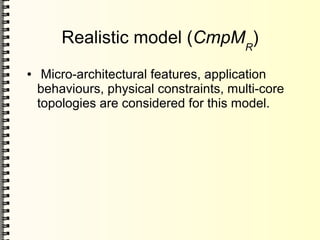
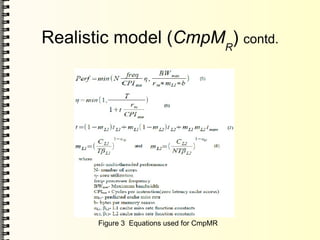
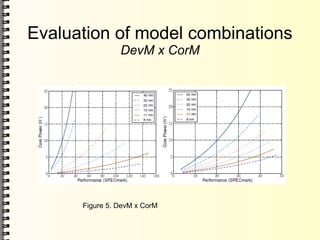
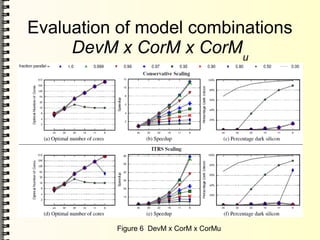
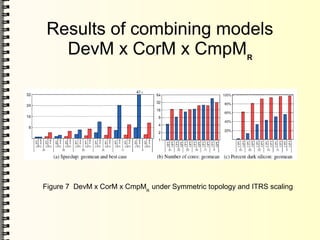
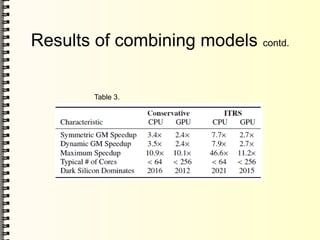
This document discusses models for predicting the future of multi-core processors and whether they can continue to provide performance scaling according to Moore's Law. It presents the Device Scaling Model (DevM) to predict characteristics of future process nodes, the Single Core Scaling Model (CorM) to model area/performance and power/performance, and the Multi-Core Scaling Models (CmpM) including an upper-bound Amdahl's Law model (CmpMU) and a more realistic model (CmpMR). Combining these models shows that a 32x performance improvement from 2008 to 2024 is not possible due to issues like increasing "dark silicon" power inefficiencies at future nodes. The most optimistic ITRS projection

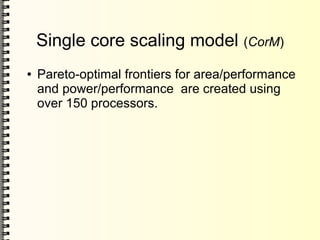
![Overview
Figure. 1 Overview of models and methodology [1]](https://image.slidesharecdn.com/darksilicon-130621064448-phpapp01/85/Dark-silicon-6-320.jpg)
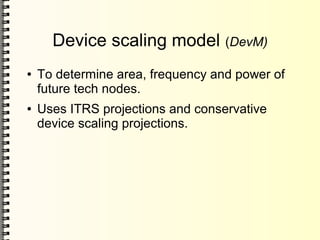
![Single core scaling model (CorM)
contd.
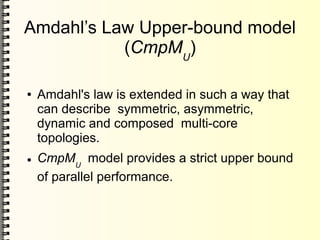
Figure 2(a) Power/performance frontier
at 45 nm[1]
Figure 2(b) Area/performance frontier
At 45 nm [1]](https://image.slidesharecdn.com/darksilicon-130621064448-phpapp01/85/Dark-silicon-10-320.jpg)

![References
[1] Hadi Esmaeilzadeh, Emily Blem, Renée St. Amant,
Karthikeyan Sankaralingam, Doug Burger. Dark Silicon and the
End of Multicore Scaling 2010](https://image.slidesharecdn.com/darksilicon-130621064448-phpapp01/85/Dark-silicon-24-320.jpg)