Download to read offline


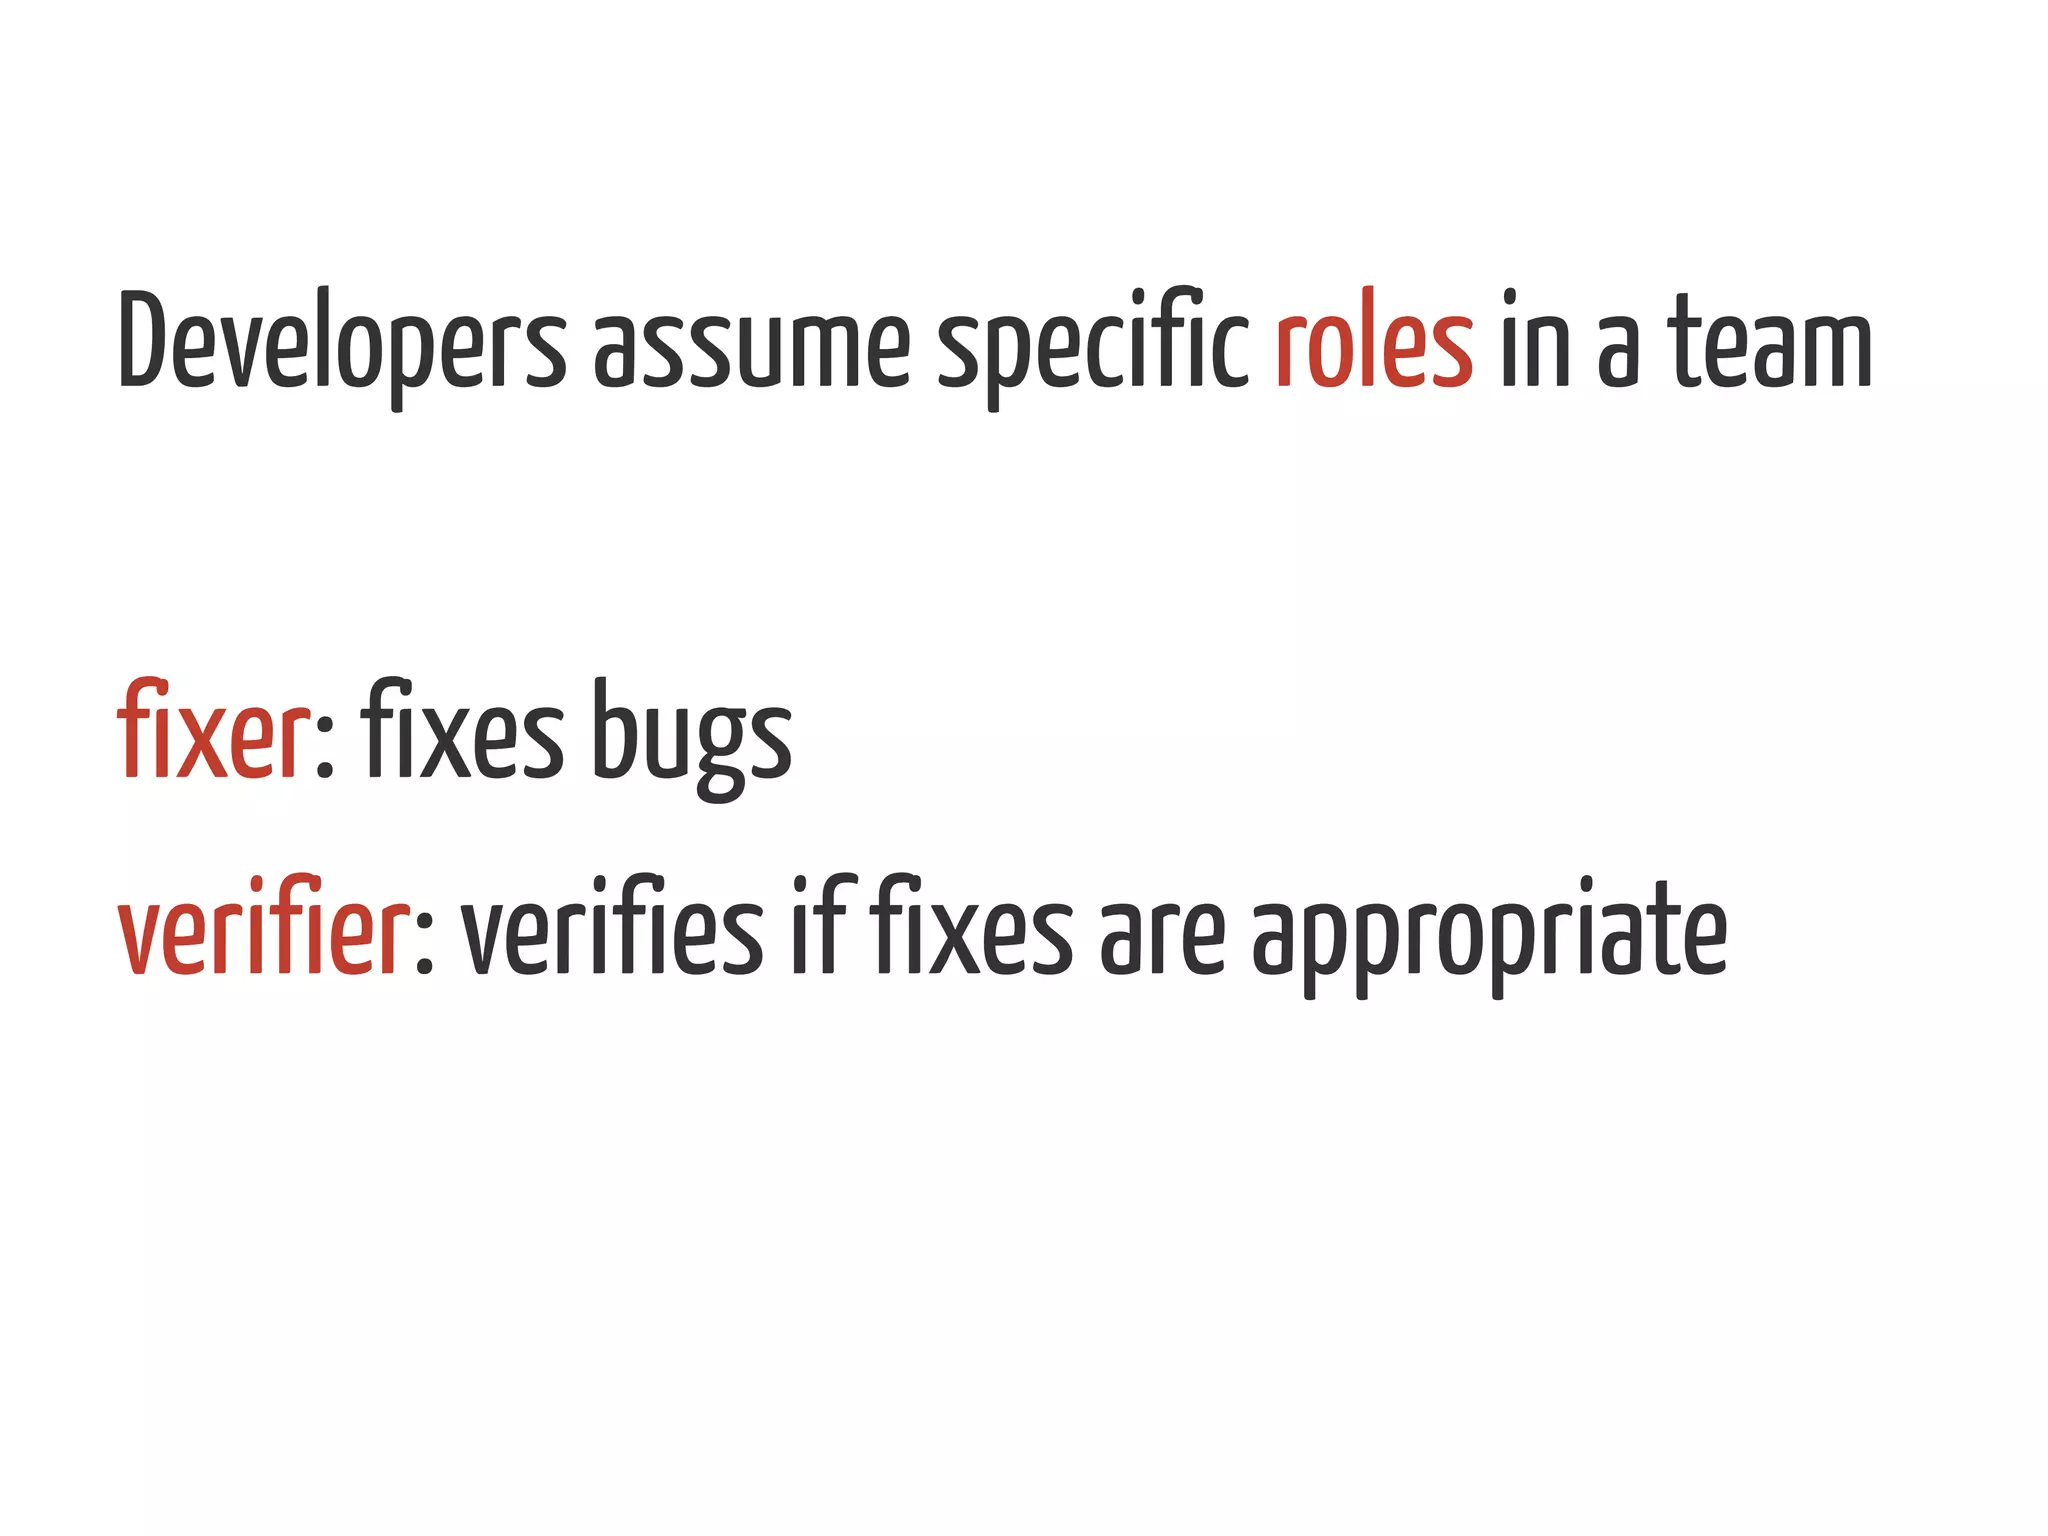
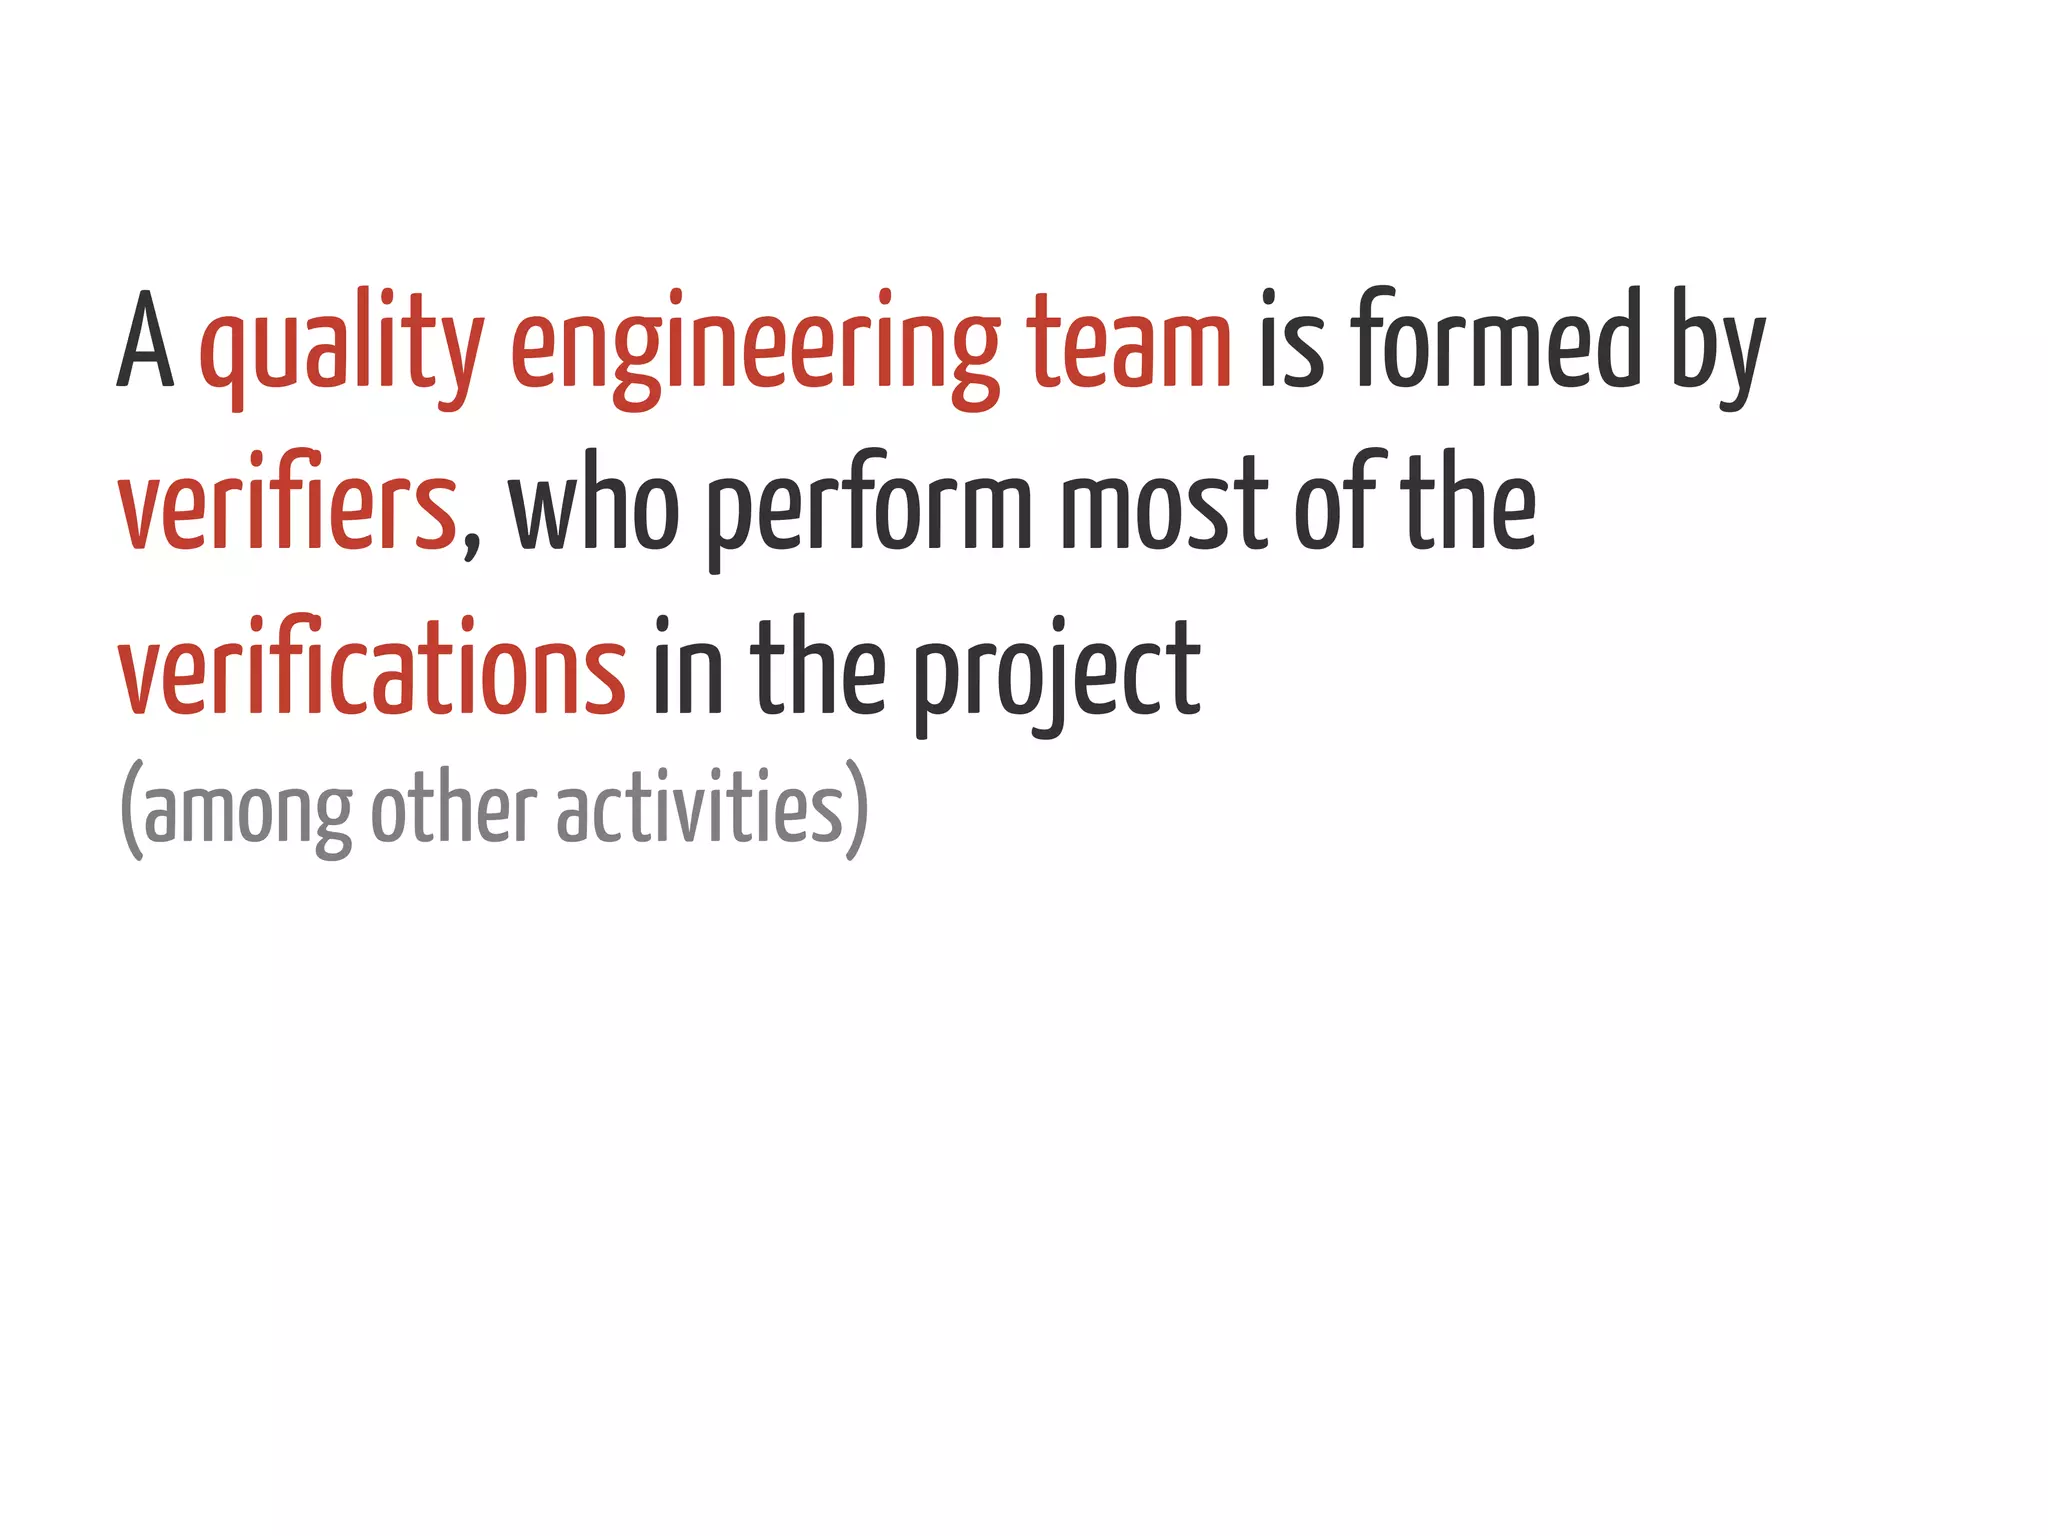
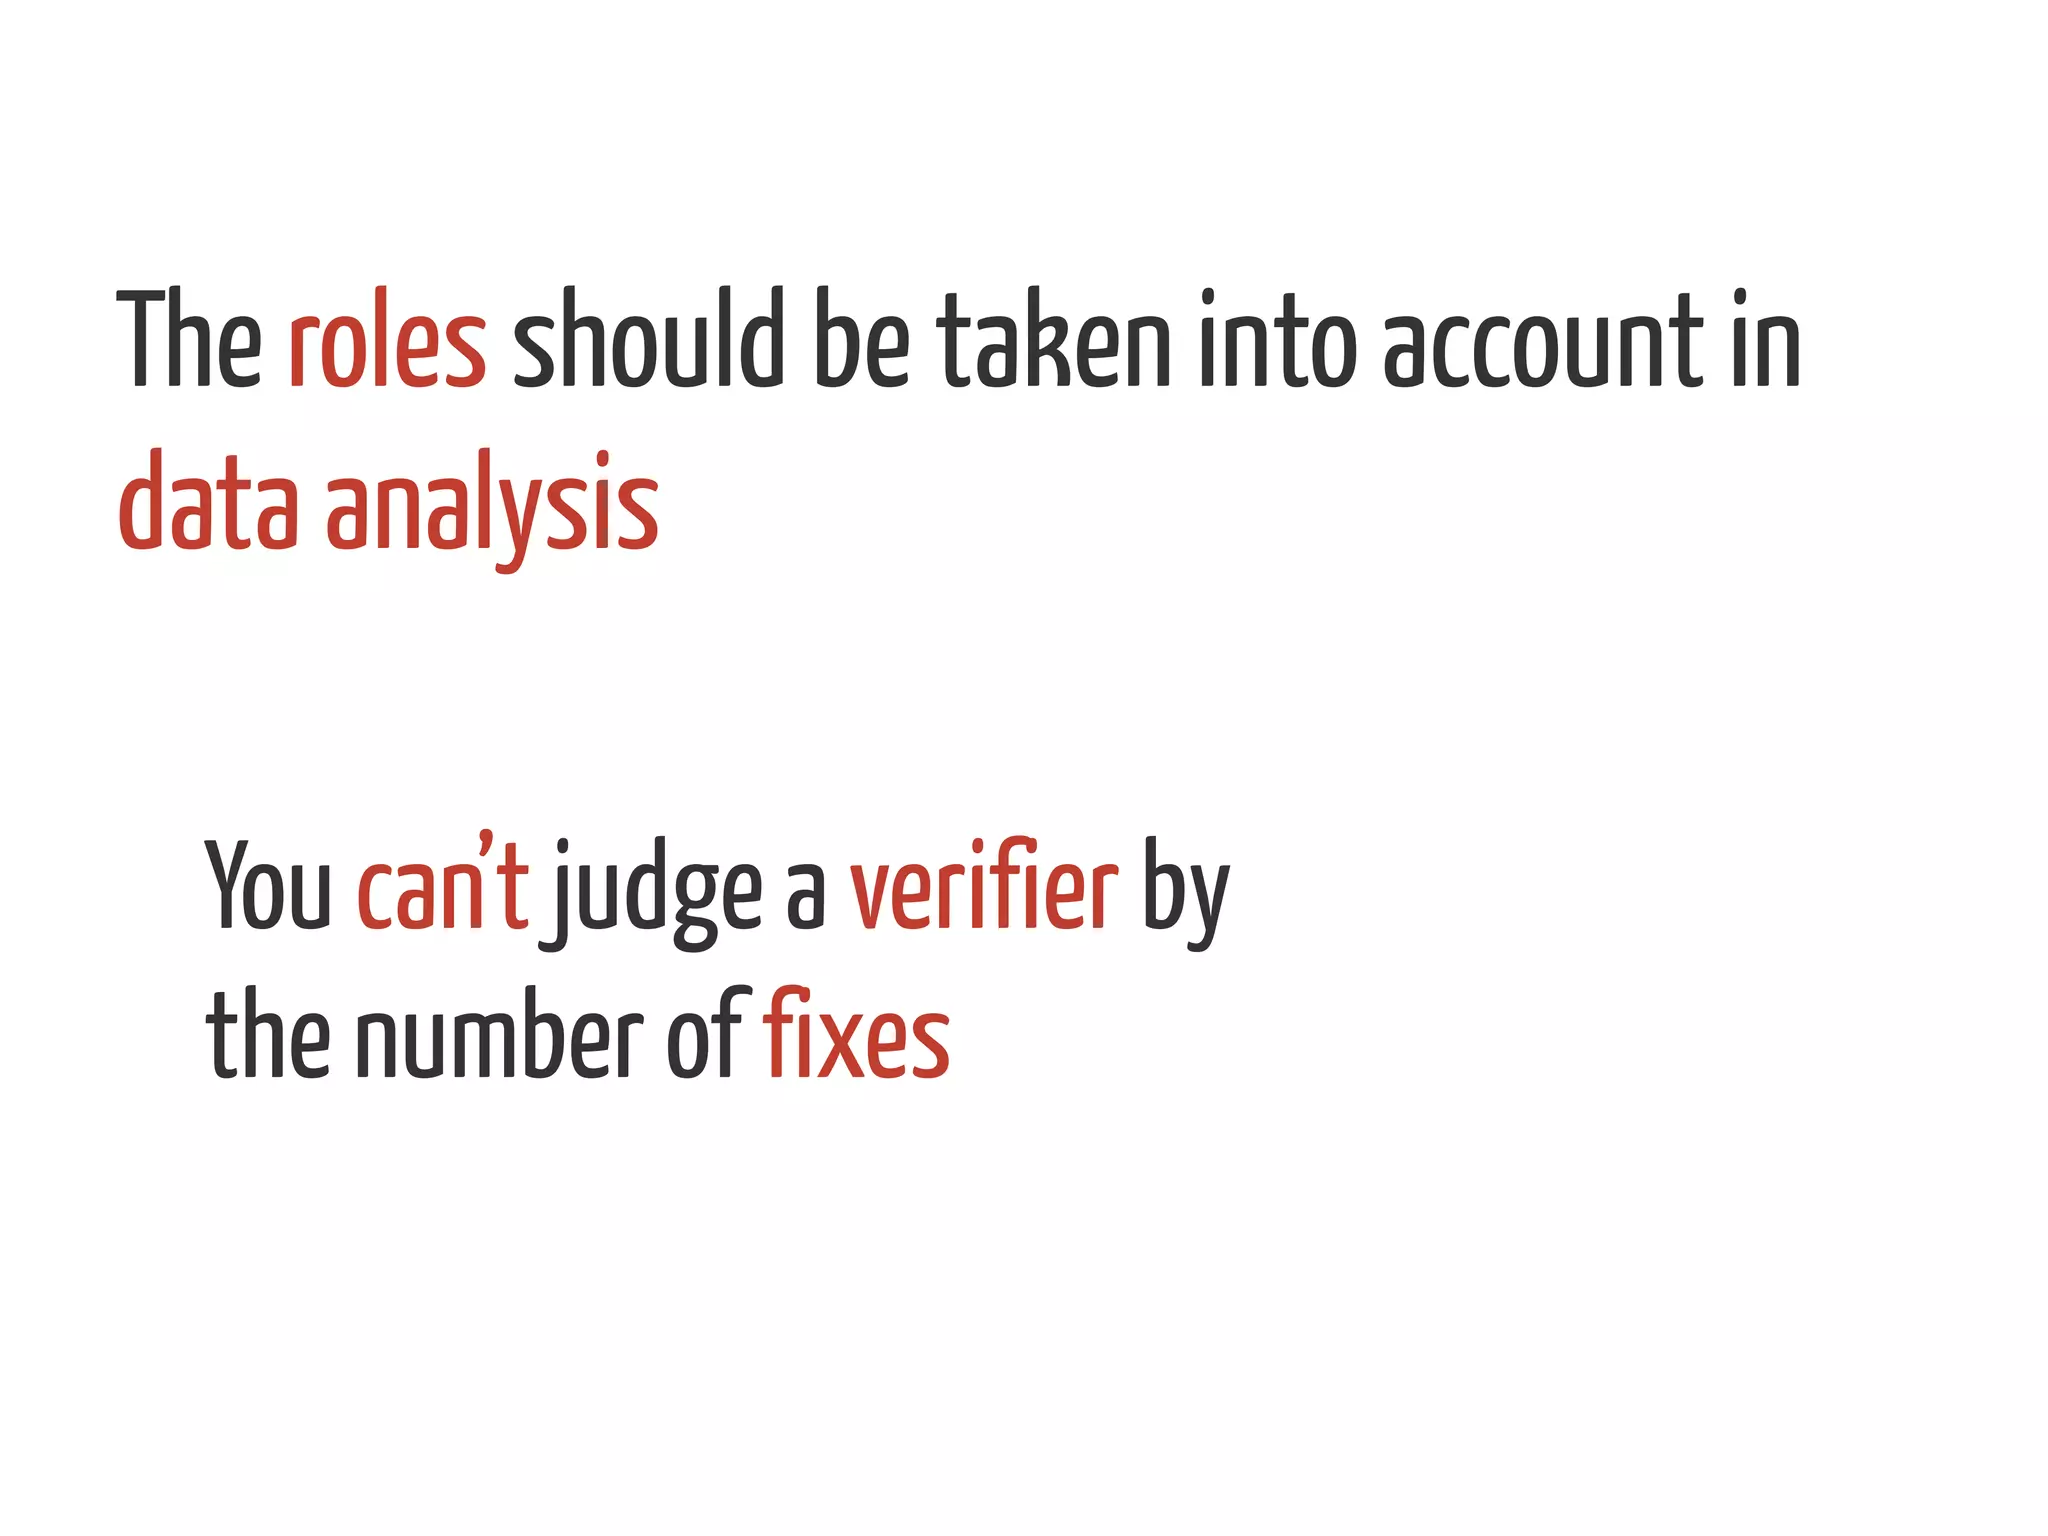

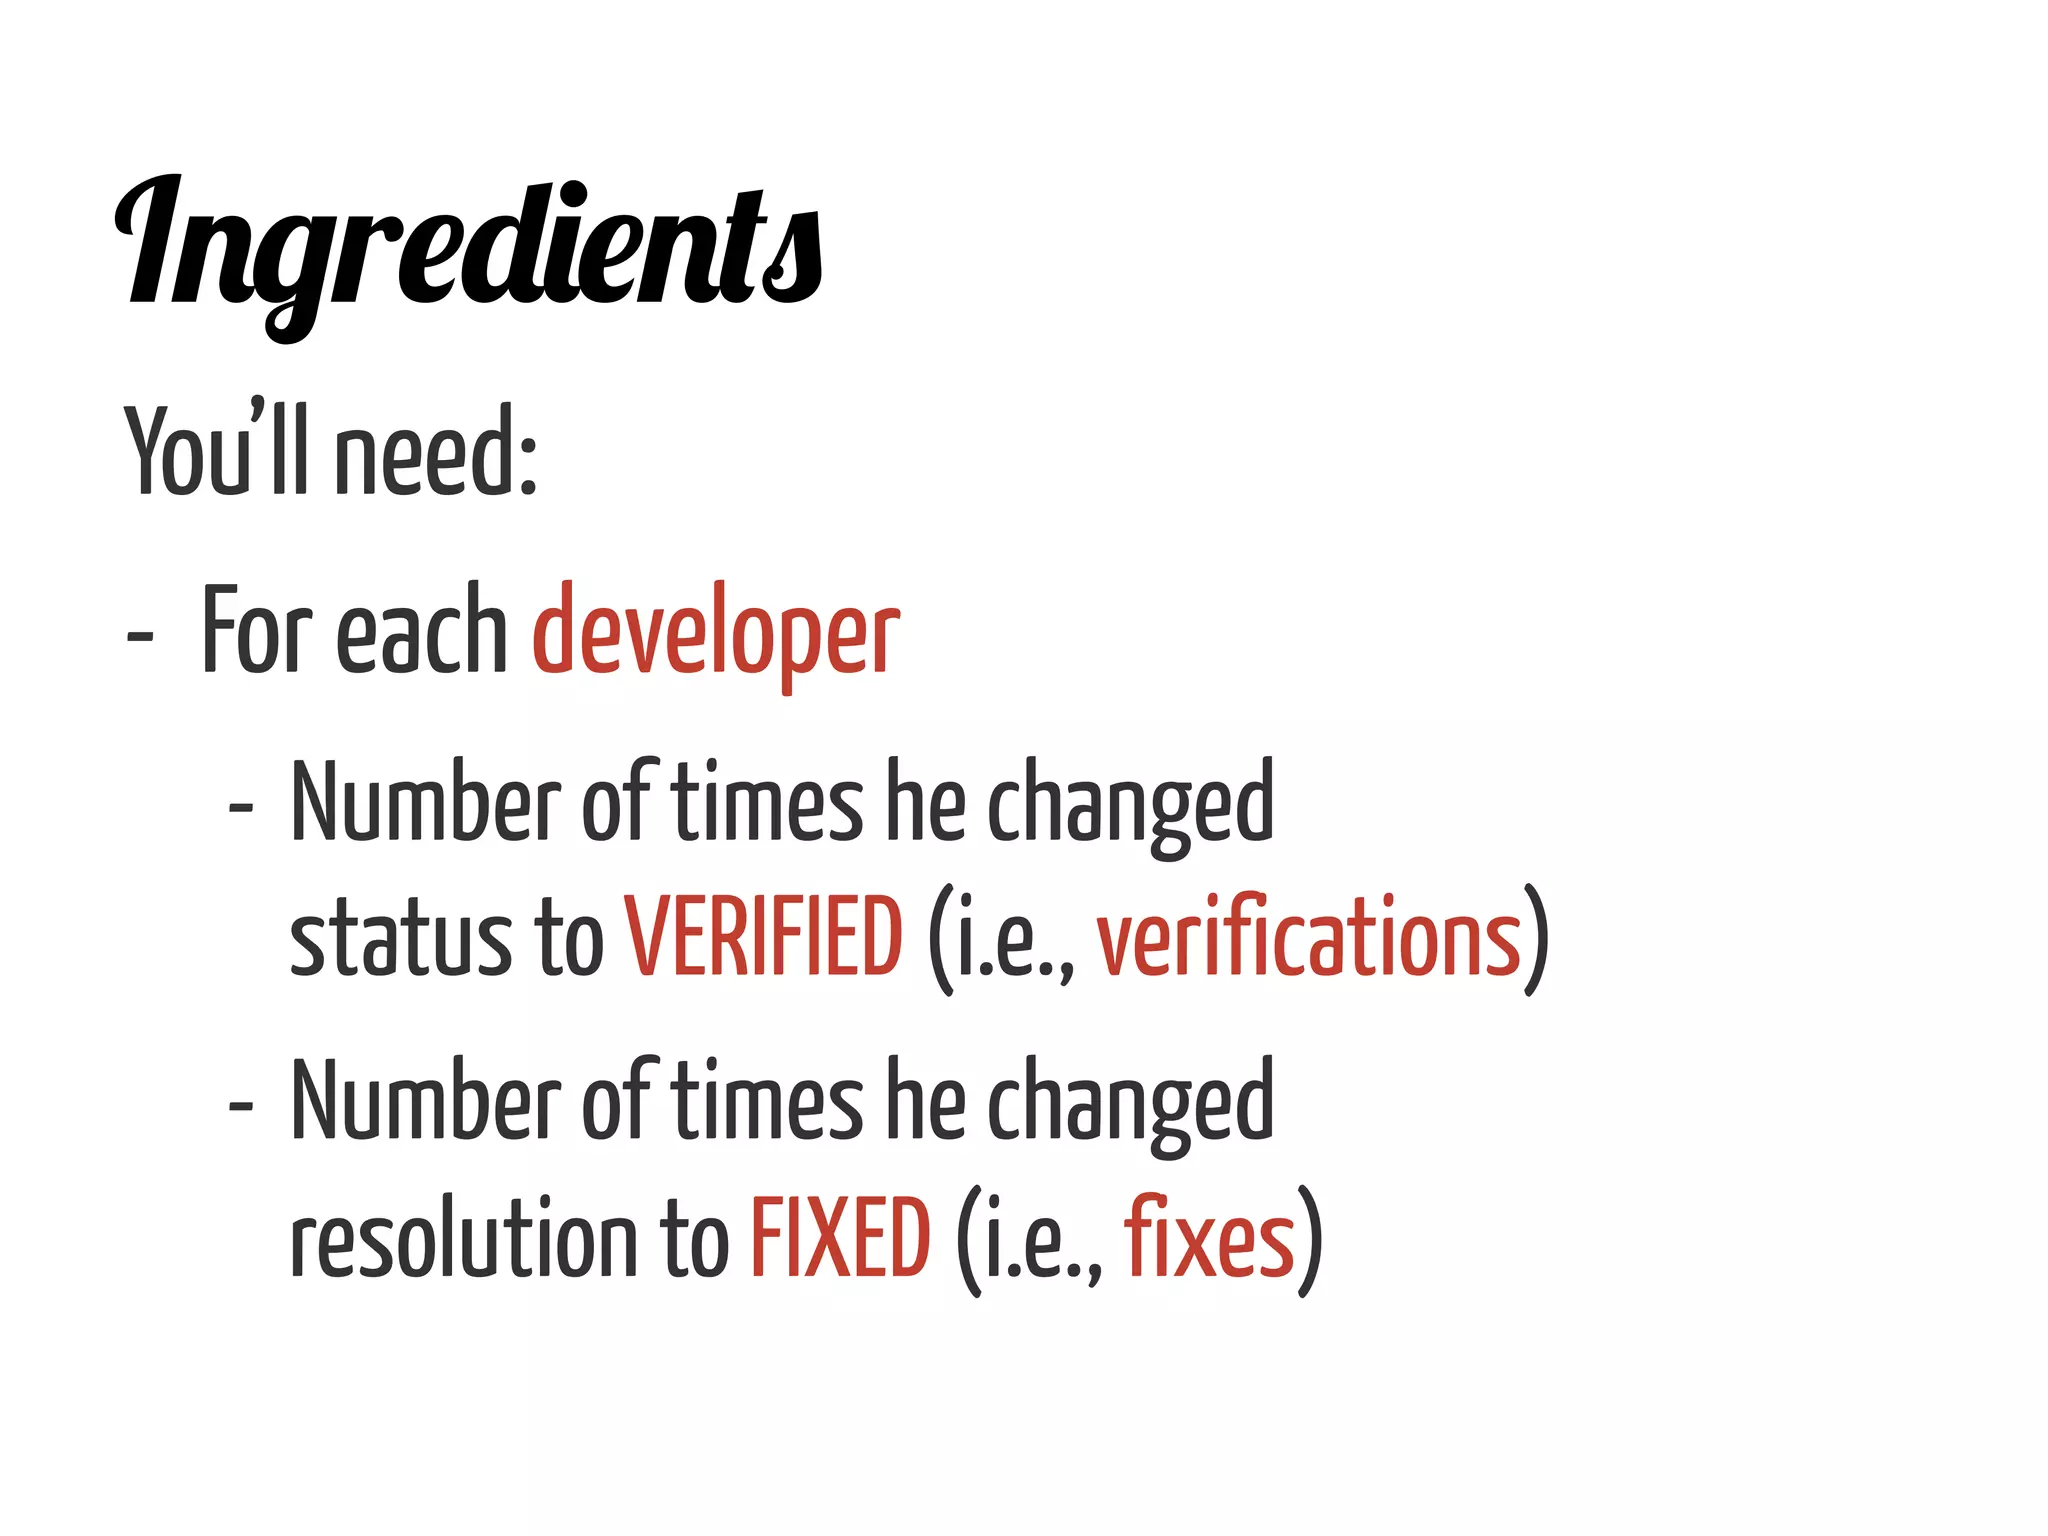
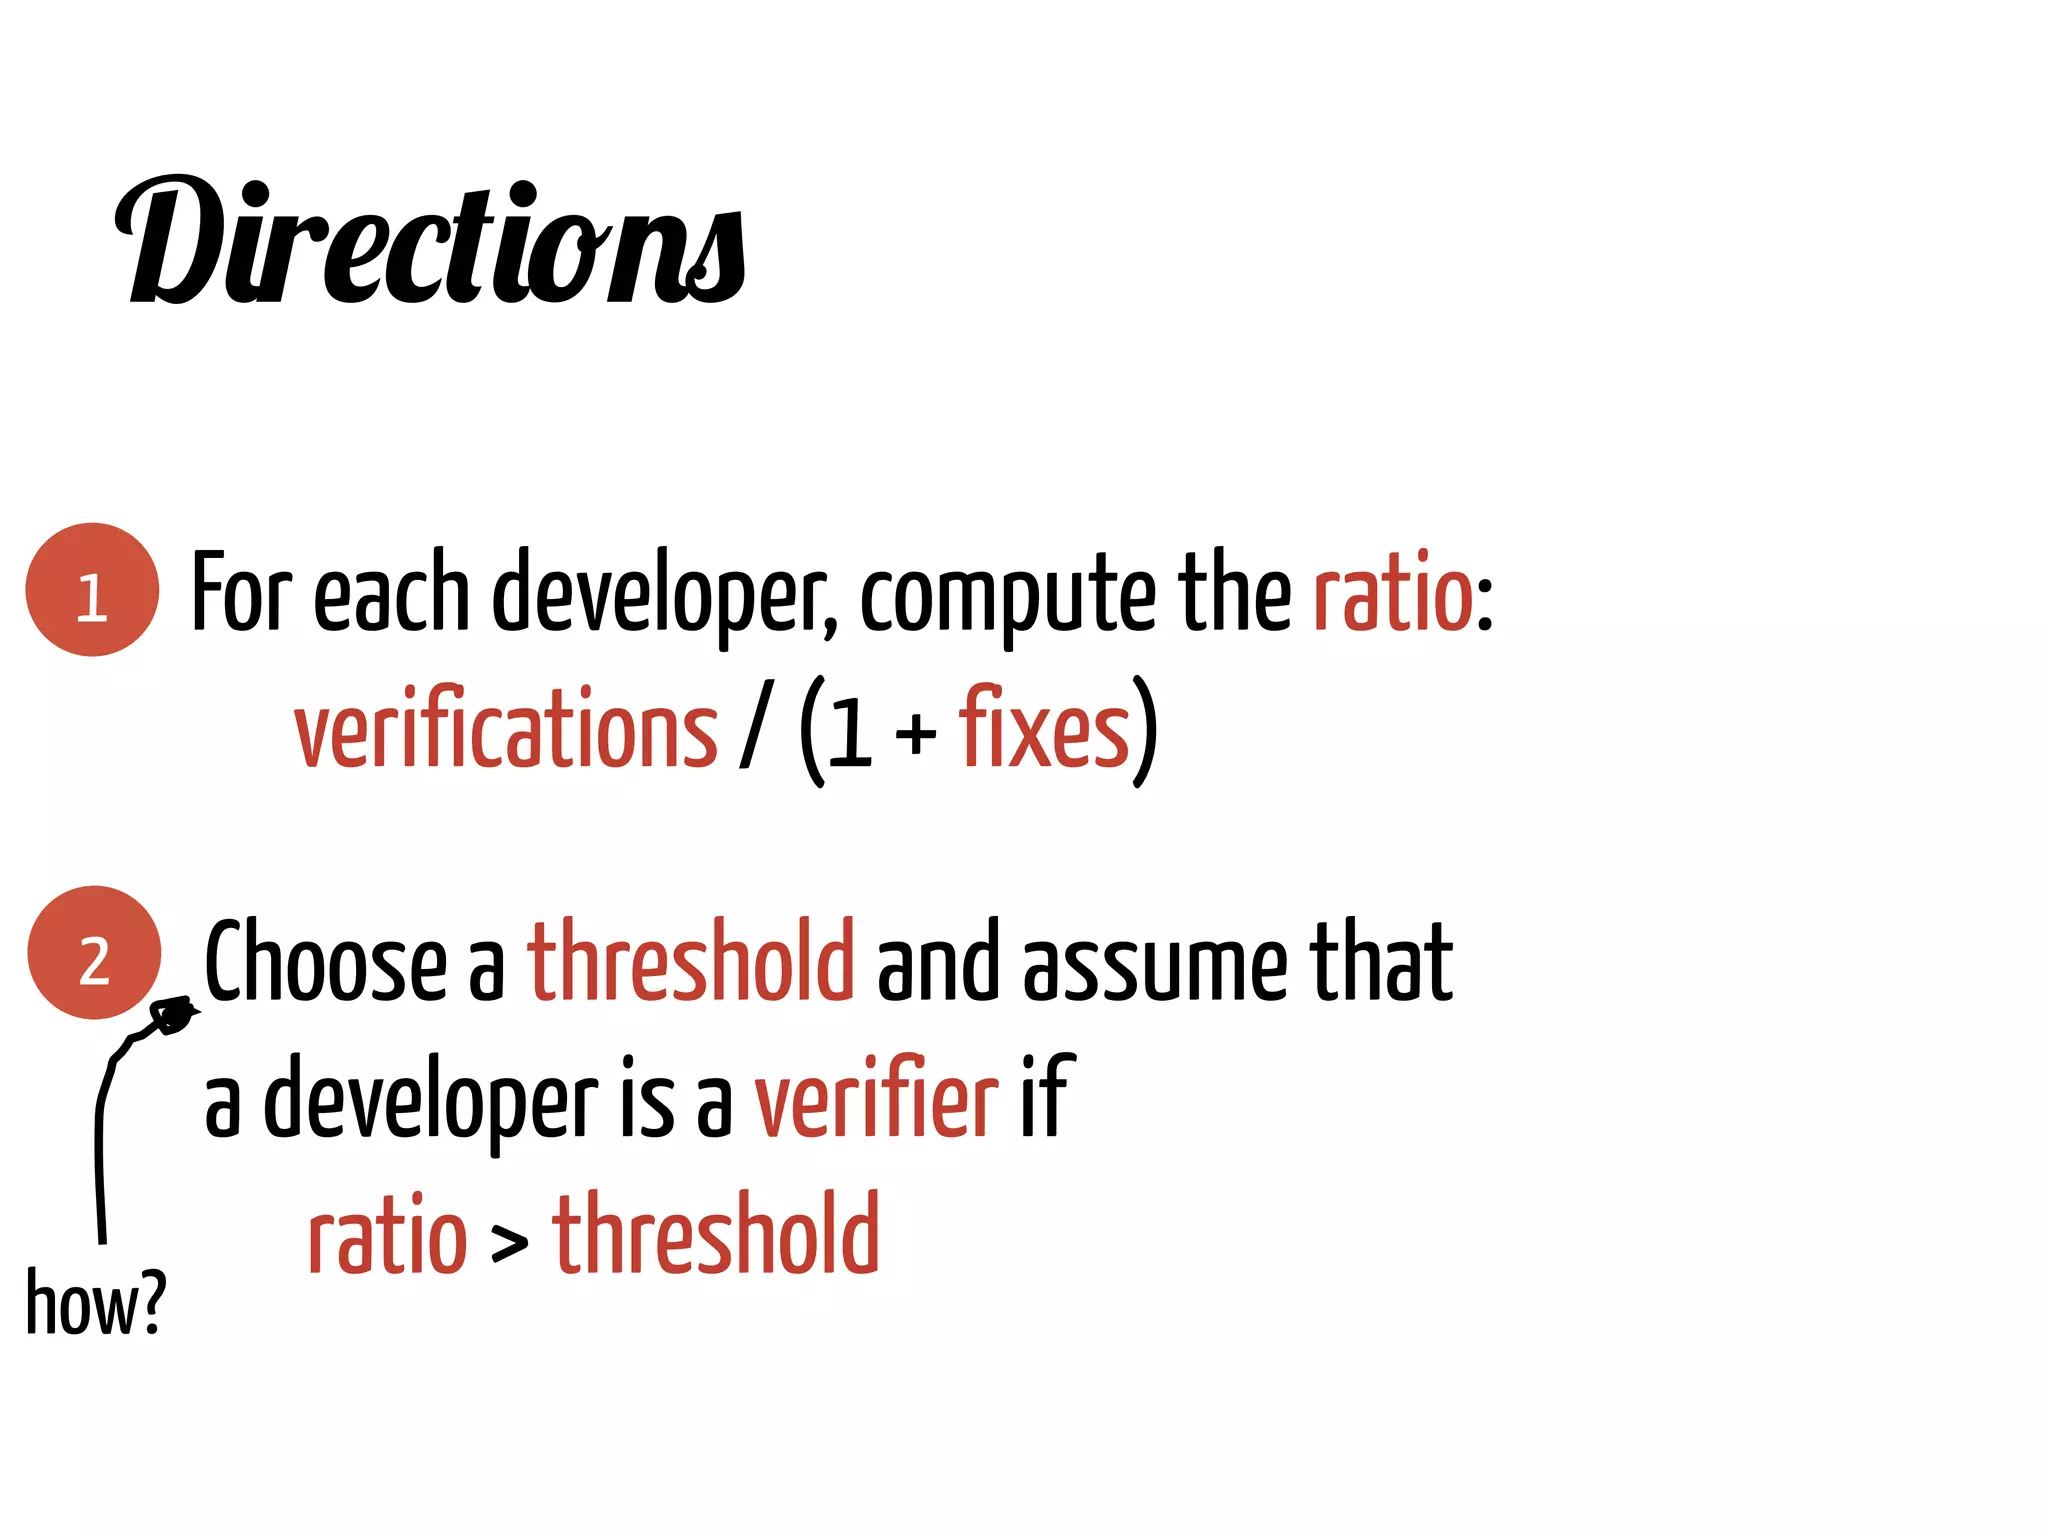
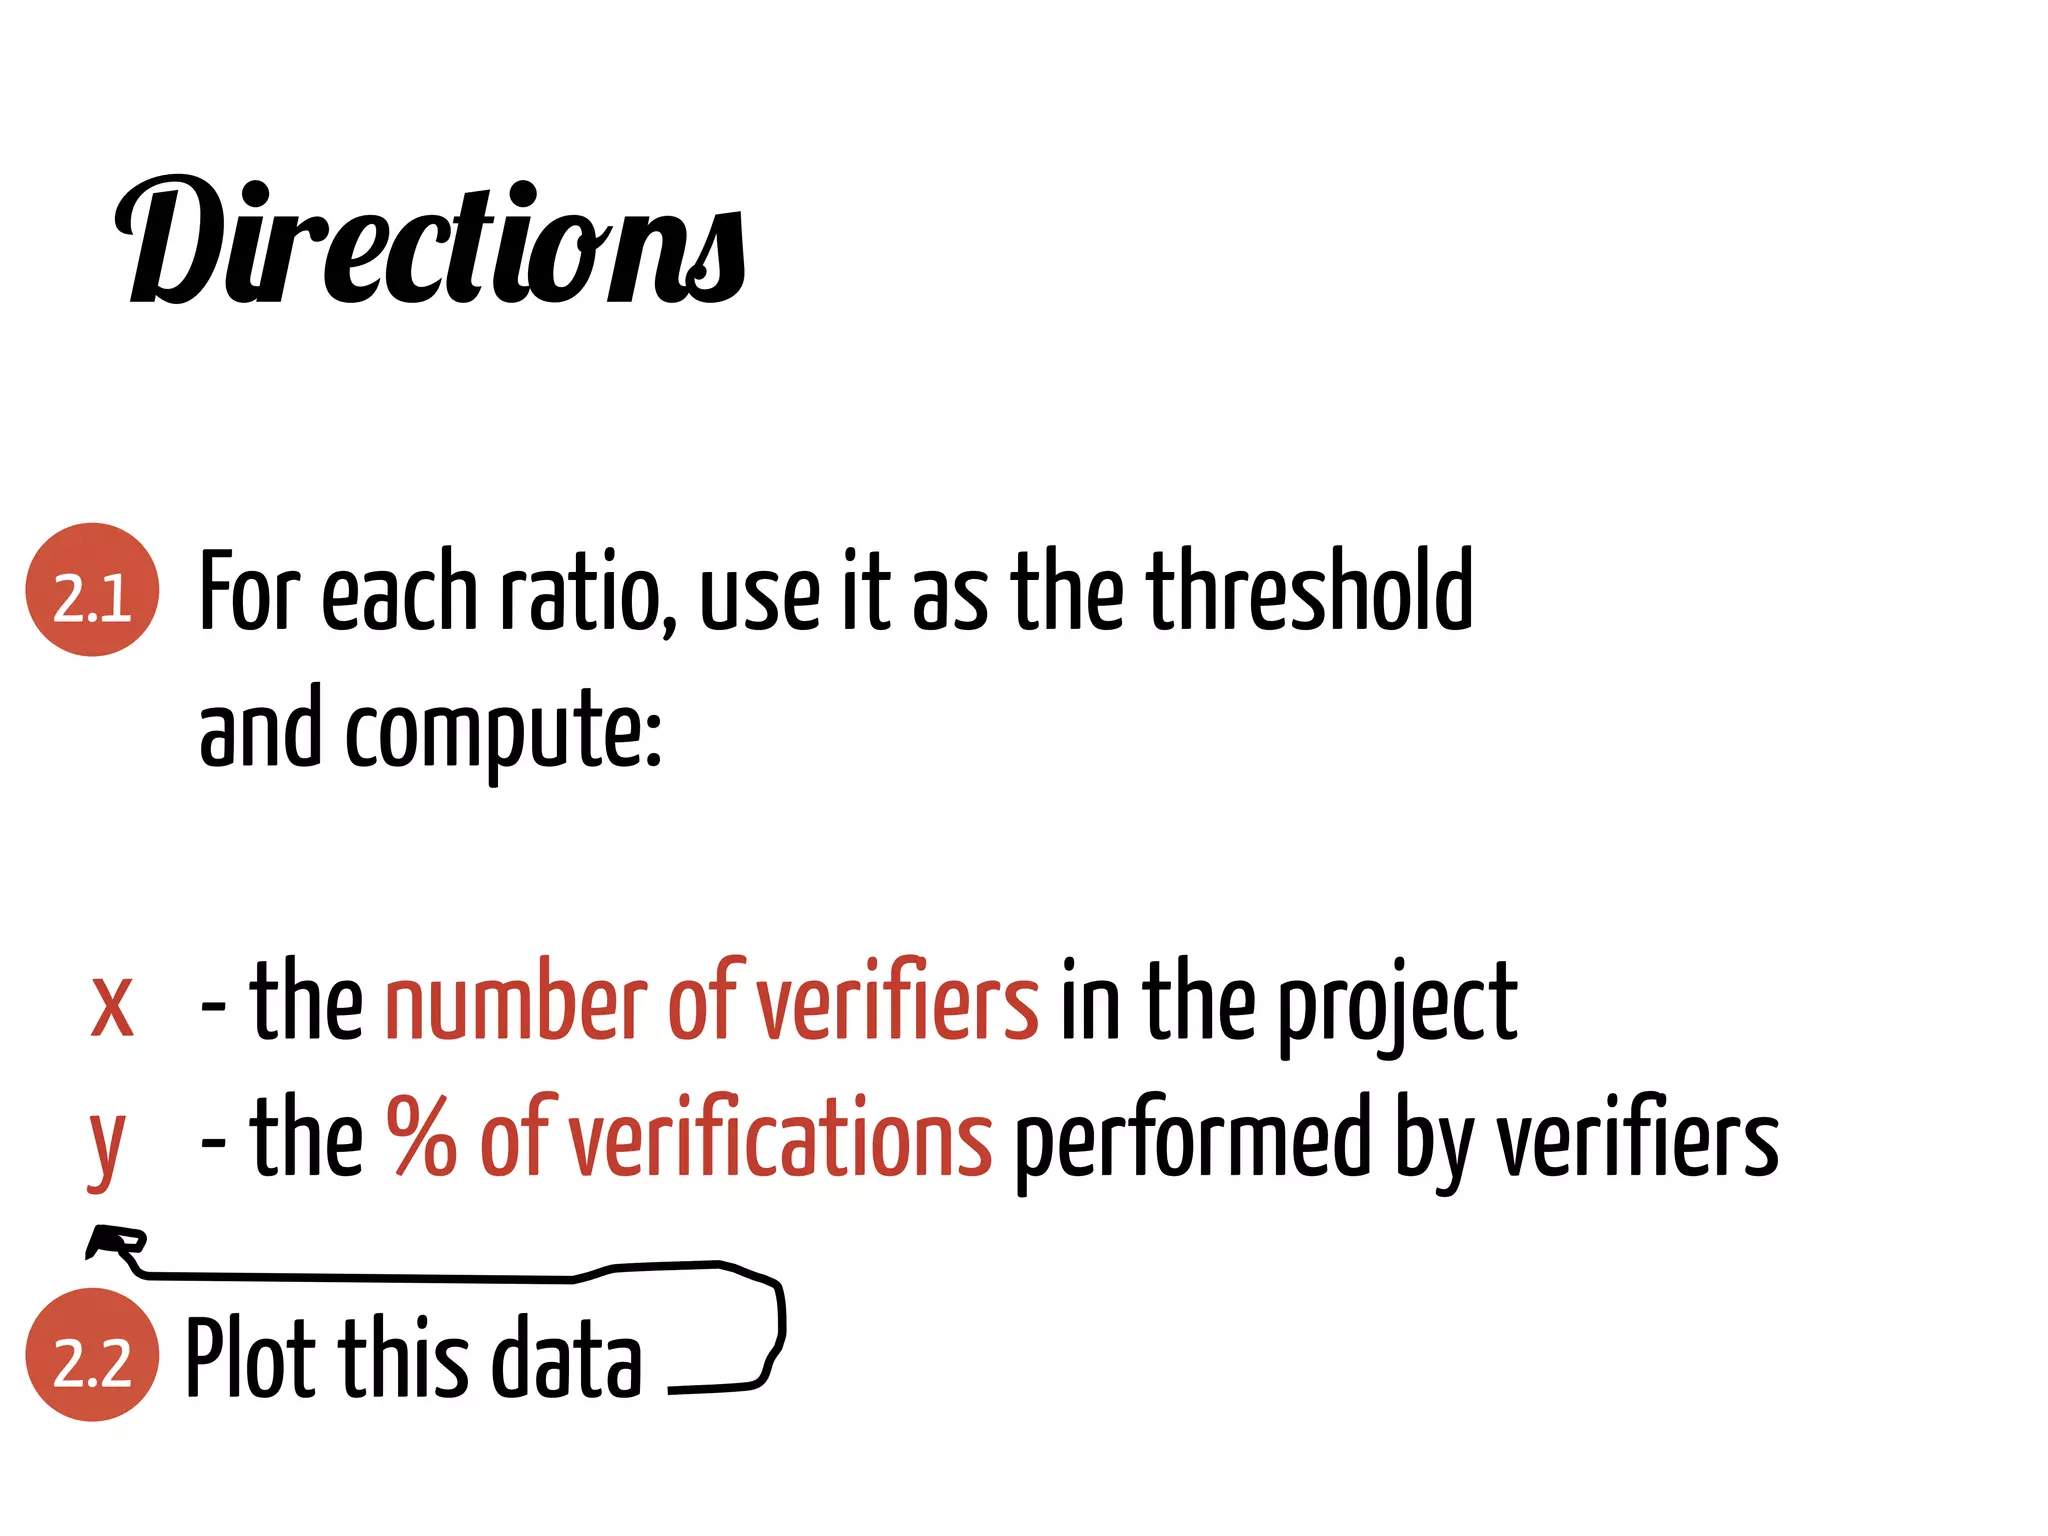
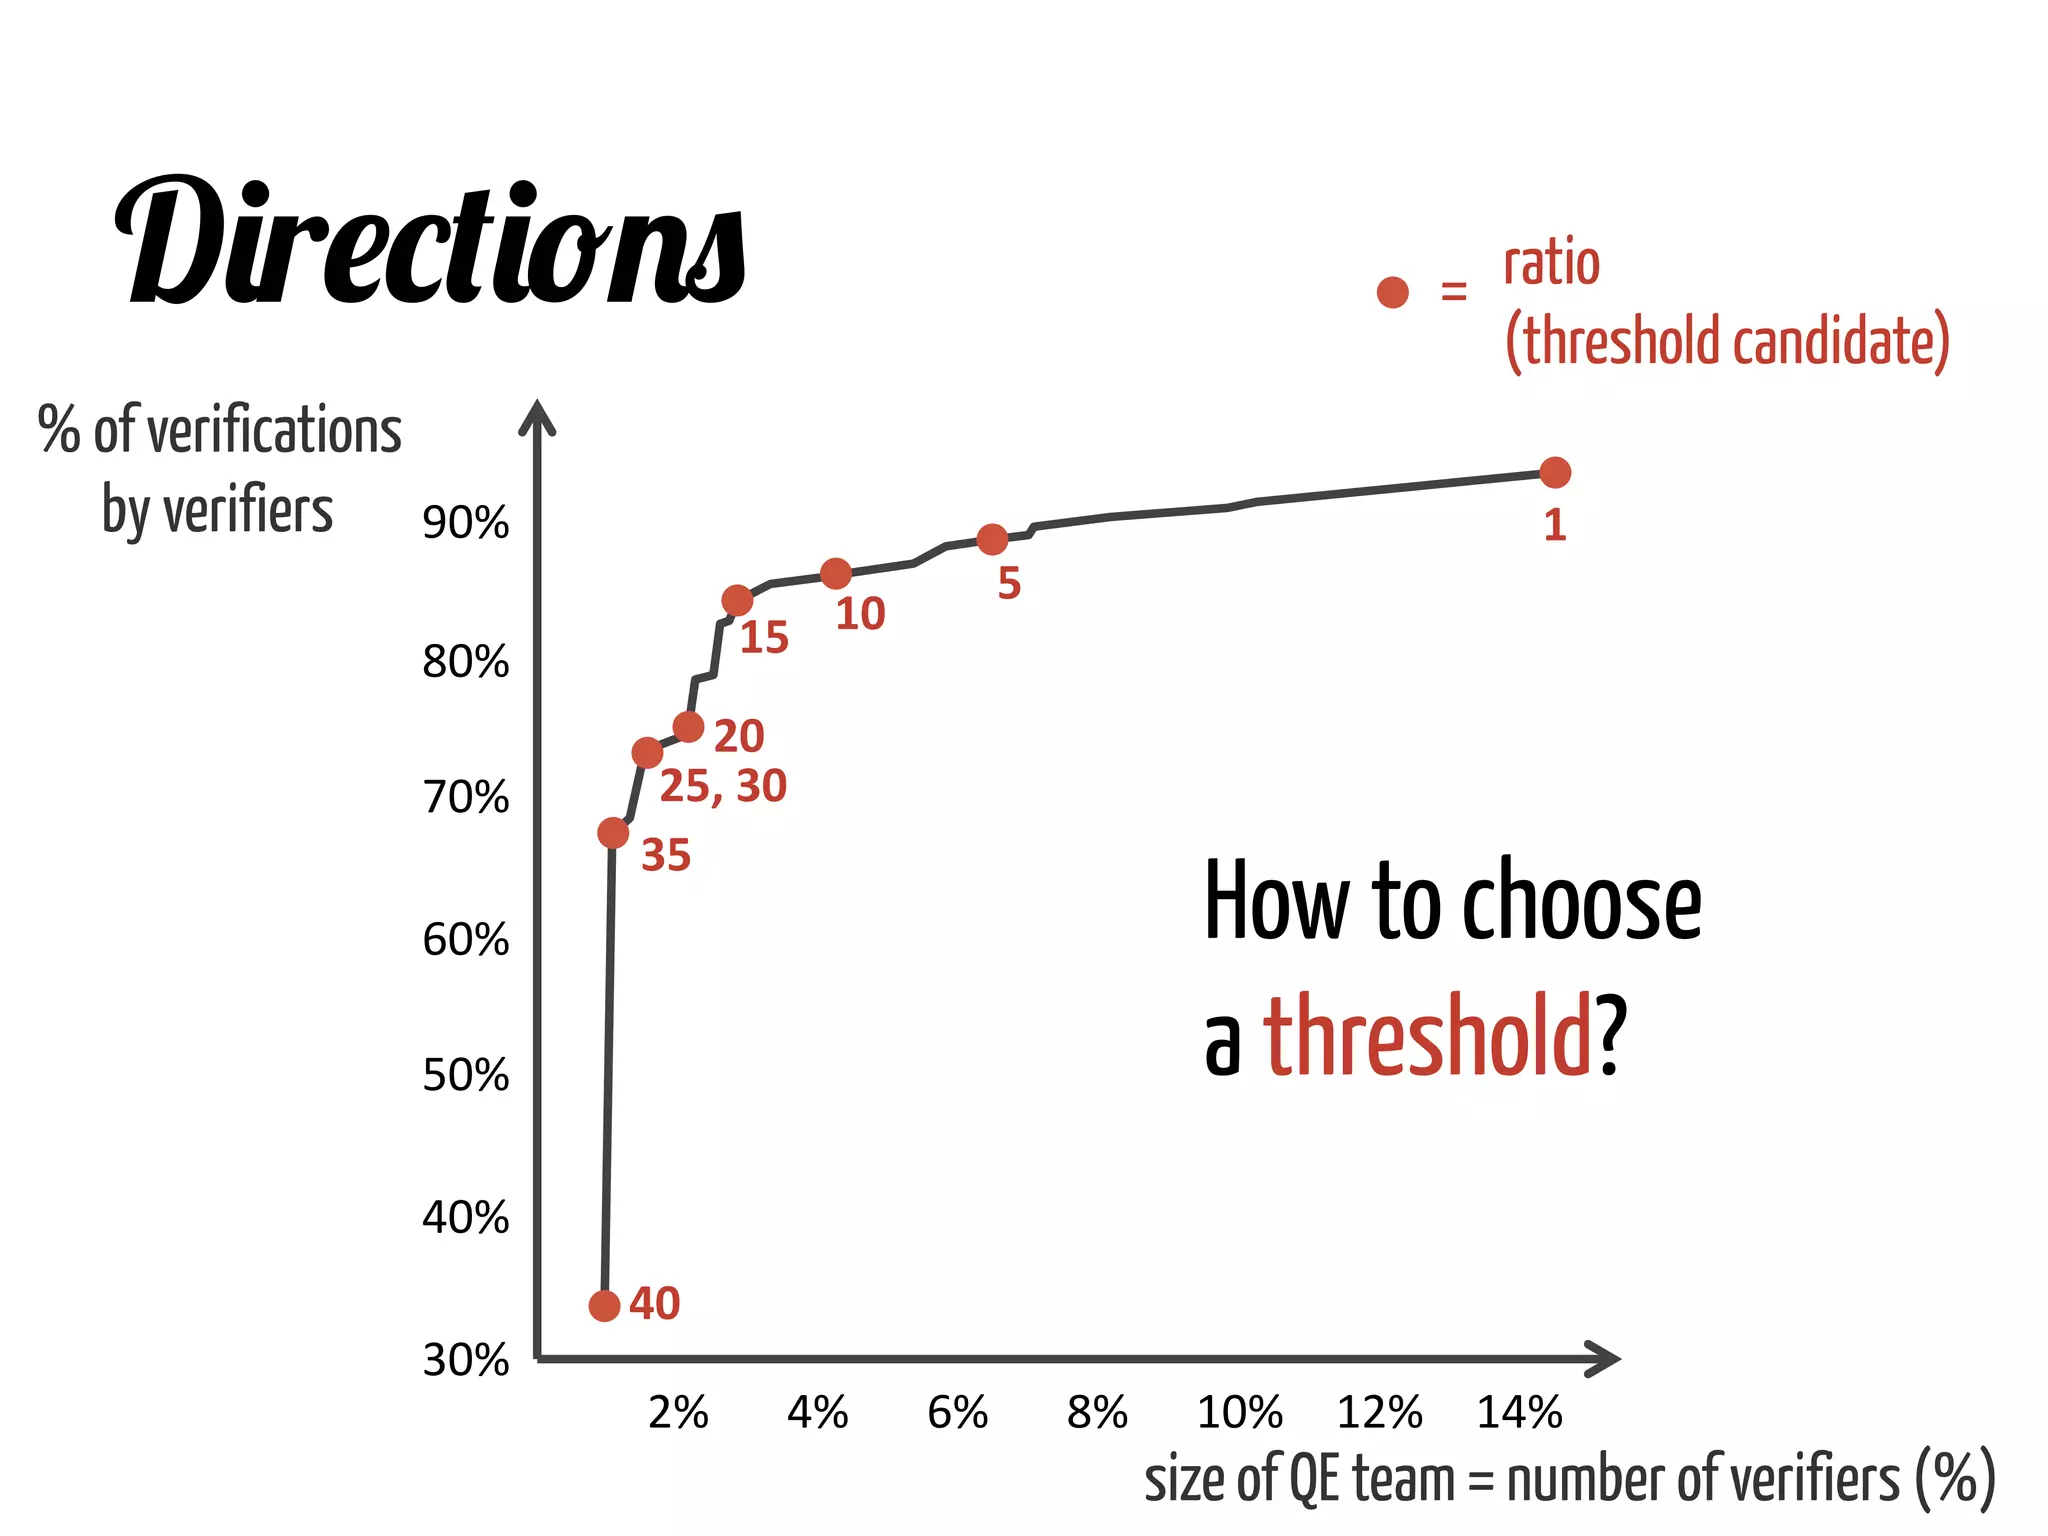
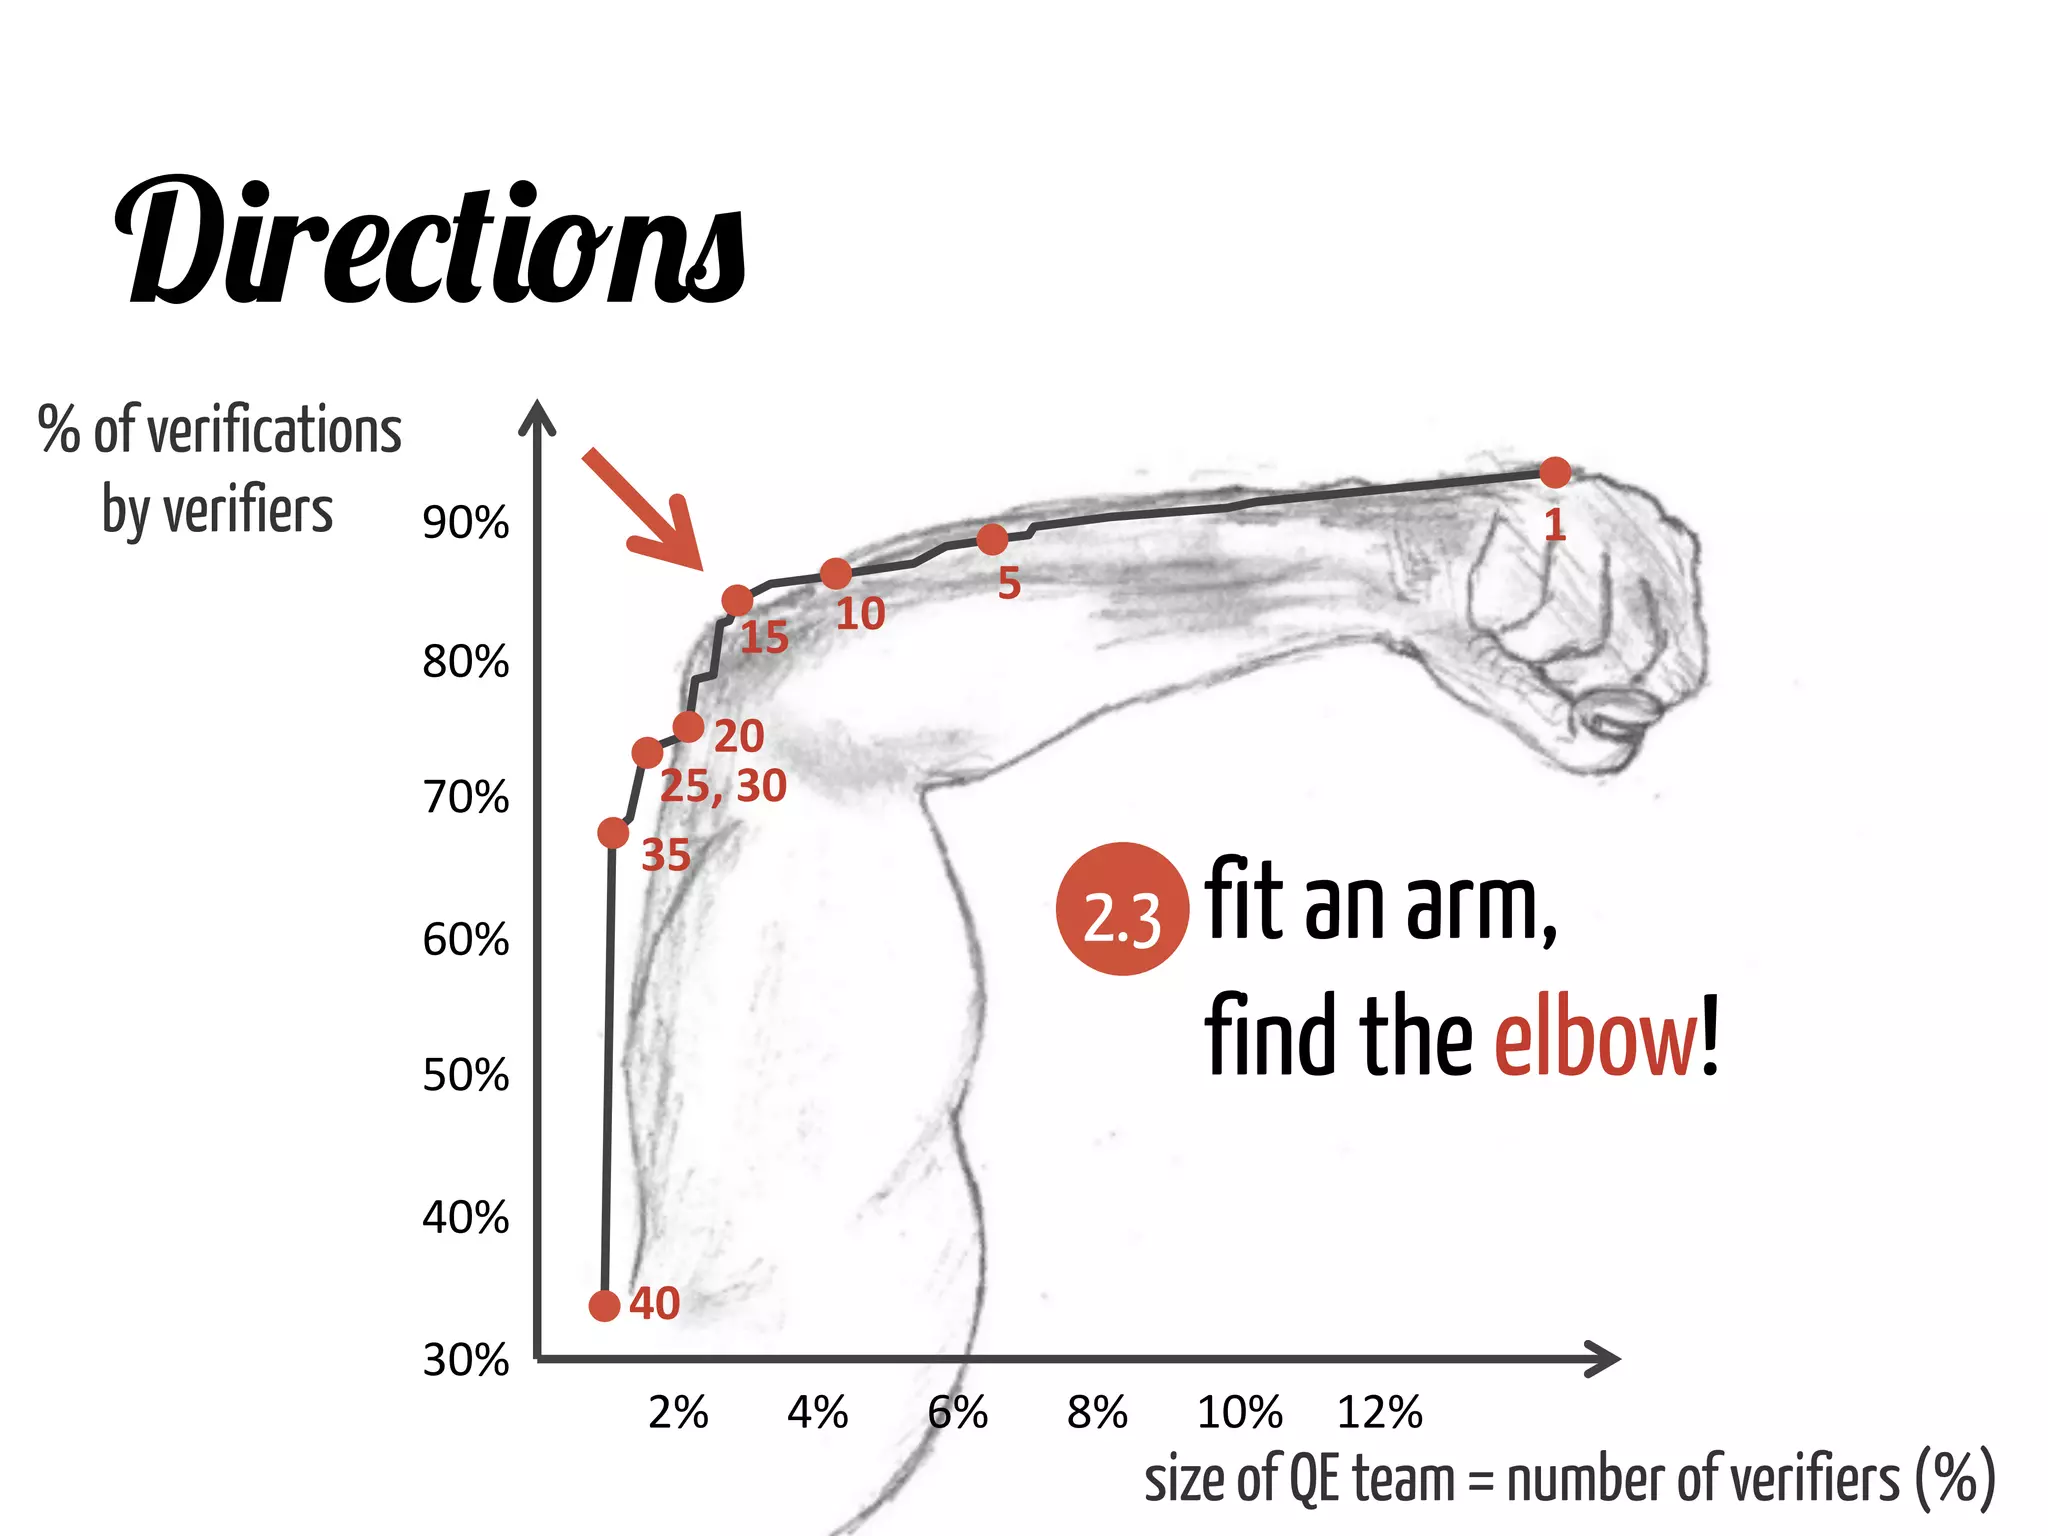
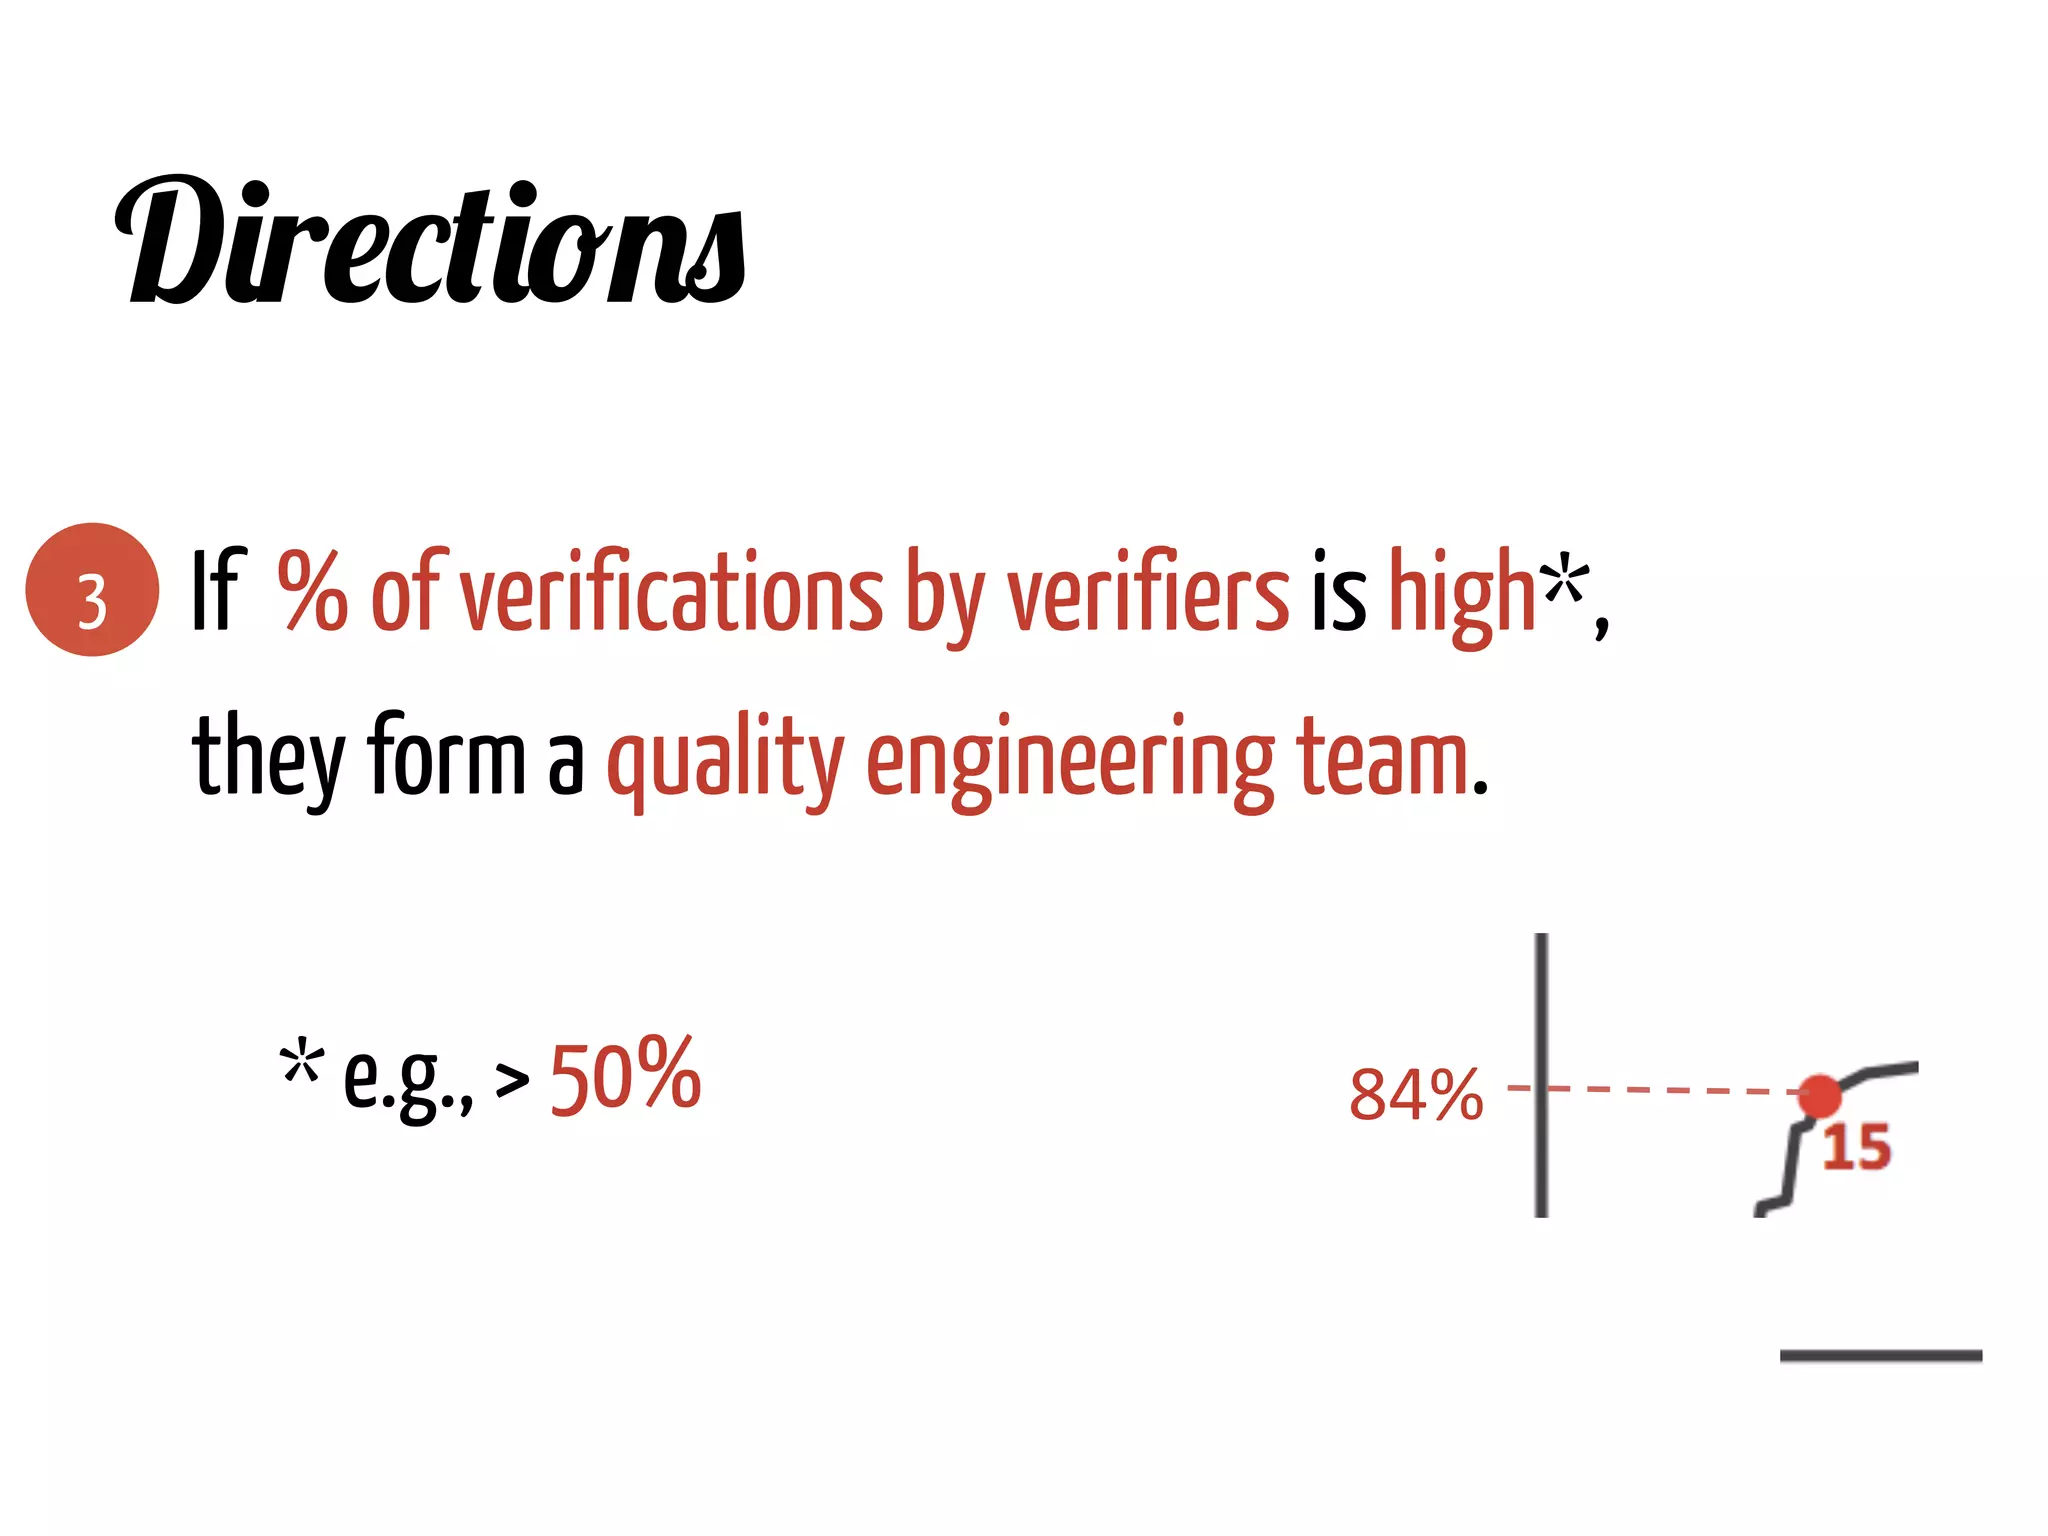
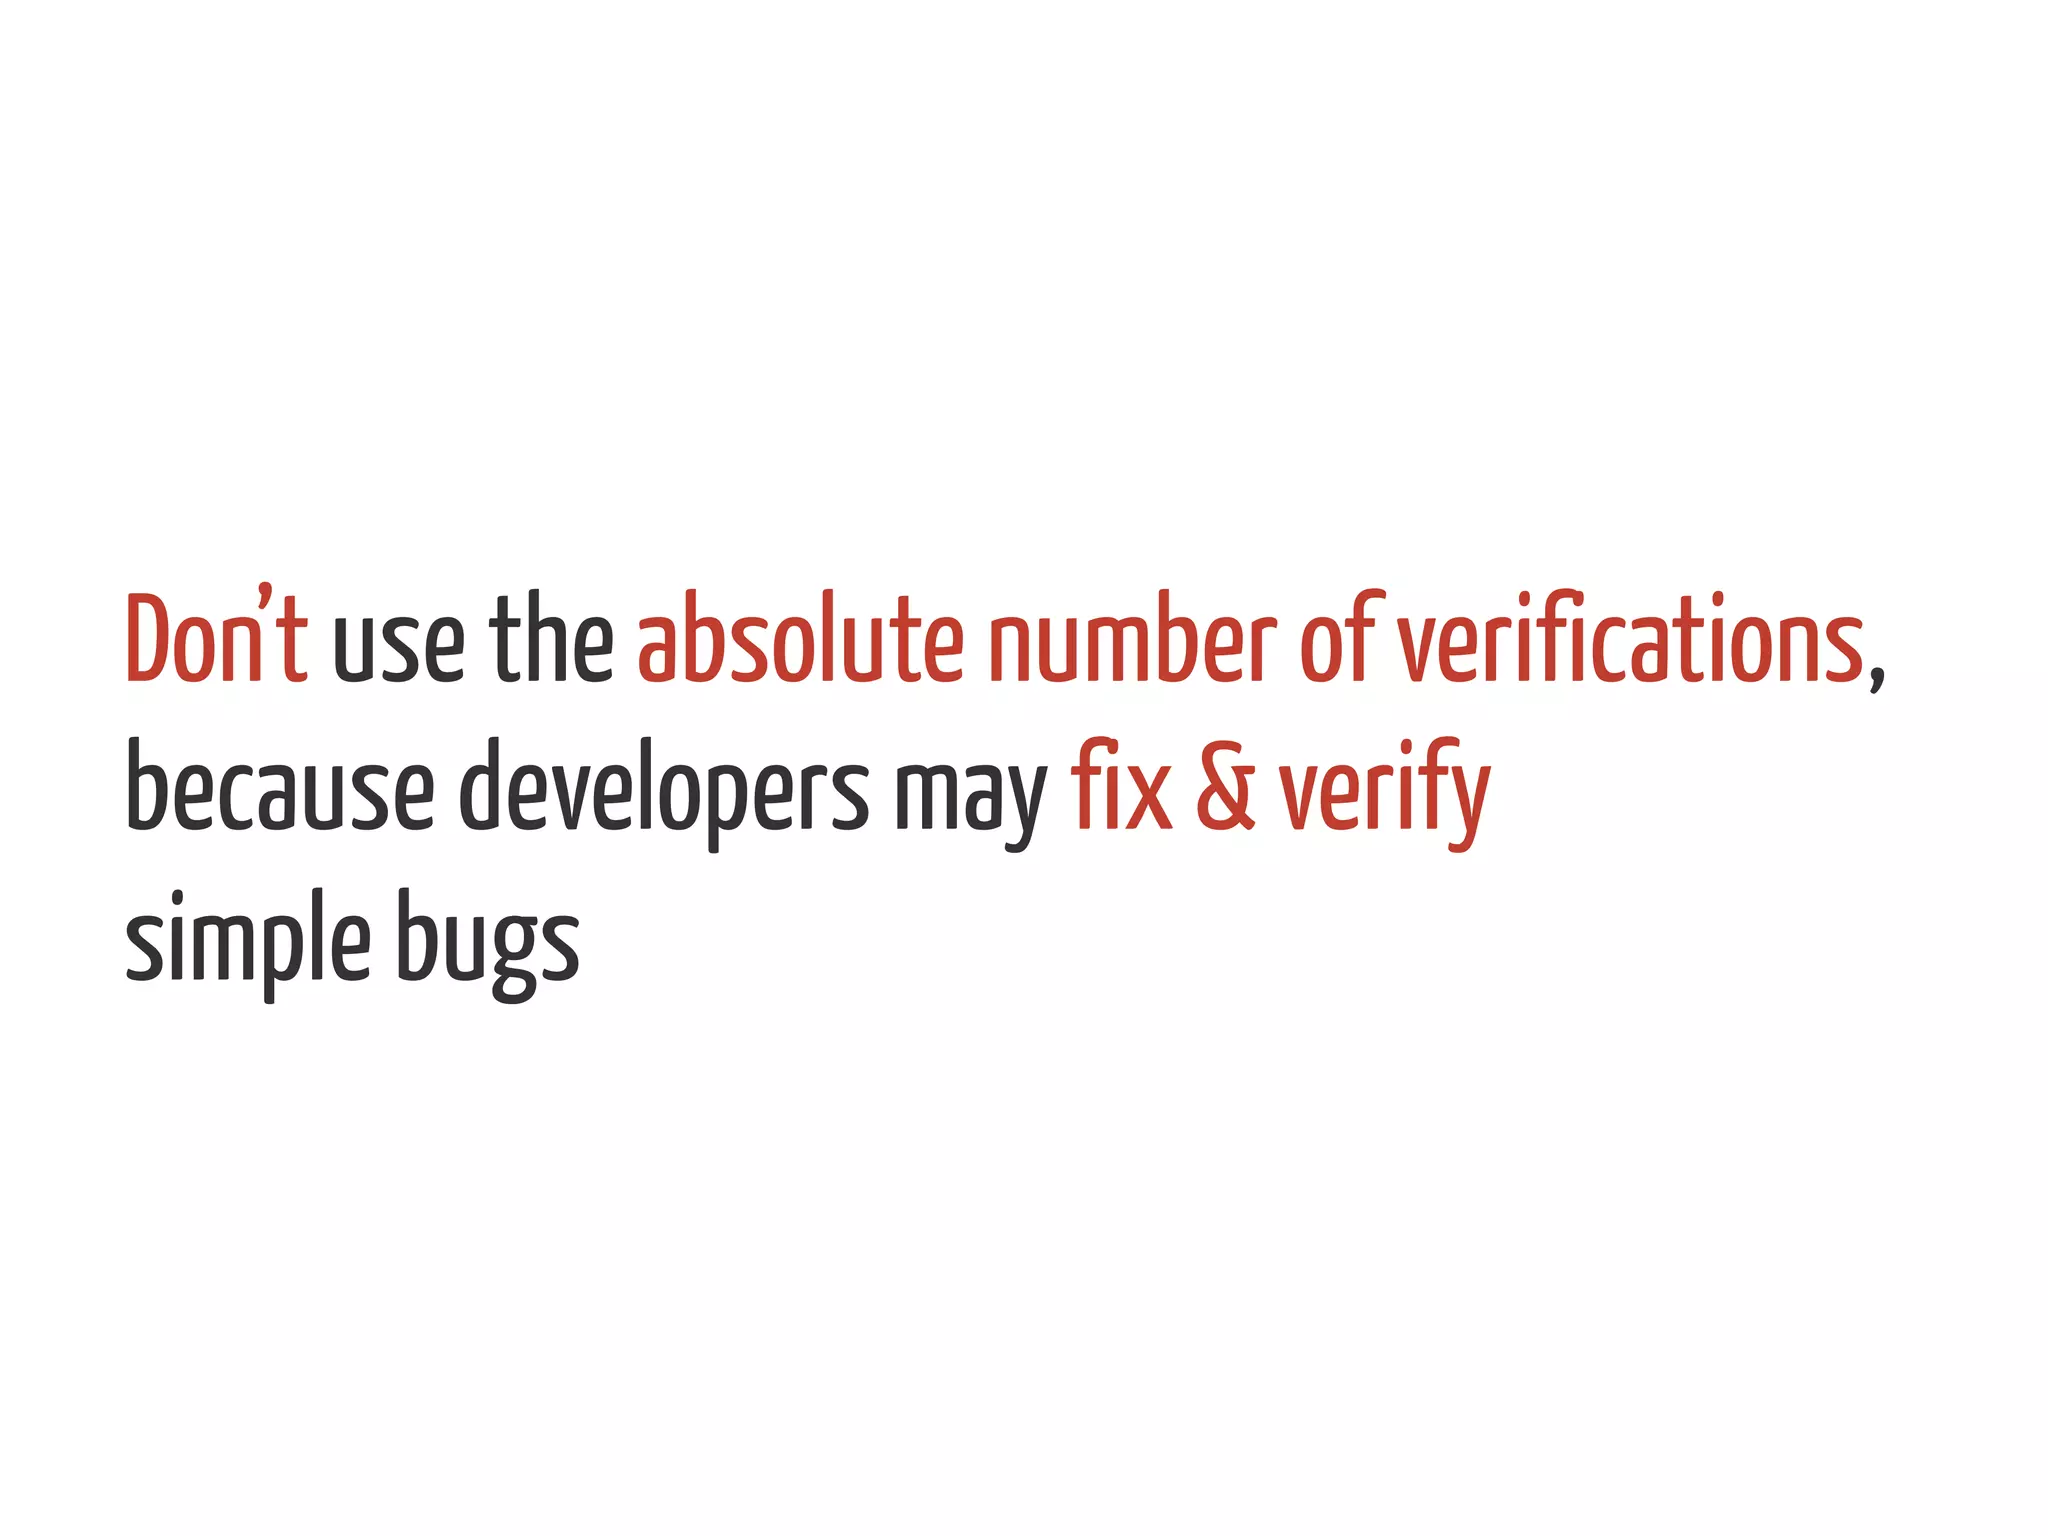


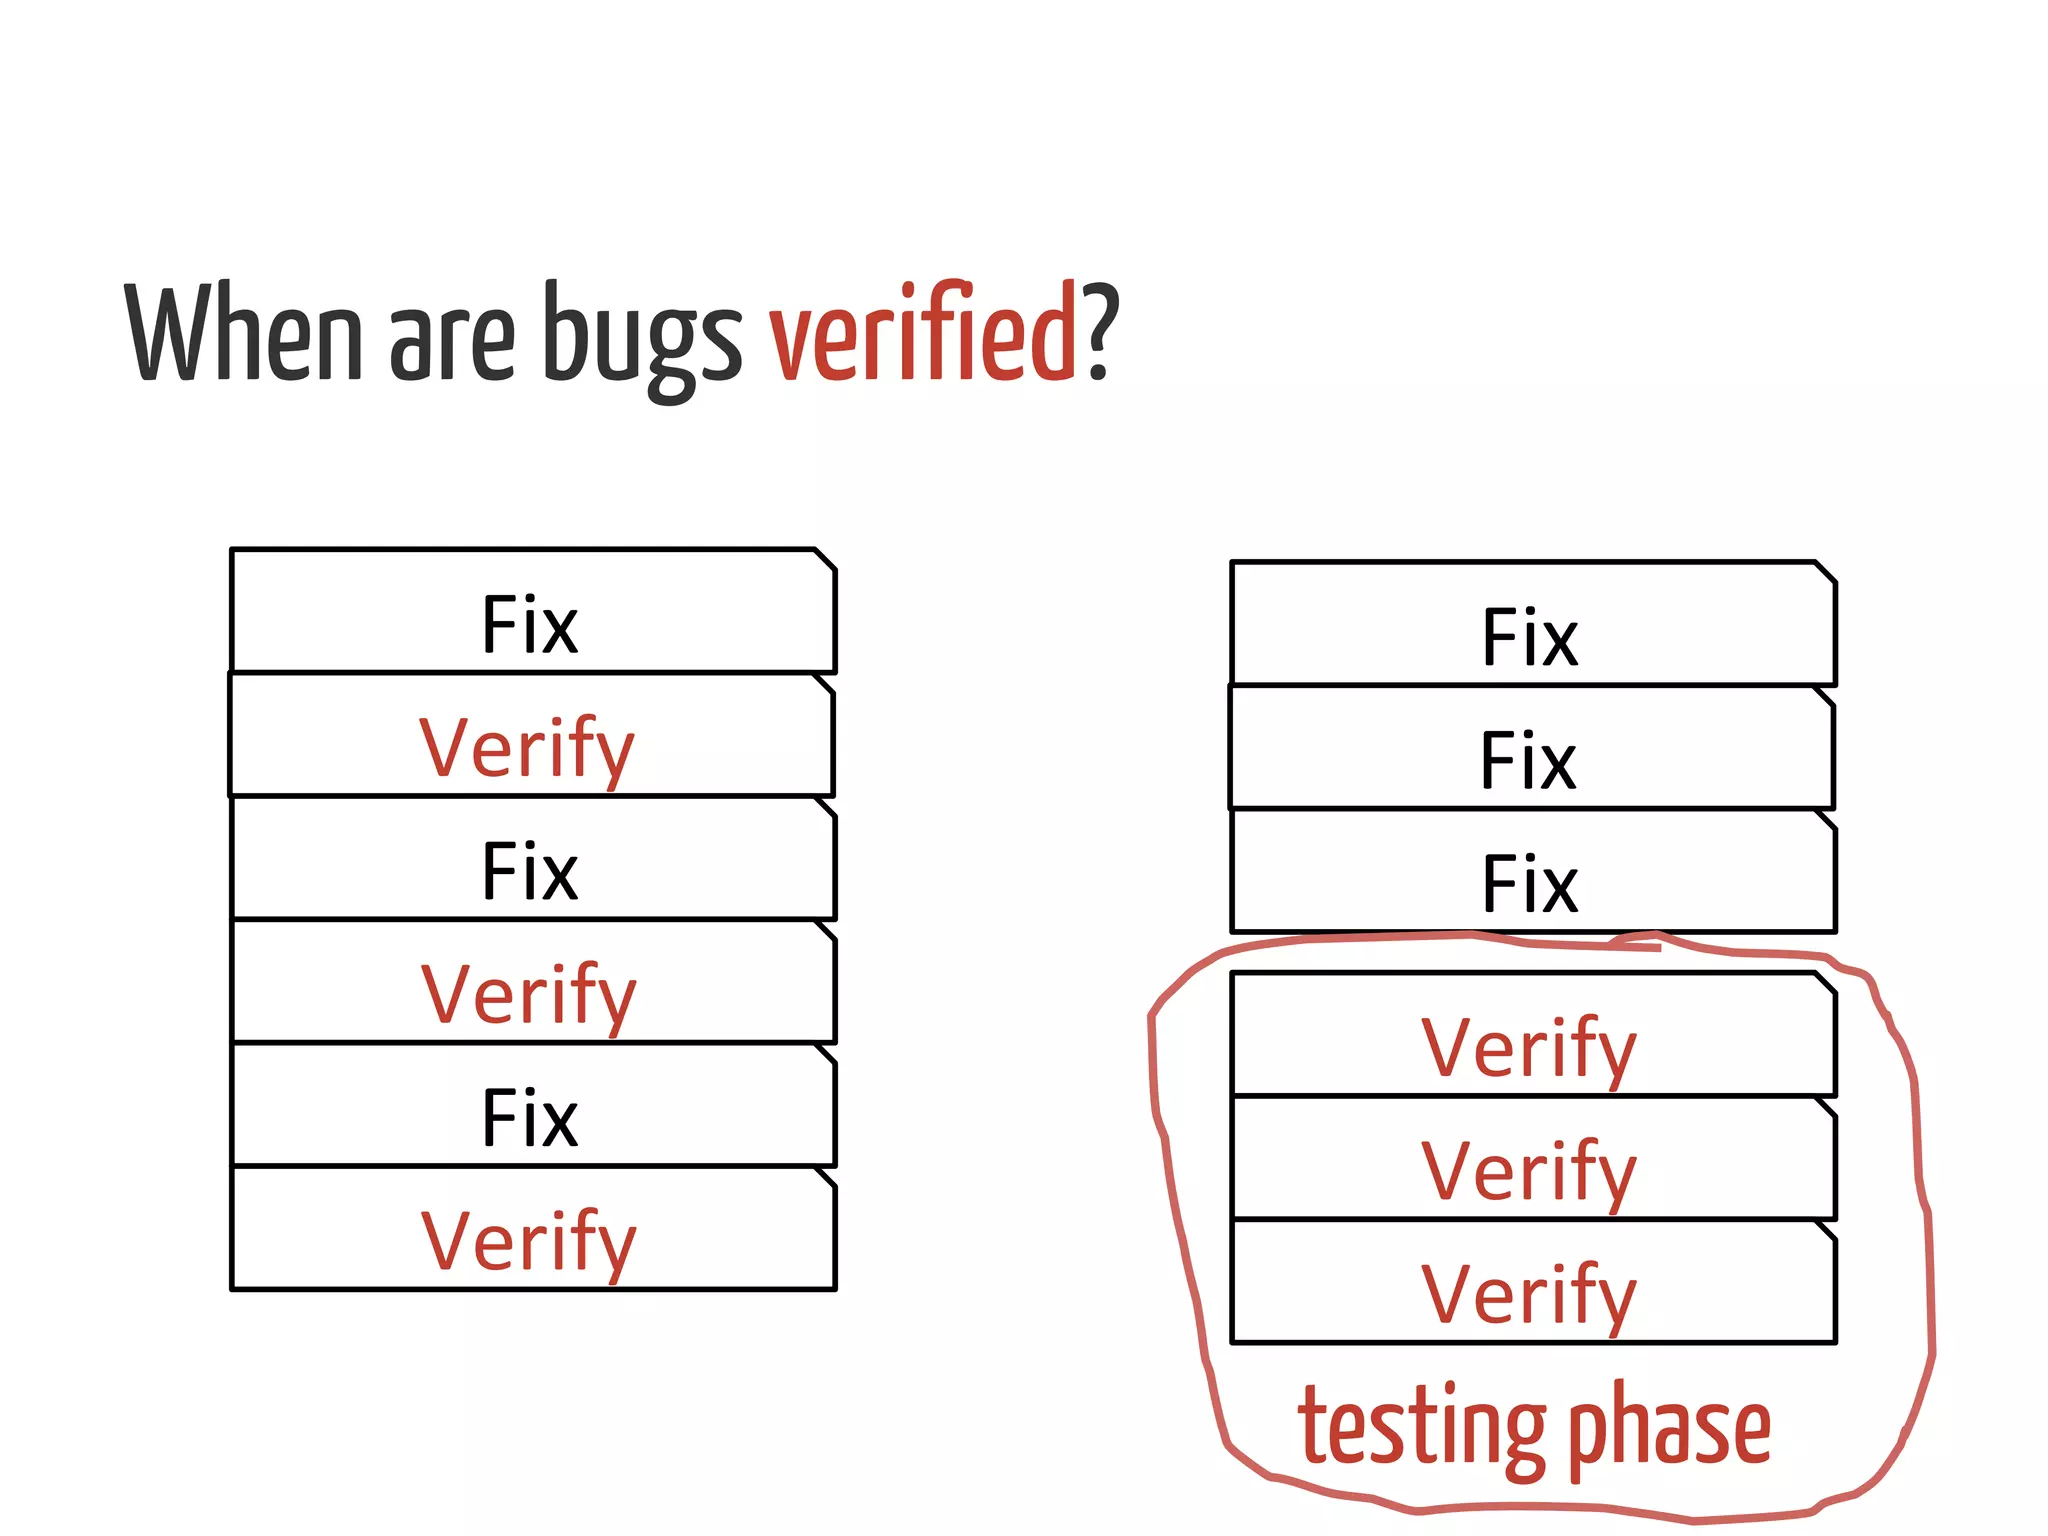

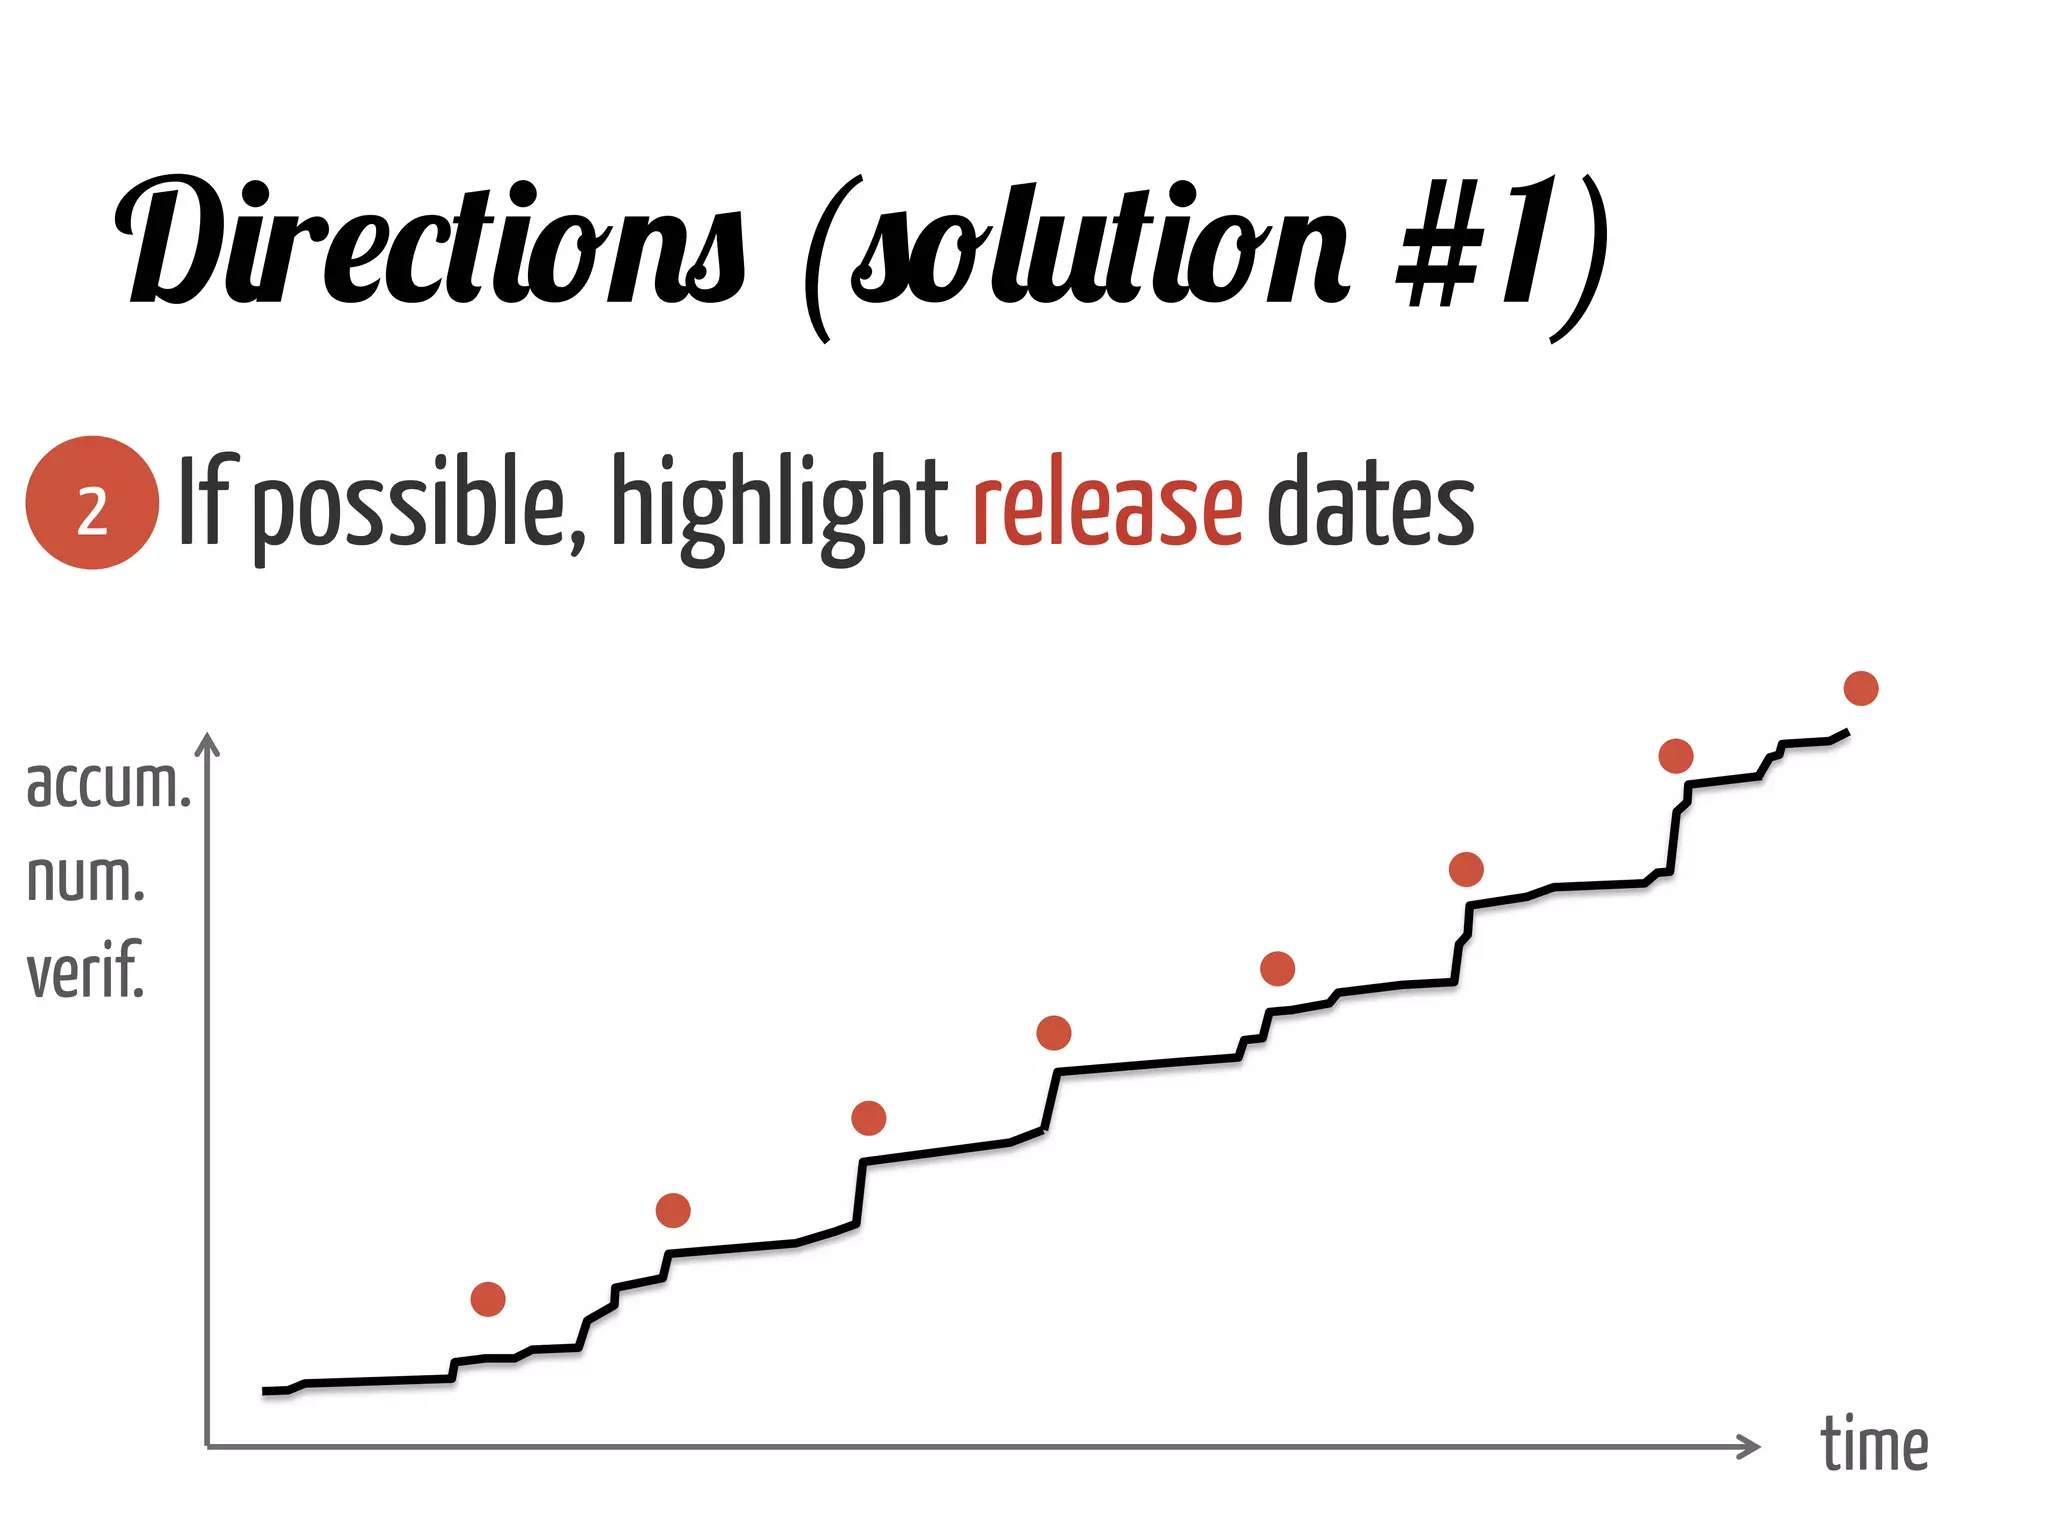
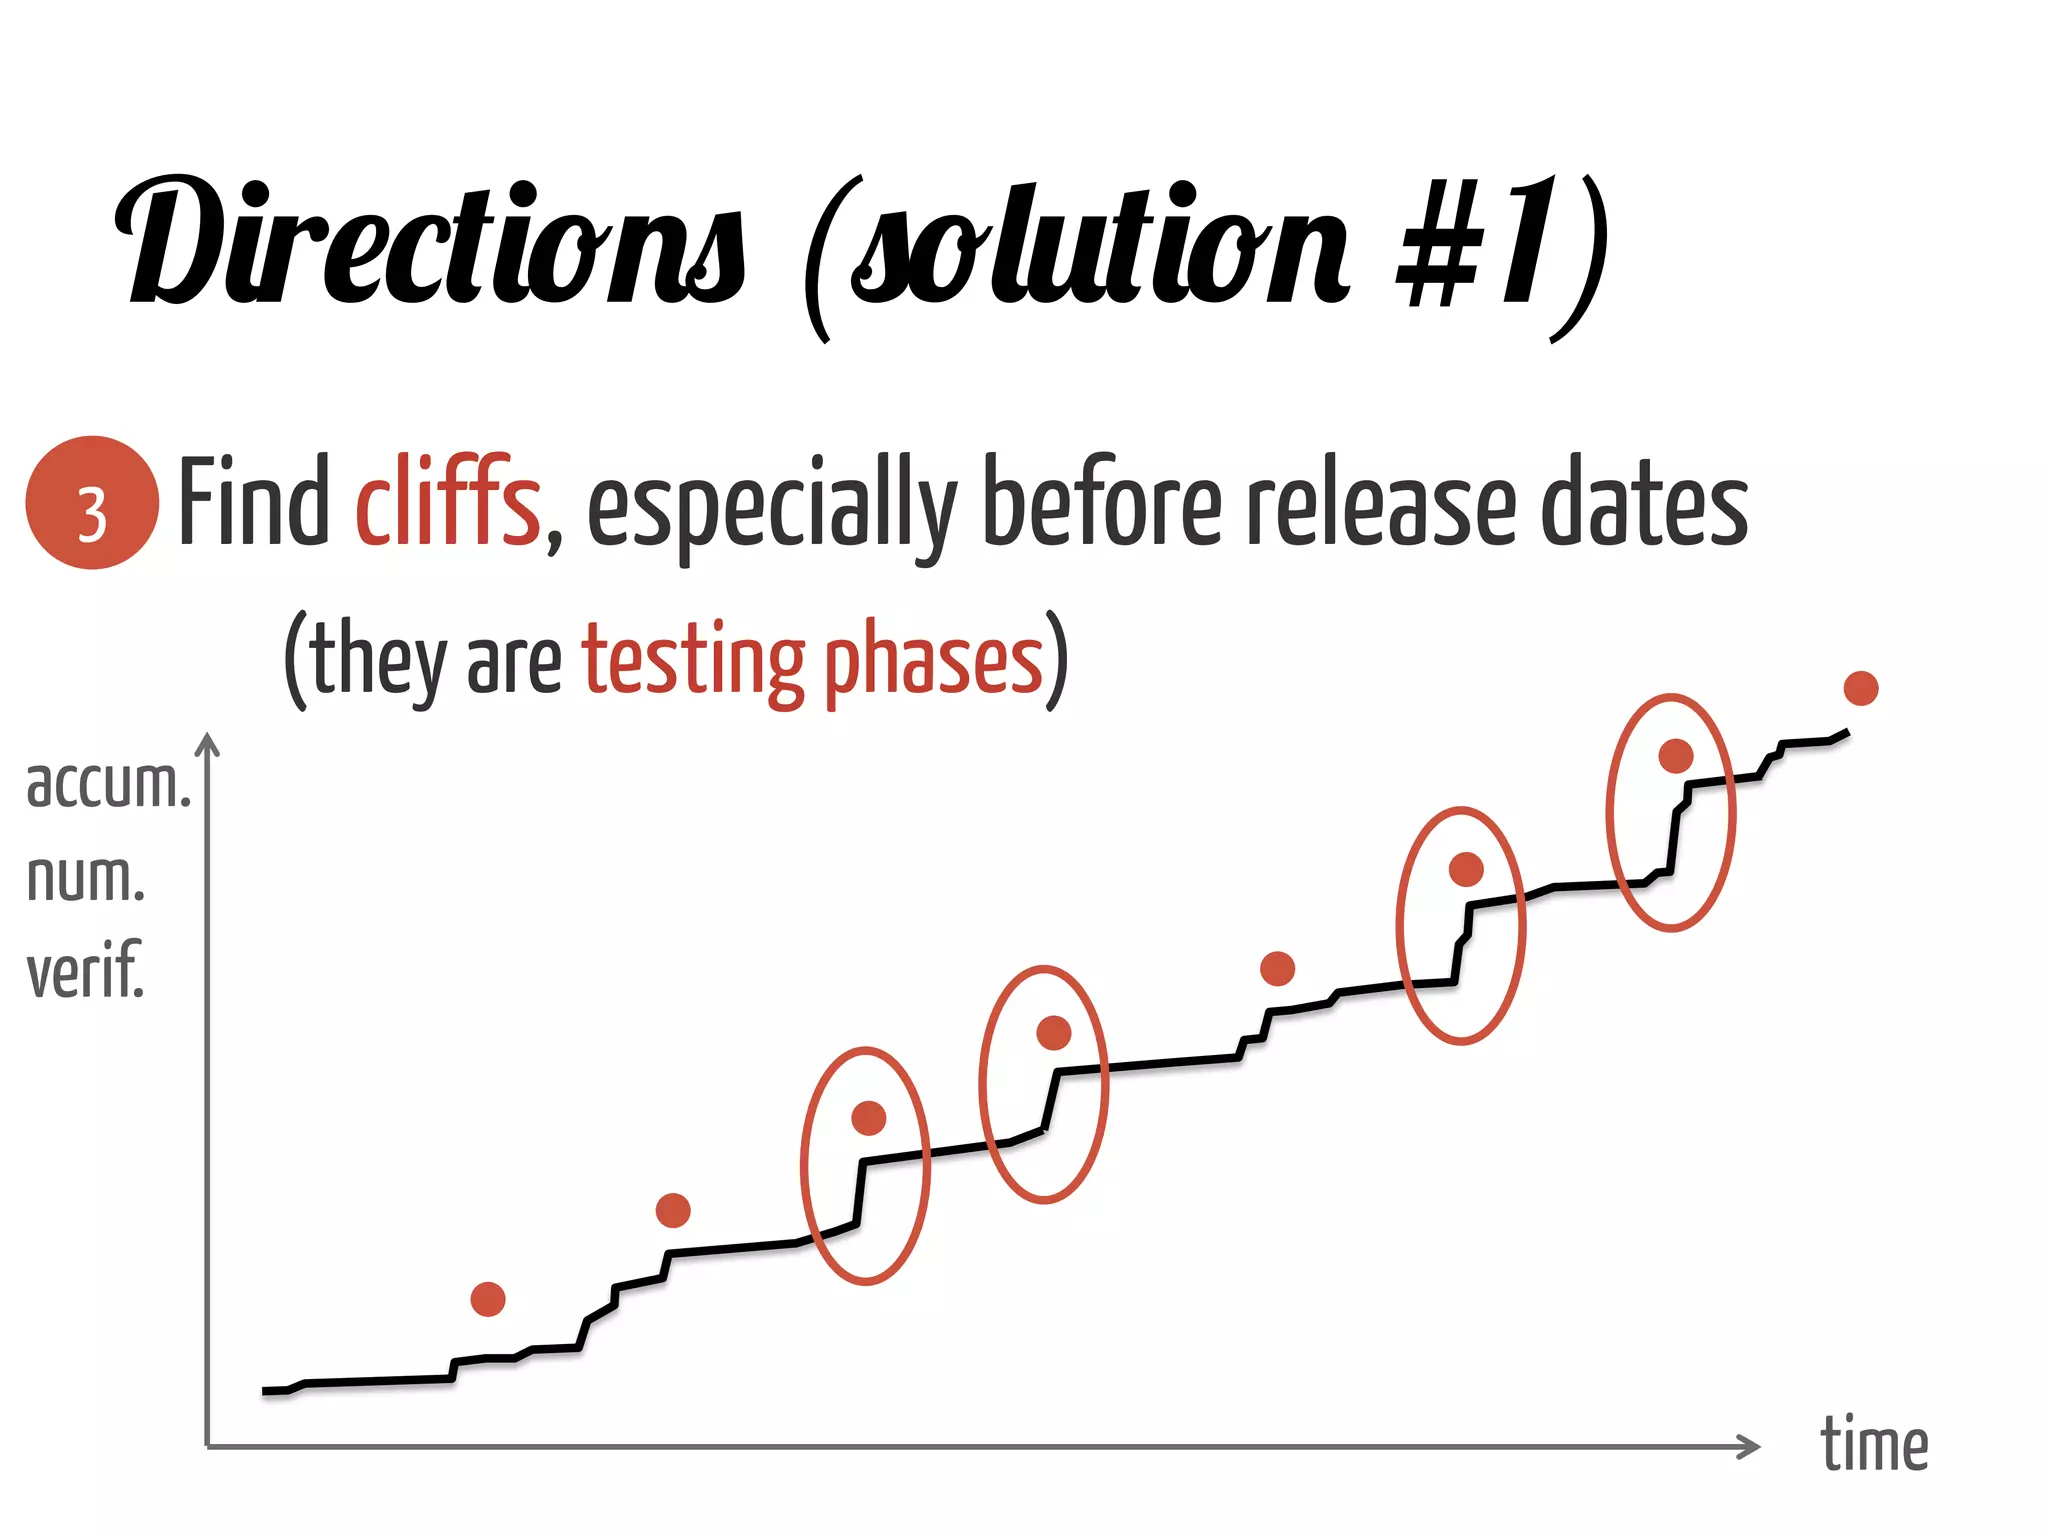
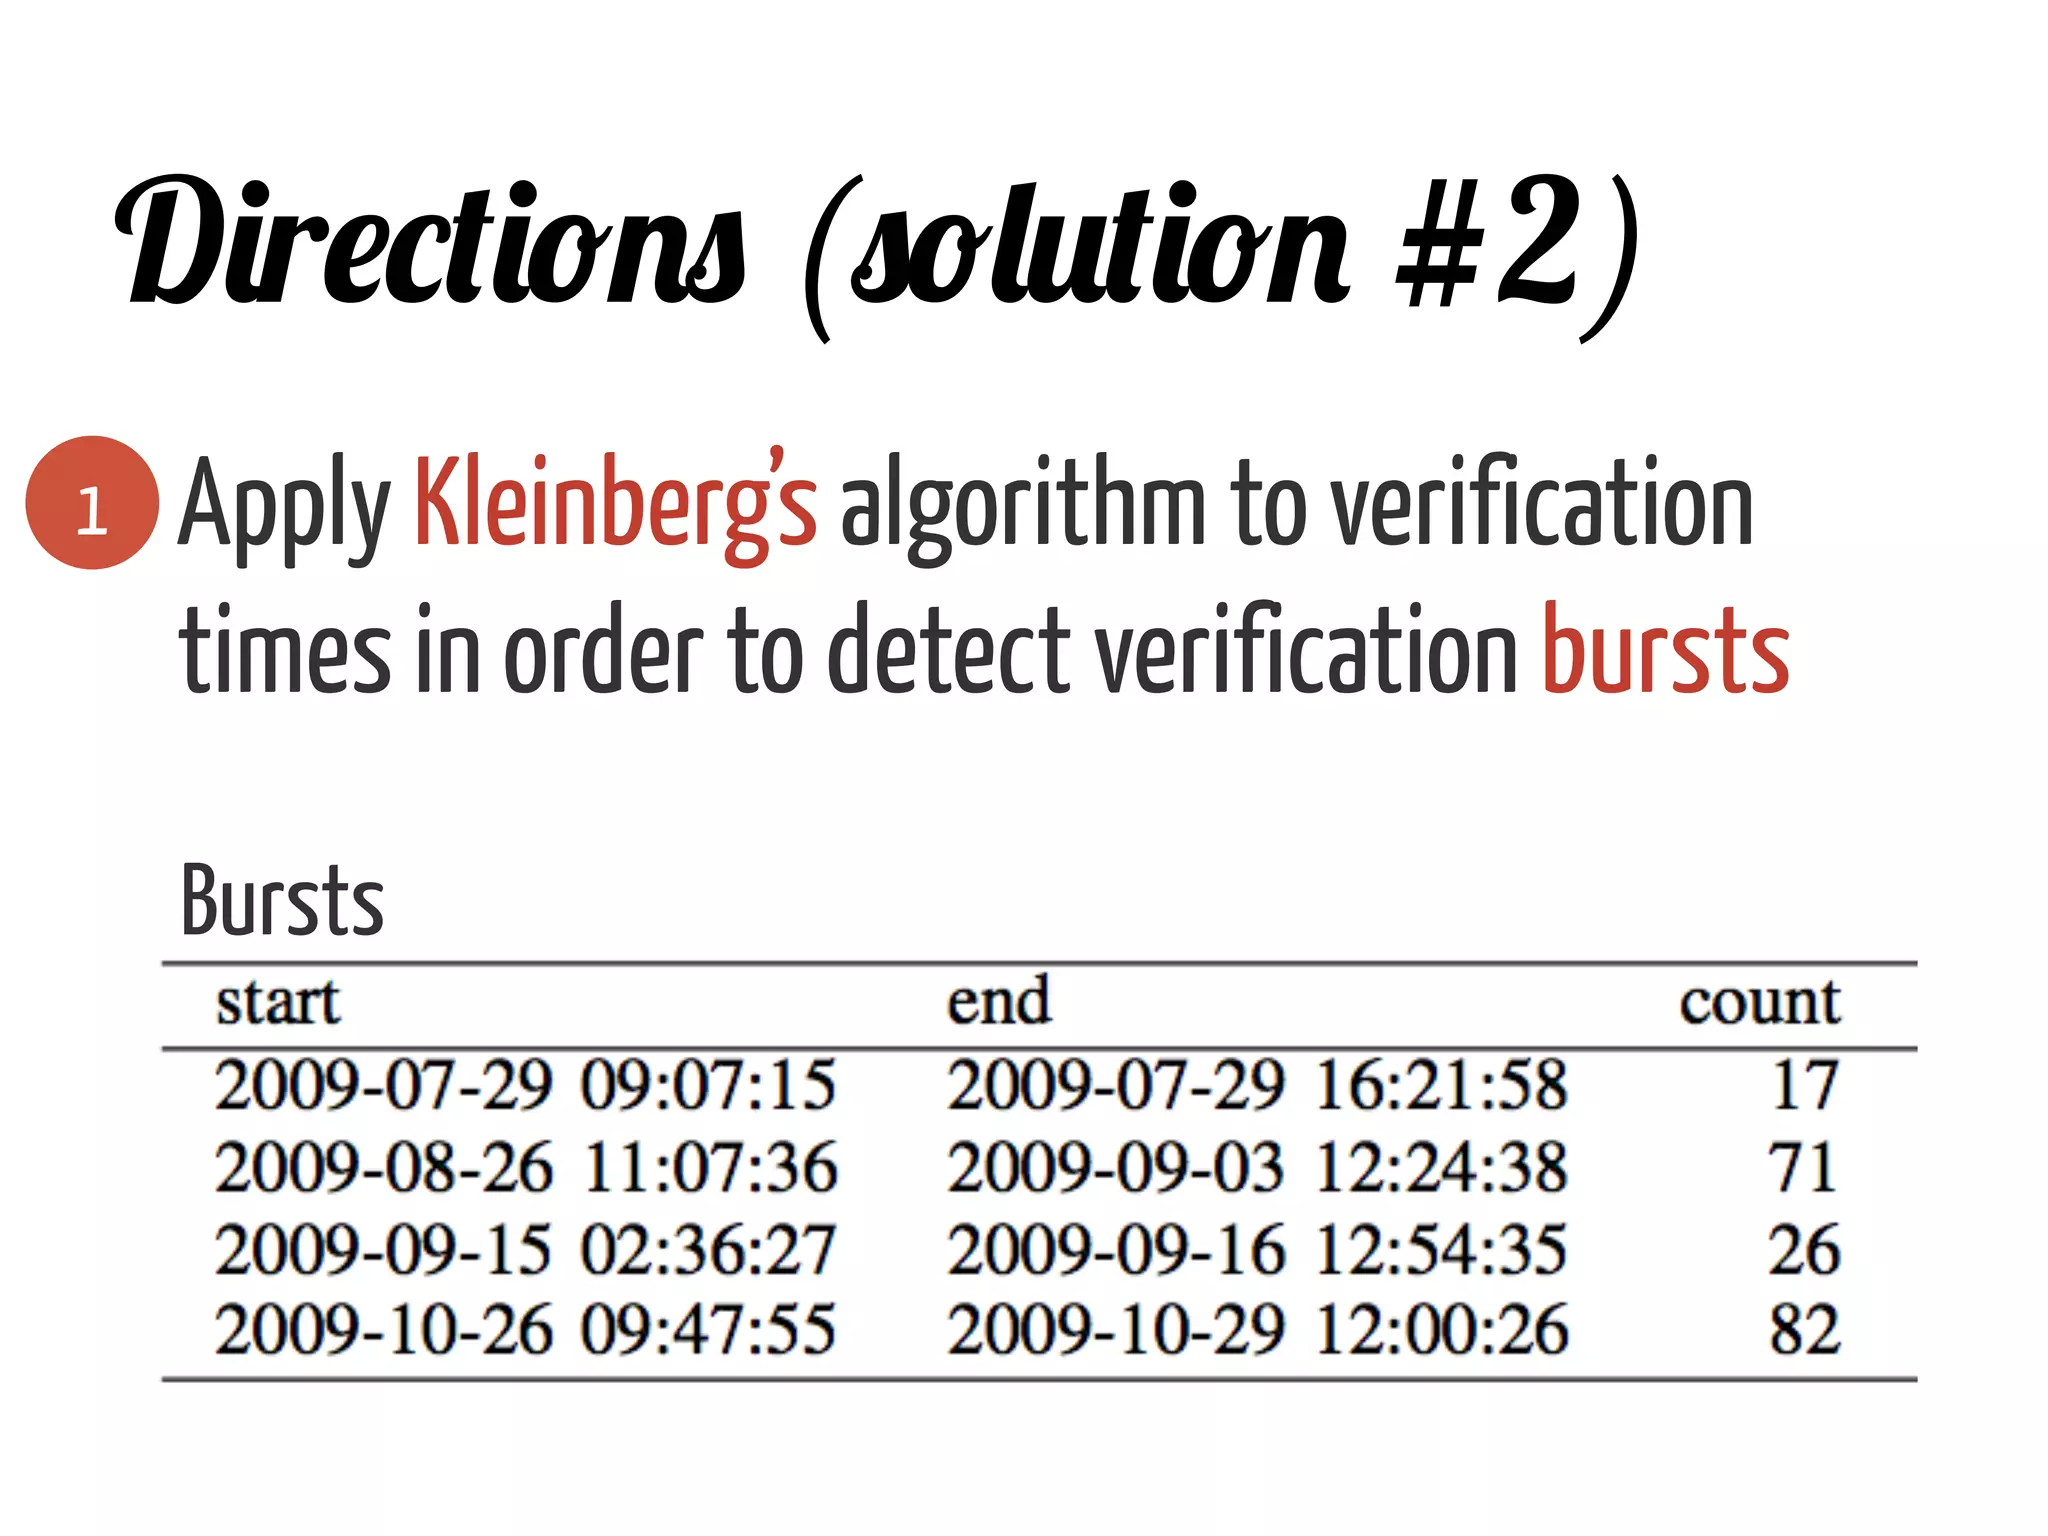
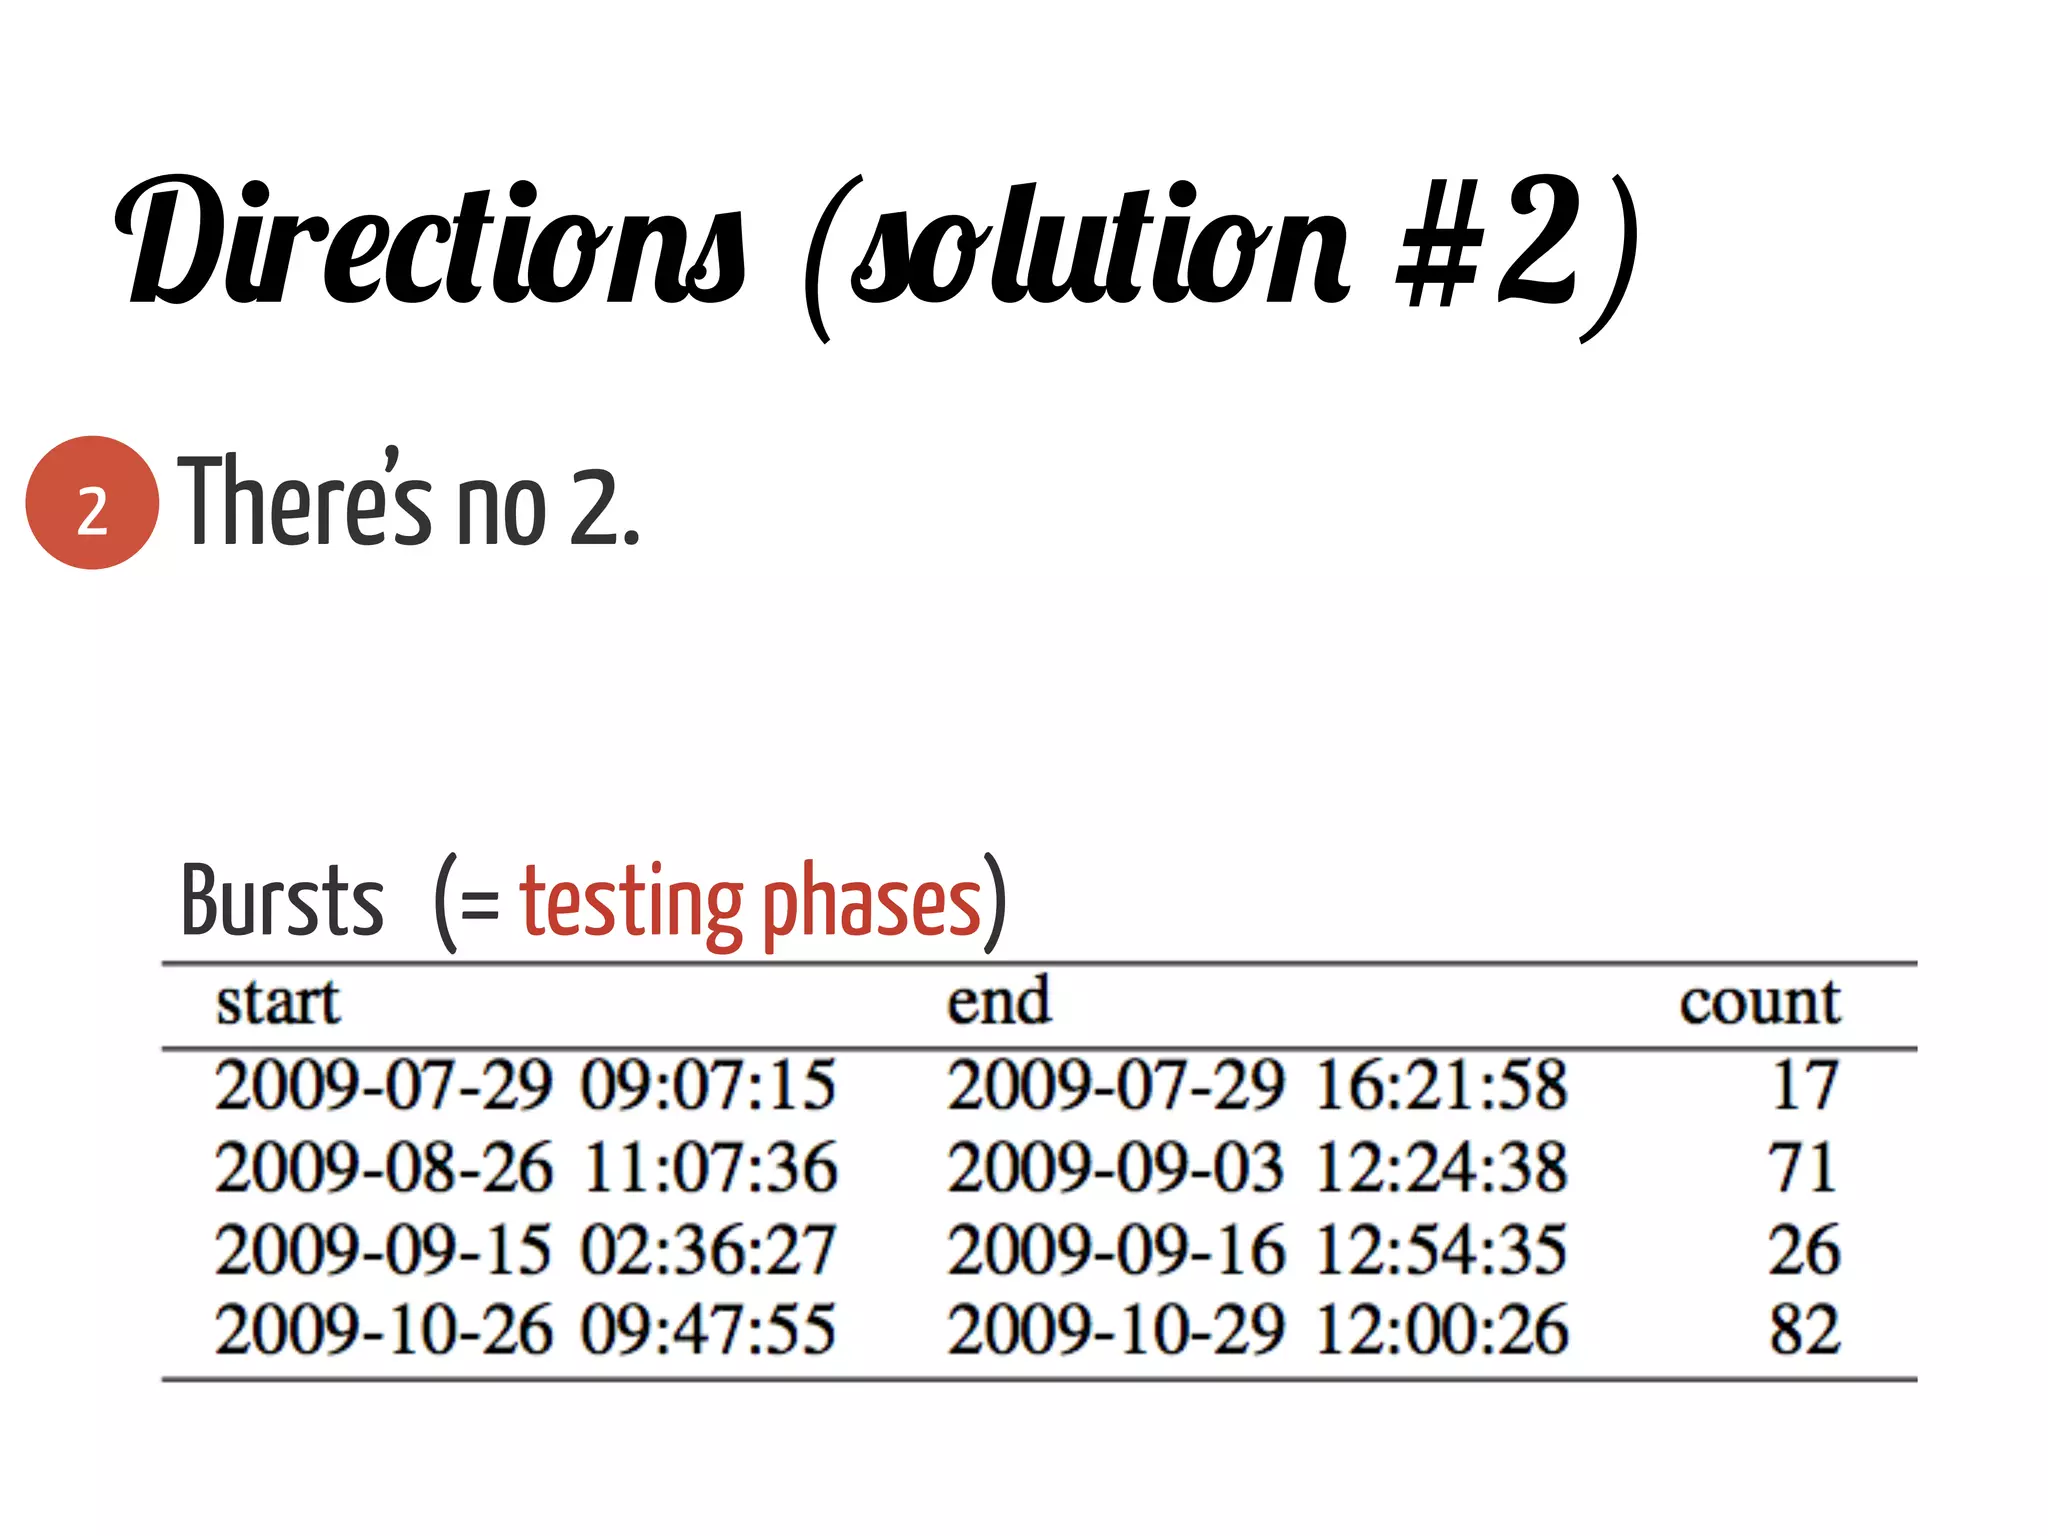


The document discusses patterns for extracting valuable insights from bug reports, focusing on two roles within quality engineering: fixers, who resolve bugs, and verifiers, who ensure fixes are appropriate. It outlines methods for analyzing developer contributions through ratios of verifications to fixes and emphasizes the importance of identifying testing phases in the software development life cycle. By applying these concepts, teams can enhance data analysis and improve software quality.


