Download to read offline
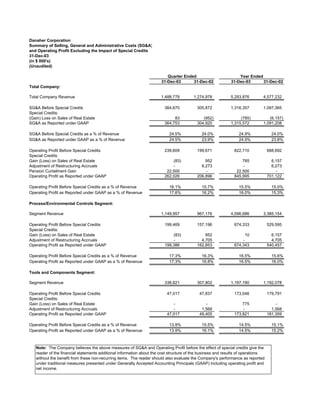


Danaher Corporation provided a document summarizing its selling, general and administrative costs, operating profit, and free cash flow for the quarter and year ended December 31, 2003. Some key highlights include: - Total company revenue for the quarter increased 16.7% to $1.49 billion compared to the same quarter last year. - Operating profit before special credits for the total company was $239.6 million for the quarter, up 20.1% from the prior year. - Free cash flow for the year was $781.2 million, up 21.1% from 2002.


