If you are looking for a pi coin investor. Then look no further because I have the right one he is a pi vendor (he buy and resell to whales in China). I met him on a crypto conference and ever since I and my friends have sold more than 10k pi coins to him And he bought all and still want more. I will drop his telegram handle below just send him a message.
@Pi_vendor_247
What price will pi network be listed on exchangesDOT TECH
The rate at which pi will be listed is practically unknown. But due to speculations surrounding it the predicted rate is tends to be from 30$ — 50$.
So if you are interested in selling your pi network coins at a high rate tho. Or you can't wait till the mainnet launch in 2026. You can easily trade your pi coins with a merchant.
A merchant is someone who buys pi coins from miners and resell them to Investors looking forward to hold massive quantities till mainnet launch.
I will leave the telegram contact of my personal pi vendor to trade with.
@Pi_vendor_247
Financial Assets: Debit vs Equity Securities.pptxWrito-Finance
financial assets represent claim for future benefit or cash. Financial assets are formed by establishing contracts between participants. These financial assets are used for collection of huge amounts of money for business purposes.
Two major Types: Debt Securities and Equity Securities.
Debt Securities are Also known as fixed-income securities or instruments. The type of assets is formed by establishing contracts between investor and issuer of the asset.
• The first type of Debit securities is BONDS. Bonds are issued by corporations and government (both local and national government).
• The second important type of Debit security is NOTES. Apart from similarities associated with notes and bonds, notes have shorter term maturity.
• The 3rd important type of Debit security is TRESURY BILLS. These securities have short-term ranging from three months, six months, and one year. Issuer of such securities are governments.
• Above discussed debit securities are mostly issued by governments and corporations. CERTIFICATE OF DEPOSITS CDs are issued by Banks and Financial Institutions. Risk factor associated with CDs gets reduced when issued by reputable institutions or Banks.
Following are the risk attached with debt securities: Credit risk, interest rate risk and currency risk
There are no fixed maturity dates in such securities, and asset’s value is determined by company’s performance. There are two major types of equity securities: common stock and preferred stock.
Common Stock: These are simple equity securities and bear no complexities which the preferred stock bears. Holders of such securities or instrument have the voting rights when it comes to select the company’s board of director or the business decisions to be made.
Preferred Stock: Preferred stocks are sometime referred to as hybrid securities, because it contains elements of both debit security and equity security. Preferred stock confers ownership rights to security holder that is why it is equity instrument
<a href="https://www.writofinance.com/equity-securities-features-types-risk/" >Equity securities </a> as a whole is used for capital funding for companies. Companies have multiple expenses to cover. Potential growth of company is required in competitive market. So, these securities are used for capital generation, and then uses it for company’s growth.
Concluding remarks
Both are employed in business. Businesses are often established through debit securities, then what is the need for equity securities. Companies have to cover multiple expenses and expansion of business. They can also use equity instruments for repayment of debits. So, there are multiple uses for securities. As an investor, you need tools for analysis. Investment decisions are made by carefully analyzing the market. For better analysis of the stock market, investors often employ financial analysis of companies.
Introduction to Indian Financial System ()Avanish Goel
The financial system of a country is an important tool for economic development of the country, as it helps in creation of wealth by linking savings with investments.
It facilitates the flow of funds form the households (savers) to business firms (investors) to aid in wealth creation and development of both the parties
how to sell pi coins in South Korea profitably.DOT TECH
Yes. You can sell your pi network coins in South Korea or any other country, by finding a verified pi merchant
What is a verified pi merchant?
Since pi network is not launched yet on any exchange, the only way you can sell pi coins is by selling to a verified pi merchant, and this is because pi network is not launched yet on any exchange and no pre-sale or ico offerings Is done on pi.
Since there is no pre-sale, the only way exchanges can get pi is by buying from miners. So a pi merchant facilitates these transactions by acting as a bridge for both transactions.
How can i find a pi vendor/merchant?
Well for those who haven't traded with a pi merchant or who don't already have one. I will leave the telegram id of my personal pi merchant who i trade pi with.
Tele gram: @Pi_vendor_247
#pi #sell #nigeria #pinetwork #picoins #sellpi #Nigerian #tradepi #pinetworkcoins #sellmypi
How to get verified on Coinbase Account?_.docxBuy bitget
t's important to note that buying verified Coinbase accounts is not recommended and may violate Coinbase's terms of service. Instead of searching to "buy verified Coinbase accounts," follow the proper steps to verify your own account to ensure compliance and security.
when will pi network coin be available on crypto exchange.DOT TECH
There is no set date for when Pi coins will enter the market.
However, the developers are working hard to get them released as soon as possible.
Once they are available, users will be able to exchange other cryptocurrencies for Pi coins on designated exchanges.
But for now the only way to sell your pi coins is through verified pi vendor.
Here is the telegram contact of my personal pi vendor
@Pi_vendor_247
what is the best method to sell pi coins in 2024DOT TECH
The best way to sell your pi coins safely is trading with an exchange..but since pi is not launched in any exchange, and second option is through a VERIFIED pi merchant.
Who is a pi merchant?
A pi merchant is someone who buys pi coins from miners and pioneers and resell them to Investors looking forward to hold massive amounts before mainnet launch in 2026.
I will leave the telegram contact of my personal pi merchant to trade pi coins with.
@Pi_vendor_247
how to sell pi coins on Bitmart crypto exchangeDOT TECH
Yes. Pi network coins can be exchanged but not on bitmart exchange. Because pi network is still in the enclosed mainnet. The only way pioneers are able to trade pi coins is by reselling the pi coins to pi verified merchants.
A verified merchant is someone who buys pi network coins and resell it to exchanges looking forward to hold till mainnet launch.
I will leave the telegram contact of my personal pi merchant to trade with.
@Pi_vendor_247
US Economic Outlook - Being Decided - M Capital Group August 2021.pdfpchutichetpong
The U.S. economy is continuing its impressive recovery from the COVID-19 pandemic and not slowing down despite re-occurring bumps. The U.S. savings rate reached its highest ever recorded level at 34% in April 2020 and Americans seem ready to spend. The sectors that had been hurt the most by the pandemic specifically reduced consumer spending, like retail, leisure, hospitality, and travel, are now experiencing massive growth in revenue and job openings.
Could this growth lead to a “Roaring Twenties”? As quickly as the U.S. economy contracted, experiencing a 9.1% drop in economic output relative to the business cycle in Q2 2020, the largest in recorded history, it has rebounded beyond expectations. This surprising growth seems to be fueled by the U.S. government’s aggressive fiscal and monetary policies, and an increase in consumer spending as mobility restrictions are lifted. Unemployment rates between June 2020 and June 2021 decreased by 5.2%, while the demand for labor is increasing, coupled with increasing wages to incentivize Americans to rejoin the labor force. Schools and businesses are expected to fully reopen soon. In parallel, vaccination rates across the country and the world continue to rise, with full vaccination rates of 50% and 14.8% respectively.
However, it is not completely smooth sailing from here. According to M Capital Group, the main risks that threaten the continued growth of the U.S. economy are inflation, unsettled trade relations, and another wave of Covid-19 mutations that could shut down the world again. Have we learned from the past year of COVID-19 and adapted our economy accordingly?
“In order for the U.S. economy to continue growing, whether there is another wave or not, the U.S. needs to focus on diversifying supply chains, supporting business investment, and maintaining consumer spending,” says Grace Feeley, a research analyst at M Capital Group.
While the economic indicators are positive, the risks are coming closer to manifesting and threatening such growth. The new variants spreading throughout the world, Delta, Lambda, and Gamma, are vaccine-resistant and muddy the predictions made about the economy and health of the country. These variants bring back the feeling of uncertainty that has wreaked havoc not only on the stock market but the mindset of people around the world. MCG provides unique insight on how to mitigate these risks to possibly ensure a bright economic future.
how to sell pi coins in all Africa Countries.DOT TECH
Yes. You can sell your pi network for other cryptocurrencies like Bitcoin, usdt , Ethereum and other currencies And this is done easily with the help from a pi merchant.
What is a pi merchant ?
Since pi is not launched yet in any exchange. The only way you can sell right now is through merchants.
A verified Pi merchant is someone who buys pi network coins from miners and resell them to investors looking forward to hold massive quantities of pi coins before mainnet launch in 2026.
I will leave the telegram contact of my personal pi merchant to trade with.
@Pi_vendor_247
The Evolution of Non-Banking Financial Companies (NBFCs) in India: Challenges...beulahfernandes8
Role in Financial System
NBFCs are critical in bridging the financial inclusion gap.
They provide specialized financial services that cater to segments often neglected by traditional banks.
Economic Impact
NBFCs contribute significantly to India's GDP.
They support sectors like micro, small, and medium enterprises (MSMEs), housing finance, and personal loans.
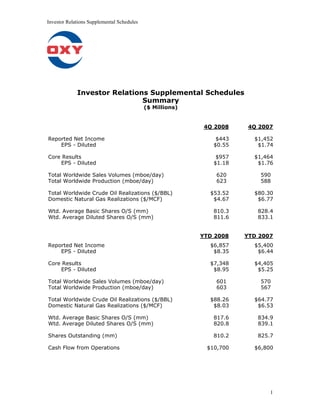
1. Investor Relations Supplemental Schedules
Investor Relations Supplemental Schedules
Summary
($ Millions)
4Q 2008 4Q 2007
Reported Net Income $443 $1,452
EPS - Diluted $0.55 $1.74
Core Results $957 $1,464
EPS - Diluted $1.18 $1.76
Total Worldwide Sales Volumes (mboe/day) 620 590
Total Worldwide Production (mboe/day) 623 588
Total Worldwide Crude Oil Realizations ($/BBL) $53.52 $80.30
Domestic Natural Gas Realizations ($/MCF) $4.67 $6.77
Wtd. Average Basic Shares O/S (mm) 810.3 828.4
Wtd. Average Diluted Shares O/S (mm) 811.6 833.1
YTD 2008 YTD 2007
Reported Net Income $6,857 $5,400
EPS - Diluted $8.35 $6.44
Core Results $7,348 $4,405
EPS - Diluted $8.95 $5.25
Total Worldwide Sales Volumes (mboe/day) 601 570
Total Worldwide Production (mboe/day) 603 567
Total Worldwide Crude Oil Realizations ($/BBL) $88.26 $64.77
Domestic Natural Gas Realizations ($/MCF) $8.03 $6.53
Wtd. Average Basic Shares O/S (mm) 817.6 834.9
Wtd. Average Diluted Shares O/S (mm) 820.8 839.1
Shares Outstanding (mm) 810.2 825.7
Cash Flow from Operations $10,700 $6,800
1
2. Investor Relations Supplemental Schedules
OCCIDENTAL PETROLEUM
2008 Fourth Quarter
Net Income (Loss)
($ millions)
Reported Core
Income Significant Items Affecting Income Results
Oil & Gas $ 339 $ 58 Rig contract terminations $ 996
599 Asset impairments
Chemical 127 90 Plant closure and impairments 217
Midstream, marketing and other 170 170
Corporate
Interest expense, net (16) (16)
Other (54) (54)
Taxes (118) (238) Tax effect of adjustments (356)
Income from continuing operations 448 509 957
Discontinued operations, net of tax (5) 5 Discontinued operations, net -
Net Income $ 443 $ 514 $ 957
Basic Earnings Per Common Share
Income from continuing operations $ 0.55
Discontinued operations, net -
Net Income $ 0.55 $ 1.18
Diluted Earnings Per Common Share
Income from continuing operations $ 0.55
Discontinued operations, net -
Net Income $ 0.55 $ 1.18
2
3. Investor Relations Supplemental Schedules
OCCIDENTAL PETROLEUM
2007 Fourth Quarter
Net Income (Loss)
($ millions)
Reported Core
Income Significant Items Affecting Income Results
Oil & Gas $ 2,461 $ 2,461
Chemical 94 94
Midstream, marketing and other 138 138
Corporate
Interest expense, net (13) (13)
Other (175) 25 Severance (150)
Taxes (1,057) (9) Tax effect of adjustments (1,066)
Income from continuing operations 1,448 16 1,464
Discontinued operations, net of tax 4 (4) Discontinued operations, net -
Net Income $ 1,452 $ 12 $ 1,464
Basic Earnings Per Common Share
Income from continuing operations $ 1.75
Discontinued operations, net of tax -
Net Income $ 1.75 $ 1.77
Diluted Earnings Per Common Share
Income from continuing operations $ 1.74
Discontinued operations, net of tax -
Net Income $ 1.74 $ 1.76
3
4. Investor Relations Supplemental Schedules
OCCIDENTAL PETROLEUM
2008 Total Year
Net Income (Loss)
($ millions)
Reported Core
Income Significant Items Affecting Income Results
Oil & Gas $ 10,651 $ 58 Rig contract terminations $ 11,308
599 Asset impairments
Chemical 669 90 Plant closure and impairments 759
Midstream, marketing and other 520 520
Corporate
Interest expense, net (26) (26)
Other (346) (346)
Taxes (4,629) (238) Tax effect of adjustments (4,867)
Income from continuing operations 6,839 509 7,348
Discontinued operations, net of tax 18 (18) Discontinued operations, net -
Net Income $ 6,857 $ 491 $ 7,348
Basic Earnings Per Common Share
Income from continuing operations $ 8.37
Discontinued operations, net 0.02
Net Income $ 8.39 $ 8.99
Diluted Earnings Per Common Share
Income from continuing operations $ 8.33
Discontinued operations, net 0.02
Net Income $ 8.35 $ 8.95
4
5. Investor Relations Supplemental Schedules
OCCIDENTAL PETROLEUM
2007 Total Year
Net Income (Loss)
($ millions)
Reported Core
Income Significant Items Affecting Income Results
Oil & Gas $ 7,957 $ (412) Sale of Russian operations $ 7,369
(112) Legal settlements
(103) Sale of exploration properties
(35) Sale of oil & gas interests
74 Exploration impairments
Chemical 601 601
Midstream, marketing and other 367 367
Corporate
Interest expense, net (199) 167 Debt purchases (32)
Other (141) (326) Sale of Lyondell shares (395)
25 Severance charge
47 Facility closure
Taxes (3,507) 2 Tax effect of adjustments (3,505)
Income from continuing operations 5,078 (673) 4,405
Discontinued operations, net of tax 322 (322) Discontinued operations, net -
Net Income $ 5,400 $ (995) $ 4,405
Basic Earnings Per Common Share
Income from continuing operations $ 6.08
Discontinued operations, net of tax 0.39
Net Income $ 6.47 $ 5.28
Diluted Earnings Per Common Share
Income from continuing operations $ 6.05
Discontinued operations, net of tax 0.39
Net Income $ 6.44 $ 5.25
5
6. Investor Relations Supplemental Schedules
OCCIDENTAL PETROLEUM
Items Affecting Comparability of Core Results Between Periods
The item(s) below are included in core results and are shown in this table
because they affect the comparability between periods.
Pre-tax
Income / (Expense) Fourth Quarter 12 Months
2008 2007 2008 2007
Corporate
Foreign Exchange Gains & (Losses)* 88 5 91 (18)
*Amounts shown after tax
6
7. Investor Relations Supplemental Schedules
OCCIDENTAL PETROLEUM
Worldwide Effective Tax Rate
QUARTERLY YEAR TO-DATE
2008 2008 2007 2008 2007
REPORTED INCOME QTR 4 QTR 3 QTR 4 12 Months 12 Months
Oil & Gas (a) 339 3,618 2,461 10,651 7,957
Chemicals 127 219 94 669 601
Midstream, marketing and other 170 66 138 520 367
Corporate (70) (85) (188) (372) (340)
Pre-tax income 566 3,818 2,505 11,468 8,585
Income tax expense
Federal and state 65 716 473 2,188 1,558
Foreign (a) 53 830 584 2,441 1,949
Total 118 1,546 1,057 4,629 3,507
Income from continuing operations 448 2,272 1,448 6,839 5,078
Worldwide effective tax rate 21% 40% 42% 40% 41%
2008 2008 2007 2008 2007
CORE RESULTS QTR 4 QTR 3 QTR 4 12 Months 12 Months
Oil & Gas (a) 996 3,618 2,461 11,308 7,369
Chemicals 217 219 94 759 601
Midstream, marketing and other 170 66 138 520 367
Corporate (70) (85) (163) (372) (427)
Pre-tax income 1,313 3,818 2,530 12,215 7,910
Income tax expense
Federal and state 131 716 482 2,254 1,556
Foreign (a) 225 830 584 2,613 1,949
Total 356 1,546 1,066 4,867 3,505
Core results 957 2,272 1,464 7,348 4,405
Worldwide effective tax rate 27% 40% 42% 40% 44%
(a) Revenues and income tax expense include taxes owed by Occidental but paid by governmental
entities on its behalf. Oil and gas pre-tax income includes the following revenue amounts by periods.
2008 2008 2007 2008 2007
QTR 4 QTR 3 QTR 4 12 Months 12 Months
250 731 406 2,051 1,325
7
8. Investor Relations Supplemental Schedules
OCCIDENTAL PETROLEUM
2008 Fourth Quarter Net Income (Loss)
Reported Income Comparison
Fourth Third
Quarter Quarter
2008 2008 B / (W)
Oil & Gas $ 339 $ 3,618 $ (3,279)
Chemical 127 219 (92)
Midstream, marketing and other 170 66 104
Corporate
Interest expense, net (16) (3) (13)
Other (54) (82) 28
Taxes (118) (1,546) 1,428
Income from continuing operations 448 2,272 (1,824)
Discontinued operations, net (5) (1) (4)
Net Income $ 443 $ 2,271 $ (1,828)
Earnings Per Common Share
Basic $ 0.55 $ 2.79 $ (2.24)
Diluted $ 0.55 $ 2.78 $ (2.23)
Worldwide Effective Tax Rate 21% 40% 19%
OCCIDENTAL PETROLEUM
2008 Fourth Quarter Net Income (Loss)
Core Results Comparison
Fourth Third
Quarter Quarter
2008 2008 B / (W)
Oil & Gas $ 996 $ 3,618 $ (2,622)
Chemical 217 219 (2)
Midstream, marketing and other 170 66 104
Corporate
Interest expense, net (16) (3) (13)
Other (54) (82) 28
Taxes (356) (1,546) 1,190
Core Results $ 957 $ 2,272 $ (1,315)
Core Results Per Common Share
Basic $ 1.18 $ 2.79 $ (1.61)
Diluted $ 1.18 $ 2.78 $ (1.60)
Worldwide Effective Tax Rate 27% 40% 13%
8
9. Investor Relations Supplemental Schedules
OCCIDENTAL PETROLEUM
Oil & Gas
Variance Analysis 4Q08 vs. 3Q08
($ Millions)
$2,512
$3,618
$83 $73 $46*
$996
3Q 08 Sales Price Sales Exploration All Others 4Q 08
Volume/Mix Expense
* Includes foreign tax liability f/x gains of $76 million
OCCIDENTAL PETROLEUM
Chemical
Variance Analysis 4Q08 vs. 3Q08
($ Millions)
$58 $217
$219 $185* $8
$121
Sales
3Q 08 Sales Price 4Q 08
Operations/ All Others
Volume/Mix Manufacturing
* Lower energy and feedstock costs
9
10. Investor Relations Supplemental Schedules
OCCIDENTAL PETROLEUM
2008 Fourth Quarter Net Income (Loss)
Reported Income Comparison
Fourth Fourth
Quarter Quarter
2008 2007 B / (W)
Oil & Gas $ 339 $ 2,461 $ (2,122)
Chemical 127 94 33
Midstream, marketing and other 170 138 32
Corporate
Interest expense, net (16) (13) (3)
Other (54) (175) 121
Taxes (118) (1,057) 939
Income from continuing operations 448 1,448 (1,000)
Discontinued operations, net (5) 4 (9)
Net Income $ 443 $ 1,452 $ (1,009)
Earnings Per Common Share
Basic $ 0.55 $ 1.75 $ (1.20)
Diluted $ 0.55 $ 1.74 $ (1.19)
Worldwide Effective Tax Rate 21% 42% 21%
OCCIDENTAL PETROLEUM
2008 Fourth Quarter Net Income (Loss)
Core Results Comparison
Fourth Fourth
Quarter Quarter
2008 2007 B / (W)
Oil & Gas $ 996 $ 2,461 $ (1,465)
Chemical 217 94 123
Midstream, marketing and other 170 138 32
Corporate
Interest expense, net (16) (13) (3)
Other (54) (150) 96
Taxes (356) (1,066) 710
Core Results $ 957 $ 1,464 $ (507)
Core Results Per Common Share
Basic $ 1.18 $ 1.77 $ (0.59)
Diluted $ 1.18 $ 1.76 $ (0.58)
Worldwide Effective Tax Rate 27% 42% 15%
10