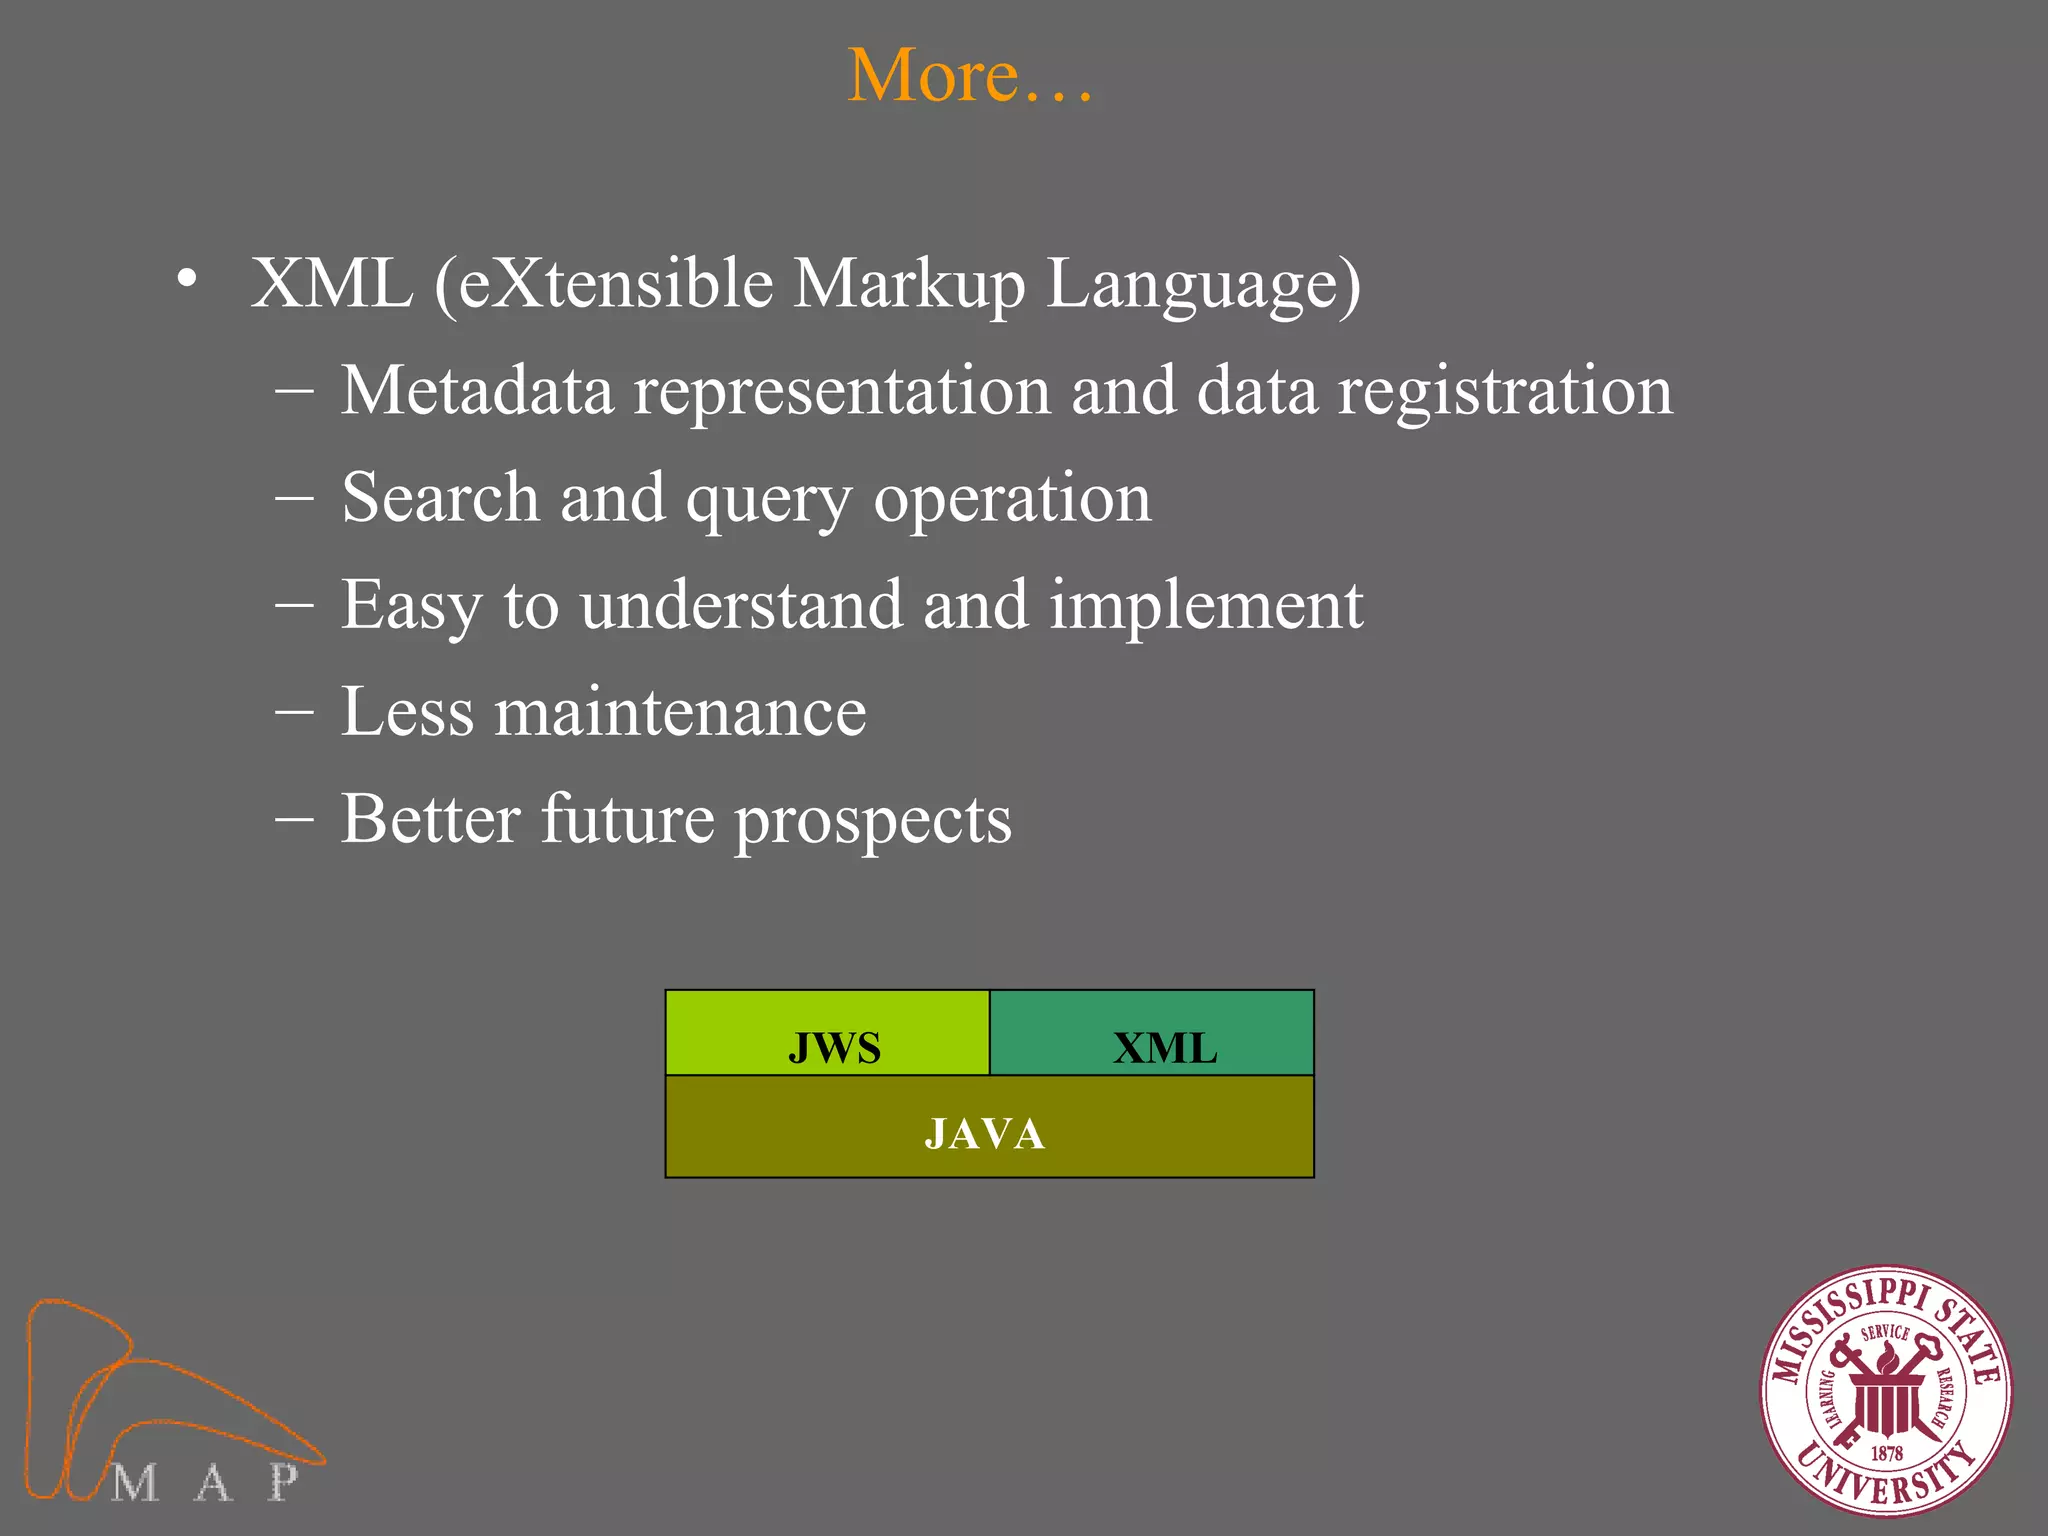
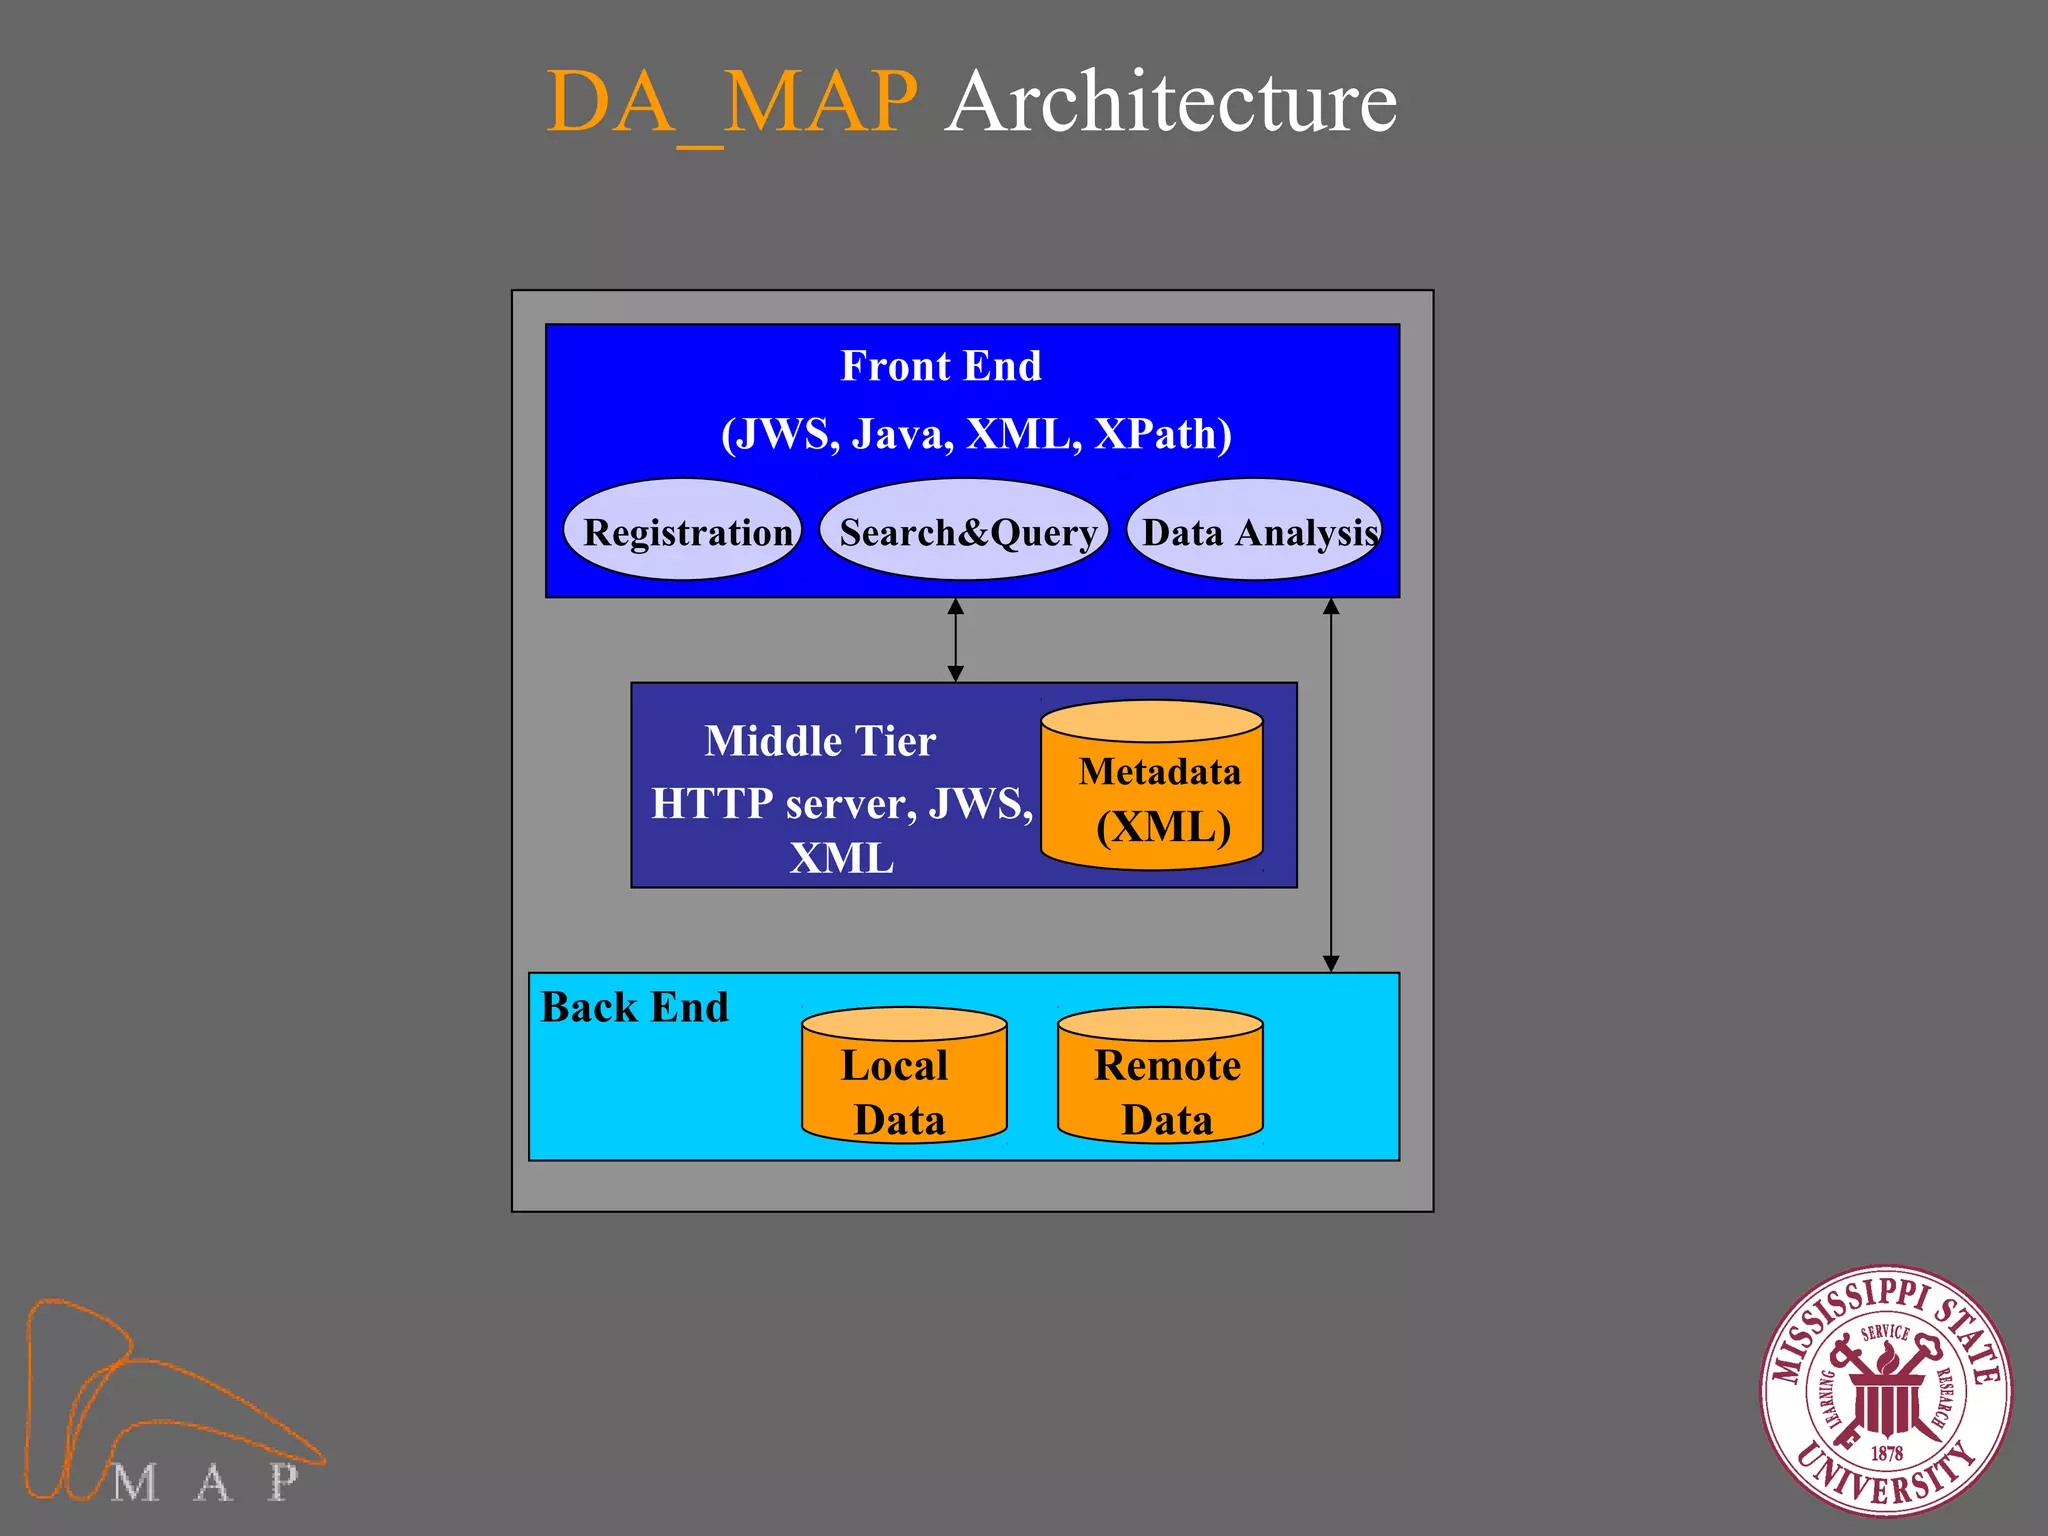
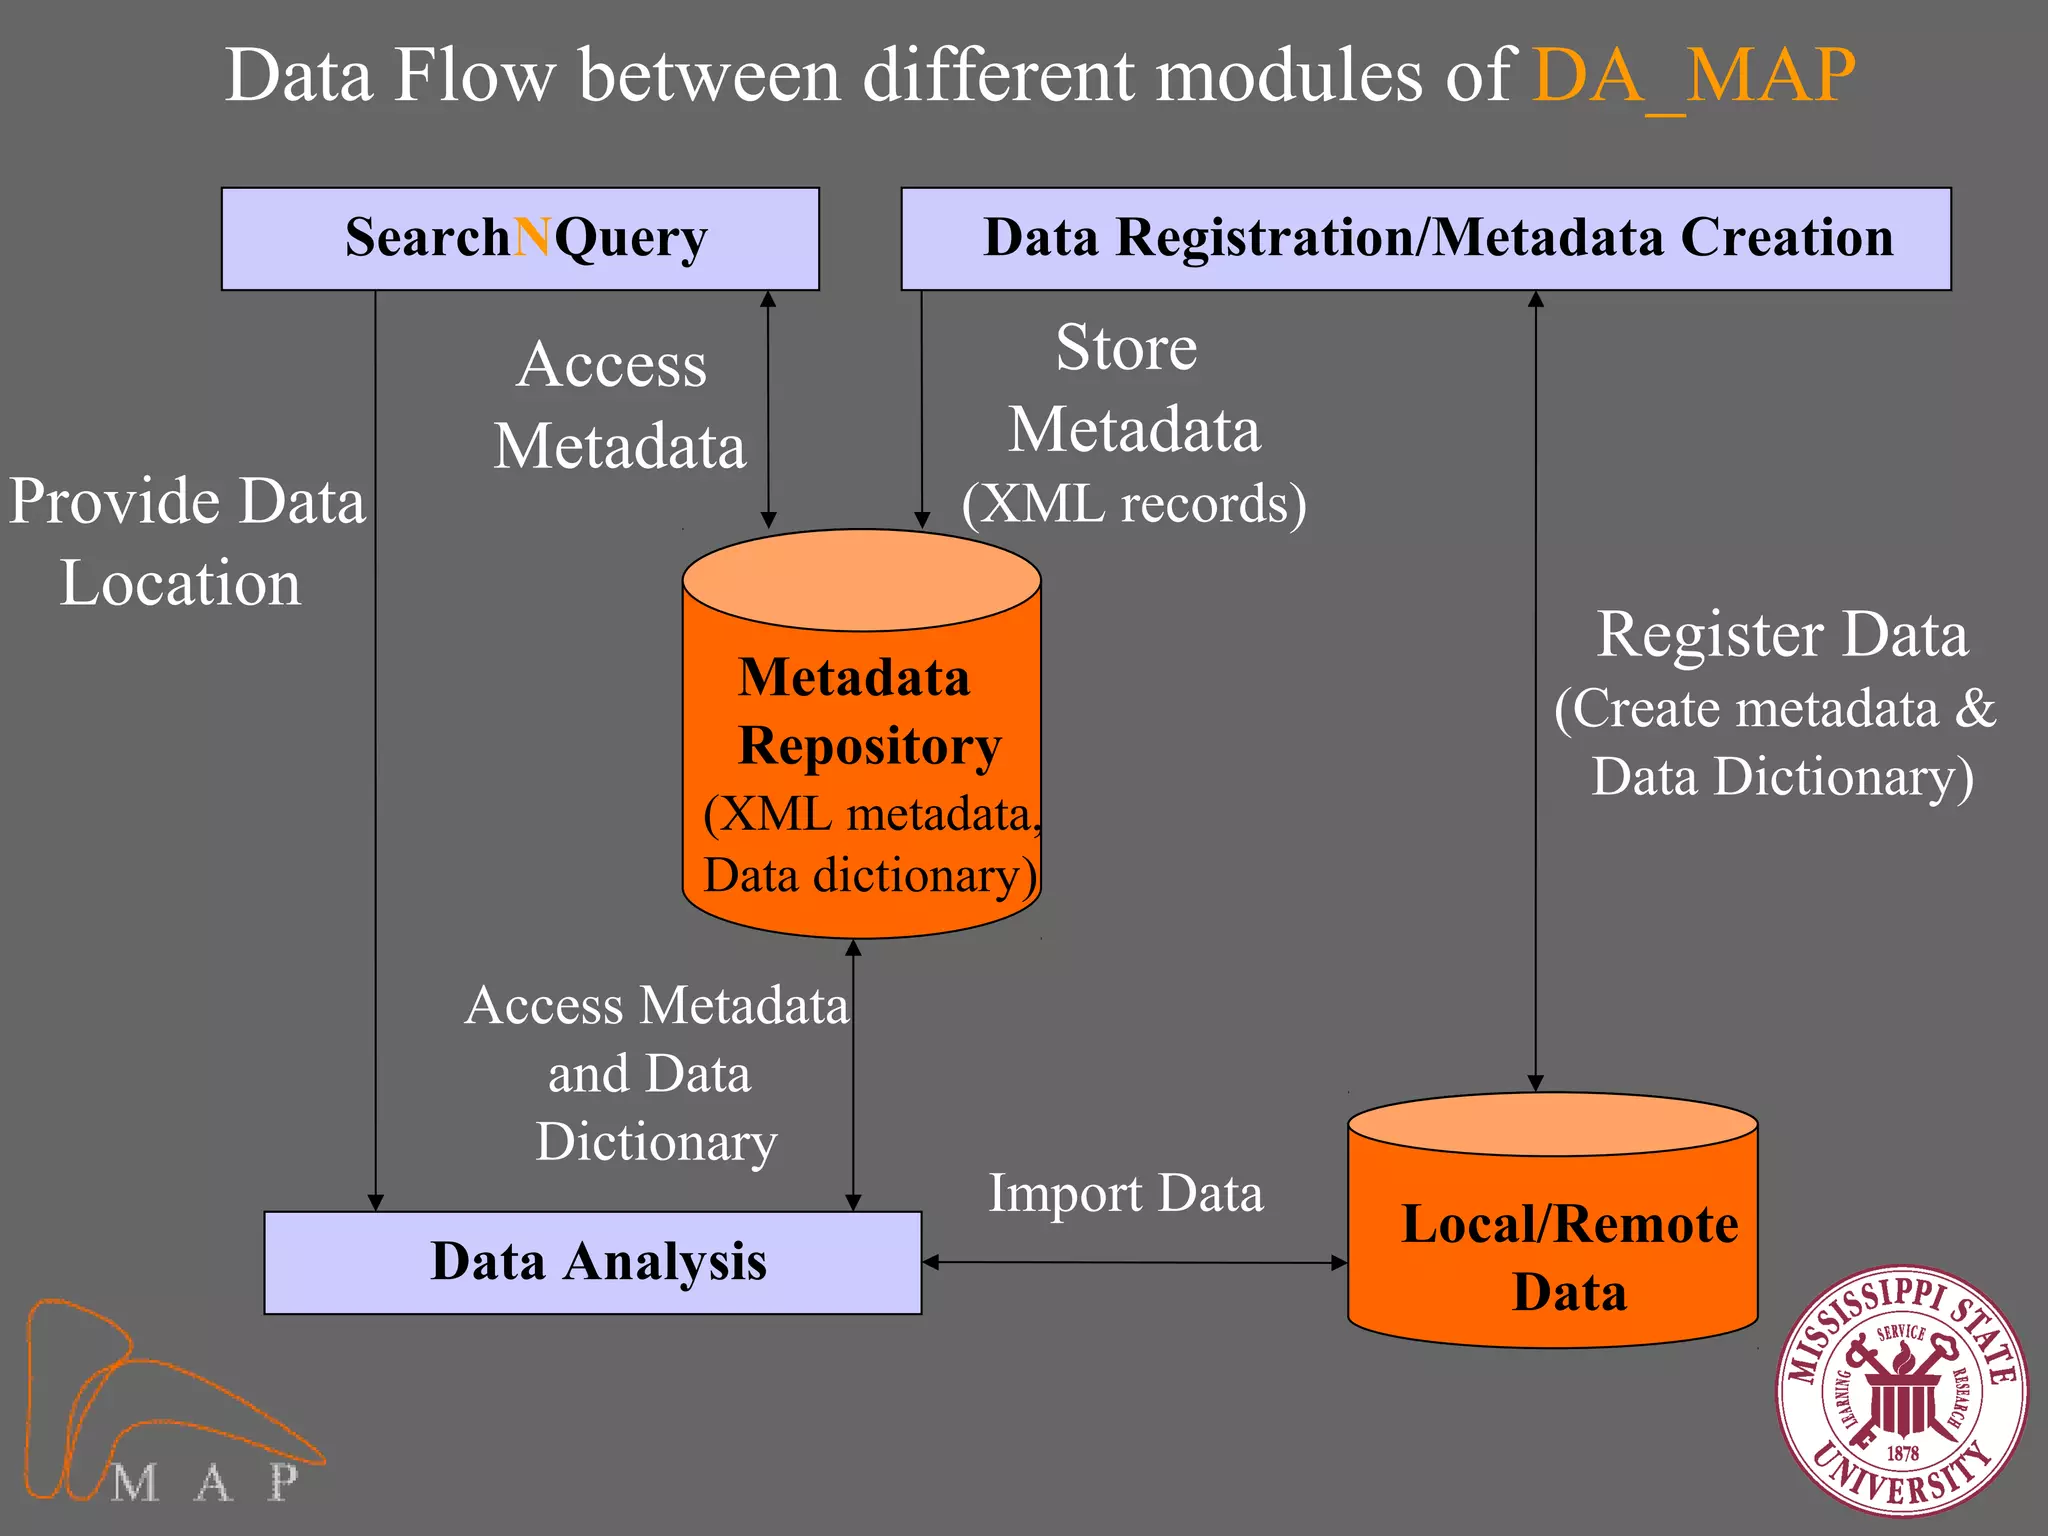
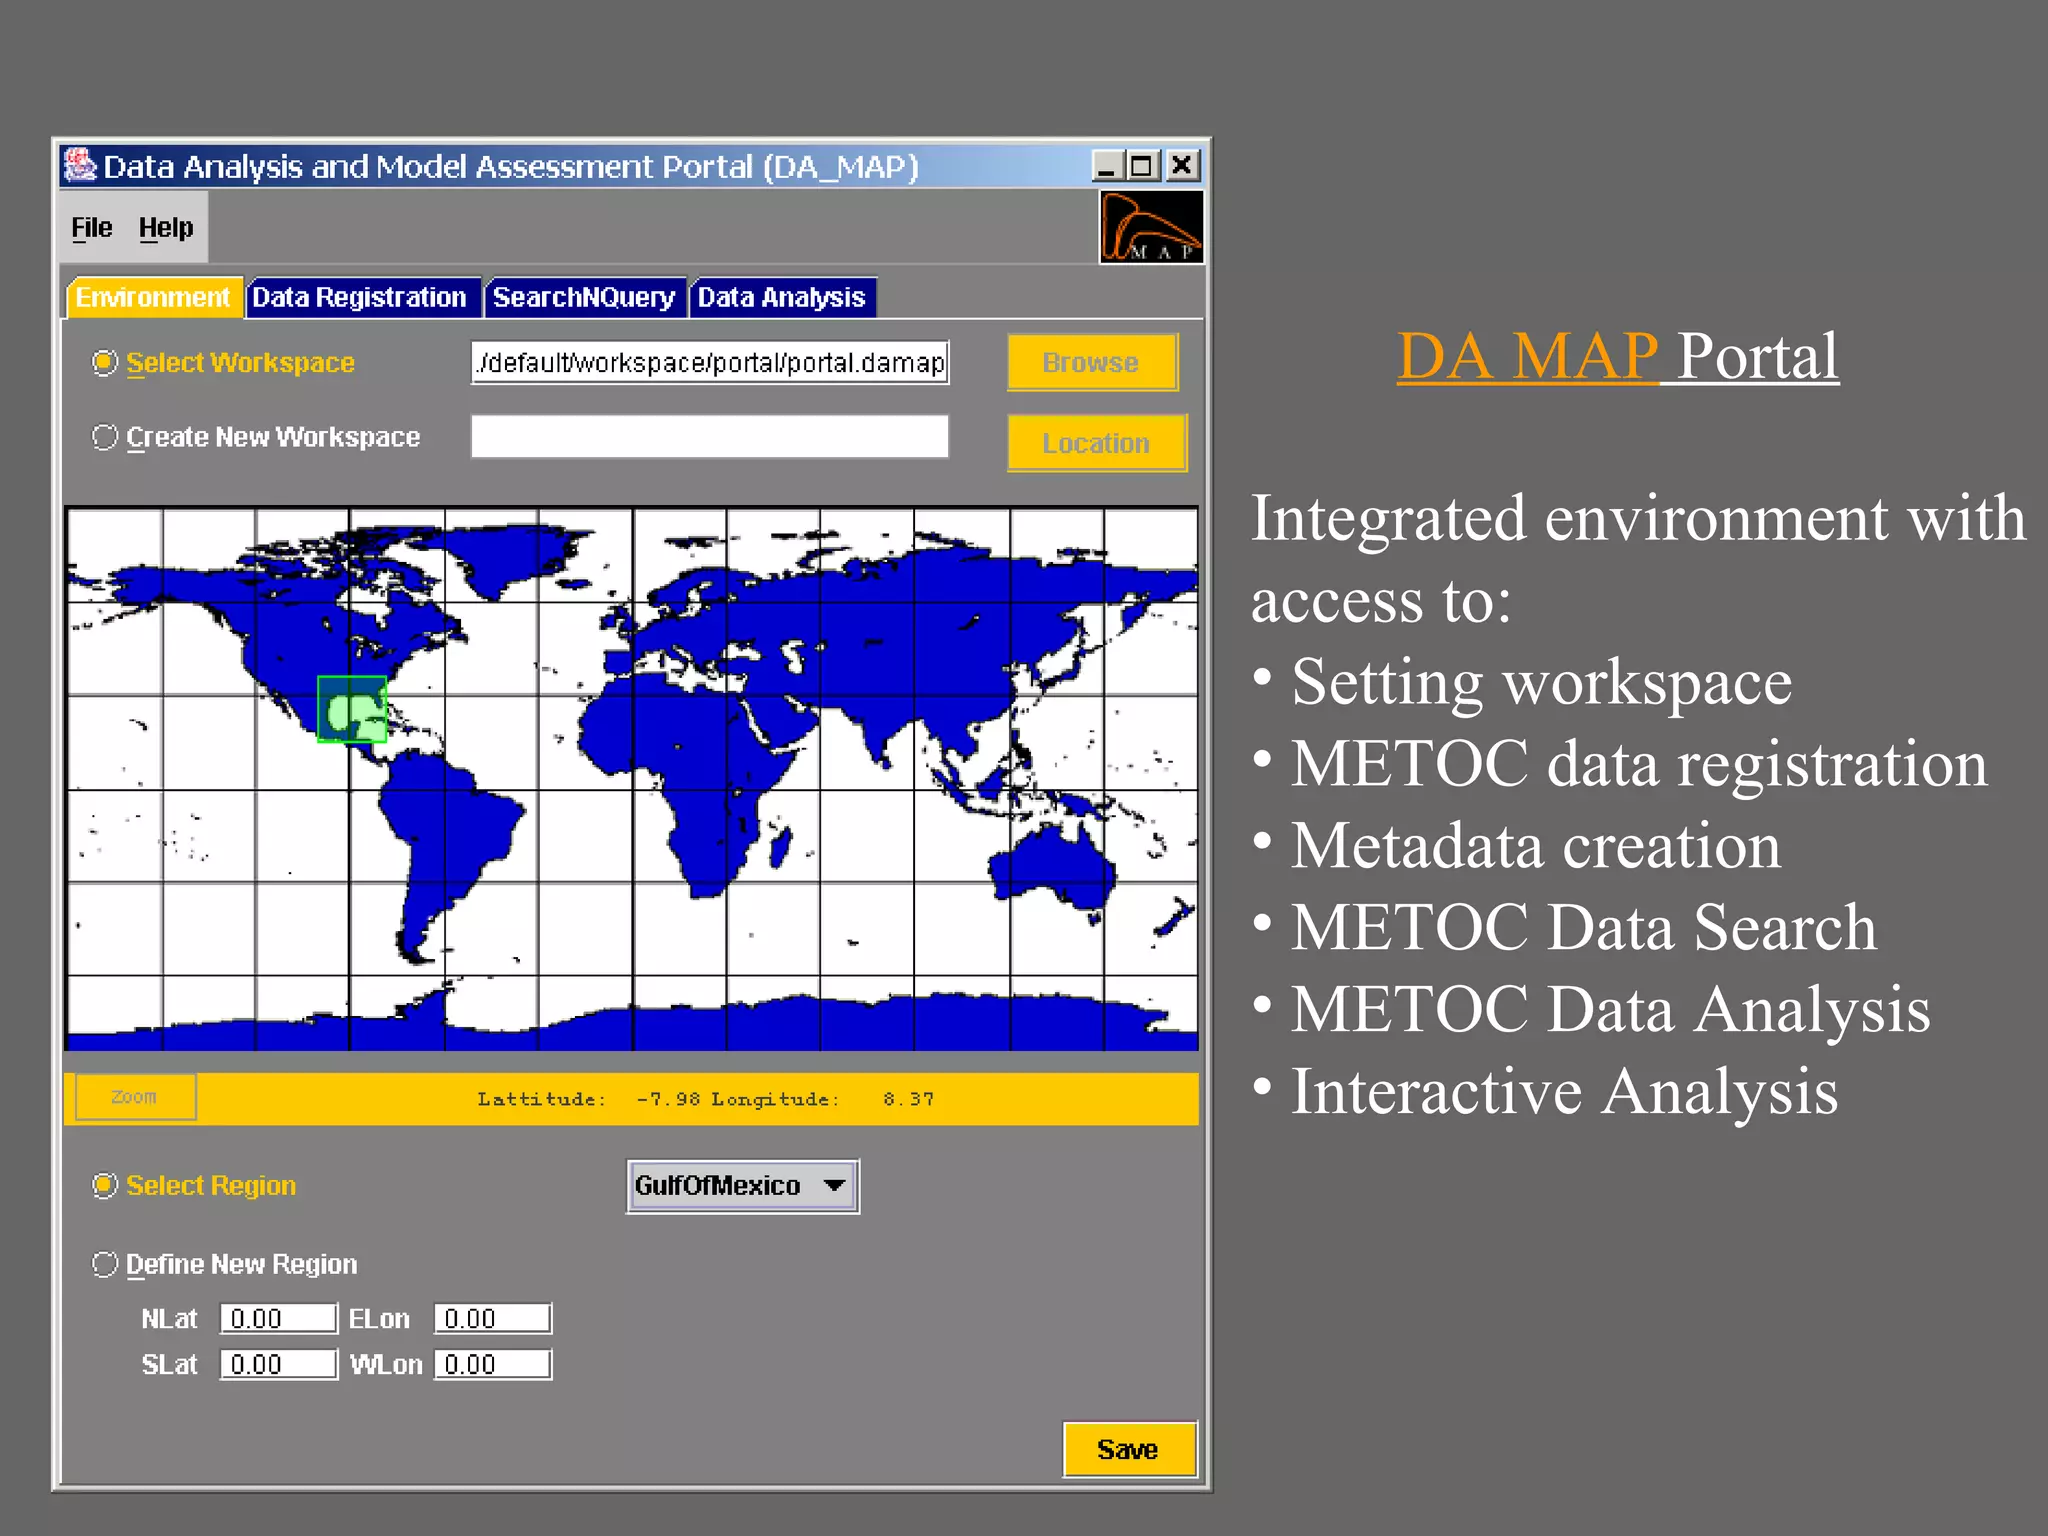
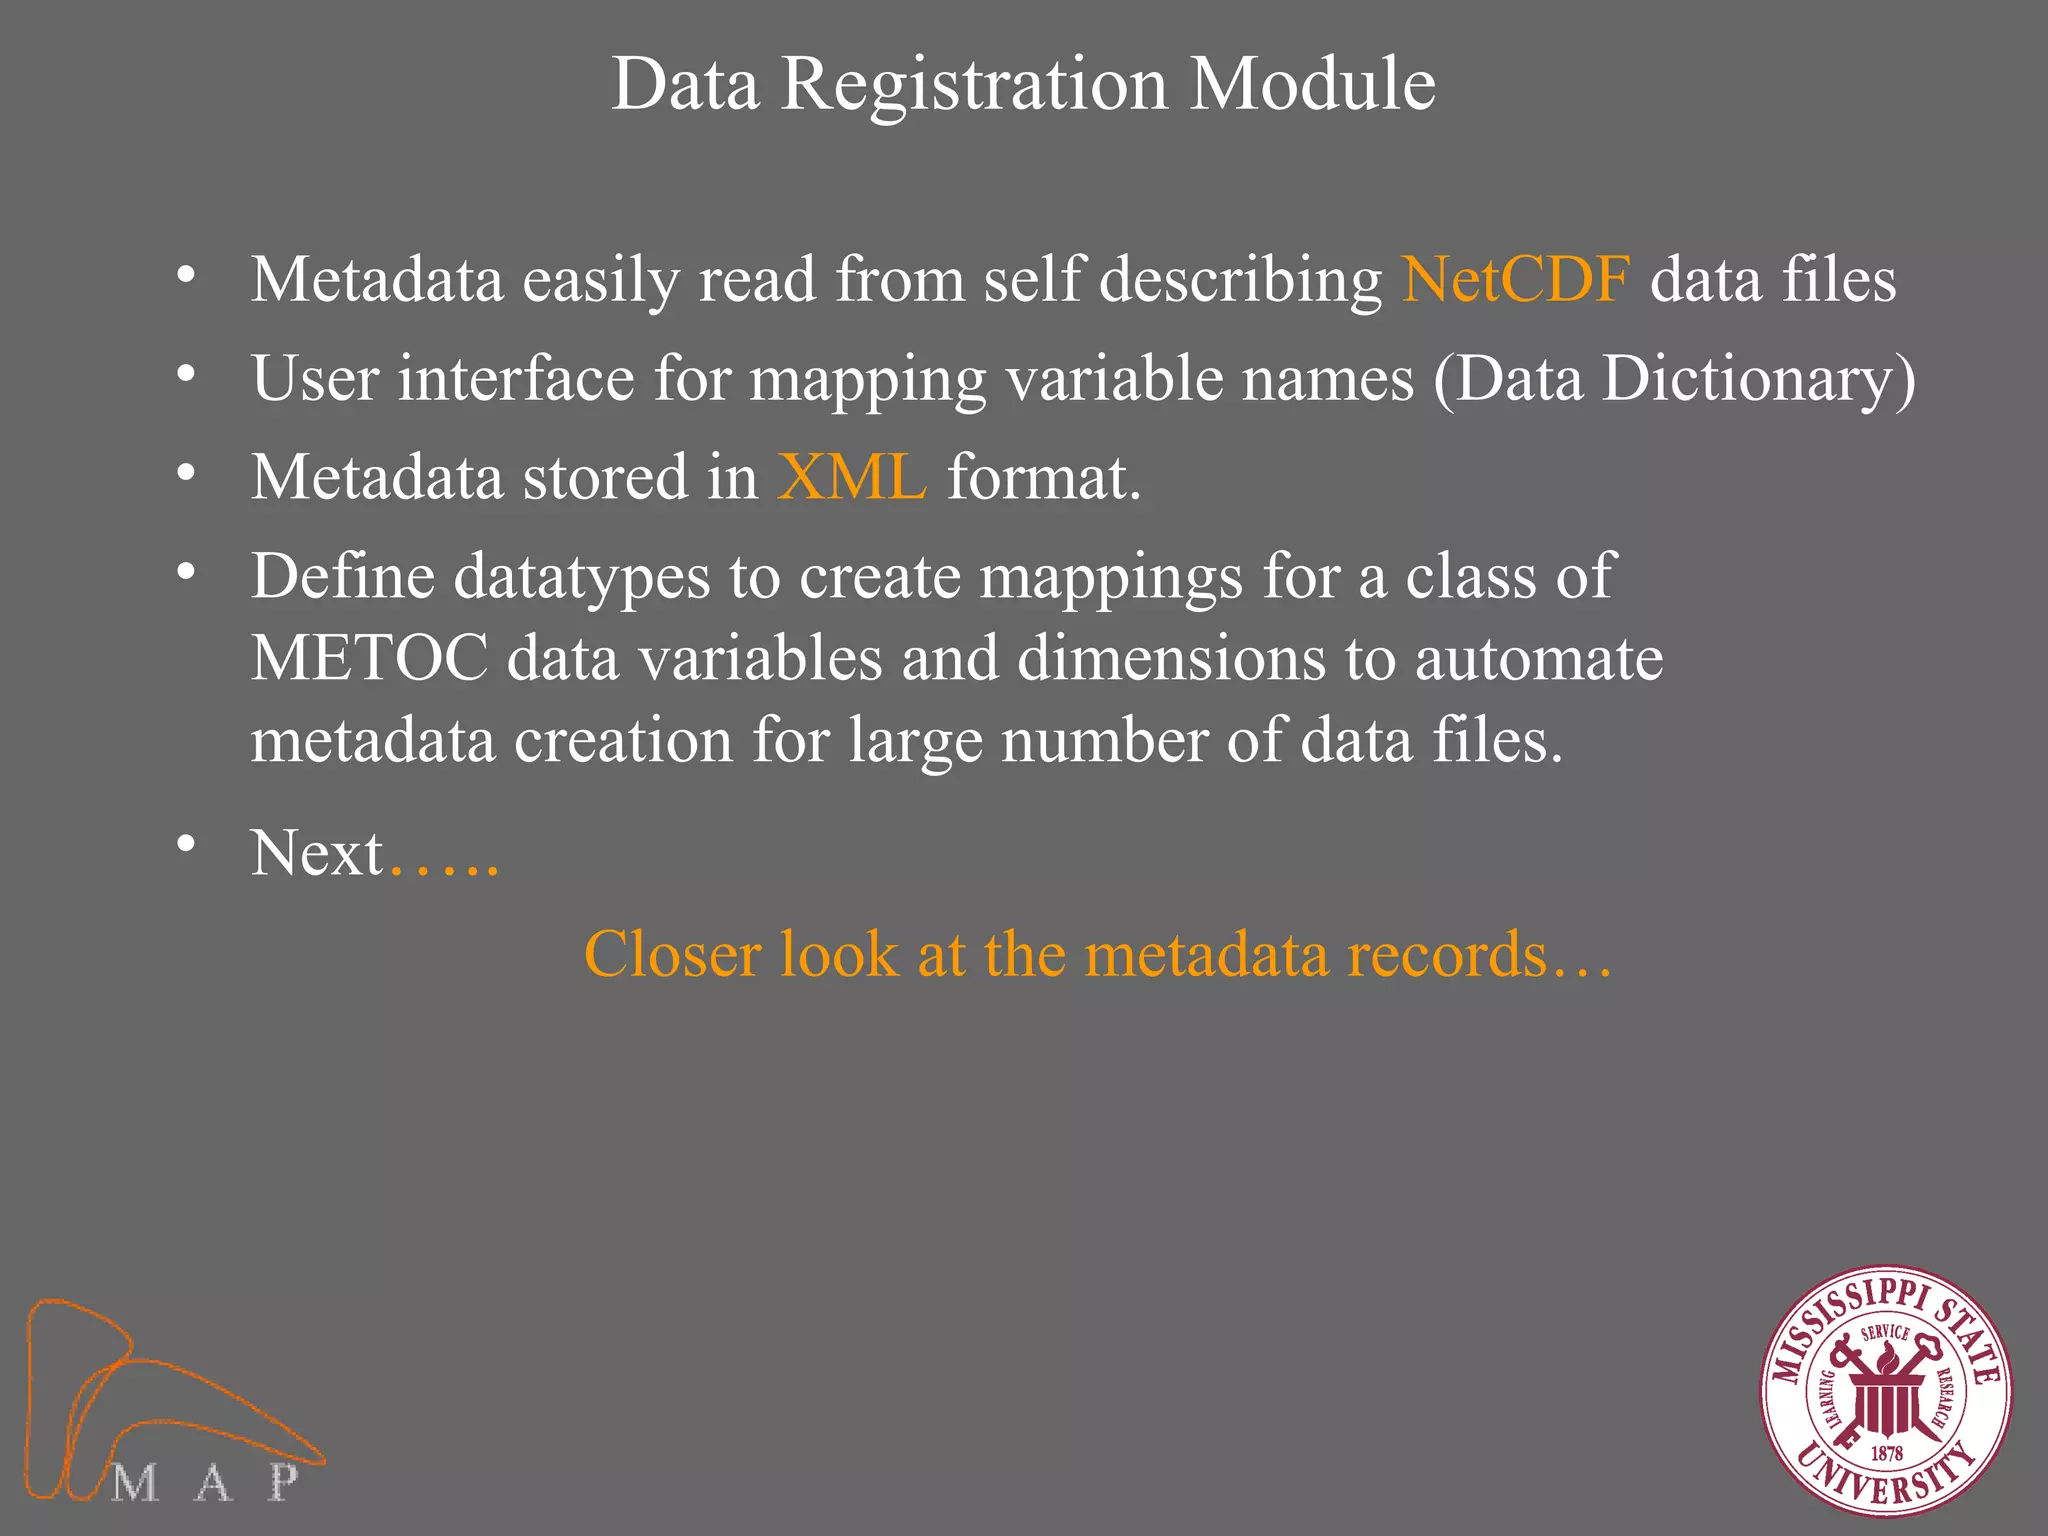
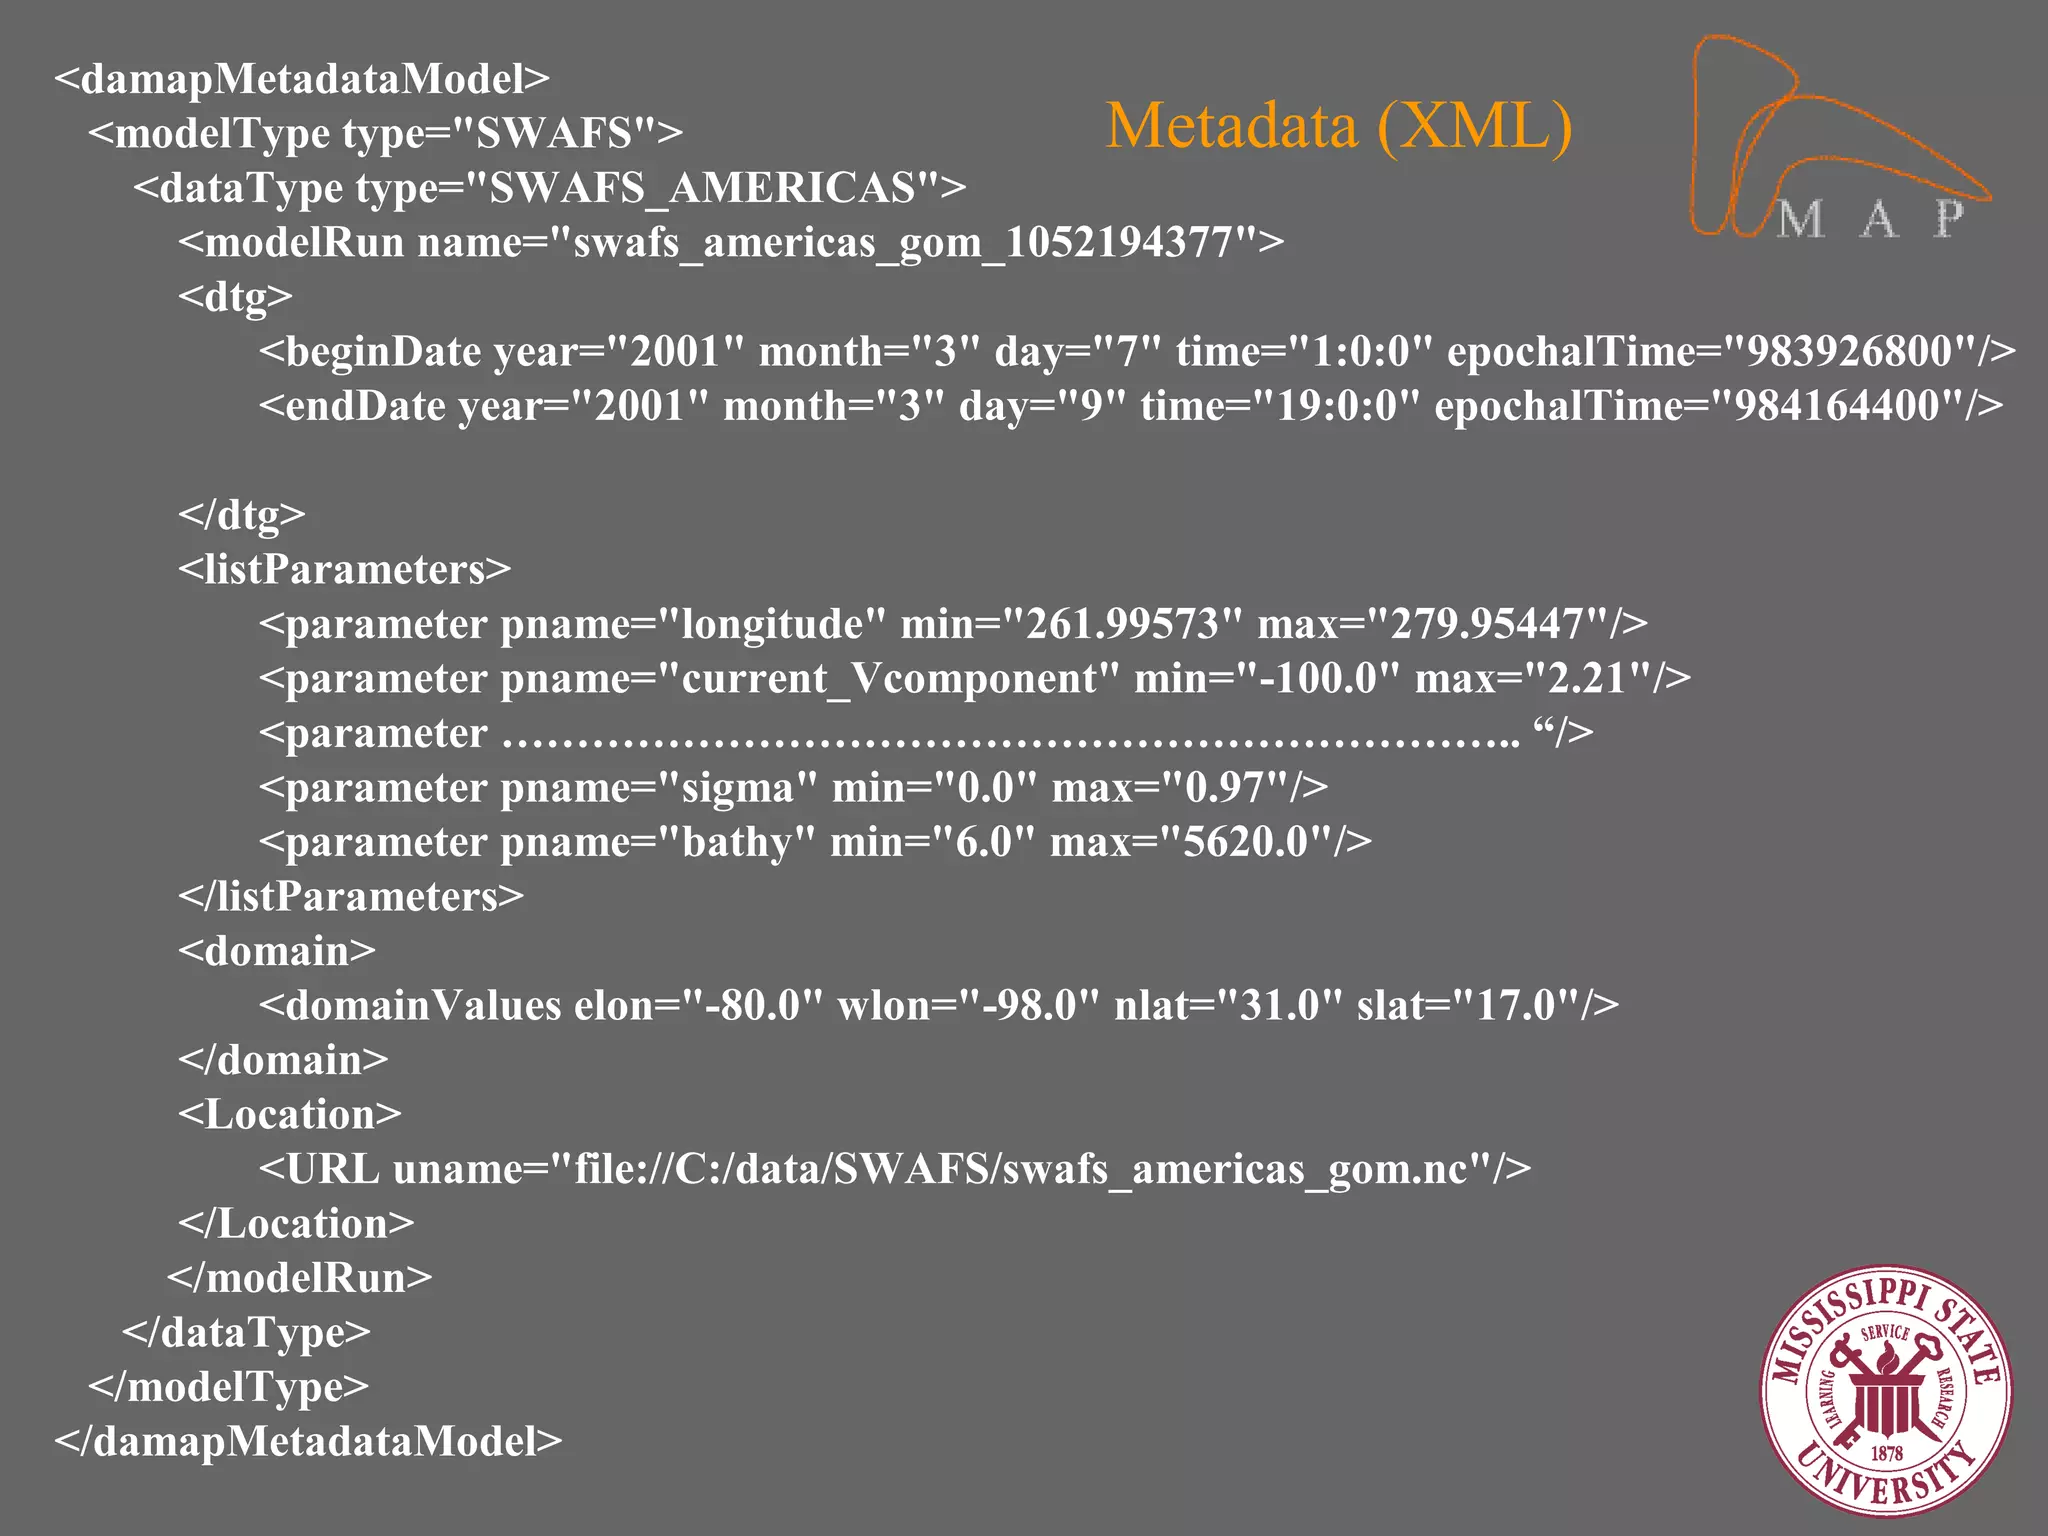
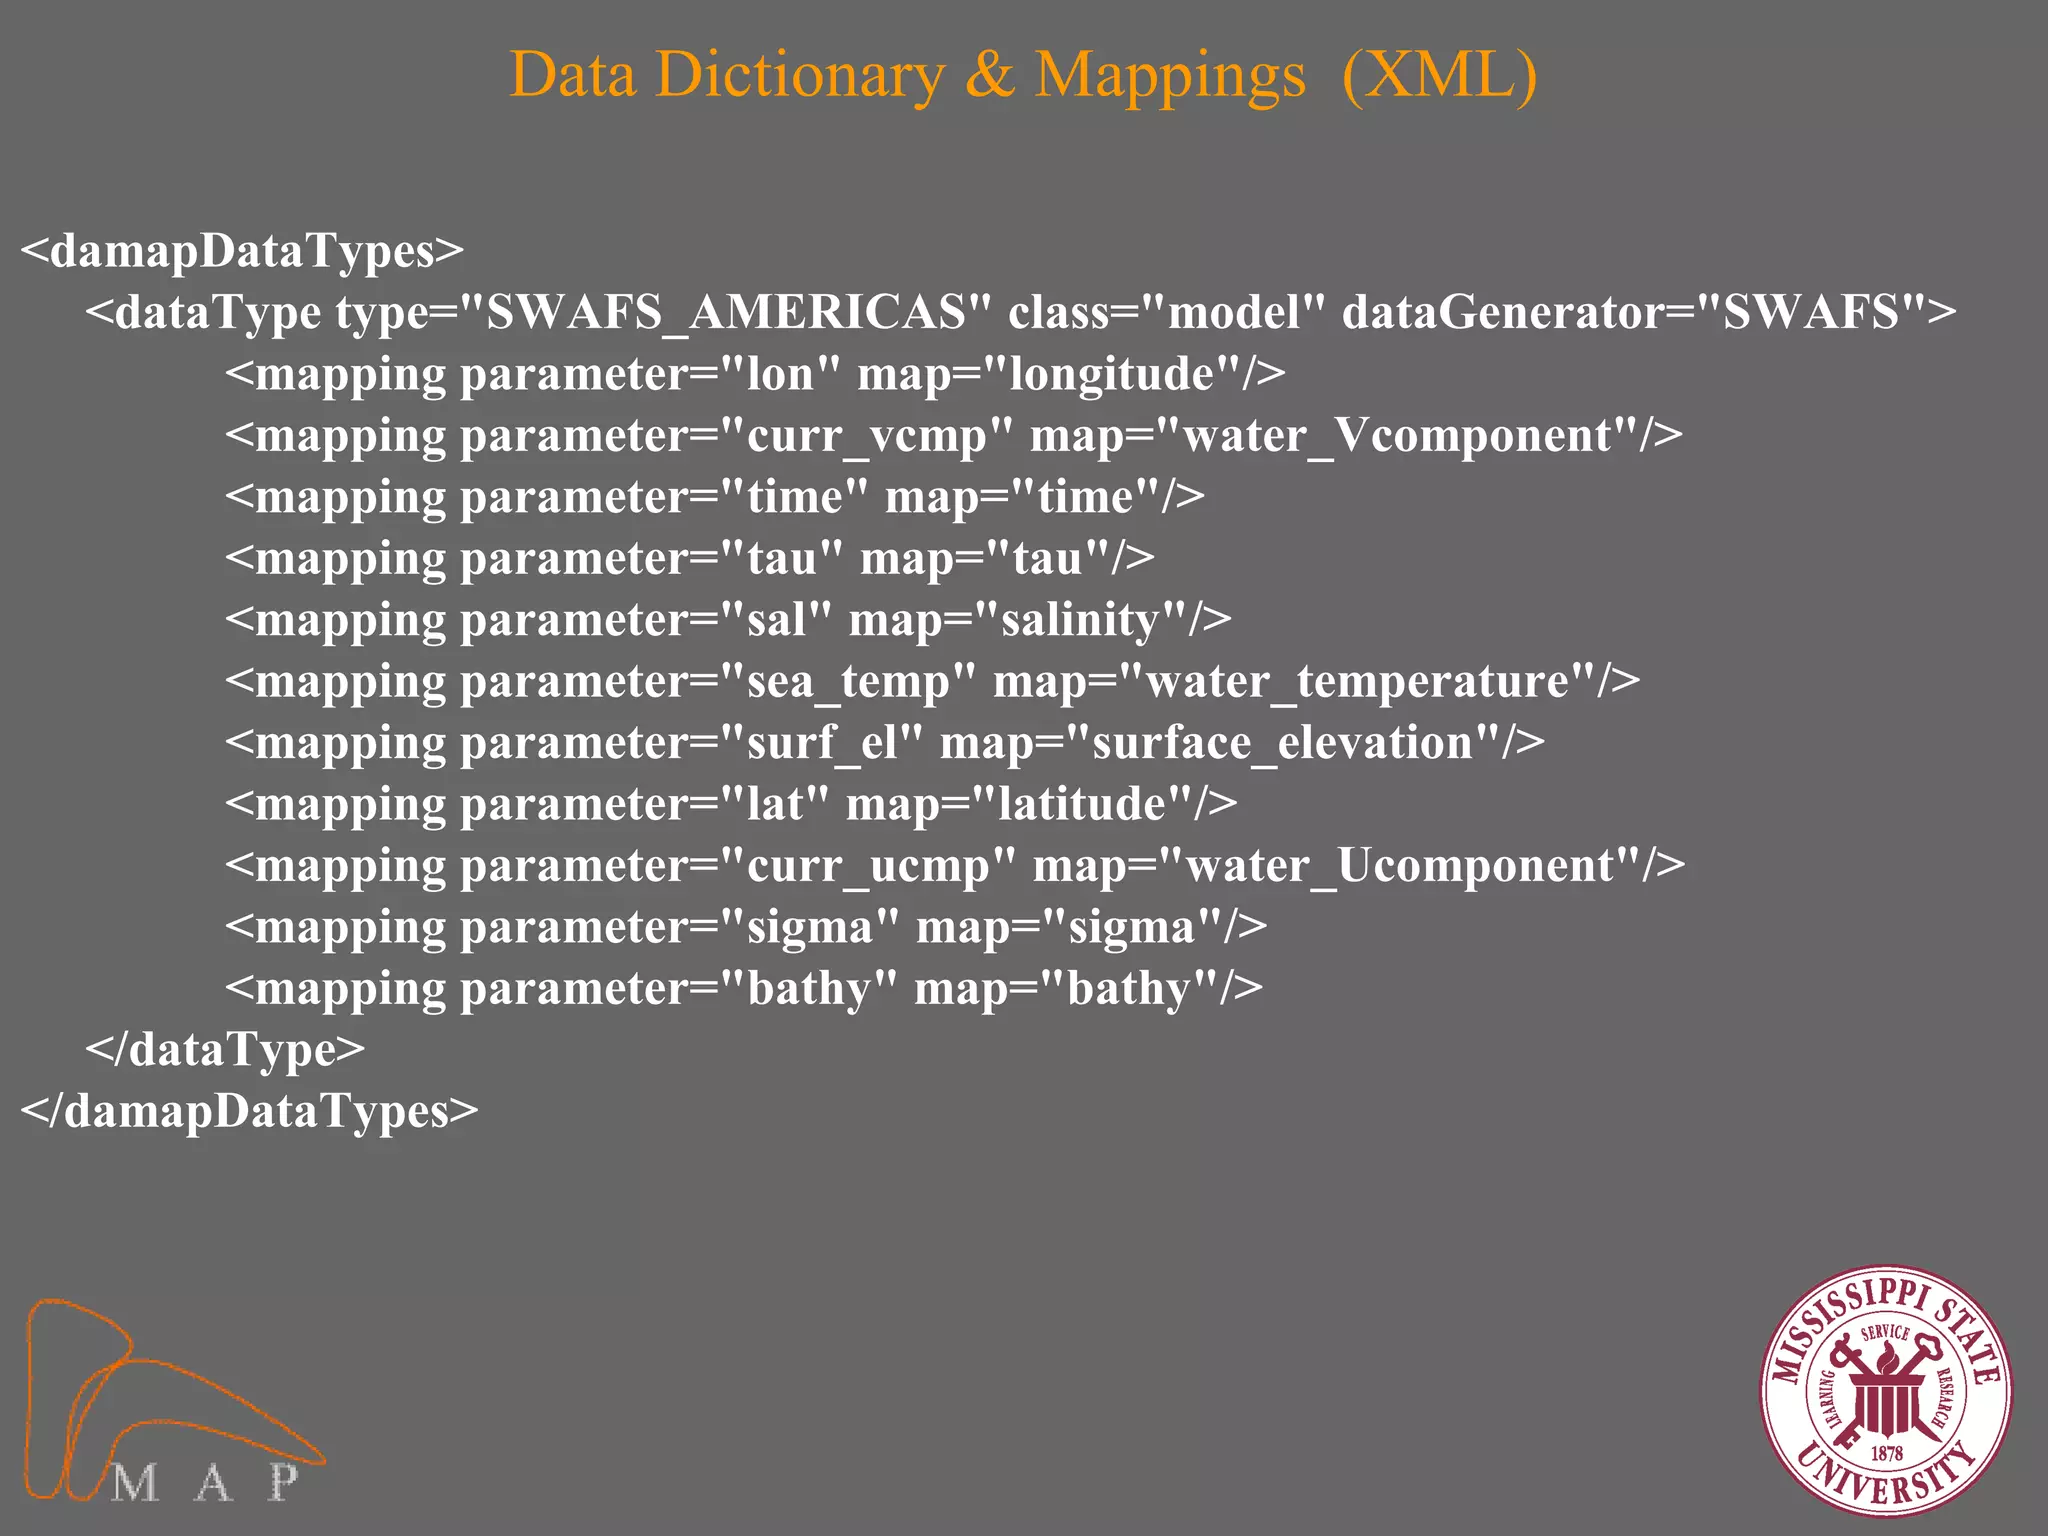
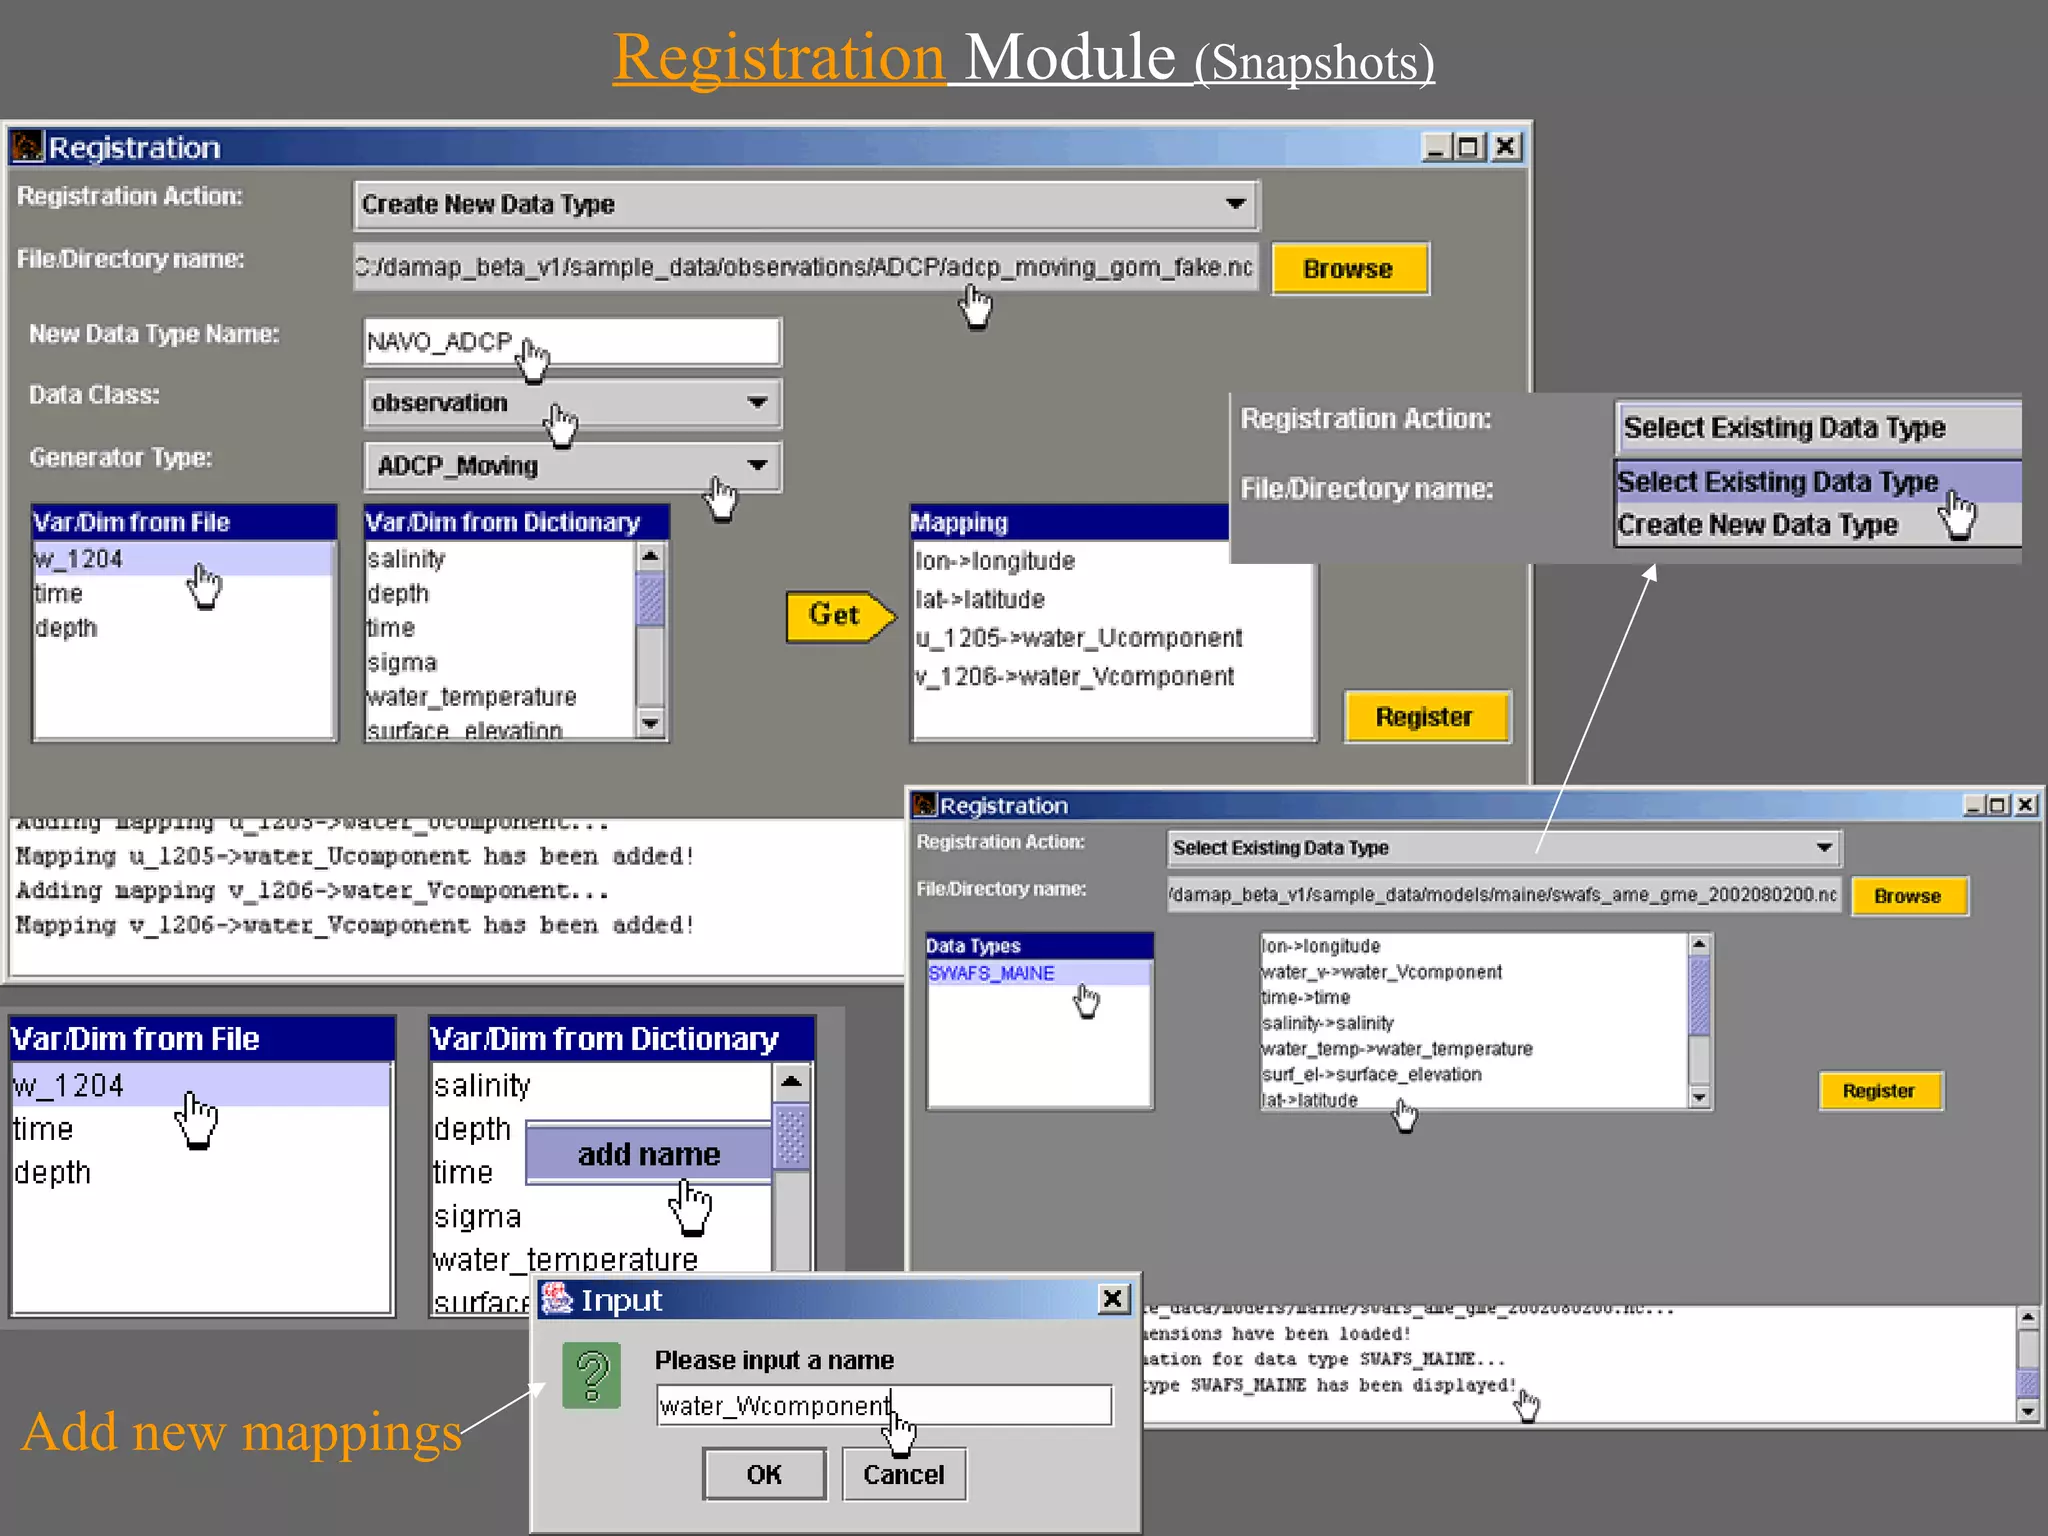
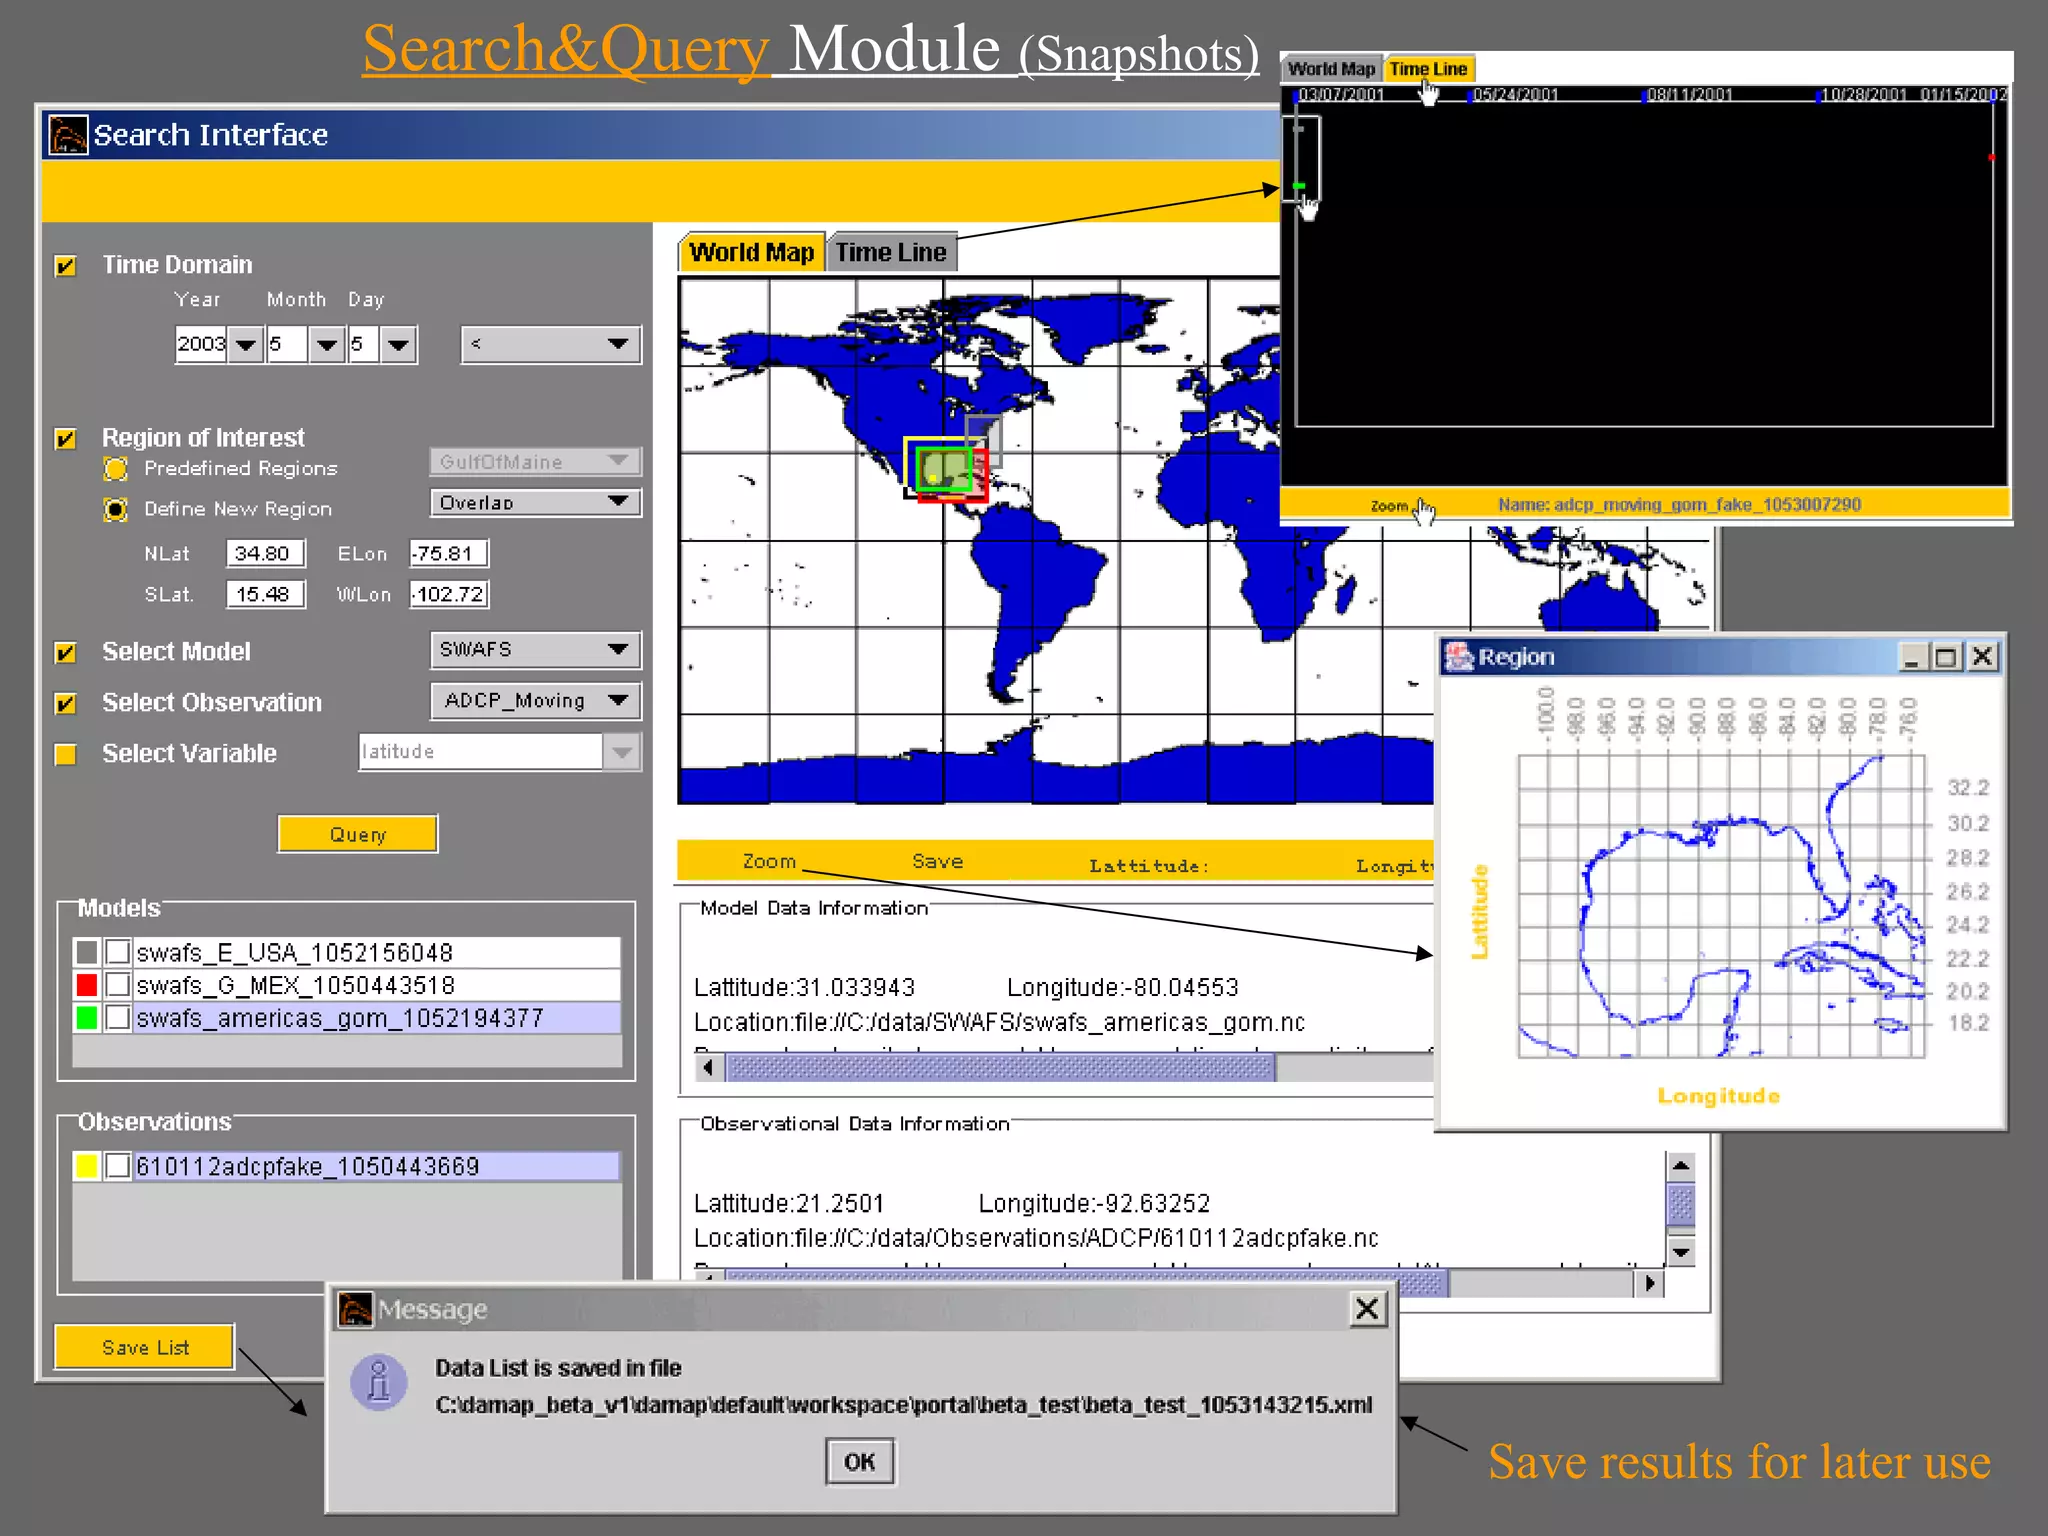
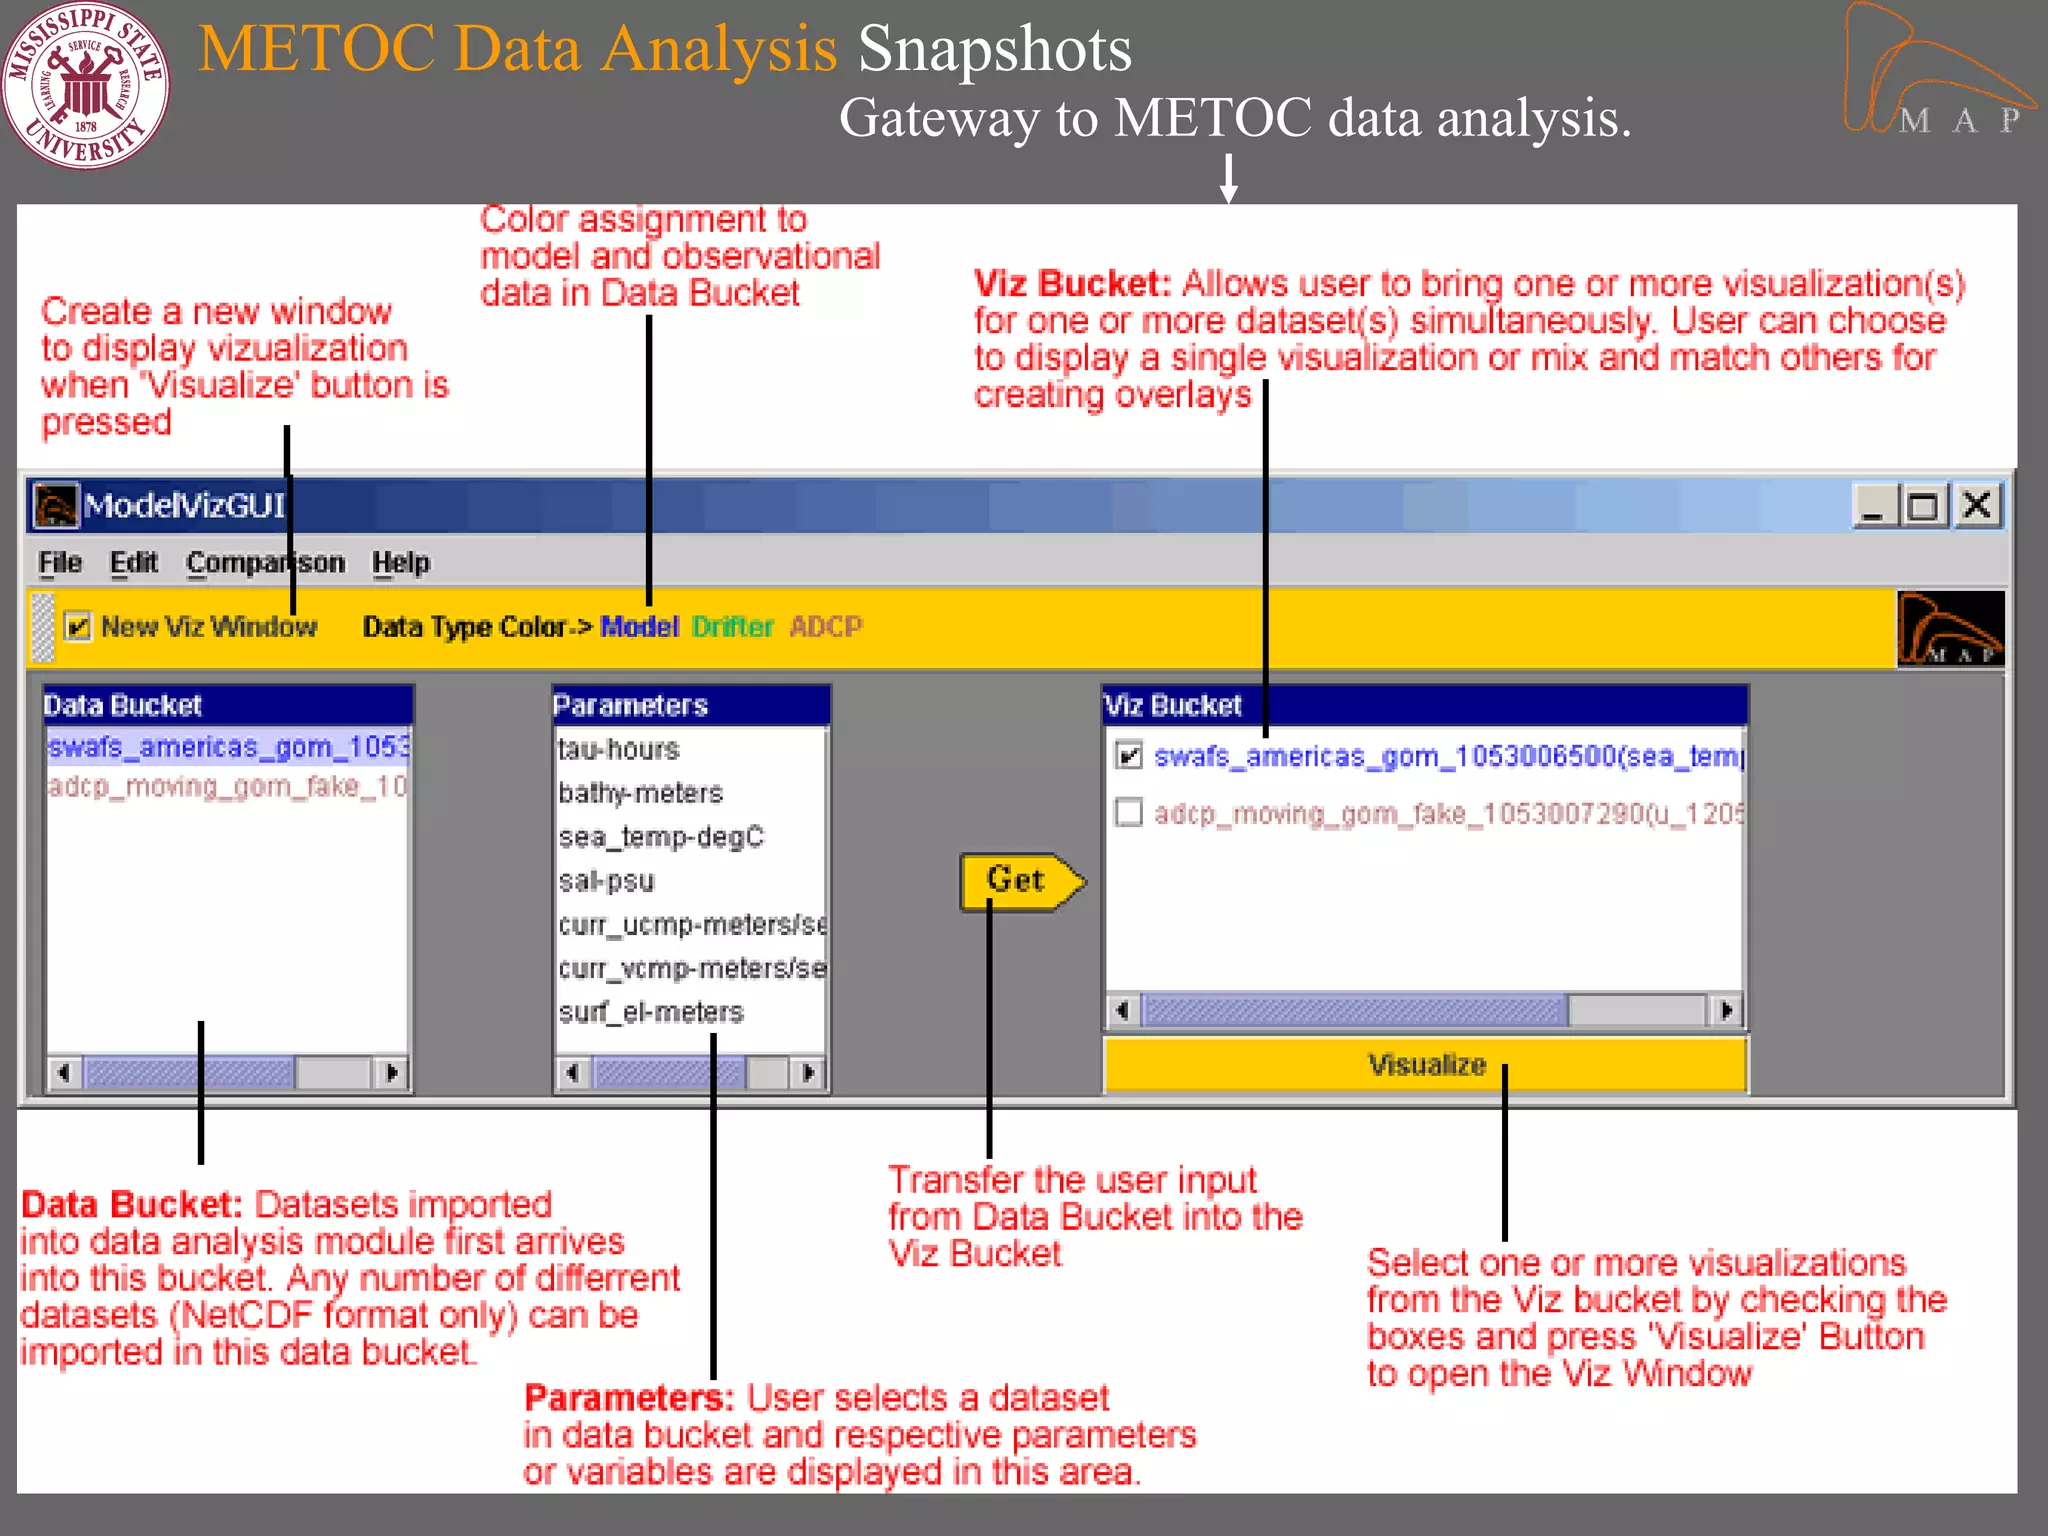
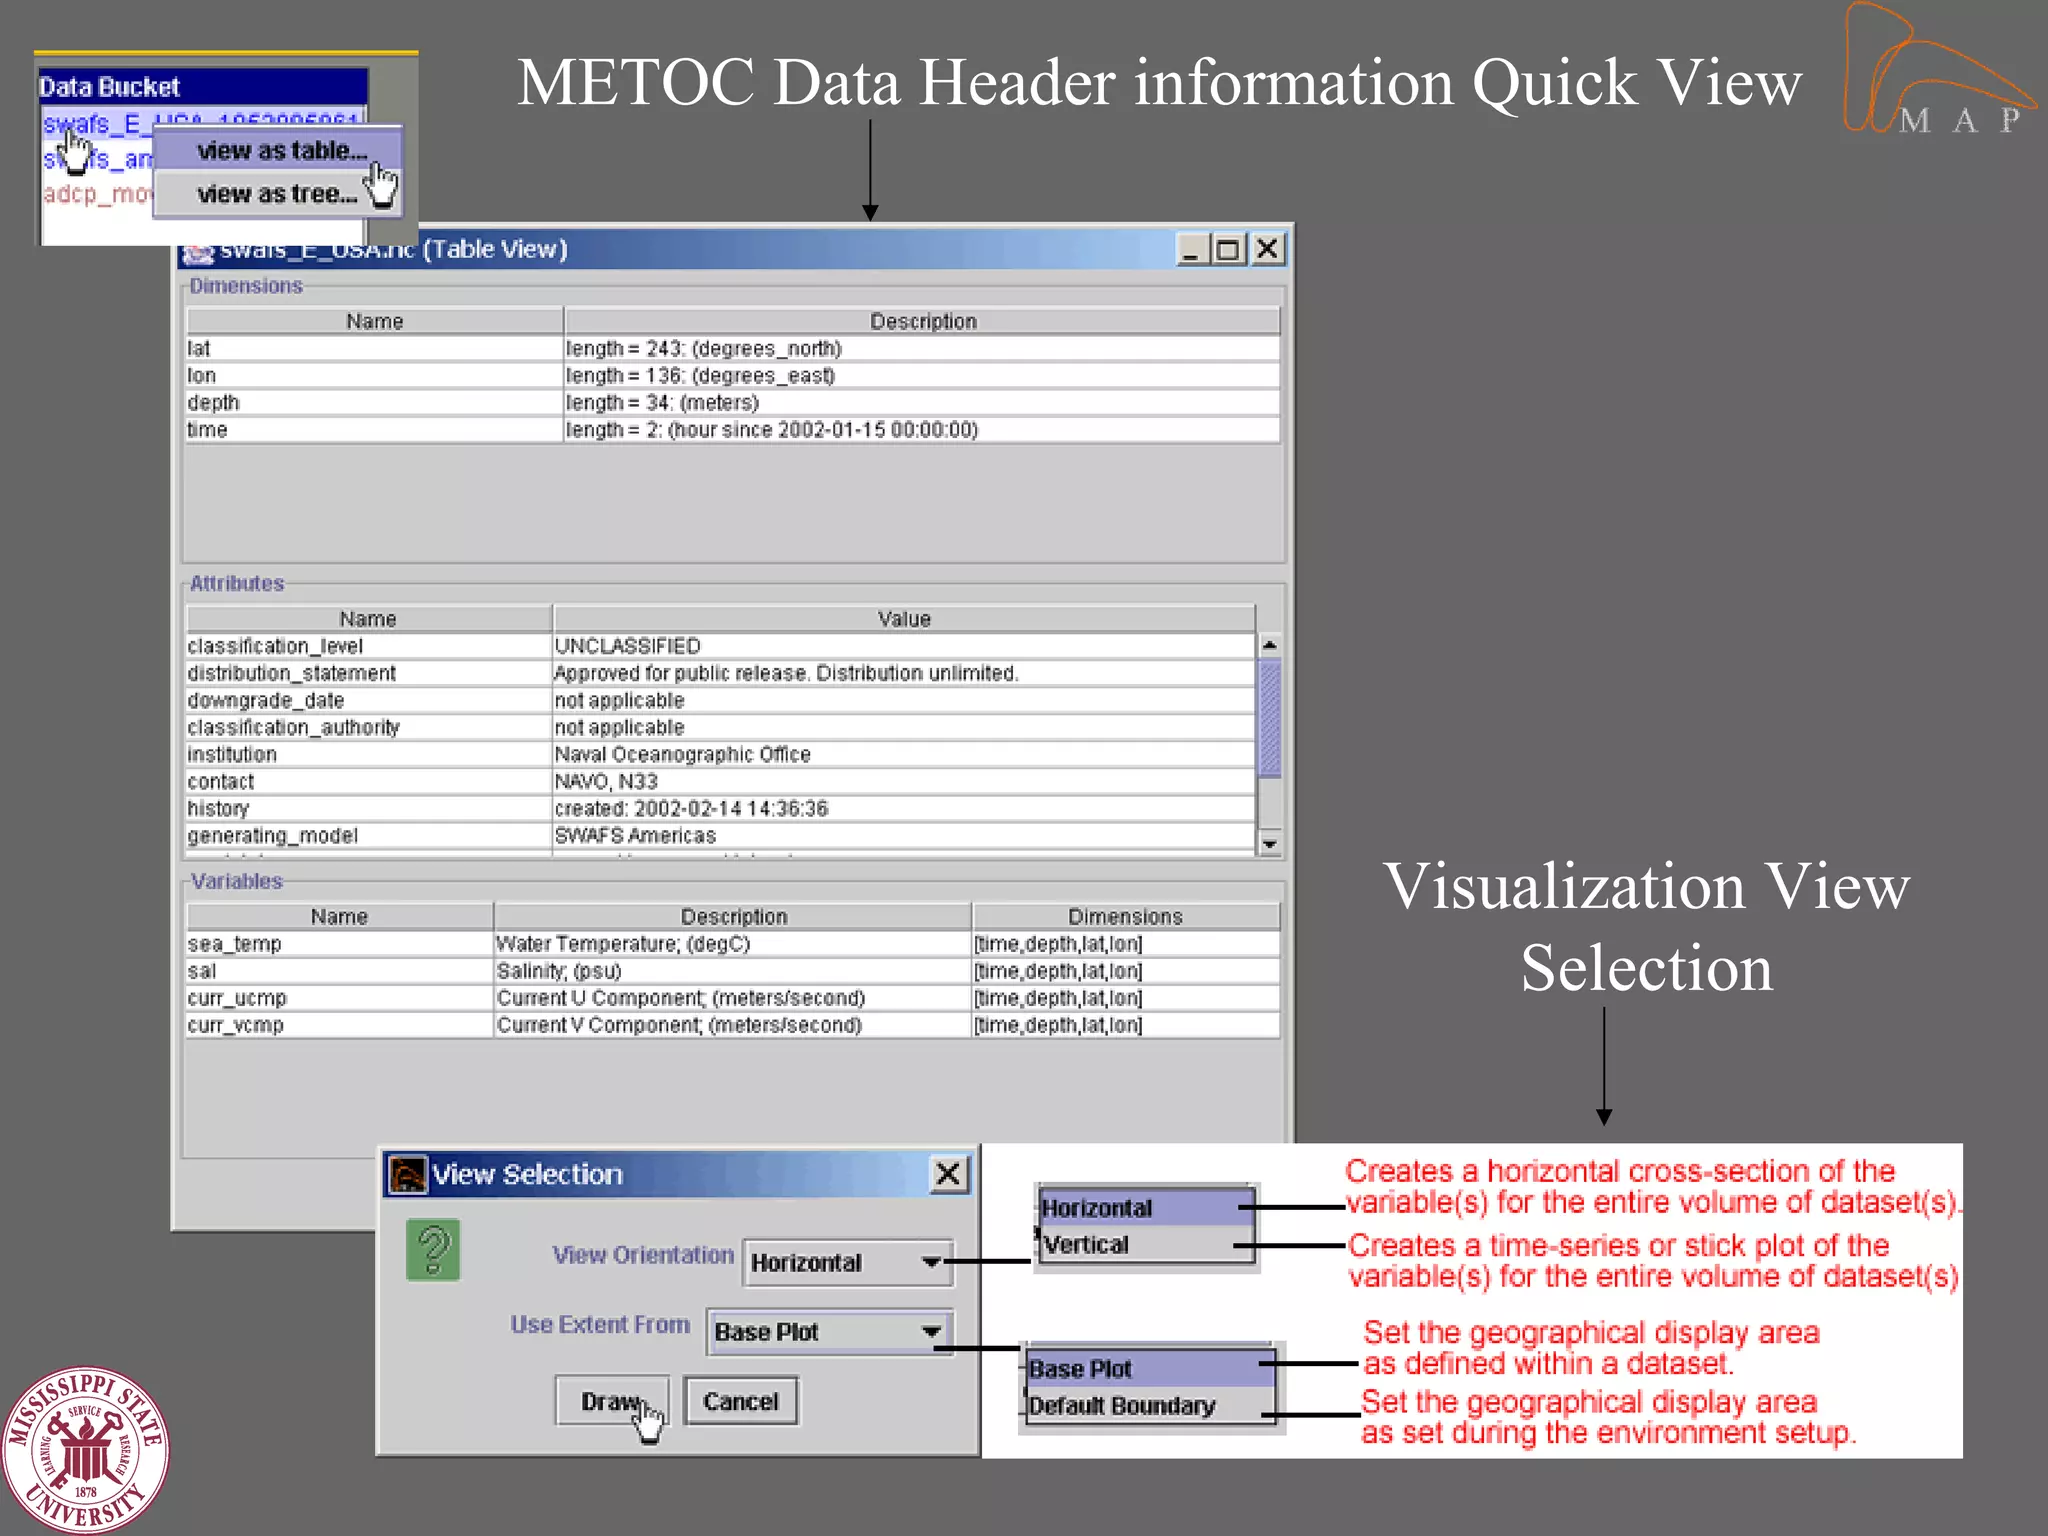
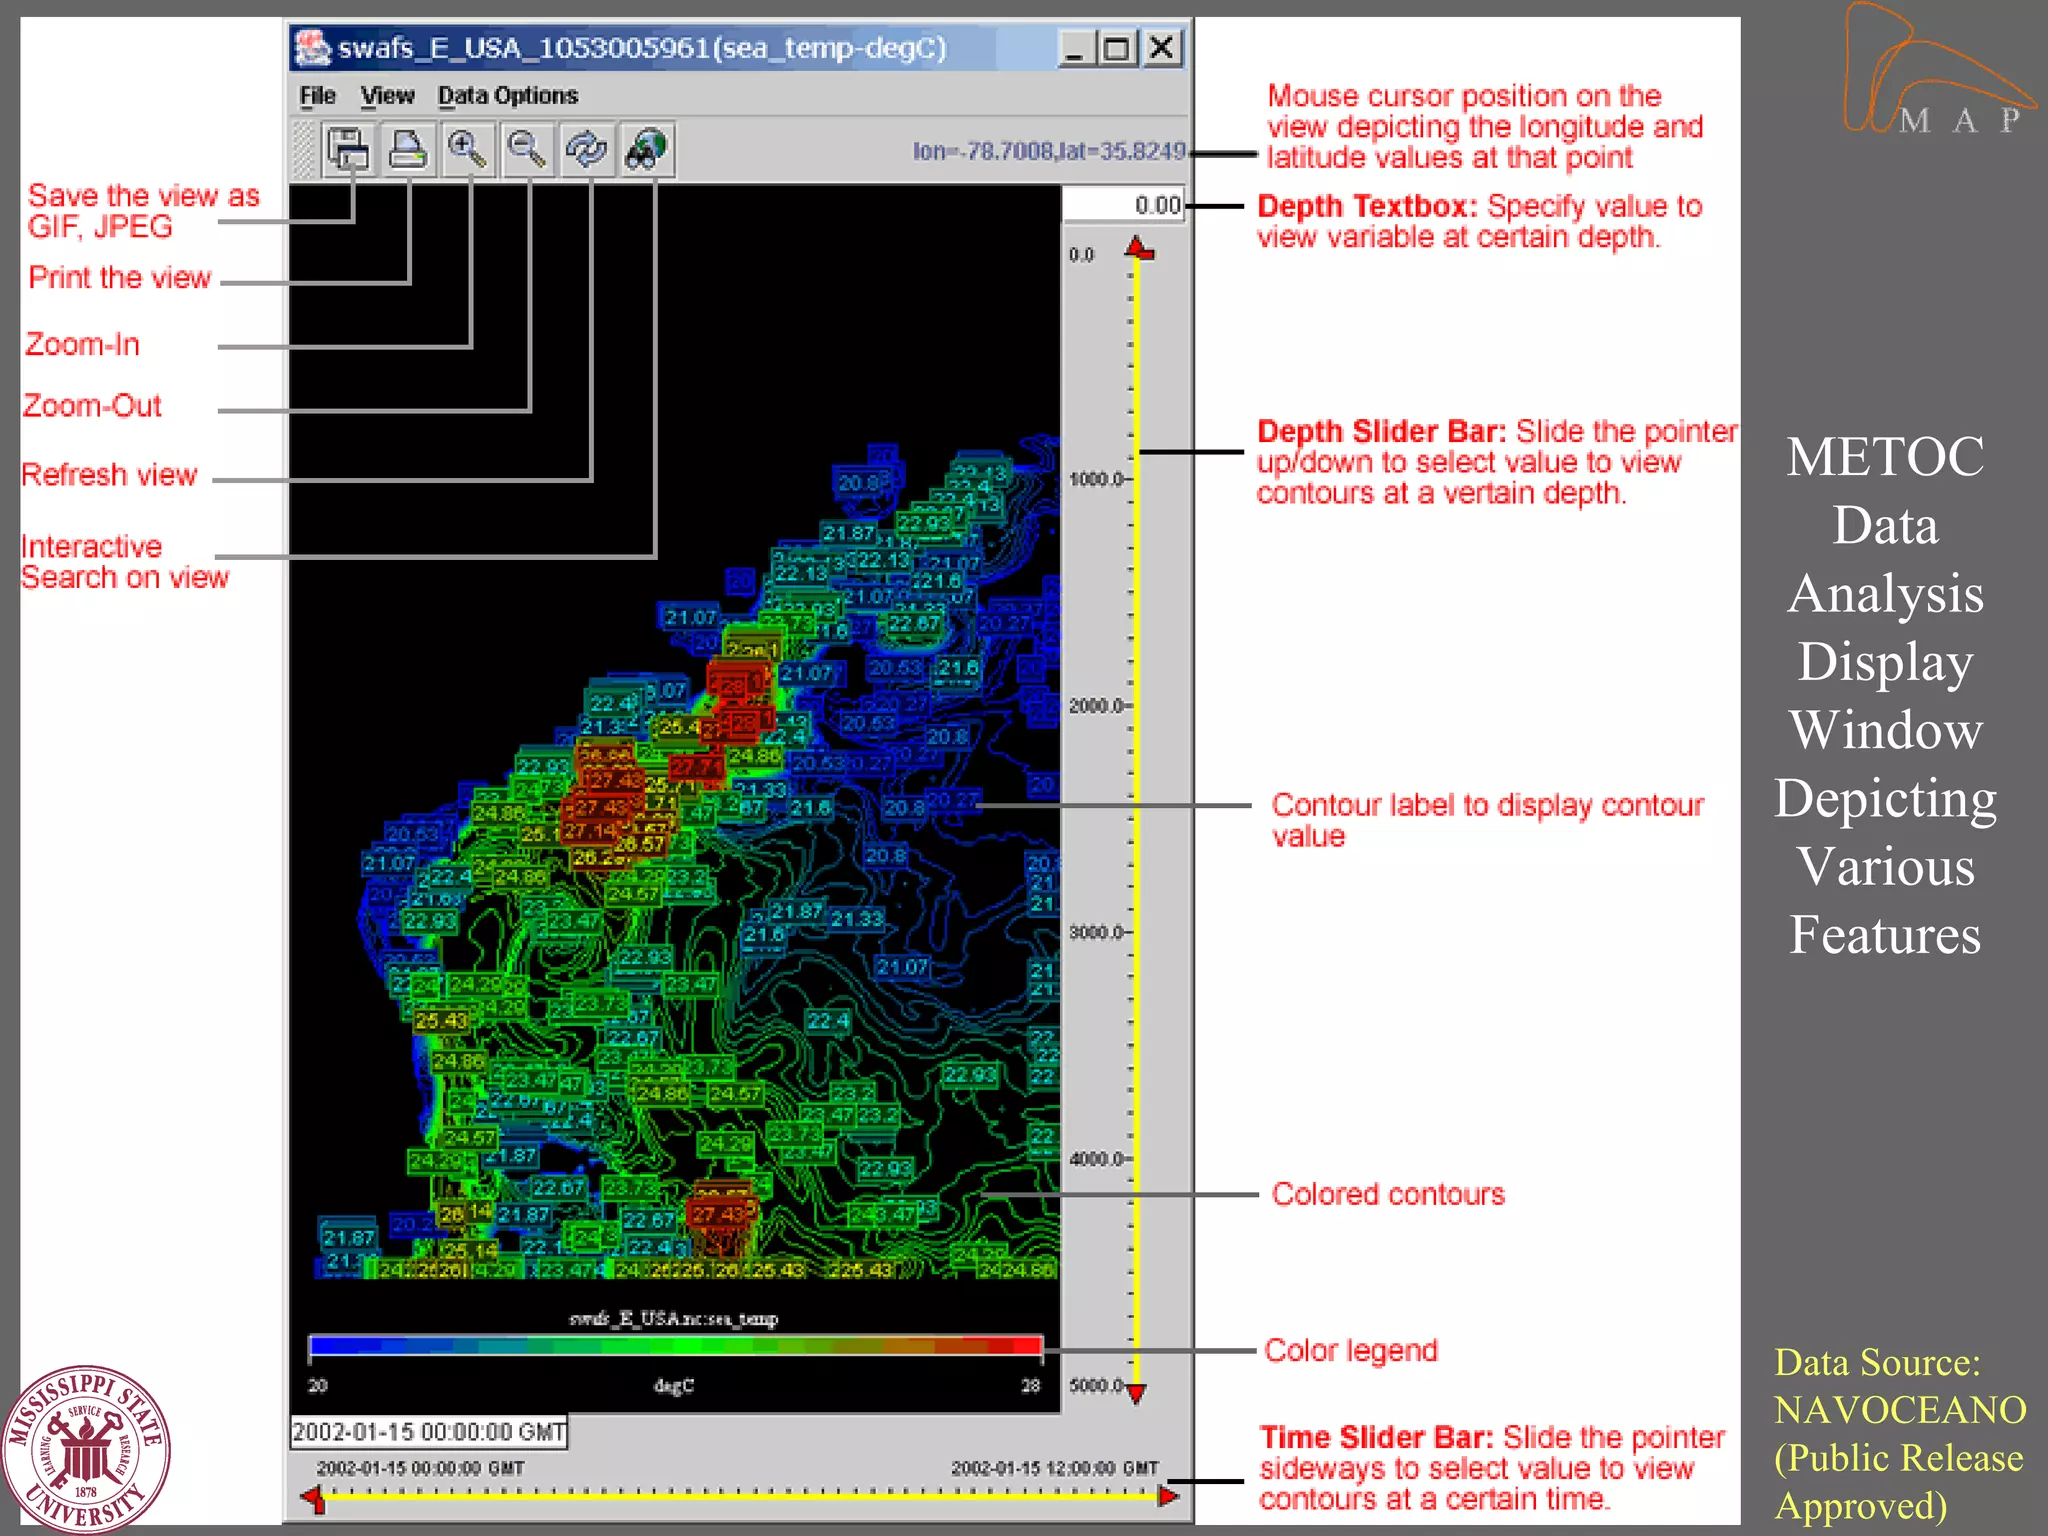
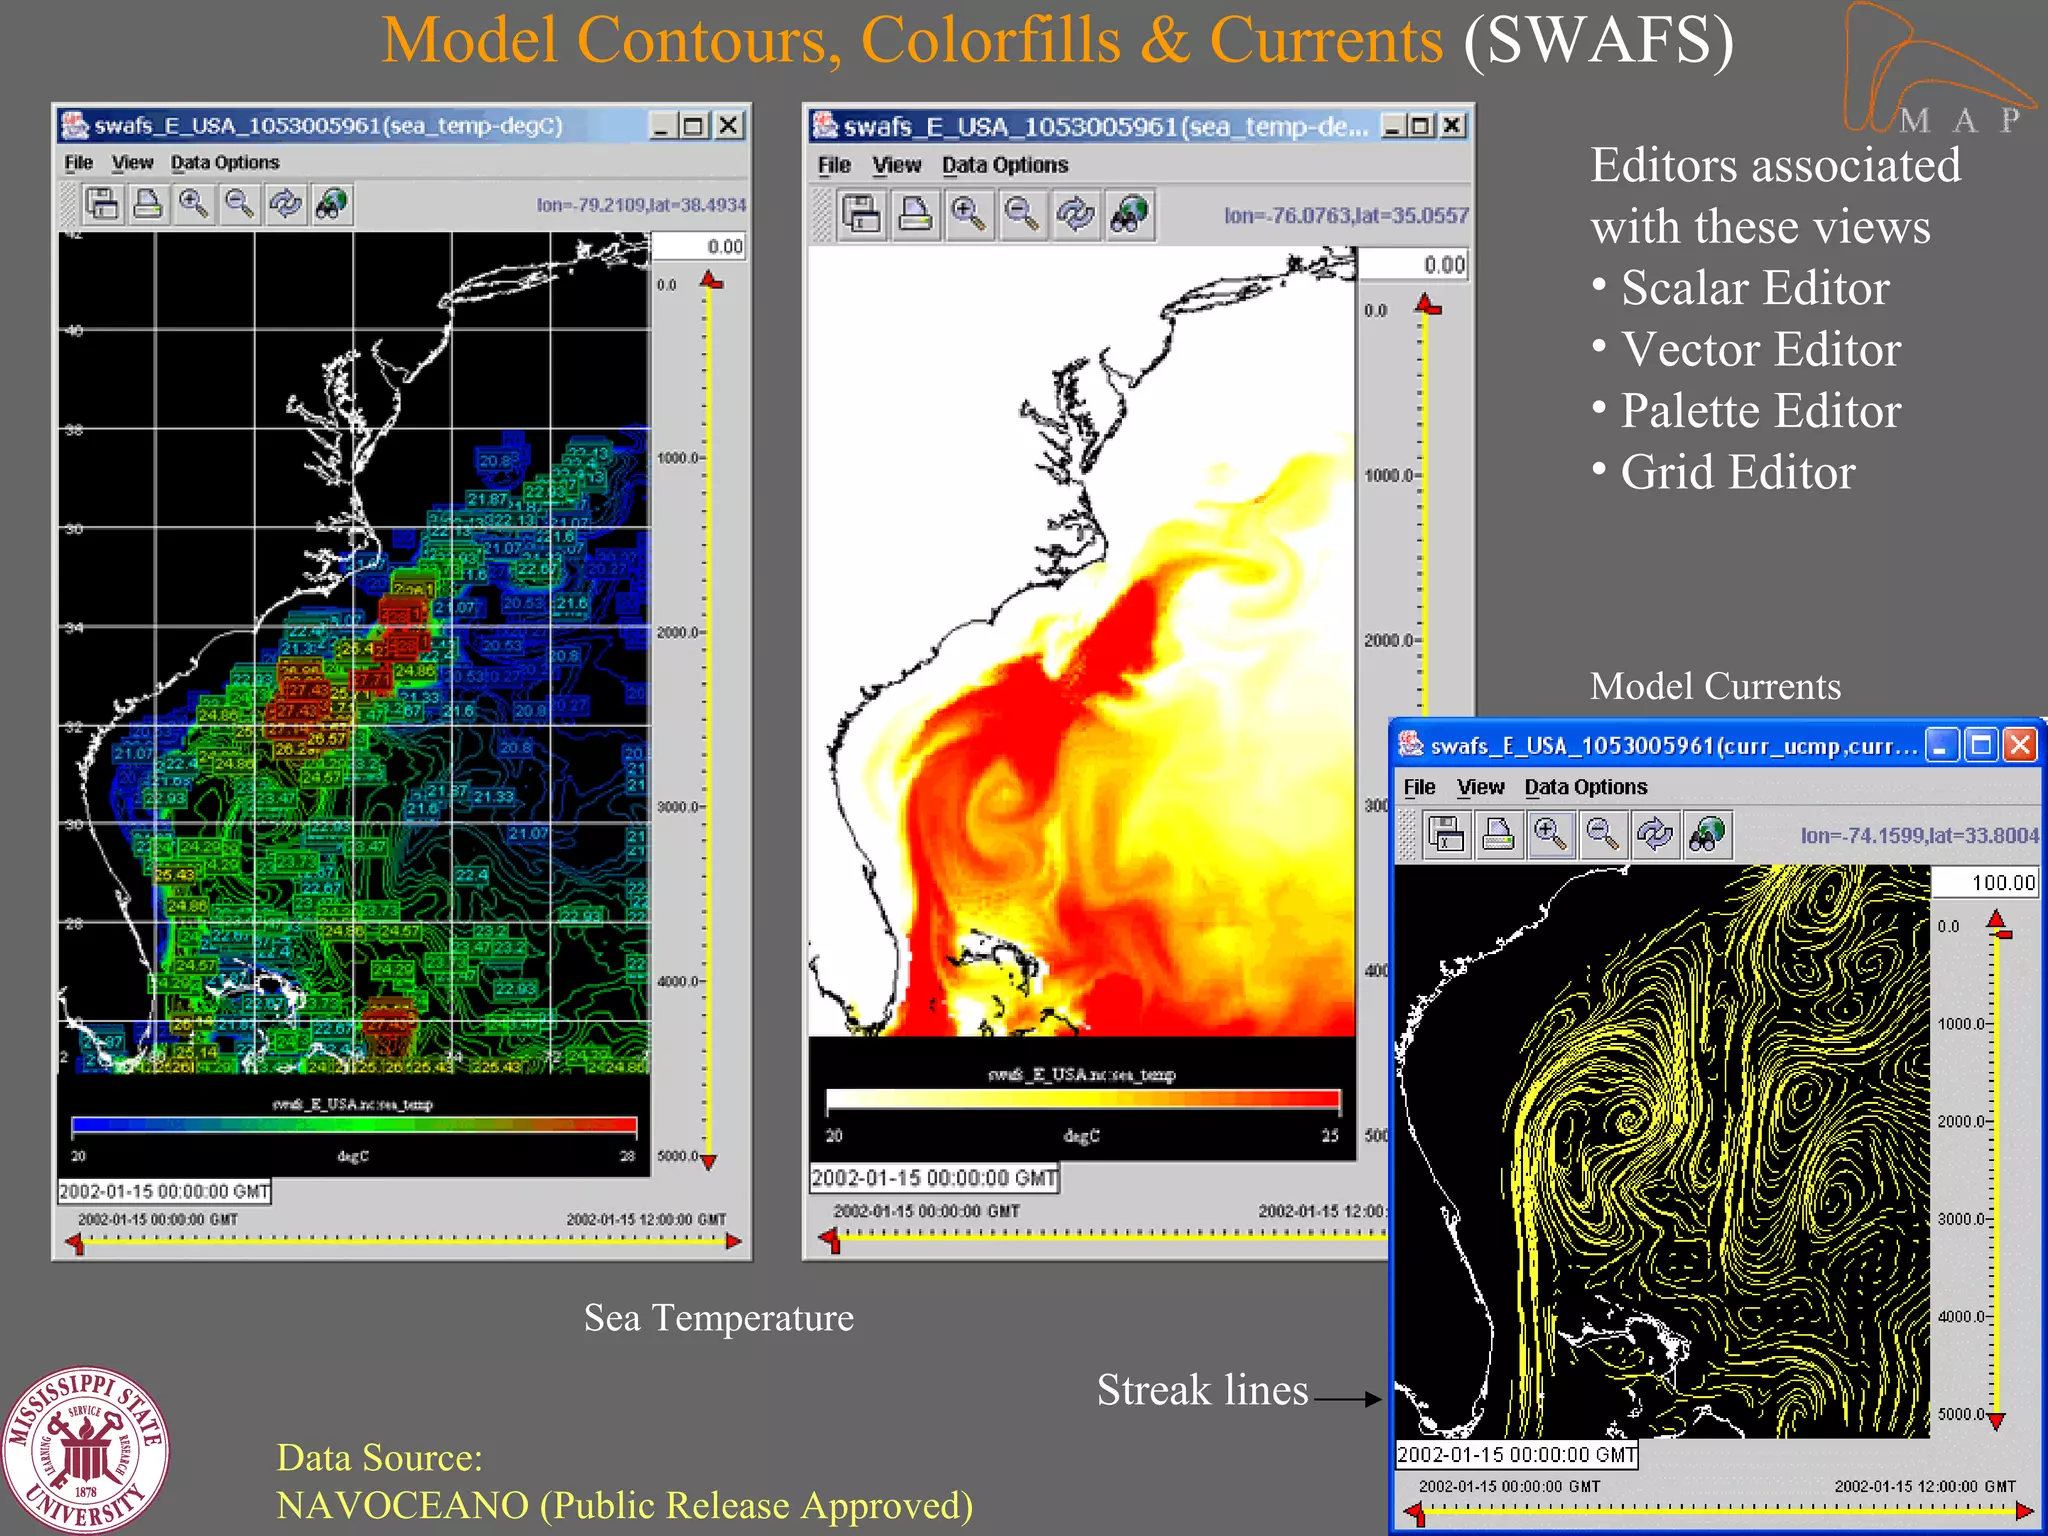
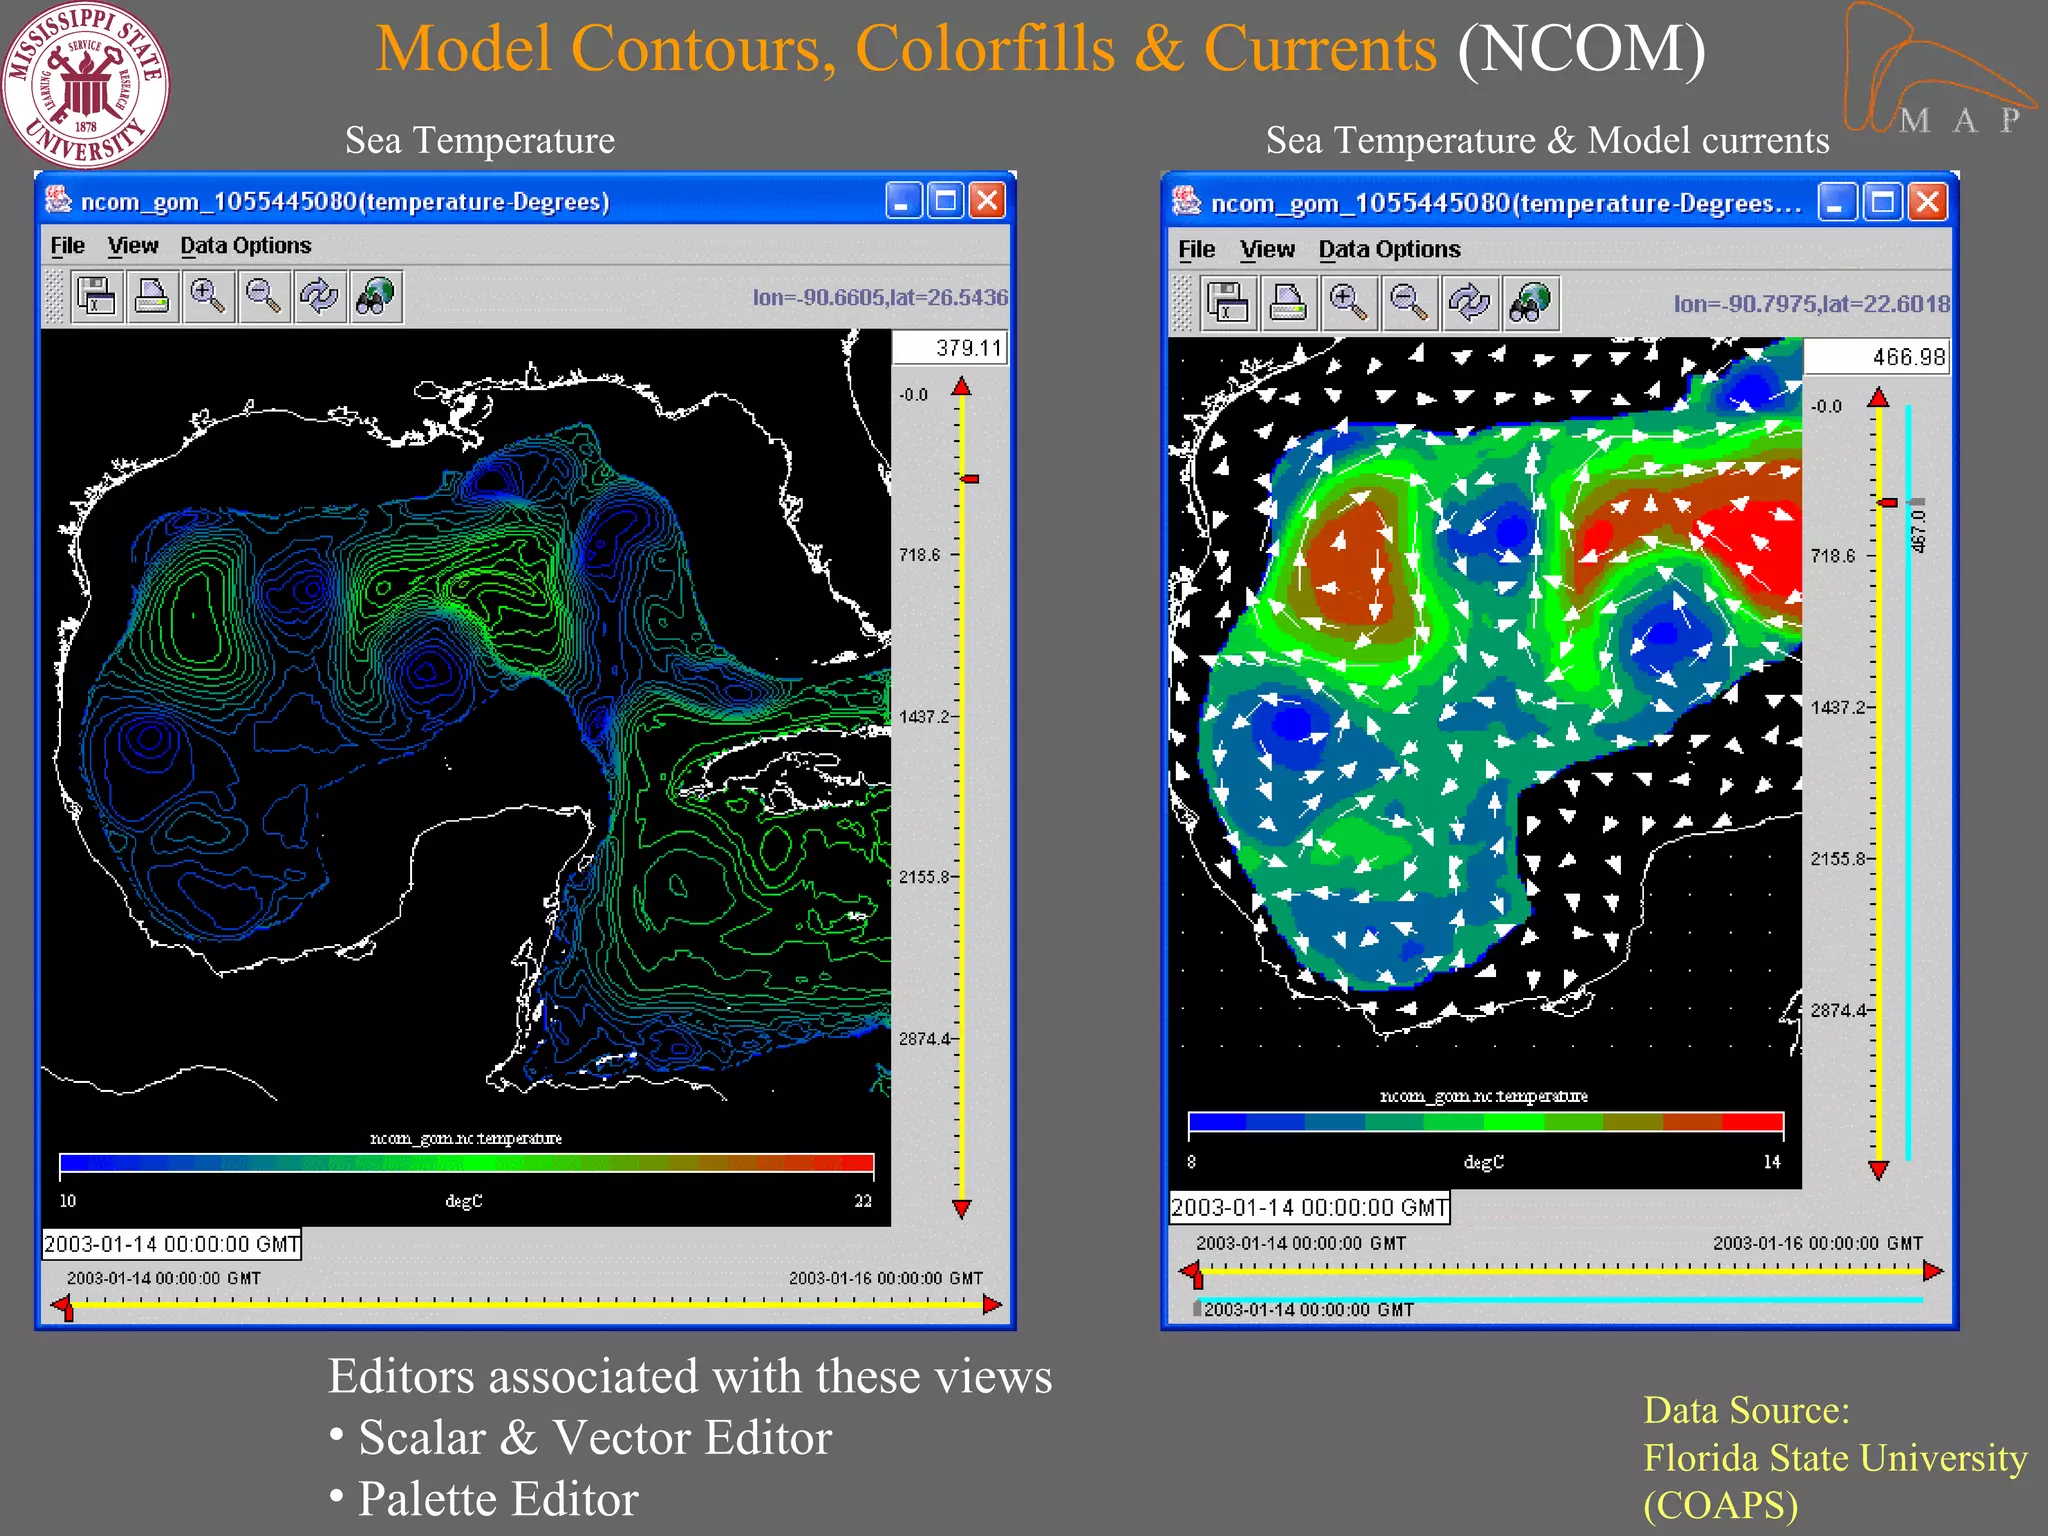
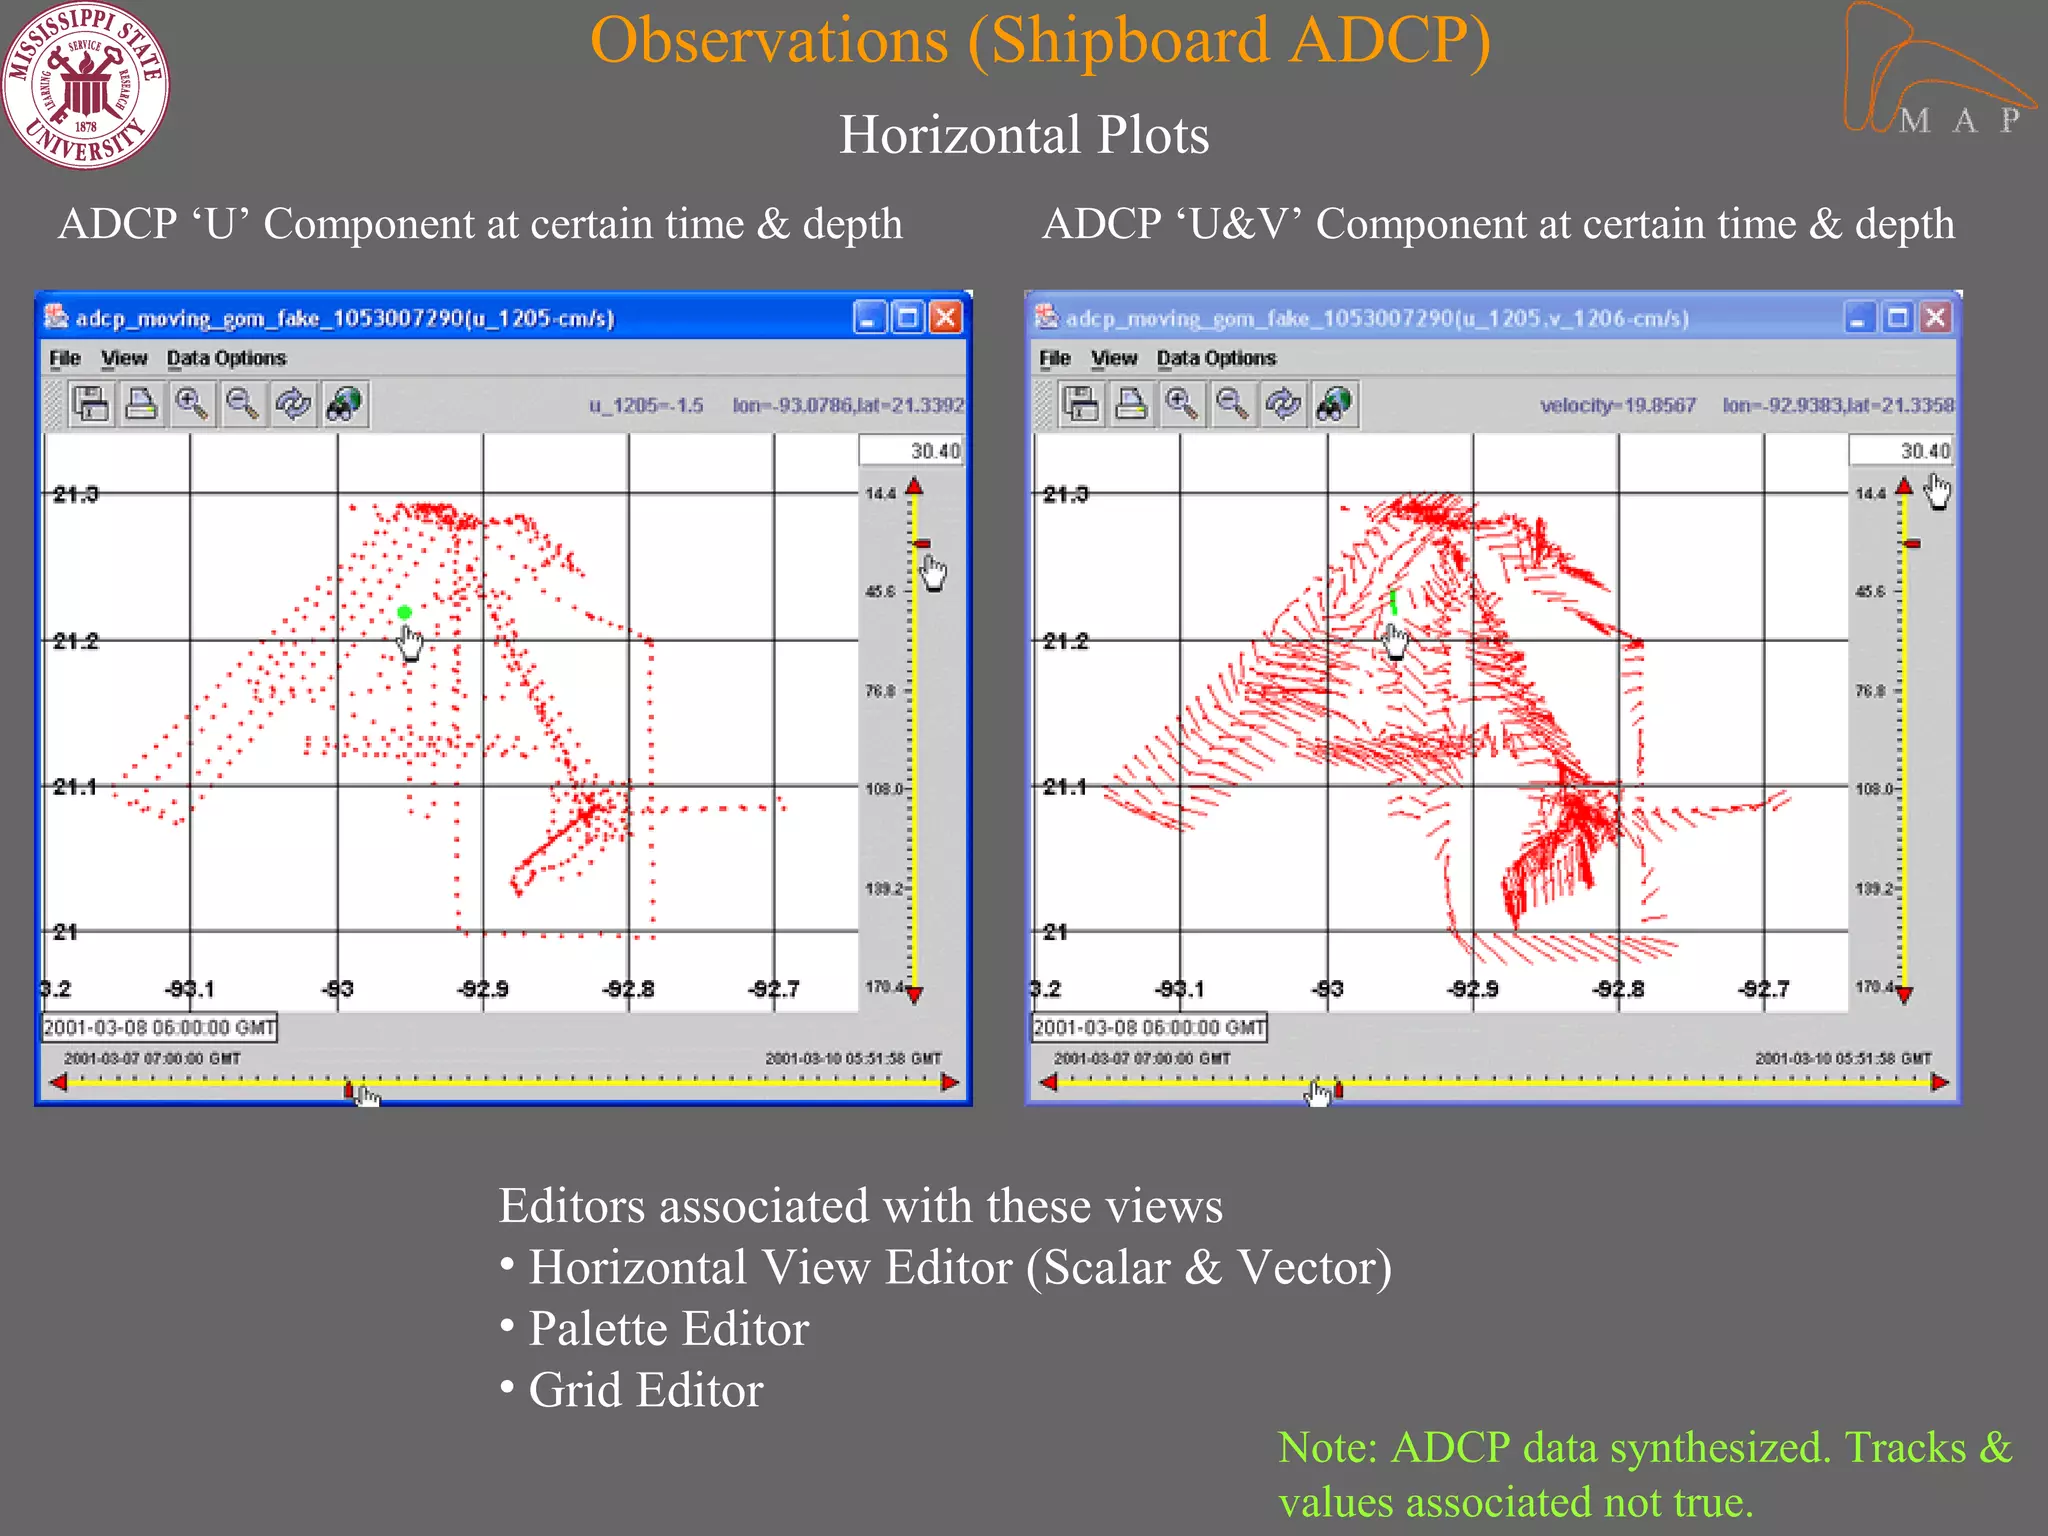
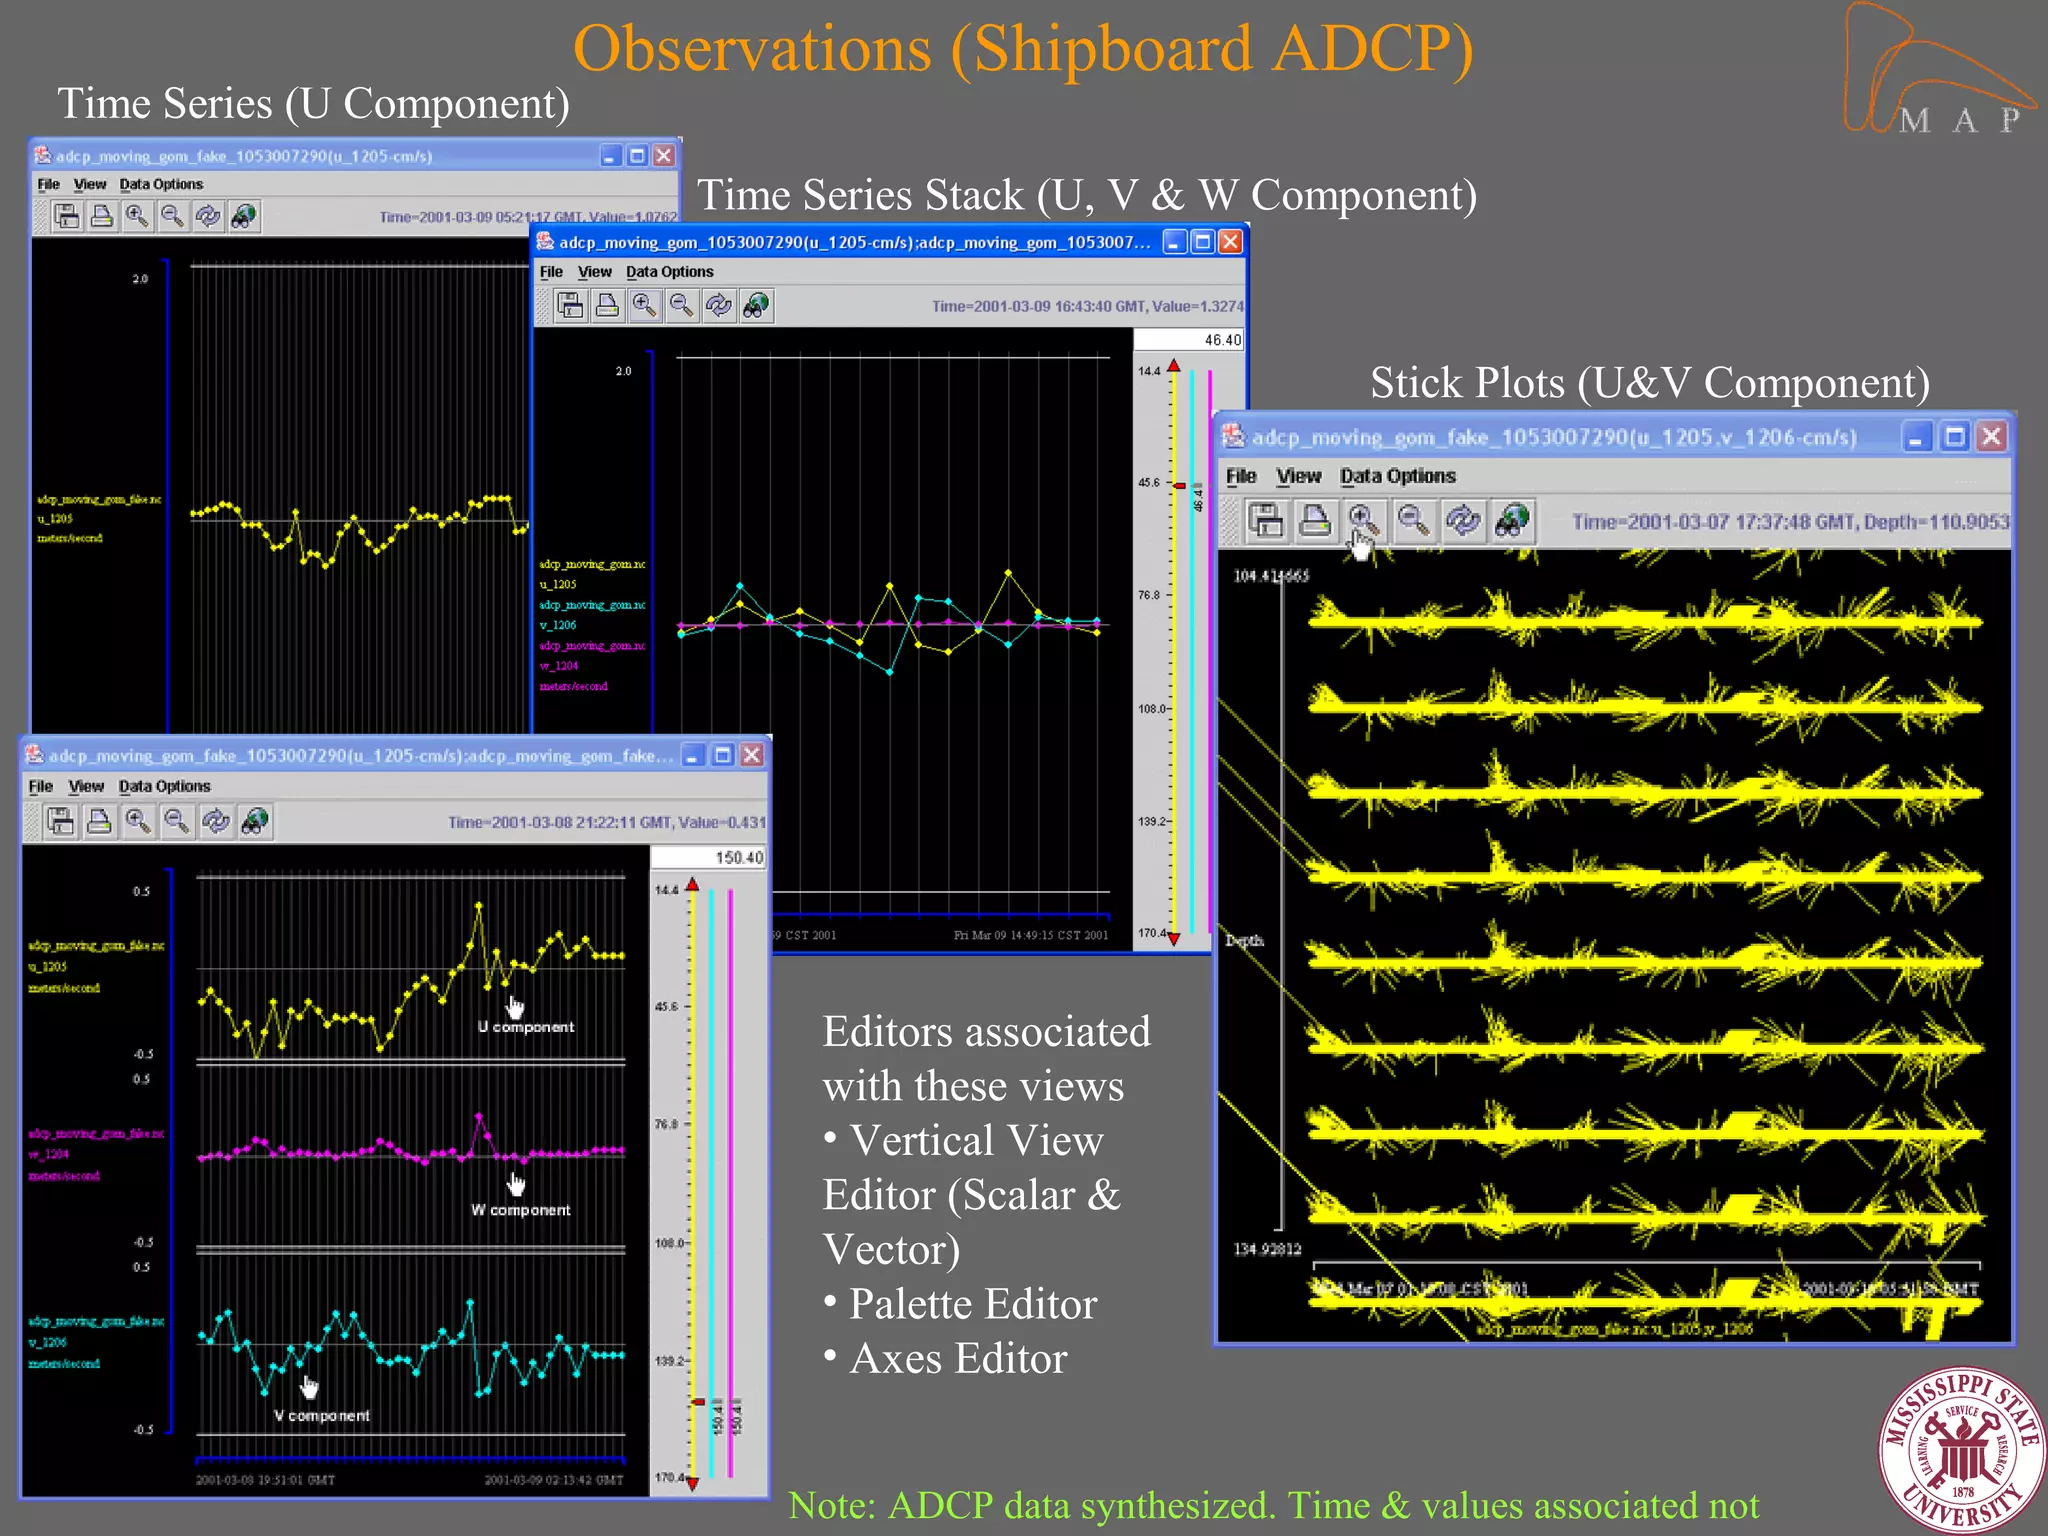
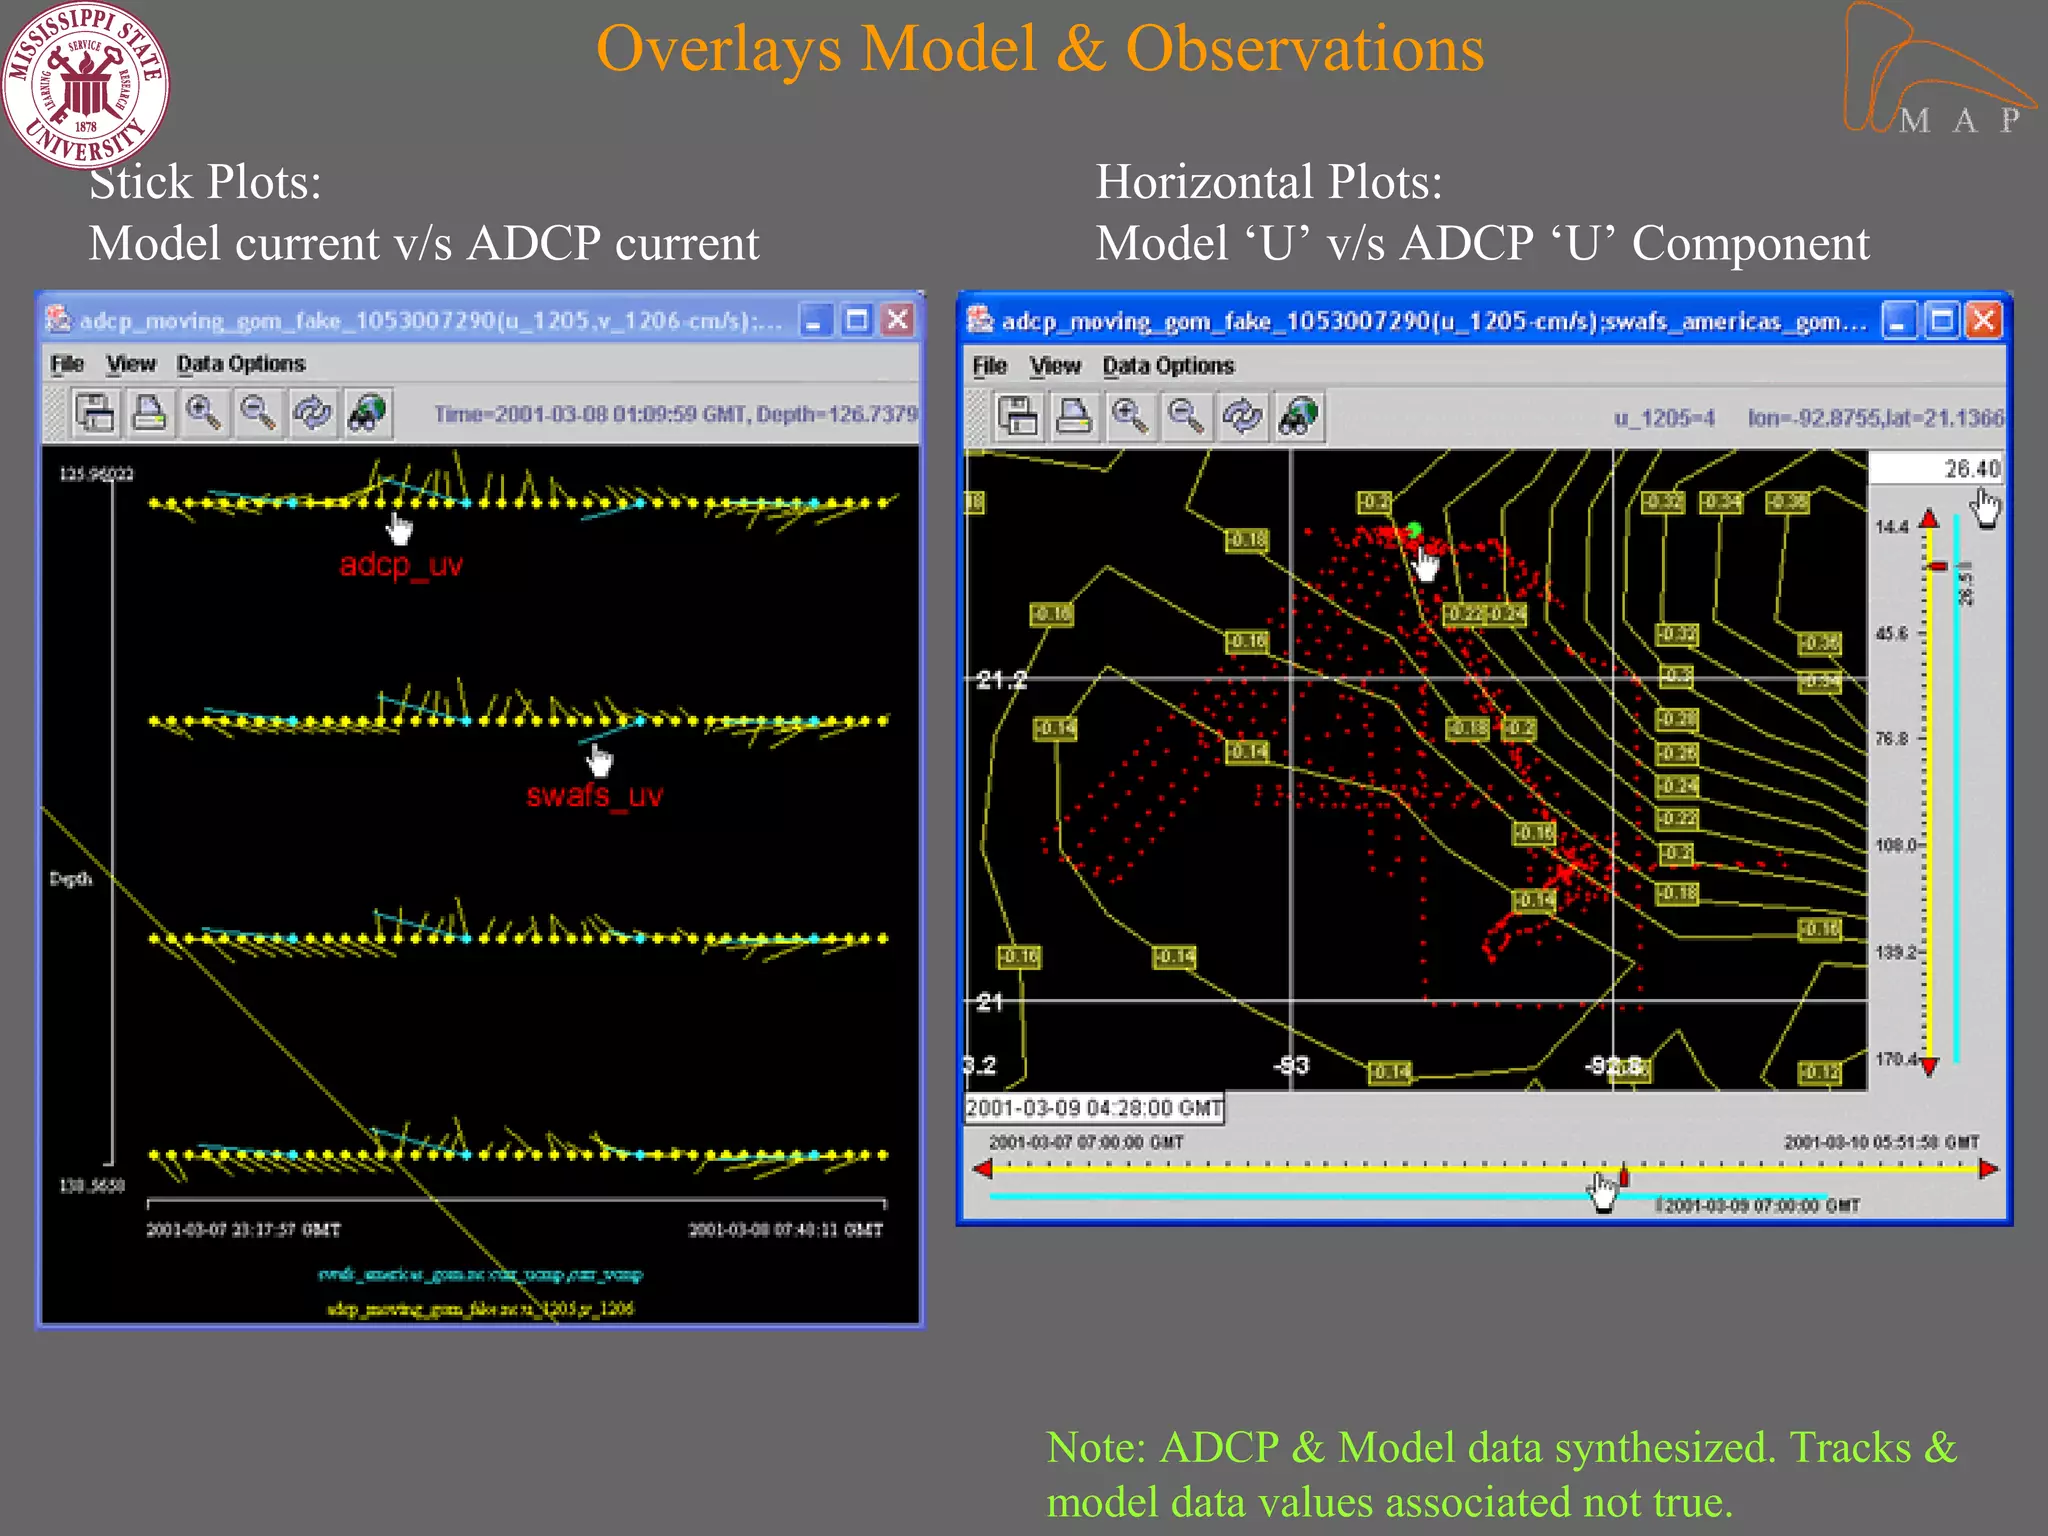
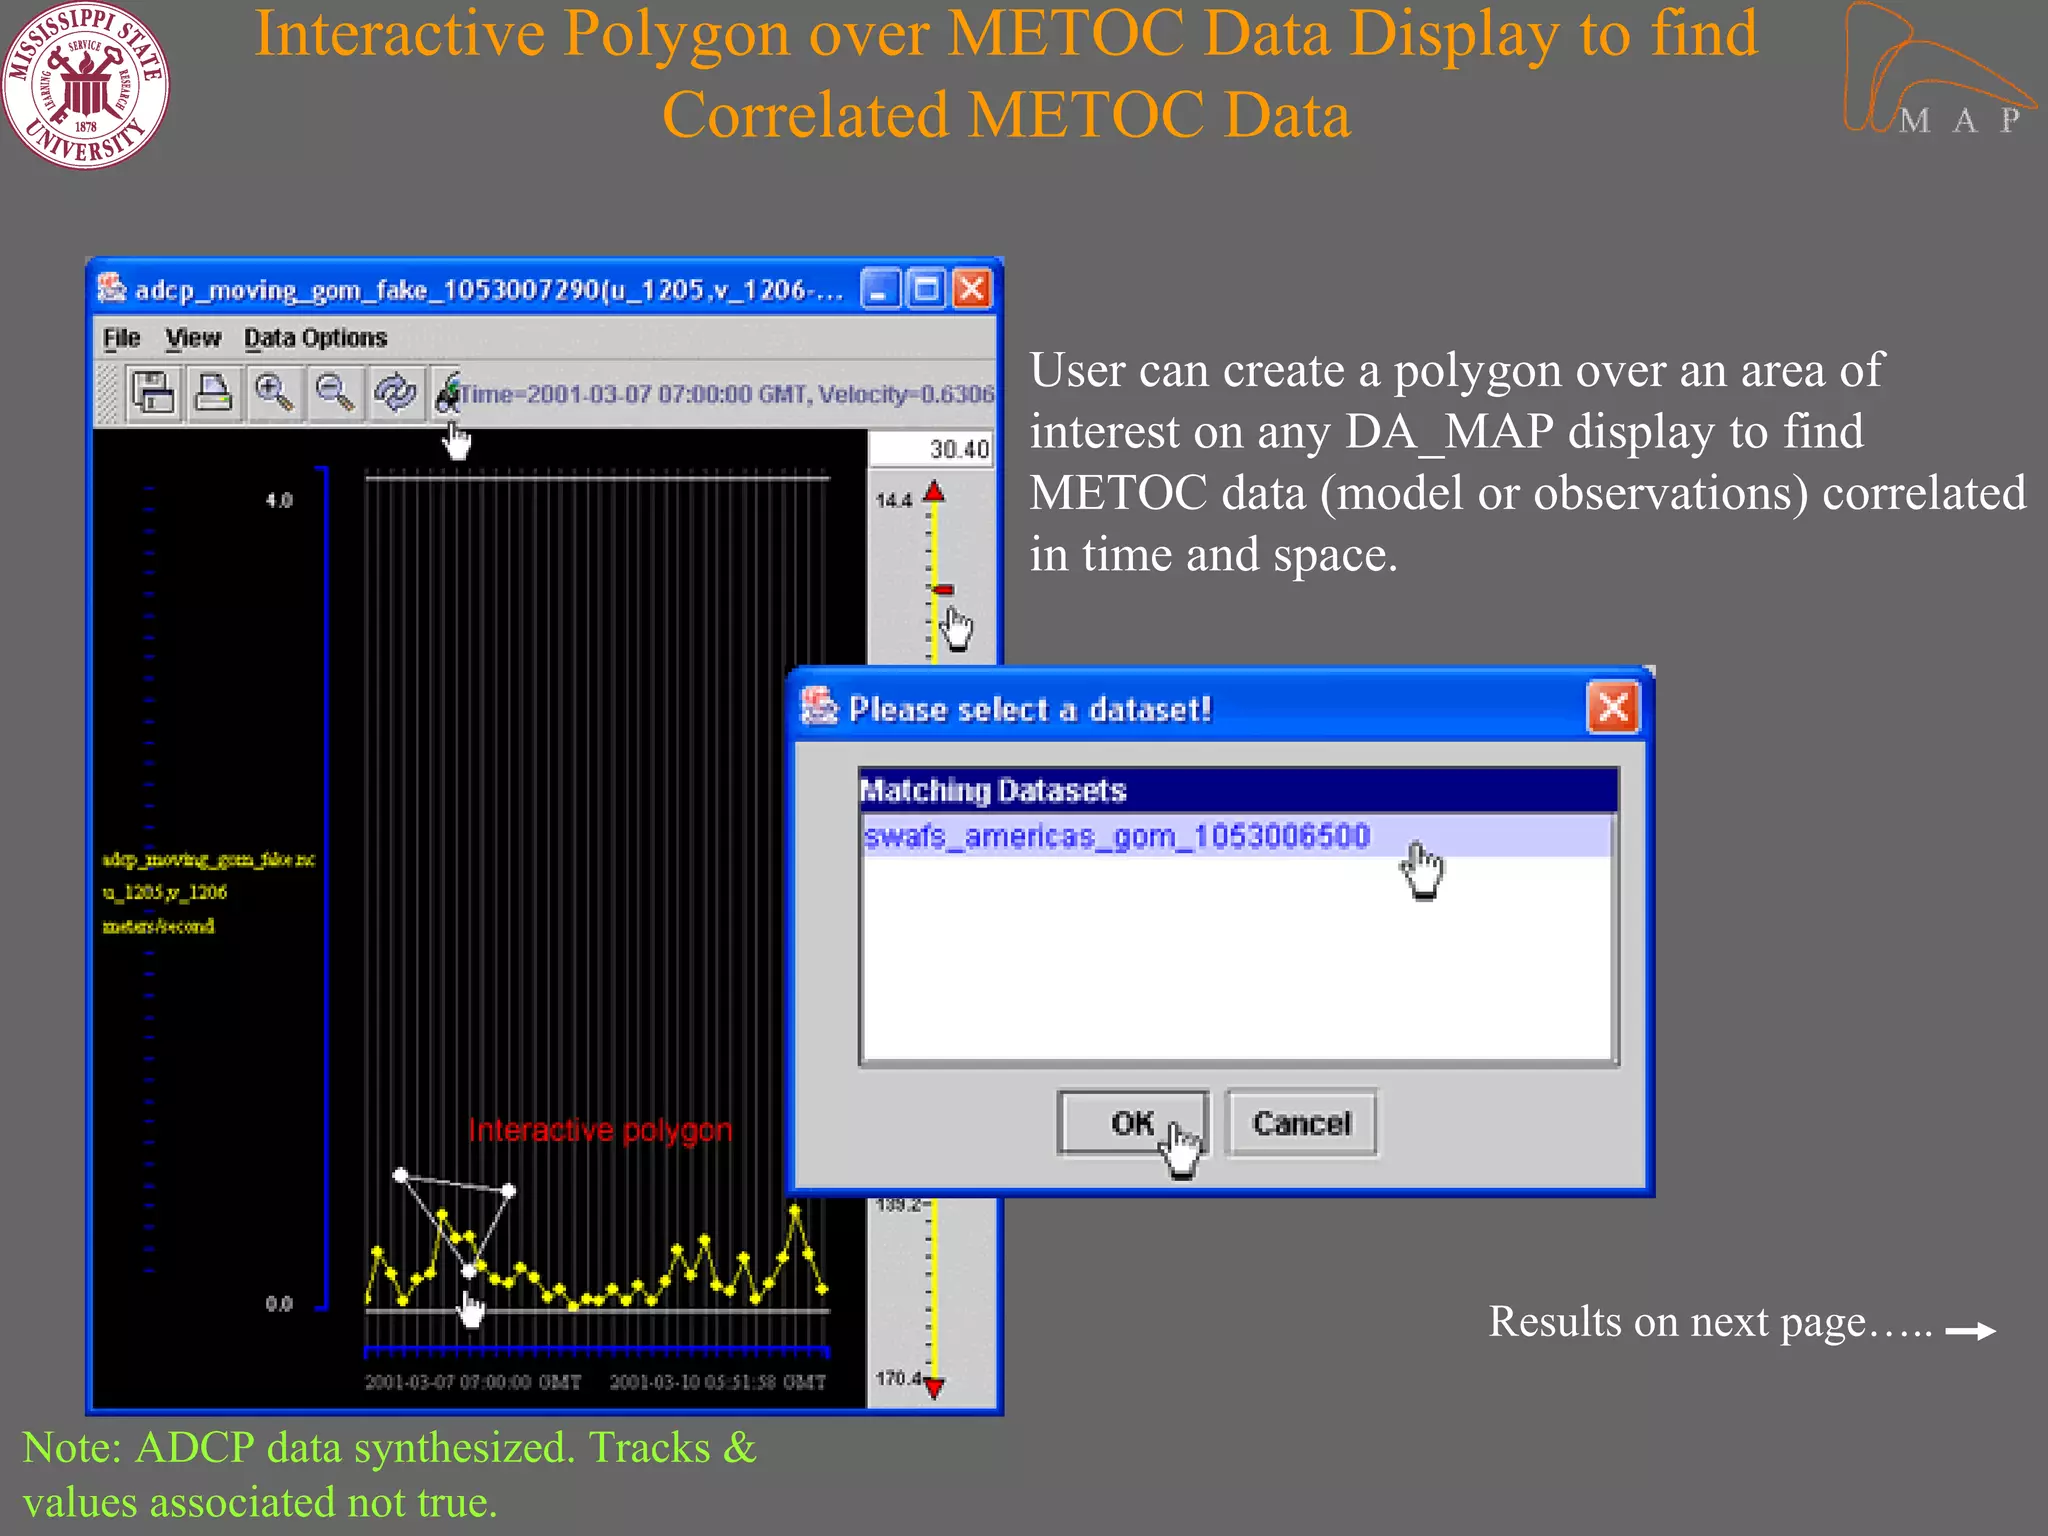
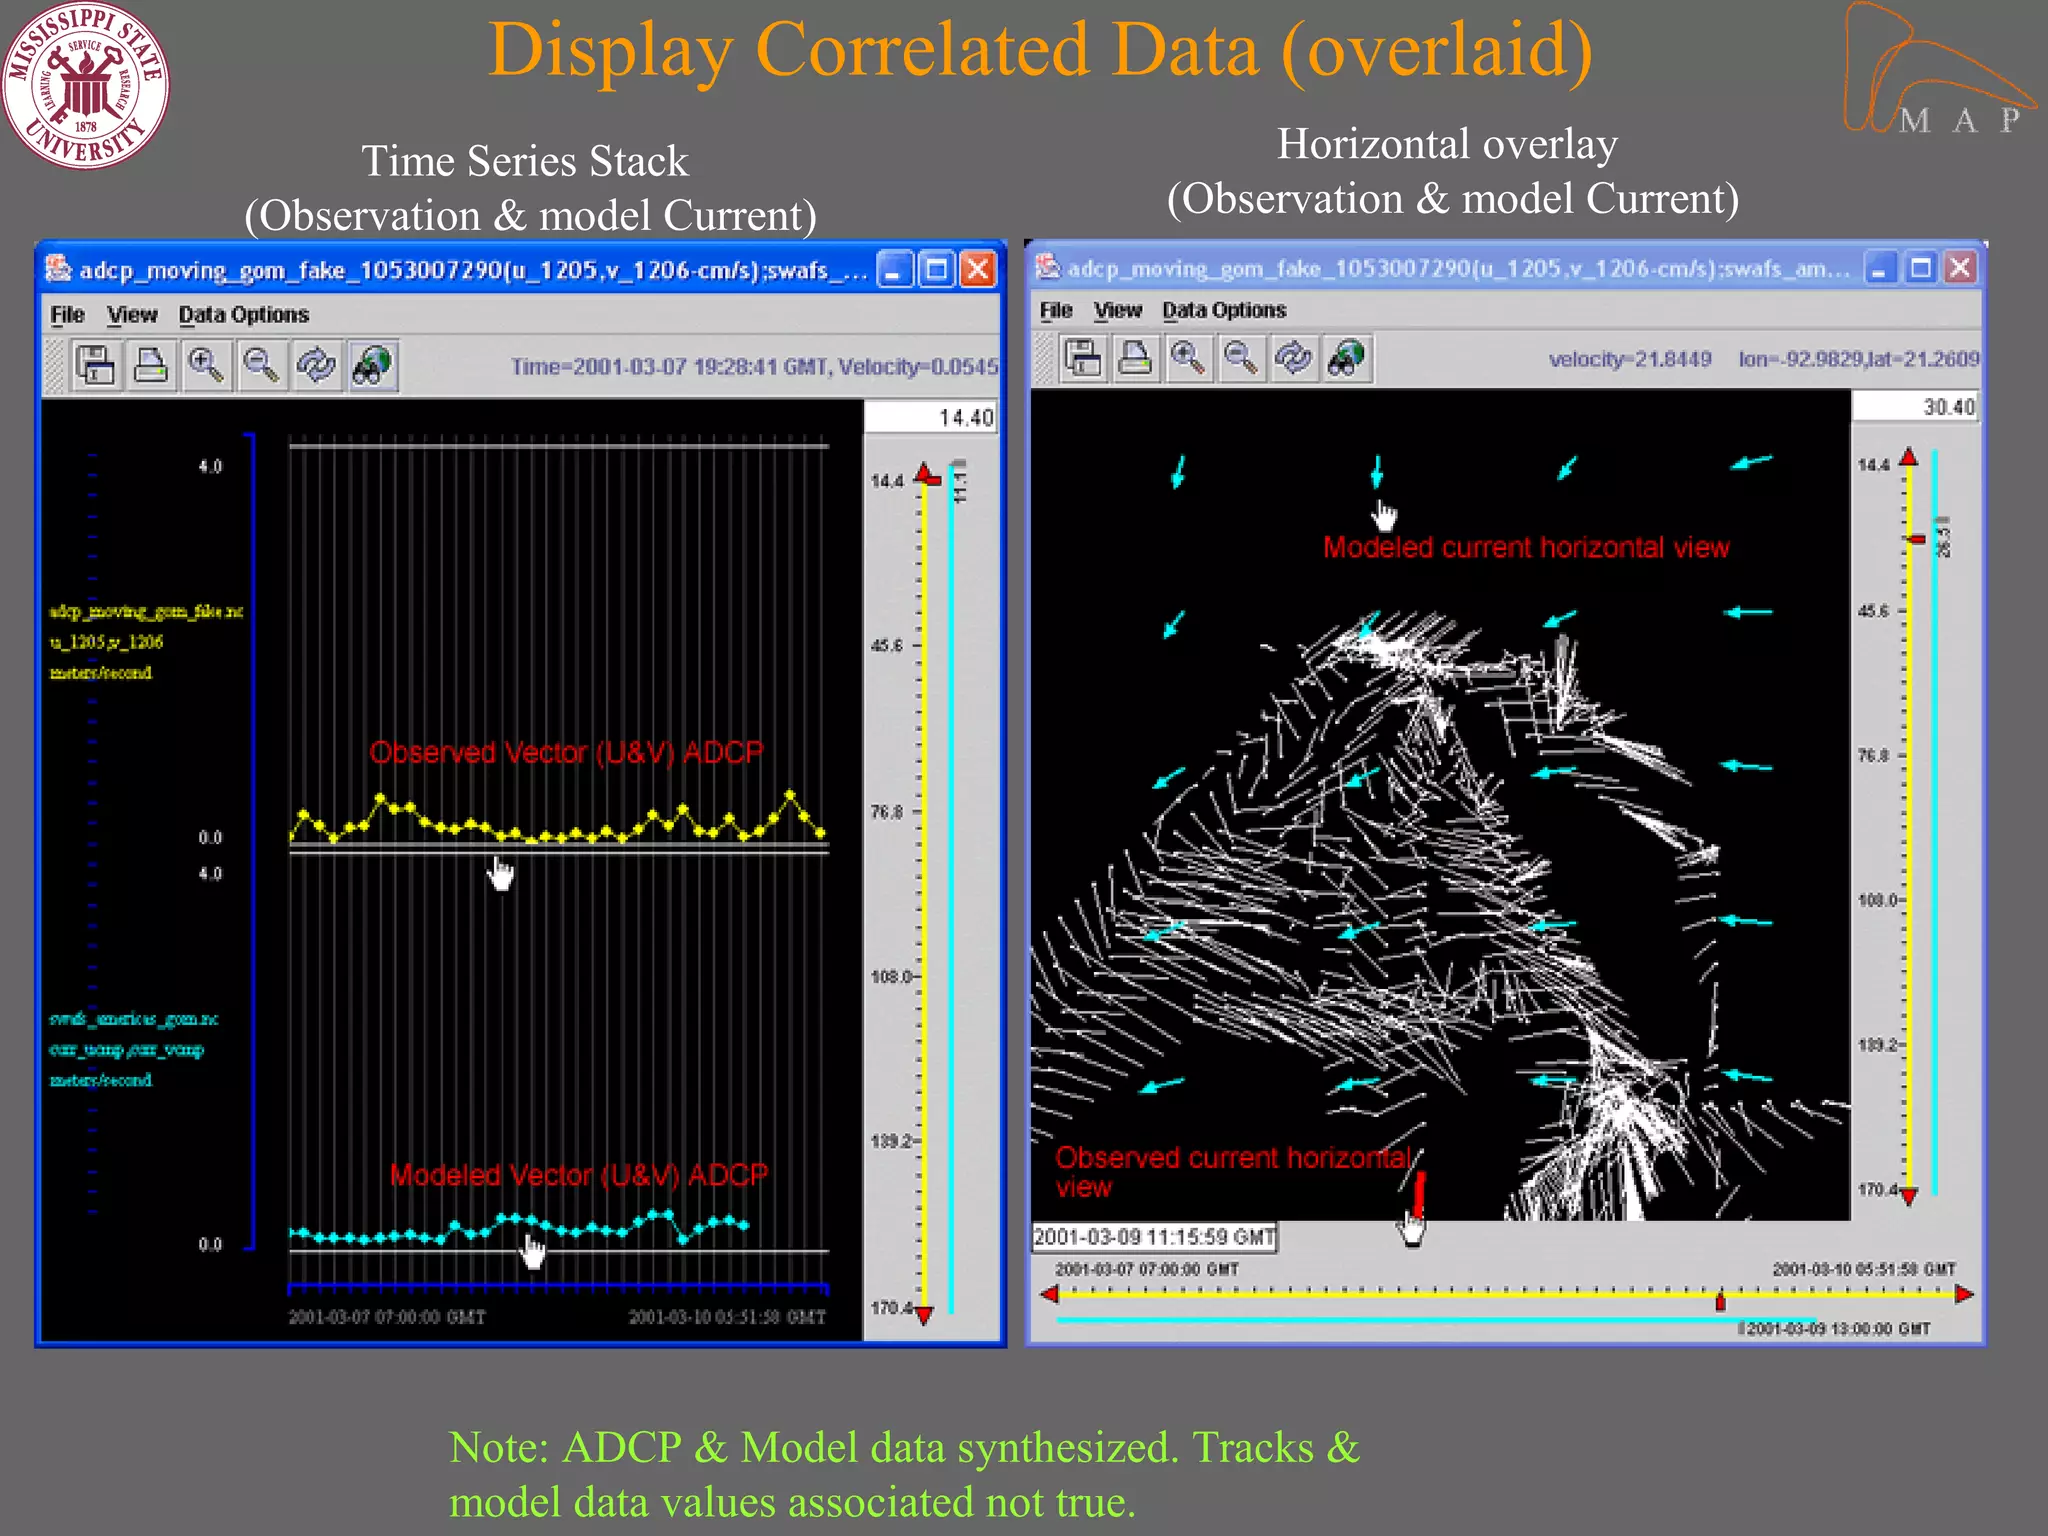
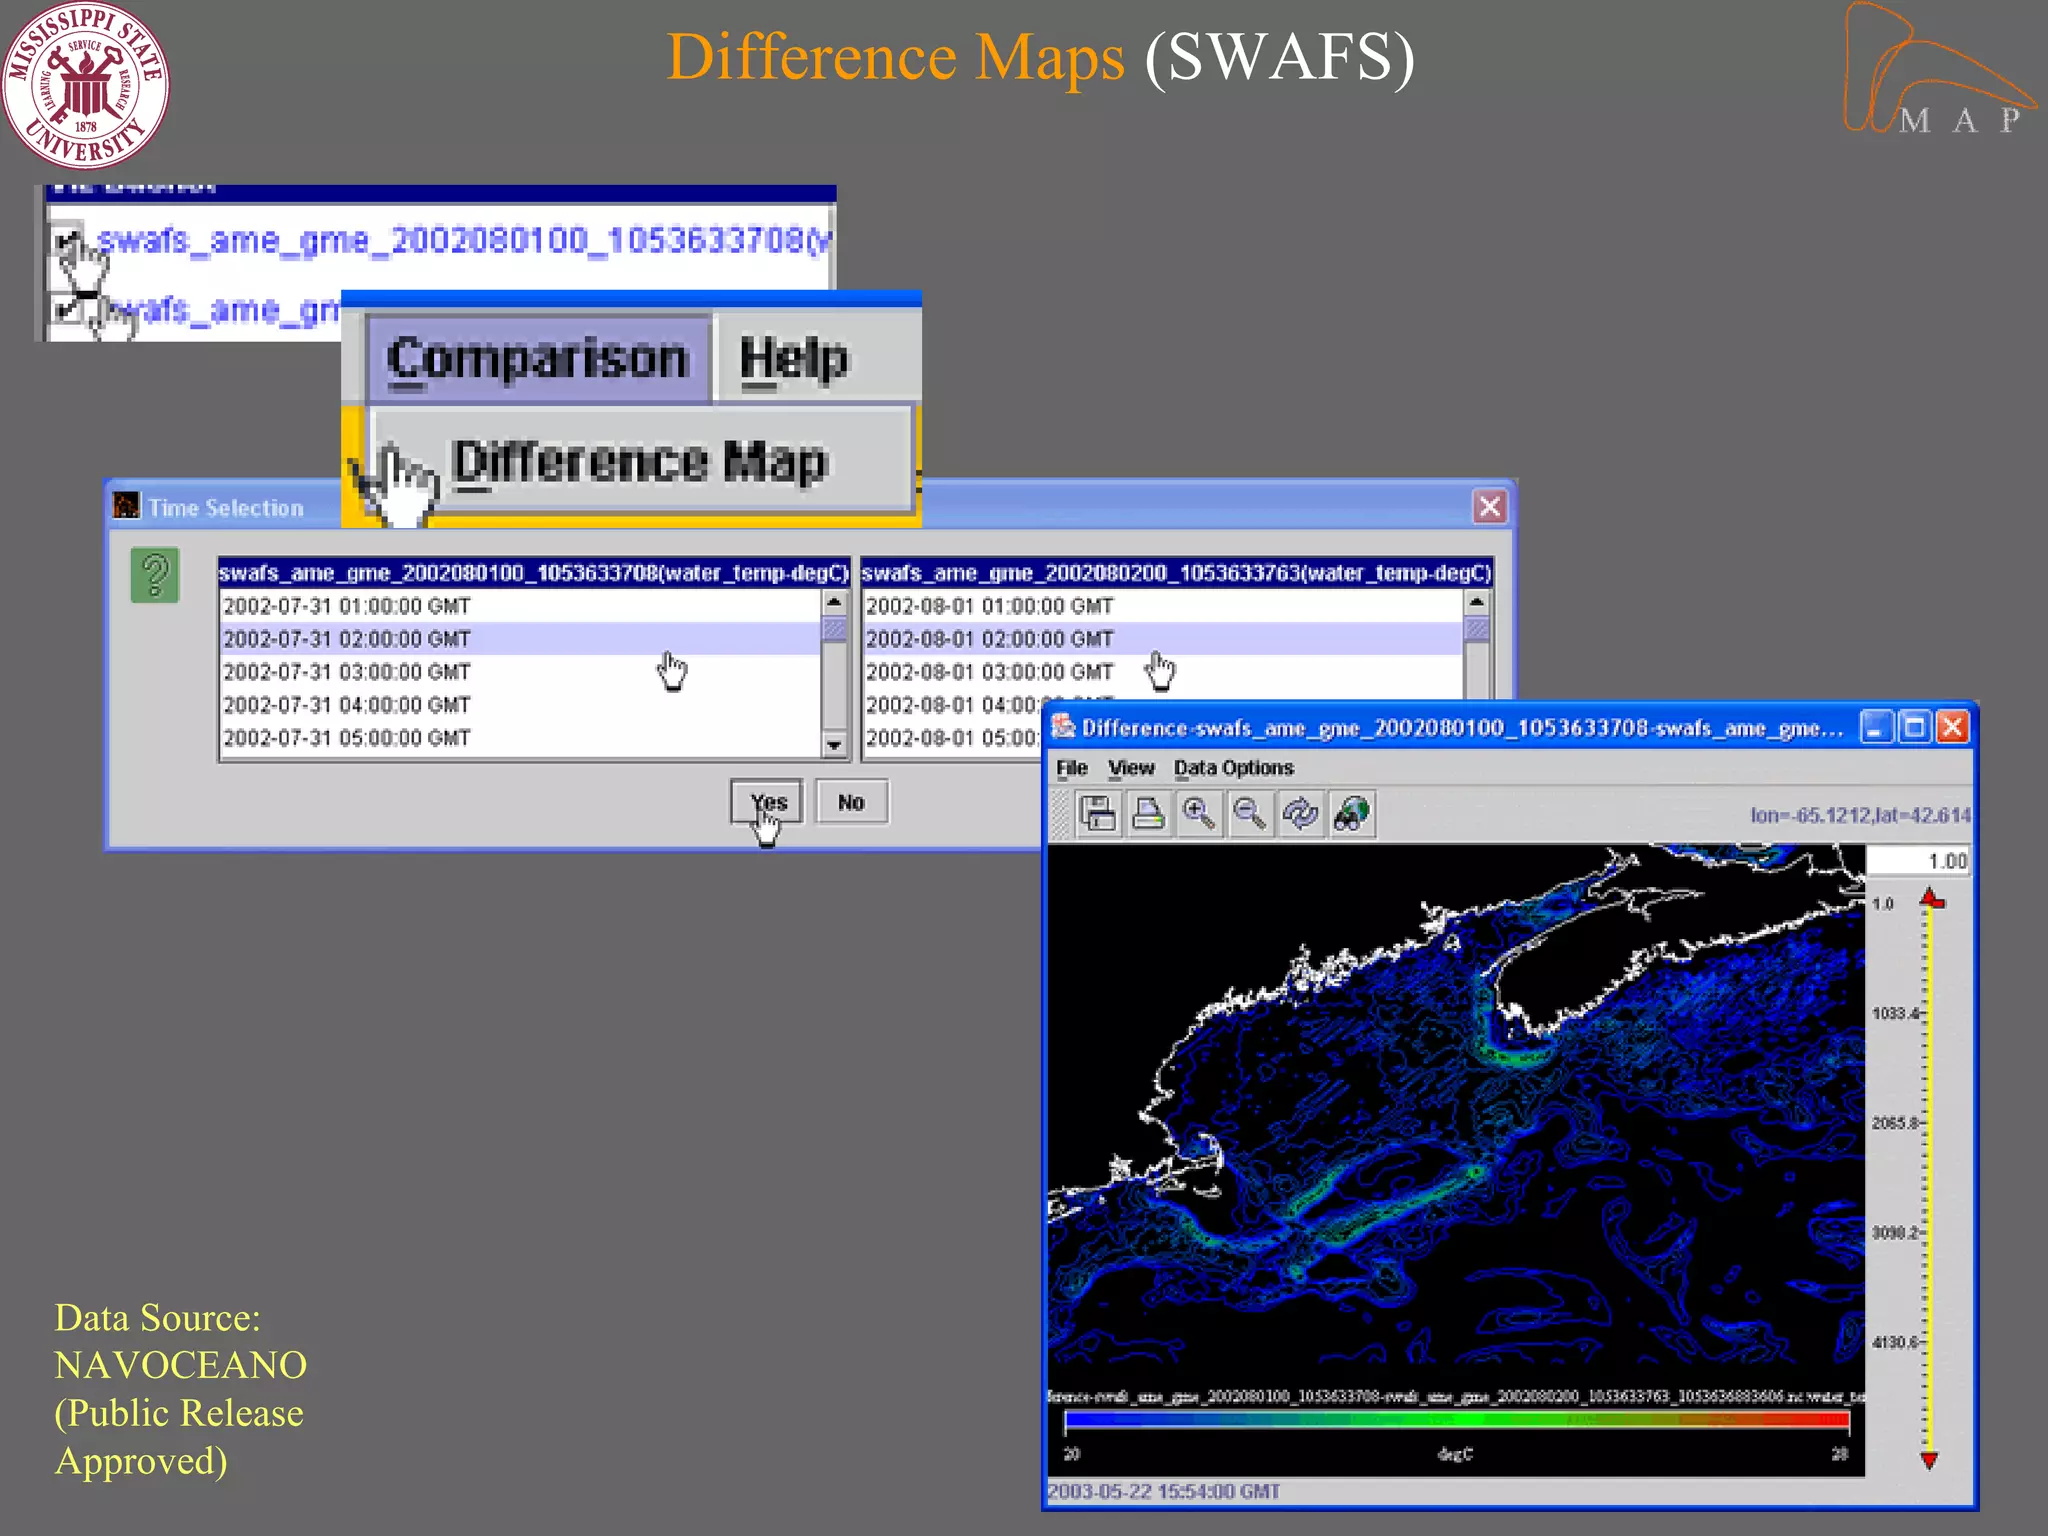
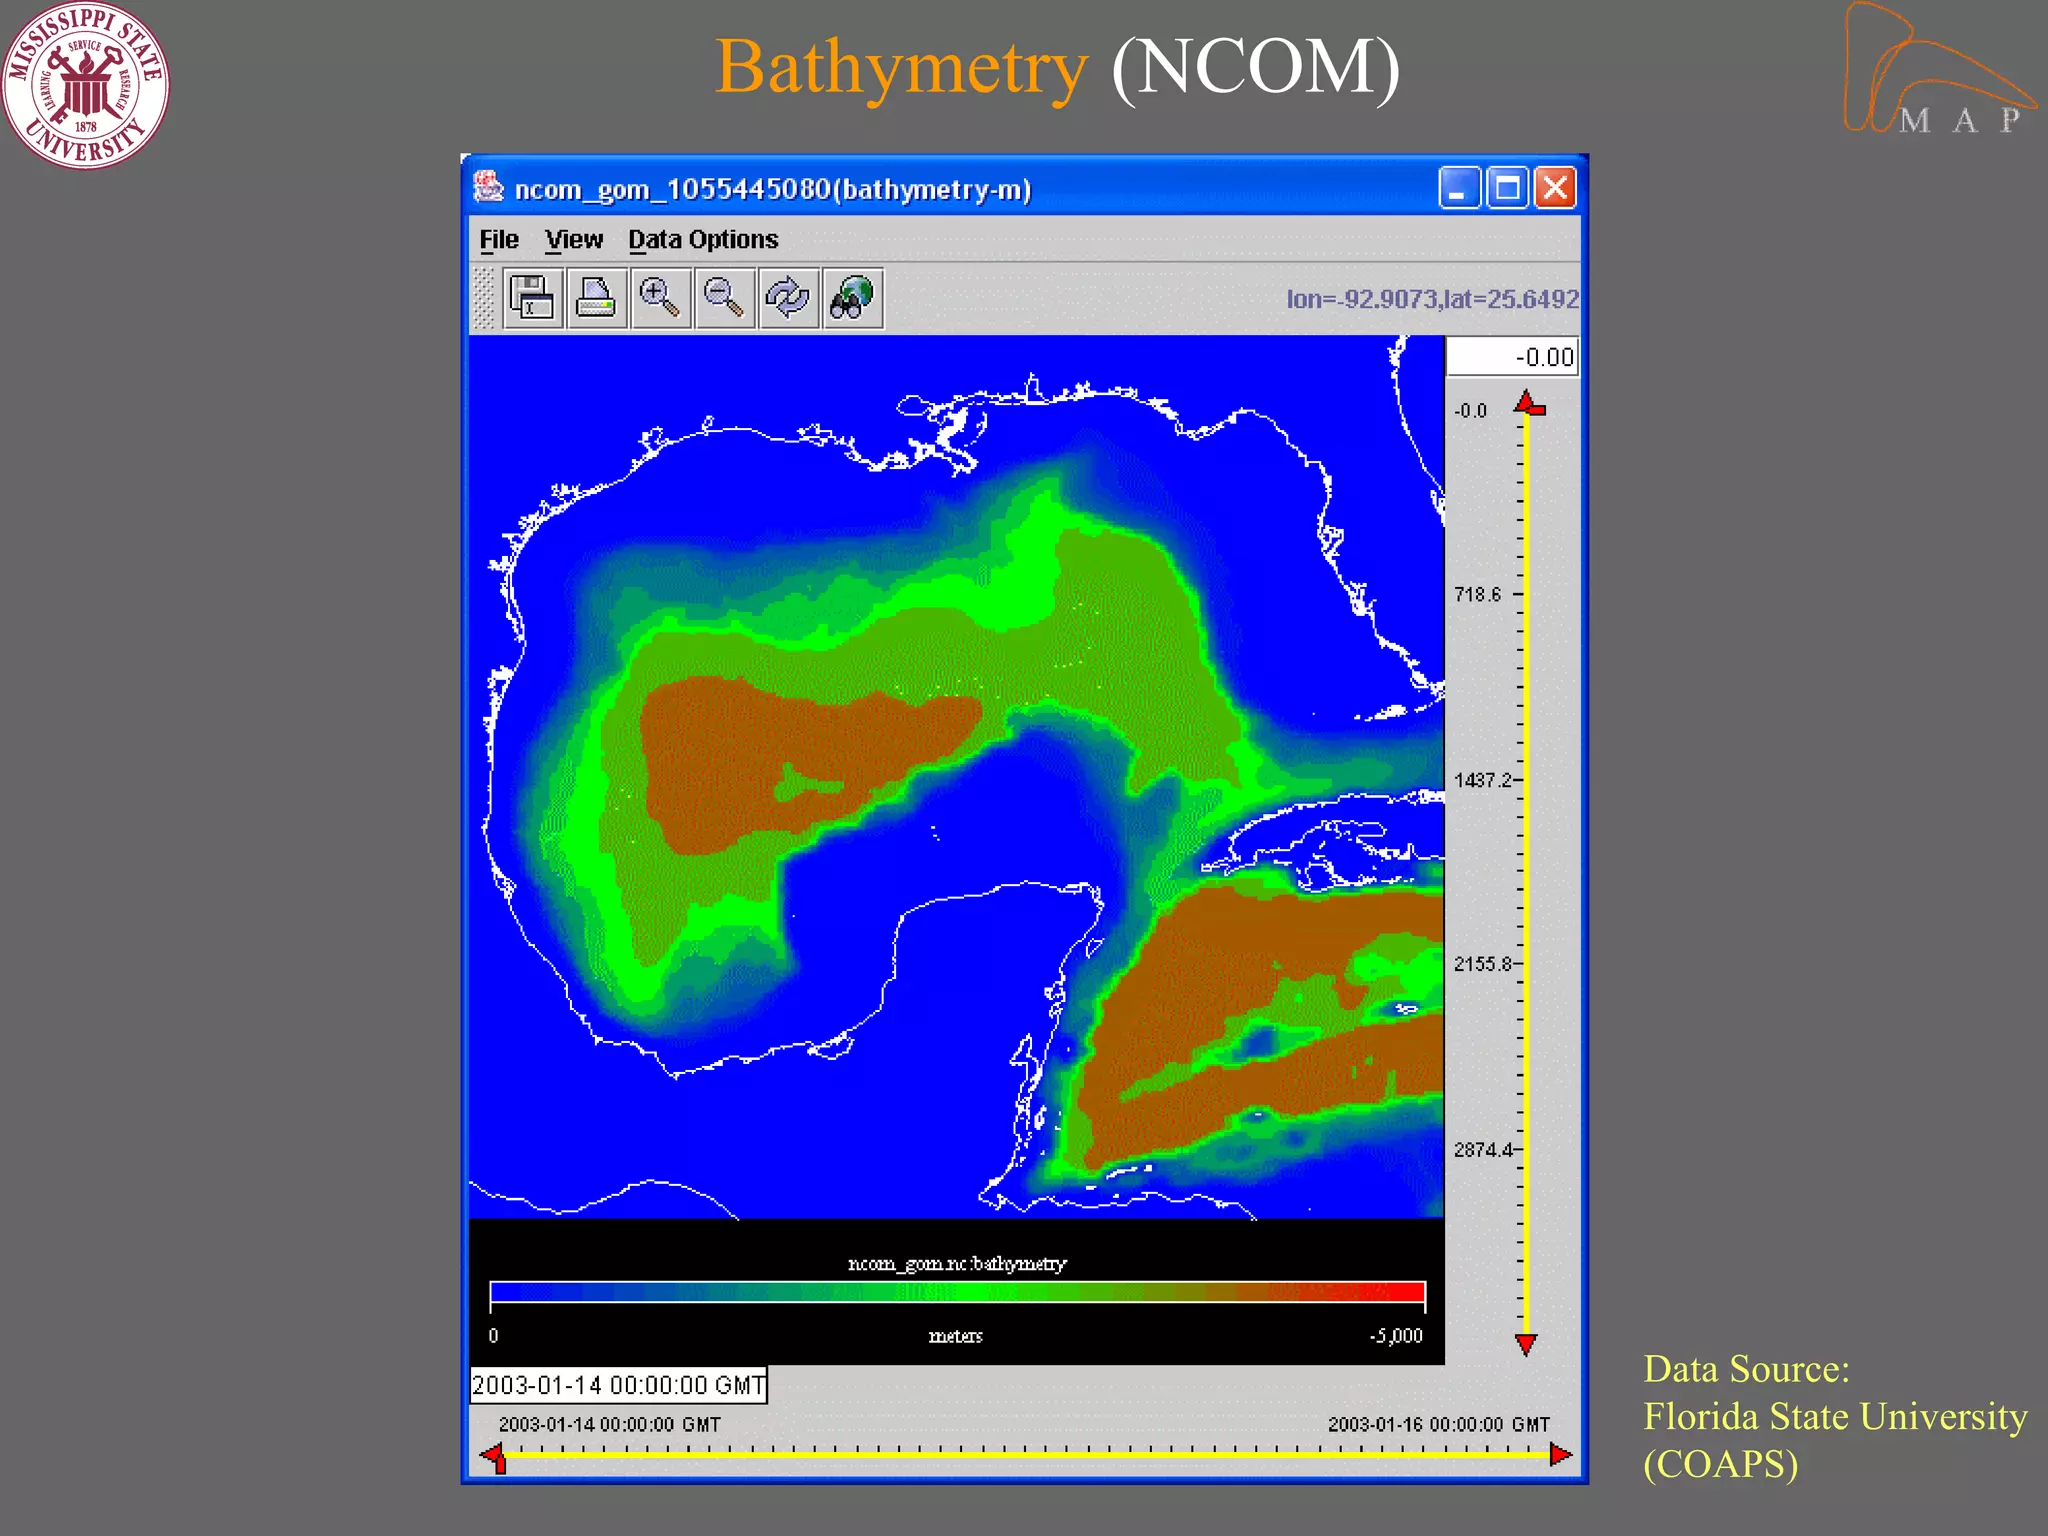
June 18, 2003

Sachin Bhate (PI), Jim Corbin, John Van Der Zwaag
       Yee Lau and Surya N Renduchintala


        Sponsor: Office of Naval Research
“Oceanographers are there, researchers are there, there
are models running in every part of ocean, there is a
buoy floating somewhere, there is some data collected
possibly every minute, and there is a weatherman out
somewhere watching for us. It is very important for us
to keep our eyes and ears open, keep a clear mind and
think, how we can build new bridges between these
modelers and data collectors, improve the
communication between researchers and weathermen,
and create a wave of virtual collaboration in
oceanographic and atmospheric community.”
                                         - Sachin Kumar Bhate
Motivation behind DA_MAP
Create an application for a METOC data analyst/modeler
that allows more time to be spent on analysis and less on
finding data and figuring out how to use it. It should:
  • Integrate data access interactively with
    visualization and analysis
  • Provide transparent access to diverse data
  • Exploit state-of-the-art software technology
  • Be easily extensible and platform independent
  • Exploit utility of a desktop/laptop computer
  • Be intuitive and user friendly
Emphasis areas

• NAVOCEANO: Our initial user
• METOC Data Analysis and Model Assessment.
• Ocean model output and in-situ observations
• Data Registration and Metadata
• SearchNQuery mechanism (Correlation)
• Interactive visualization/analysis environment
Our Technical Approach
• Java
   – Our main driver for application
   – Graphical User Interface
   – Visualization (Java2D)
   – NetCDF Java Interface (Unidata)
• JWS (Java Web Start)
   – An application deployment web technology, gives the
     user the power to launch full-featured applications
     with a click from a standard web browser
   – Just an HTTP server is enough
   – Facilitates easy installation and updates for
     applications
   – Launch DA_MAP on any desktop from anywhere.
More…

• XML (eXtensible Markup Language)
  – Metadata representation and data registration
  – Search and query operation
  – Easy to understand and implement
  – Less maintenance
  – Better future prospects


                    JWS          XML
                          JAVA
DA_MAP Architecture

             Front End
        (JWS, Java, XML, XPath)

 Registration   Search&Query   Data Analysis


      Middle Tier
                      Metadata
    HTTP server, JWS,
                      (XML)
         XML


Back End
                Local      Remote
                Data        Data
Data Flow between different modules of DA_MAP
           SearchNQuery               Data Registration/Metadata Creation

                 Access                 Store
                 Metadata              Metadata
Provide Data                         (XML records)
  Location
                                                             Register Data
                          Metadata
                                                           (Create metadata &
                          Repository
                                                            Data Dictionary)
                         (XML metadata,
                         Data dictionary)

                Access Metadata
                   and Data
                  Dictionary
                                      Import Data
                                                      Local/Remote
               Data Analysis
                                                          Data
DA MAP Portal

Integrated environment with
access to:
• Setting workspace
• METOC data registration
• Metadata creation
• METOC Data Search
• METOC Data Analysis
• Interactive Analysis
Data Registration Module

•   Metadata easily read from self describing NetCDF data files
•   User interface for mapping variable names (Data Dictionary)
•   Metadata stored in XML format.
•   Define datatypes to create mappings for a class of
    METOC data variables and dimensions to automate
    metadata creation for large number of data files.
• Next…..
               Closer look at the metadata records…
<damapMetadataModel>
 <modelType type="SWAFS">                      Metadata (XML)
   <dataType type="SWAFS_AMERICAS">
     <modelRun name="swafs_americas_gom_1052194377">
     <dtg>
         <beginDate year="2001" month="3" day="7" time="1:0:0" epochalTime="983926800"/>
         <endDate year="2001" month="3" day="9" time="19:0:0" epochalTime="984164400"/>

       </dtg>
       <listParameters>
            <parameter pname="longitude" min="261.99573" max="279.95447"/>
            <parameter pname="current_Vcomponent" min="-100.0" max="2.21"/>
            <parameter ………………………………………………………….. “/>
            <parameter pname="sigma" min="0.0" max="0.97"/>
            <parameter pname="bathy" min="6.0" max="5620.0"/>
       </listParameters>
       <domain>
            <domainValues elon="-80.0" wlon="-98.0" nlat="31.0" slat="17.0"/>
       </domain>
       <Location>
            <URL uname="file://C:/data/SWAFS/swafs_americas_gom.nc"/>
       </Location>
      </modelRun>
    </dataType>
  </modelType>
</damapMetadataModel>
Data Dictionary & Mappings (XML)

<damapDataTypes>
   <dataType type="SWAFS_AMERICAS" class="model" dataGenerator="SWAFS">
         <mapping parameter="lon" map="longitude"/>
         <mapping parameter="curr_vcmp" map="water_Vcomponent"/>
         <mapping parameter="time" map="time"/>
         <mapping parameter="tau" map="tau"/>
         <mapping parameter="sal" map="salinity"/>
         <mapping parameter="sea_temp" map="water_temperature"/>
         <mapping parameter="surf_el" map="surface_elevation"/>
         <mapping parameter="lat" map="latitude"/>
         <mapping parameter="curr_ucmp" map="water_Ucomponent"/>
         <mapping parameter="sigma" map="sigma"/>
         <mapping parameter="bathy" map="bathy"/>
   </dataType>
</damapDataTypes>
Registration Module (Snapshots)


Add new mappings
SearchNQuery Module
• XML Query Engine
• Search on small metadata files rather than large primary
  data files.
• Data search based on temporal and spatial domain
• Search based on models and observations
• Keyword search
• Save user-defined region
• Query result display in temporal and spatial domain
• Save query results and export directly to METOC Data
  Analysis module
Search&Query Module (Snapshots)


                                  Save results for later use
METOC Data Analysis and Assessment
• Floating interface
• Easy mixing and matching of METOC datasets.
• Interface and functionalities
   – Choice of Horizontal and Vertical view
   – Choice of base plot.
   – Palette associated with each plot.
   – Provide new extent for view
   – Model data display (SWAFS, NCOM, etc.)
       • Colorfill, contours, vectors, Streaklines
   – Observation data display (ADCP, drifters, Buoy etc.)
       • Horizontal & vertical plots.
   – Overlay of model versus model data and
     model versus observation
More…
•   Model time series
•   Sigma to Z-level conversion
•   Vertical Stacking of time series plots
•   Interactivity within the display
•   Import data directly into analysis module
•   Difference Maps, Color legend
•   Editors for various functions
METOC Data Analysis Snapshots
                   Gateway to METOC data analysis.
METOC Data Header information Quick View


                          Visualization View
                              Selection
METOC
  Data
Analysis
 Display
Window
Depicting
 Various
Features


Data Source:
NAVOCEANO
(Public Release
Approved)
Model Contours, Colorfills & Currents (SWAFS)
                                                     Editors associated
                                                     with these views
                                                     • Scalar Editor
                                                     • Vector Editor
                                                     • Palette Editor
                                                     • Grid Editor


                                                     Model Currents


               Sea Temperature
                                      Streak lines
Data Source:
NAVOCEANO (Public Release Approved)
Model Contours, Colorfills & Currents (NCOM)
Sea Temperature                       Sea Temperature & Model currents


Editors associated with these views
                                                           Data Source:
• Scalar & Vector Editor                                   Florida State University
• Palette Editor                                           (COAPS)
Observations (Shipboard ADCP)
                                      Horizontal Plots
ADCP ‘U’ Component at certain time & depth    ADCP ‘U&V’ Component at certain time & depth


                     Editors associated with these views
                     • Horizontal View Editor (Scalar & Vector)
                     • Palette Editor
                     • Grid Editor
                                                         Note: ADCP data synthesized. Tracks &
                                                         values associated not true.
Observations (Shipboard ADCP)
Time Series (U Component)

                               Time Series Stack (U, V & W Component)


                                                                     Stick Plots (U&V Component)


                                     Editors associated
                                     with these views
                                     • Vertical View
                                     Editor (Scalar &
                                     Vector)
                                     • Palette Editor
                                     • Axes Editor


                                   Note: ADCP data synthesized. Time & values associated not
Overlays Model & Observations
Stick Plots:                          Horizontal Plots:
Model current v/s ADCP current        Model ‘U’ v/s ADCP ‘U’ Component


                                    Note: ADCP & Model data synthesized. Tracks &
                                    model data values associated not true.
Interactive Polygon over METOC Data Display to find
                          Correlated METOC Data


                                        User can create a polygon over an area of
                                        interest on any DA_MAP display to find
                                        METOC data (model or observations) correlated
                                        in time and space.


                                                            Results on next page…..

Note: ADCP data synthesized. Tracks &
values associated not true.
Display Correlated Data (overlaid)
      Time Series Stack                           Horizontal overlay
(Observation & model Current)                (Observation & model Current)


          Note: ADCP & Model data synthesized. Tracks &
          model data values associated not true.
Difference Maps (SWAFS)


Data Source:
NAVOCEANO
(Public Release
Approved)
Bathymetry (NCOM)


                    Data Source:
                    Florida State University
                    (COAPS)
Information & Contacts


  Sachin Kumar Bhate

   skbhate@gmail.com

DA_MAP

  • 1.
    June 18, 2003 SachinBhate (PI), Jim Corbin, John Van Der Zwaag Yee Lau and Surya N Renduchintala Sponsor: Office of Naval Research
  • 2.
    “Oceanographers are there,researchers are there, there are models running in every part of ocean, there is a buoy floating somewhere, there is some data collected possibly every minute, and there is a weatherman out somewhere watching for us. It is very important for us to keep our eyes and ears open, keep a clear mind and think, how we can build new bridges between these modelers and data collectors, improve the communication between researchers and weathermen, and create a wave of virtual collaboration in oceanographic and atmospheric community.” - Sachin Kumar Bhate
  • 3.
    Motivation behind DA_MAP Createan application for a METOC data analyst/modeler that allows more time to be spent on analysis and less on finding data and figuring out how to use it. It should: • Integrate data access interactively with visualization and analysis • Provide transparent access to diverse data • Exploit state-of-the-art software technology • Be easily extensible and platform independent • Exploit utility of a desktop/laptop computer • Be intuitive and user friendly
  • 4.
    Emphasis areas • NAVOCEANO:Our initial user • METOC Data Analysis and Model Assessment. • Ocean model output and in-situ observations • Data Registration and Metadata • SearchNQuery mechanism (Correlation) • Interactive visualization/analysis environment
  • 5.
    Our Technical Approach •Java – Our main driver for application – Graphical User Interface – Visualization (Java2D) – NetCDF Java Interface (Unidata) • JWS (Java Web Start) – An application deployment web technology, gives the user the power to launch full-featured applications with a click from a standard web browser – Just an HTTP server is enough – Facilitates easy installation and updates for applications – Launch DA_MAP on any desktop from anywhere.
  • 6.
    More… • XML (eXtensibleMarkup Language) – Metadata representation and data registration – Search and query operation – Easy to understand and implement – Less maintenance – Better future prospects JWS XML JAVA
  • 7.
    DA_MAP Architecture Front End (JWS, Java, XML, XPath) Registration Search&Query Data Analysis Middle Tier Metadata HTTP server, JWS, (XML) XML Back End Local Remote Data Data
  • 8.
    Data Flow betweendifferent modules of DA_MAP SearchNQuery Data Registration/Metadata Creation Access Store Metadata Metadata Provide Data (XML records) Location Register Data Metadata (Create metadata & Repository Data Dictionary) (XML metadata, Data dictionary) Access Metadata and Data Dictionary Import Data Local/Remote Data Analysis Data
  • 9.
    DA MAP Portal Integratedenvironment with access to: • Setting workspace • METOC data registration • Metadata creation • METOC Data Search • METOC Data Analysis • Interactive Analysis
  • 10.
    Data Registration Module • Metadata easily read from self describing NetCDF data files • User interface for mapping variable names (Data Dictionary) • Metadata stored in XML format. • Define datatypes to create mappings for a class of METOC data variables and dimensions to automate metadata creation for large number of data files. • Next….. Closer look at the metadata records…
  • 11.
    <damapMetadataModel> <modelType type="SWAFS"> Metadata (XML) <dataType type="SWAFS_AMERICAS"> <modelRun name="swafs_americas_gom_1052194377"> <dtg> <beginDate year="2001" month="3" day="7" time="1:0:0" epochalTime="983926800"/> <endDate year="2001" month="3" day="9" time="19:0:0" epochalTime="984164400"/> </dtg> <listParameters> <parameter pname="longitude" min="261.99573" max="279.95447"/> <parameter pname="current_Vcomponent" min="-100.0" max="2.21"/> <parameter ………………………………………………………….. “/> <parameter pname="sigma" min="0.0" max="0.97"/> <parameter pname="bathy" min="6.0" max="5620.0"/> </listParameters> <domain> <domainValues elon="-80.0" wlon="-98.0" nlat="31.0" slat="17.0"/> </domain> <Location> <URL uname="file://C:/data/SWAFS/swafs_americas_gom.nc"/> </Location> </modelRun> </dataType> </modelType> </damapMetadataModel>
  • 12.
    Data Dictionary &Mappings (XML) <damapDataTypes> <dataType type="SWAFS_AMERICAS" class="model" dataGenerator="SWAFS"> <mapping parameter="lon" map="longitude"/> <mapping parameter="curr_vcmp" map="water_Vcomponent"/> <mapping parameter="time" map="time"/> <mapping parameter="tau" map="tau"/> <mapping parameter="sal" map="salinity"/> <mapping parameter="sea_temp" map="water_temperature"/> <mapping parameter="surf_el" map="surface_elevation"/> <mapping parameter="lat" map="latitude"/> <mapping parameter="curr_ucmp" map="water_Ucomponent"/> <mapping parameter="sigma" map="sigma"/> <mapping parameter="bathy" map="bathy"/> </dataType> </damapDataTypes>
  • 13.
  • 14.
    SearchNQuery Module • XMLQuery Engine • Search on small metadata files rather than large primary data files. • Data search based on temporal and spatial domain • Search based on models and observations • Keyword search • Save user-defined region • Query result display in temporal and spatial domain • Save query results and export directly to METOC Data Analysis module
  • 15.
    Search&Query Module (Snapshots) Save results for later use
  • 16.
    METOC Data Analysisand Assessment • Floating interface • Easy mixing and matching of METOC datasets. • Interface and functionalities – Choice of Horizontal and Vertical view – Choice of base plot. – Palette associated with each plot. – Provide new extent for view – Model data display (SWAFS, NCOM, etc.) • Colorfill, contours, vectors, Streaklines – Observation data display (ADCP, drifters, Buoy etc.) • Horizontal & vertical plots. – Overlay of model versus model data and model versus observation
  • 17.
    More… • Model time series • Sigma to Z-level conversion • Vertical Stacking of time series plots • Interactivity within the display • Import data directly into analysis module • Difference Maps, Color legend • Editors for various functions
  • 18.
    METOC Data AnalysisSnapshots Gateway to METOC data analysis.
  • 19.
    METOC Data Headerinformation Quick View Visualization View Selection
  • 20.
    METOC Data Analysis Display Window Depicting Various Features Data Source: NAVOCEANO (Public Release Approved)
  • 21.
    Model Contours, Colorfills& Currents (SWAFS) Editors associated with these views • Scalar Editor • Vector Editor • Palette Editor • Grid Editor Model Currents Sea Temperature Streak lines Data Source: NAVOCEANO (Public Release Approved)
  • 22.
    Model Contours, Colorfills& Currents (NCOM) Sea Temperature Sea Temperature & Model currents Editors associated with these views Data Source: • Scalar & Vector Editor Florida State University • Palette Editor (COAPS)
  • 23.
    Observations (Shipboard ADCP) Horizontal Plots ADCP ‘U’ Component at certain time & depth ADCP ‘U&V’ Component at certain time & depth Editors associated with these views • Horizontal View Editor (Scalar & Vector) • Palette Editor • Grid Editor Note: ADCP data synthesized. Tracks & values associated not true.
  • 24.
    Observations (Shipboard ADCP) TimeSeries (U Component) Time Series Stack (U, V & W Component) Stick Plots (U&V Component) Editors associated with these views • Vertical View Editor (Scalar & Vector) • Palette Editor • Axes Editor Note: ADCP data synthesized. Time & values associated not
  • 25.
    Overlays Model &Observations Stick Plots: Horizontal Plots: Model current v/s ADCP current Model ‘U’ v/s ADCP ‘U’ Component Note: ADCP & Model data synthesized. Tracks & model data values associated not true.
  • 26.
    Interactive Polygon overMETOC Data Display to find Correlated METOC Data User can create a polygon over an area of interest on any DA_MAP display to find METOC data (model or observations) correlated in time and space. Results on next page….. Note: ADCP data synthesized. Tracks & values associated not true.
  • 27.
    Display Correlated Data(overlaid) Time Series Stack Horizontal overlay (Observation & model Current) (Observation & model Current) Note: ADCP & Model data synthesized. Tracks & model data values associated not true.
  • 28.
    Difference Maps (SWAFS) DataSource: NAVOCEANO (Public Release Approved)
  • 29.
    Bathymetry (NCOM) Data Source: Florida State University (COAPS)
  • 30.
    Information & Contacts Sachin Kumar Bhate skbhate@gmail.com