Download to read offline


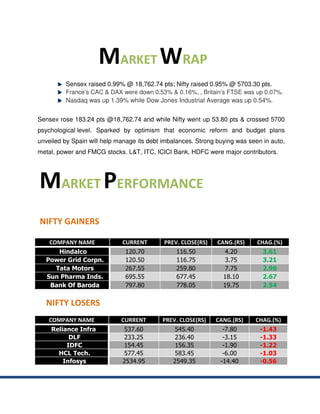
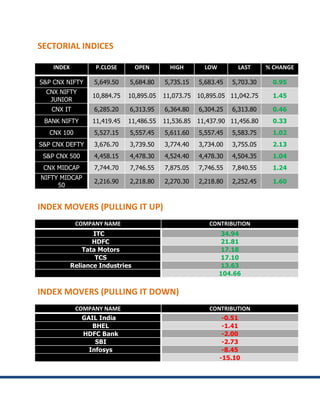
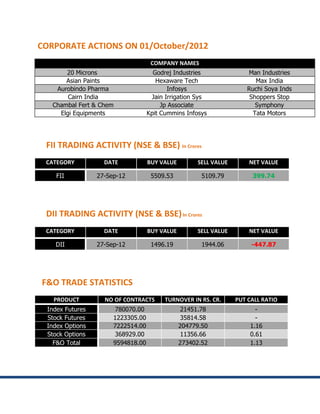
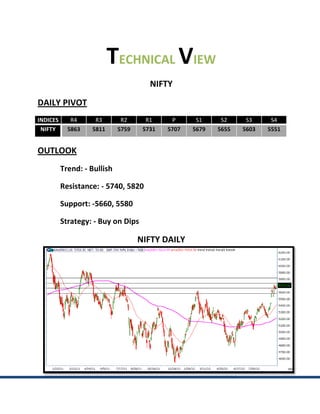
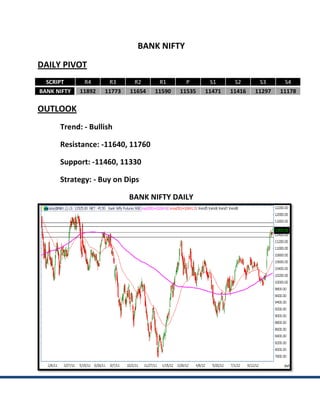

The Indian stock market indices rose on optimism about reforms in Spain helping manage its debt. The Sensex rose 0.99% and Nifty rose 0.95%. Among sectoral indices, S&P CNX Nifty rose 0.95% while CNX Junior rose 1.45%. Major contributors to the rise were ITC, HDFC, and Tata Motors. Hindalco and Power Grid Corp led gains among Nifty gainers while Reliance Infra and DLF led losses. FIIs were net buyers of Indian stocks while DIIs were net sellers. The technical outlook was bullish for both Nifty and Bank Nifty with support and resistance levels provided.


