Download to read offline


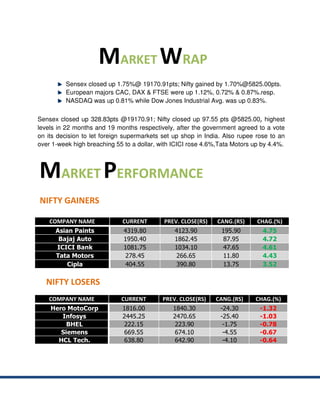
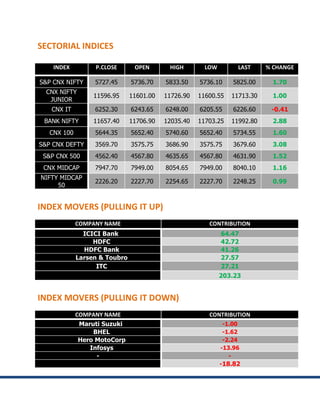
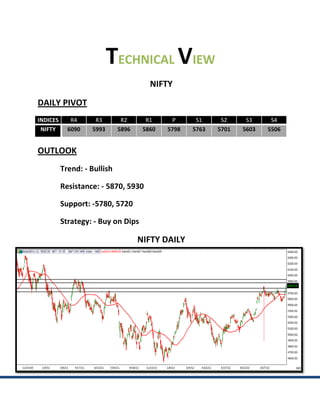

On November 30, 2012, the Sensex rose by 1.75% to 19,170.91 points, and the Nifty gained 1.70% to 5,825.00 points, marking their highest levels in 22 and 19 months respectively. Market gains were led by significant contributions from ICICI Bank and HDFC, while losses were noted from Hero MotoCorp and Infosys. The report emphasizes a bullish trend with recommendations to buy on dips for both the Nifty and Bank Nifty, alongside a disclaimer regarding the investment advice provided.


