Download to read offline


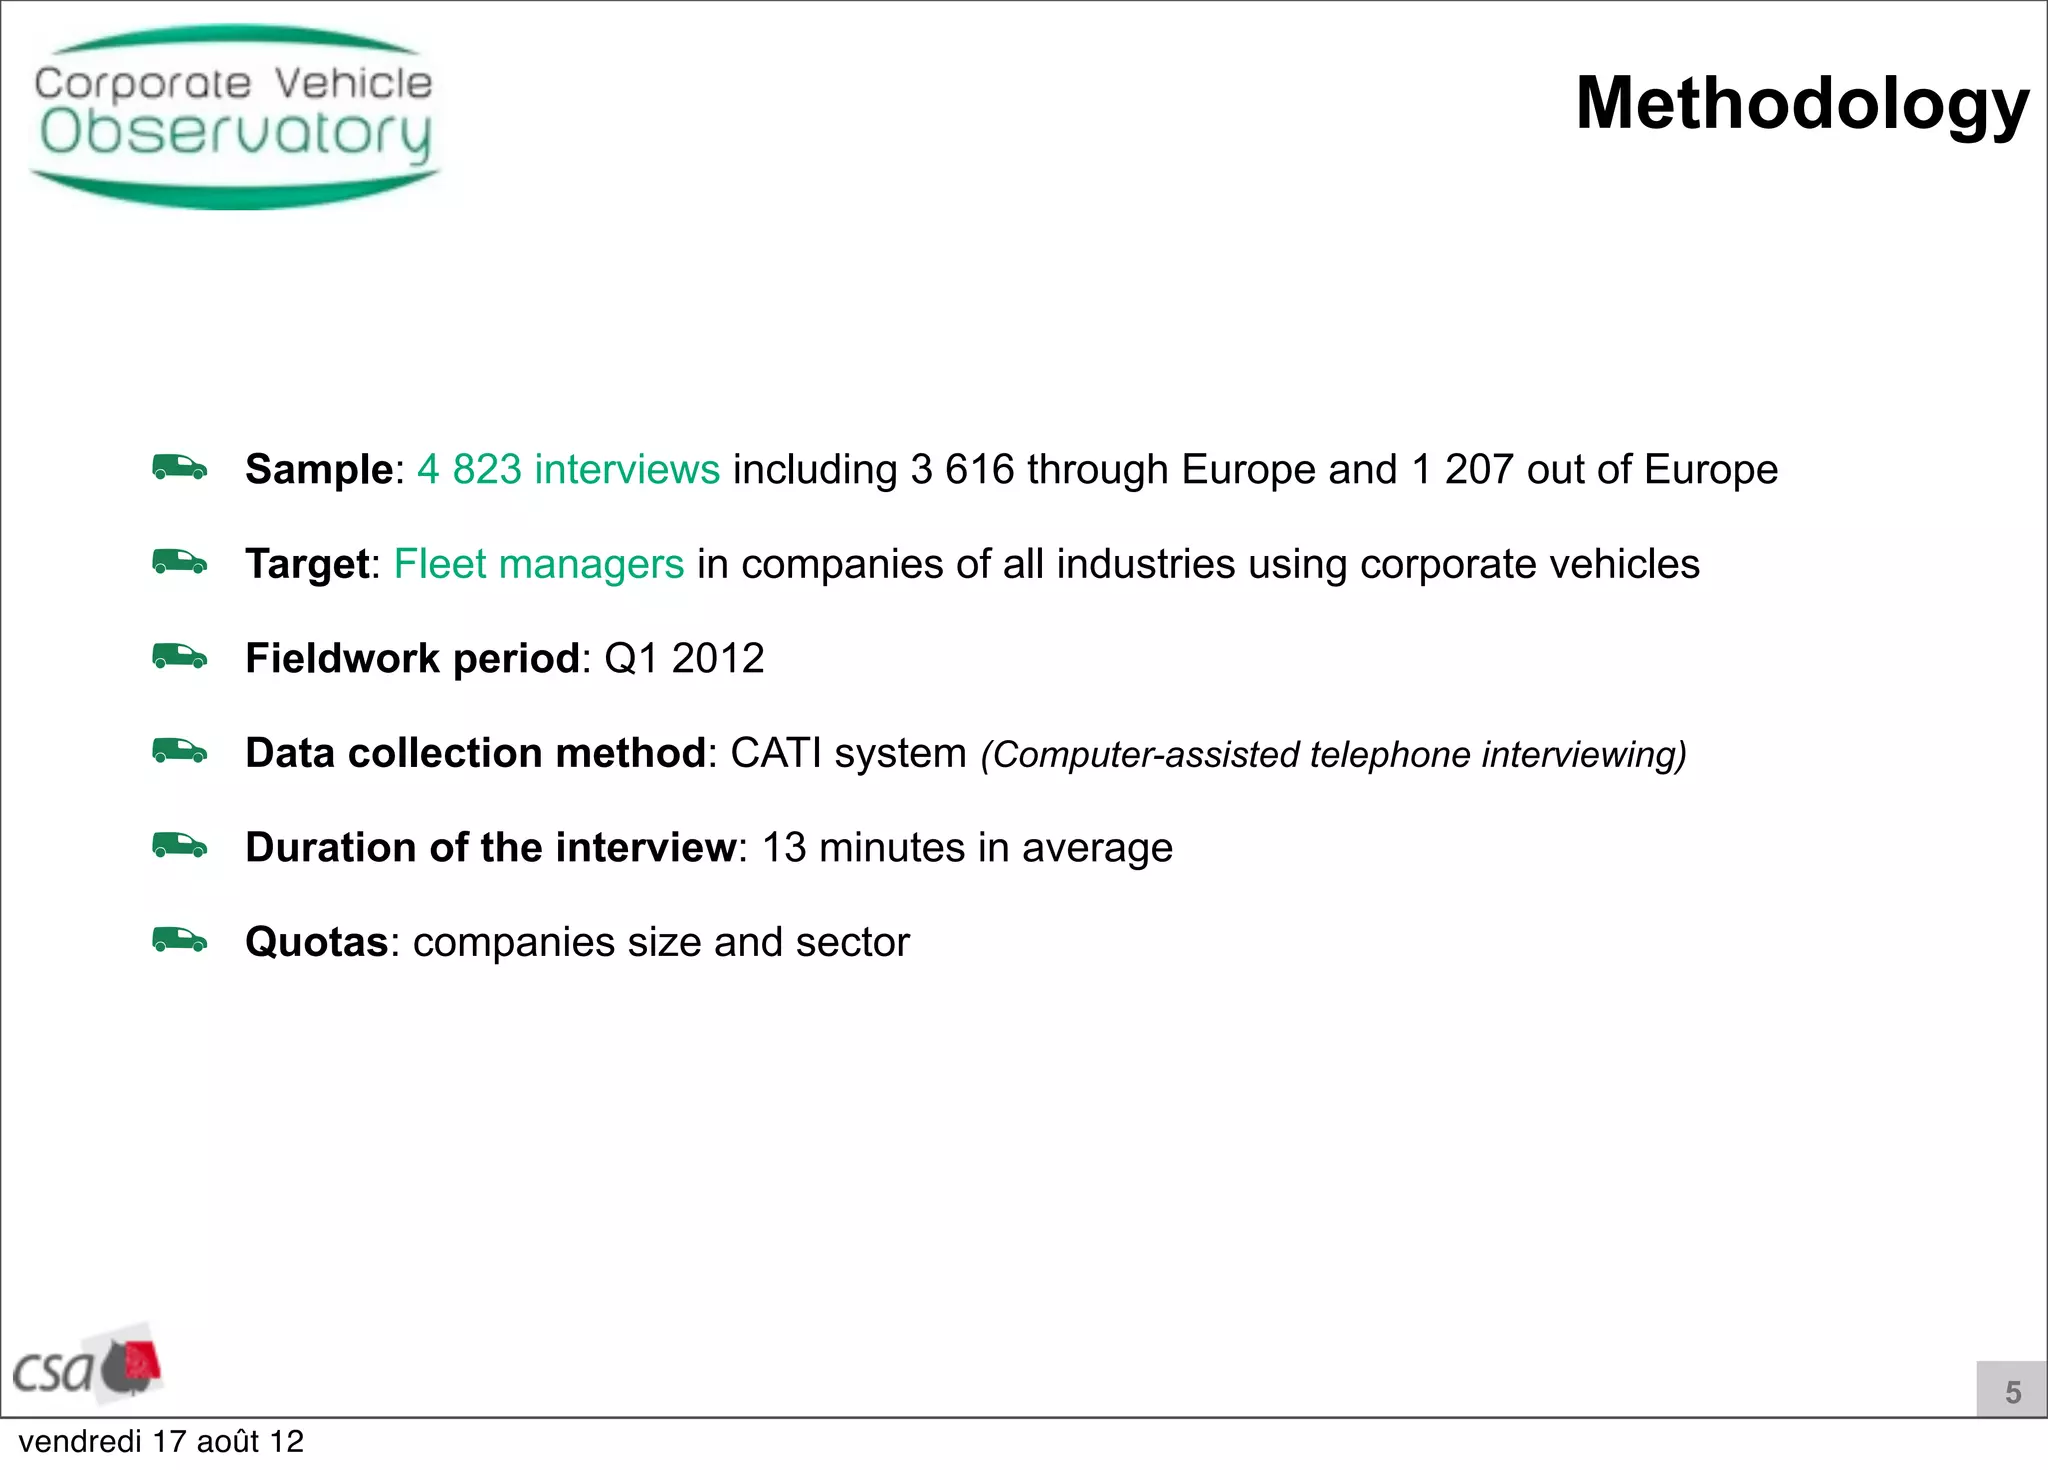
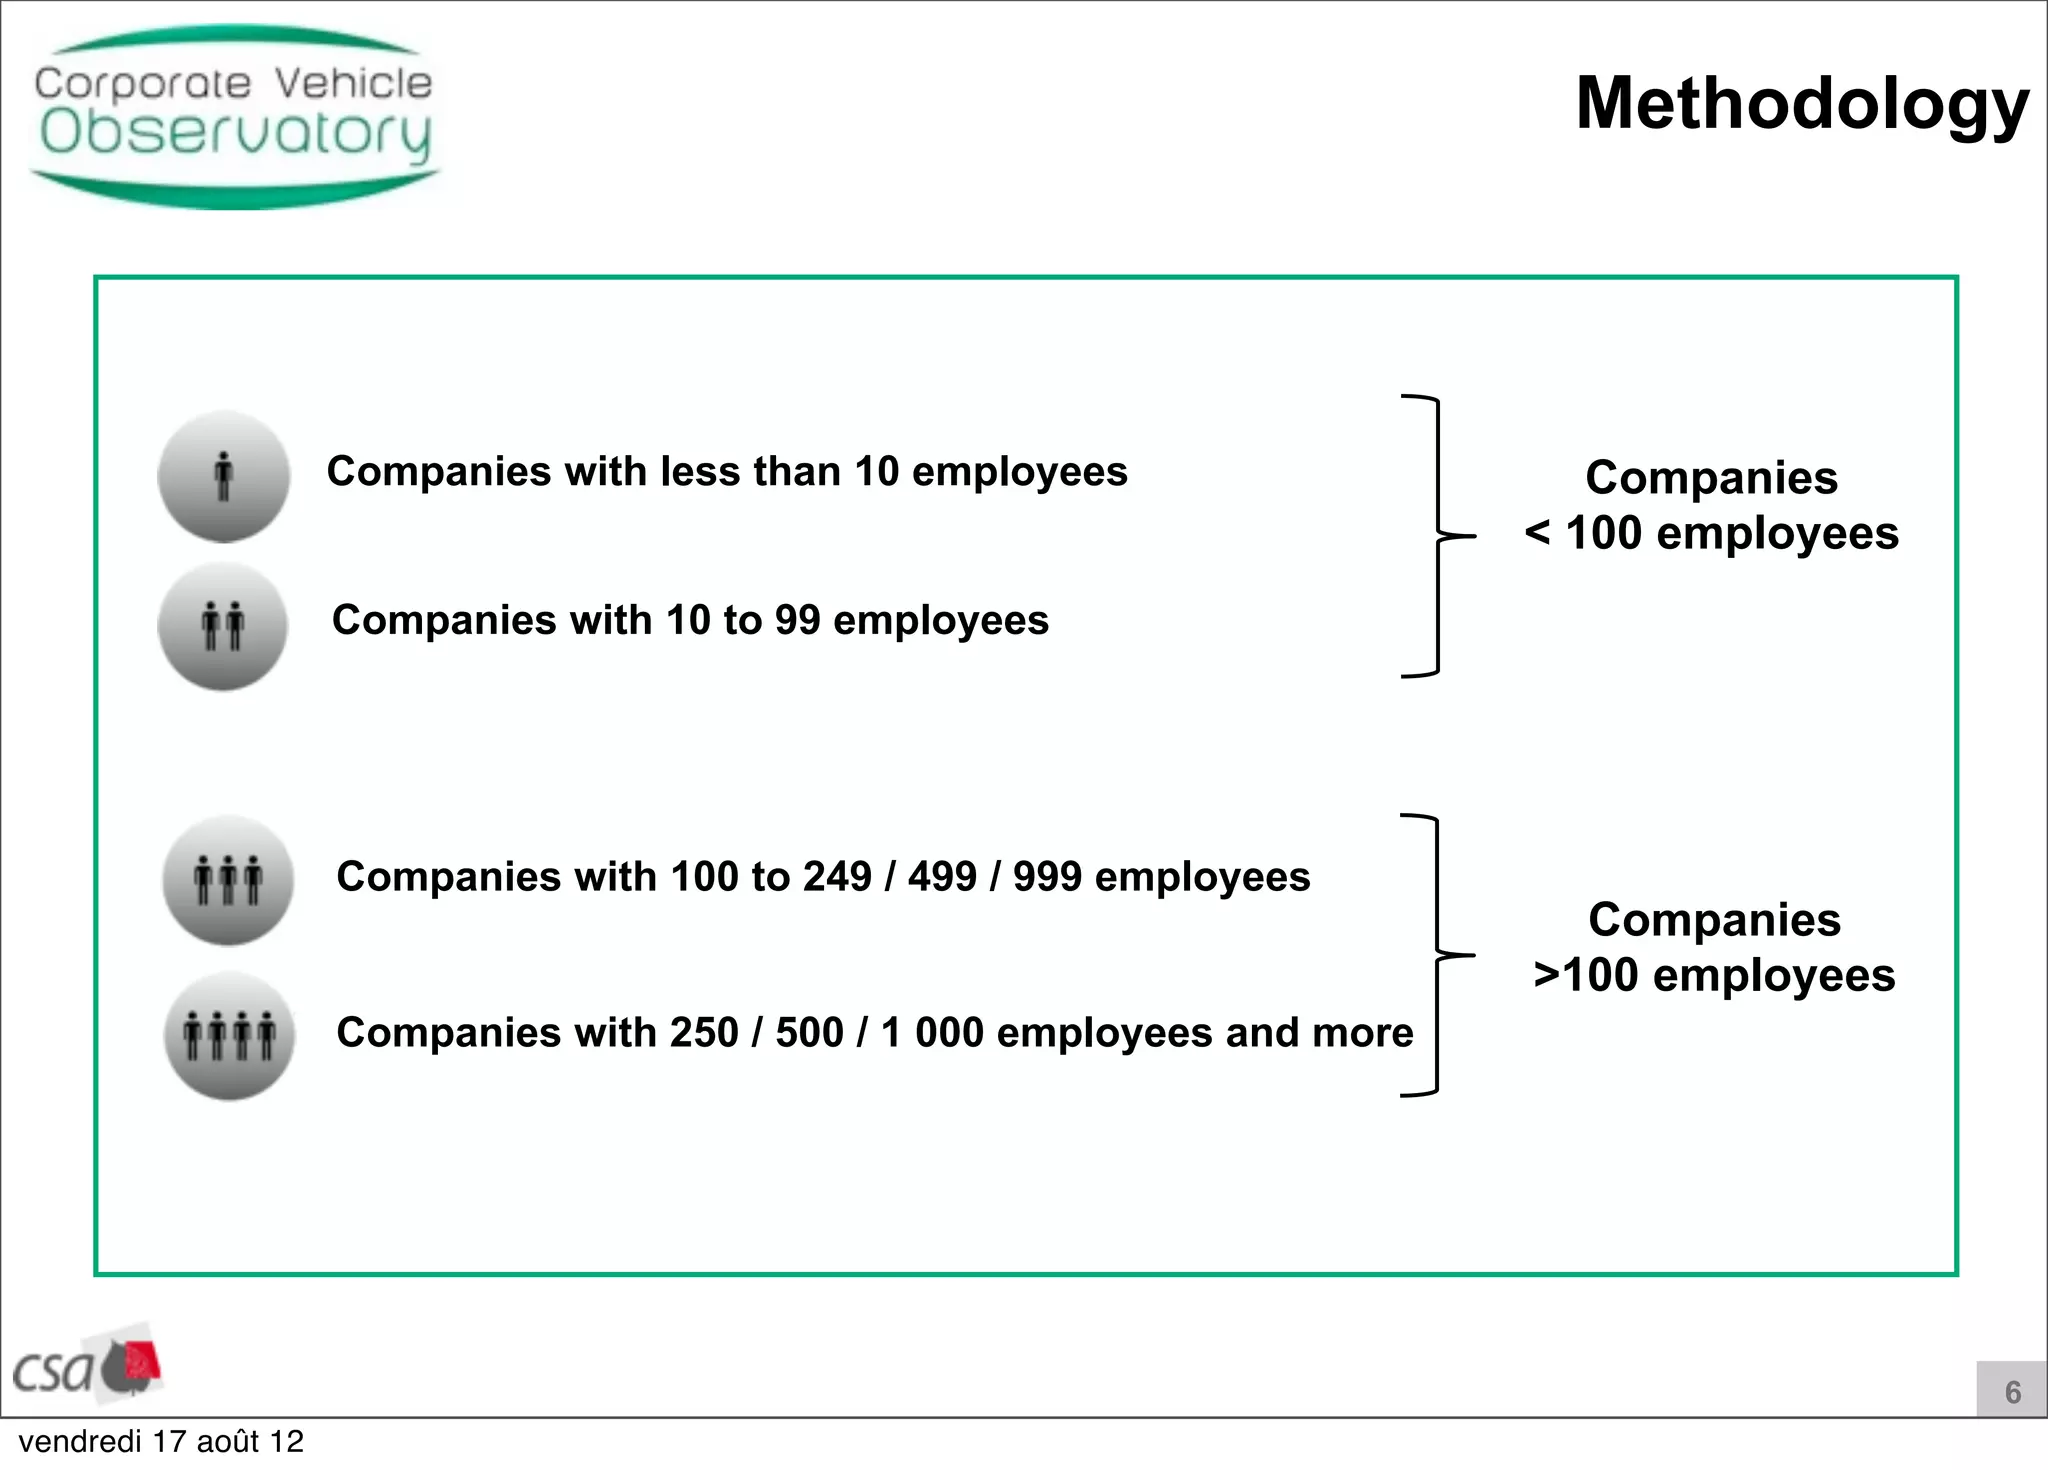
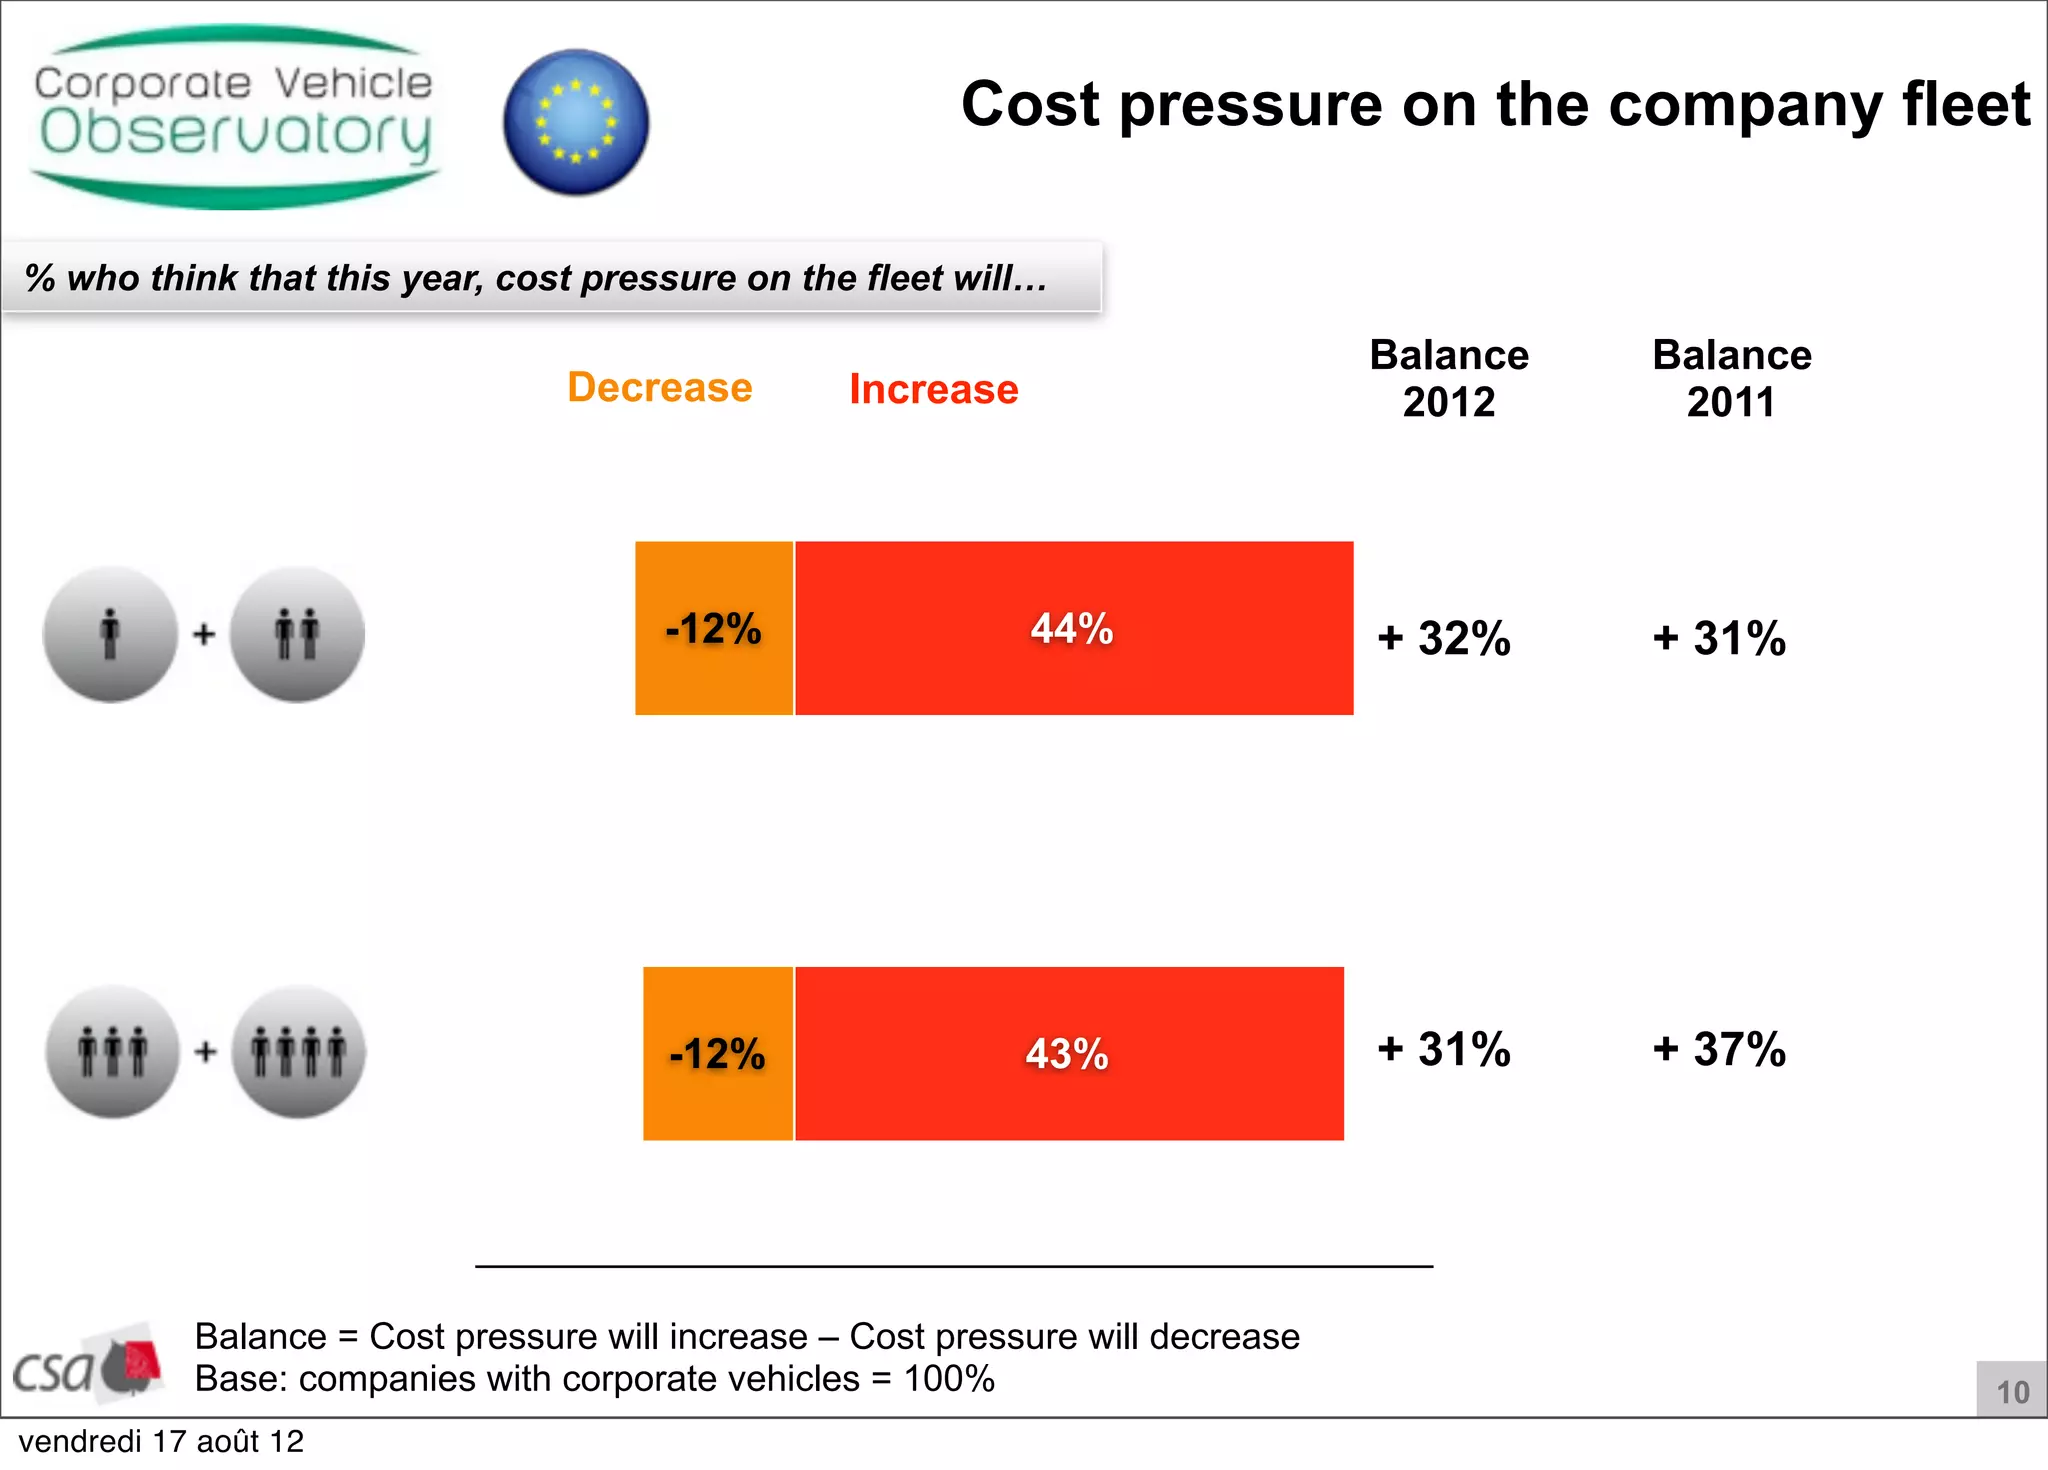
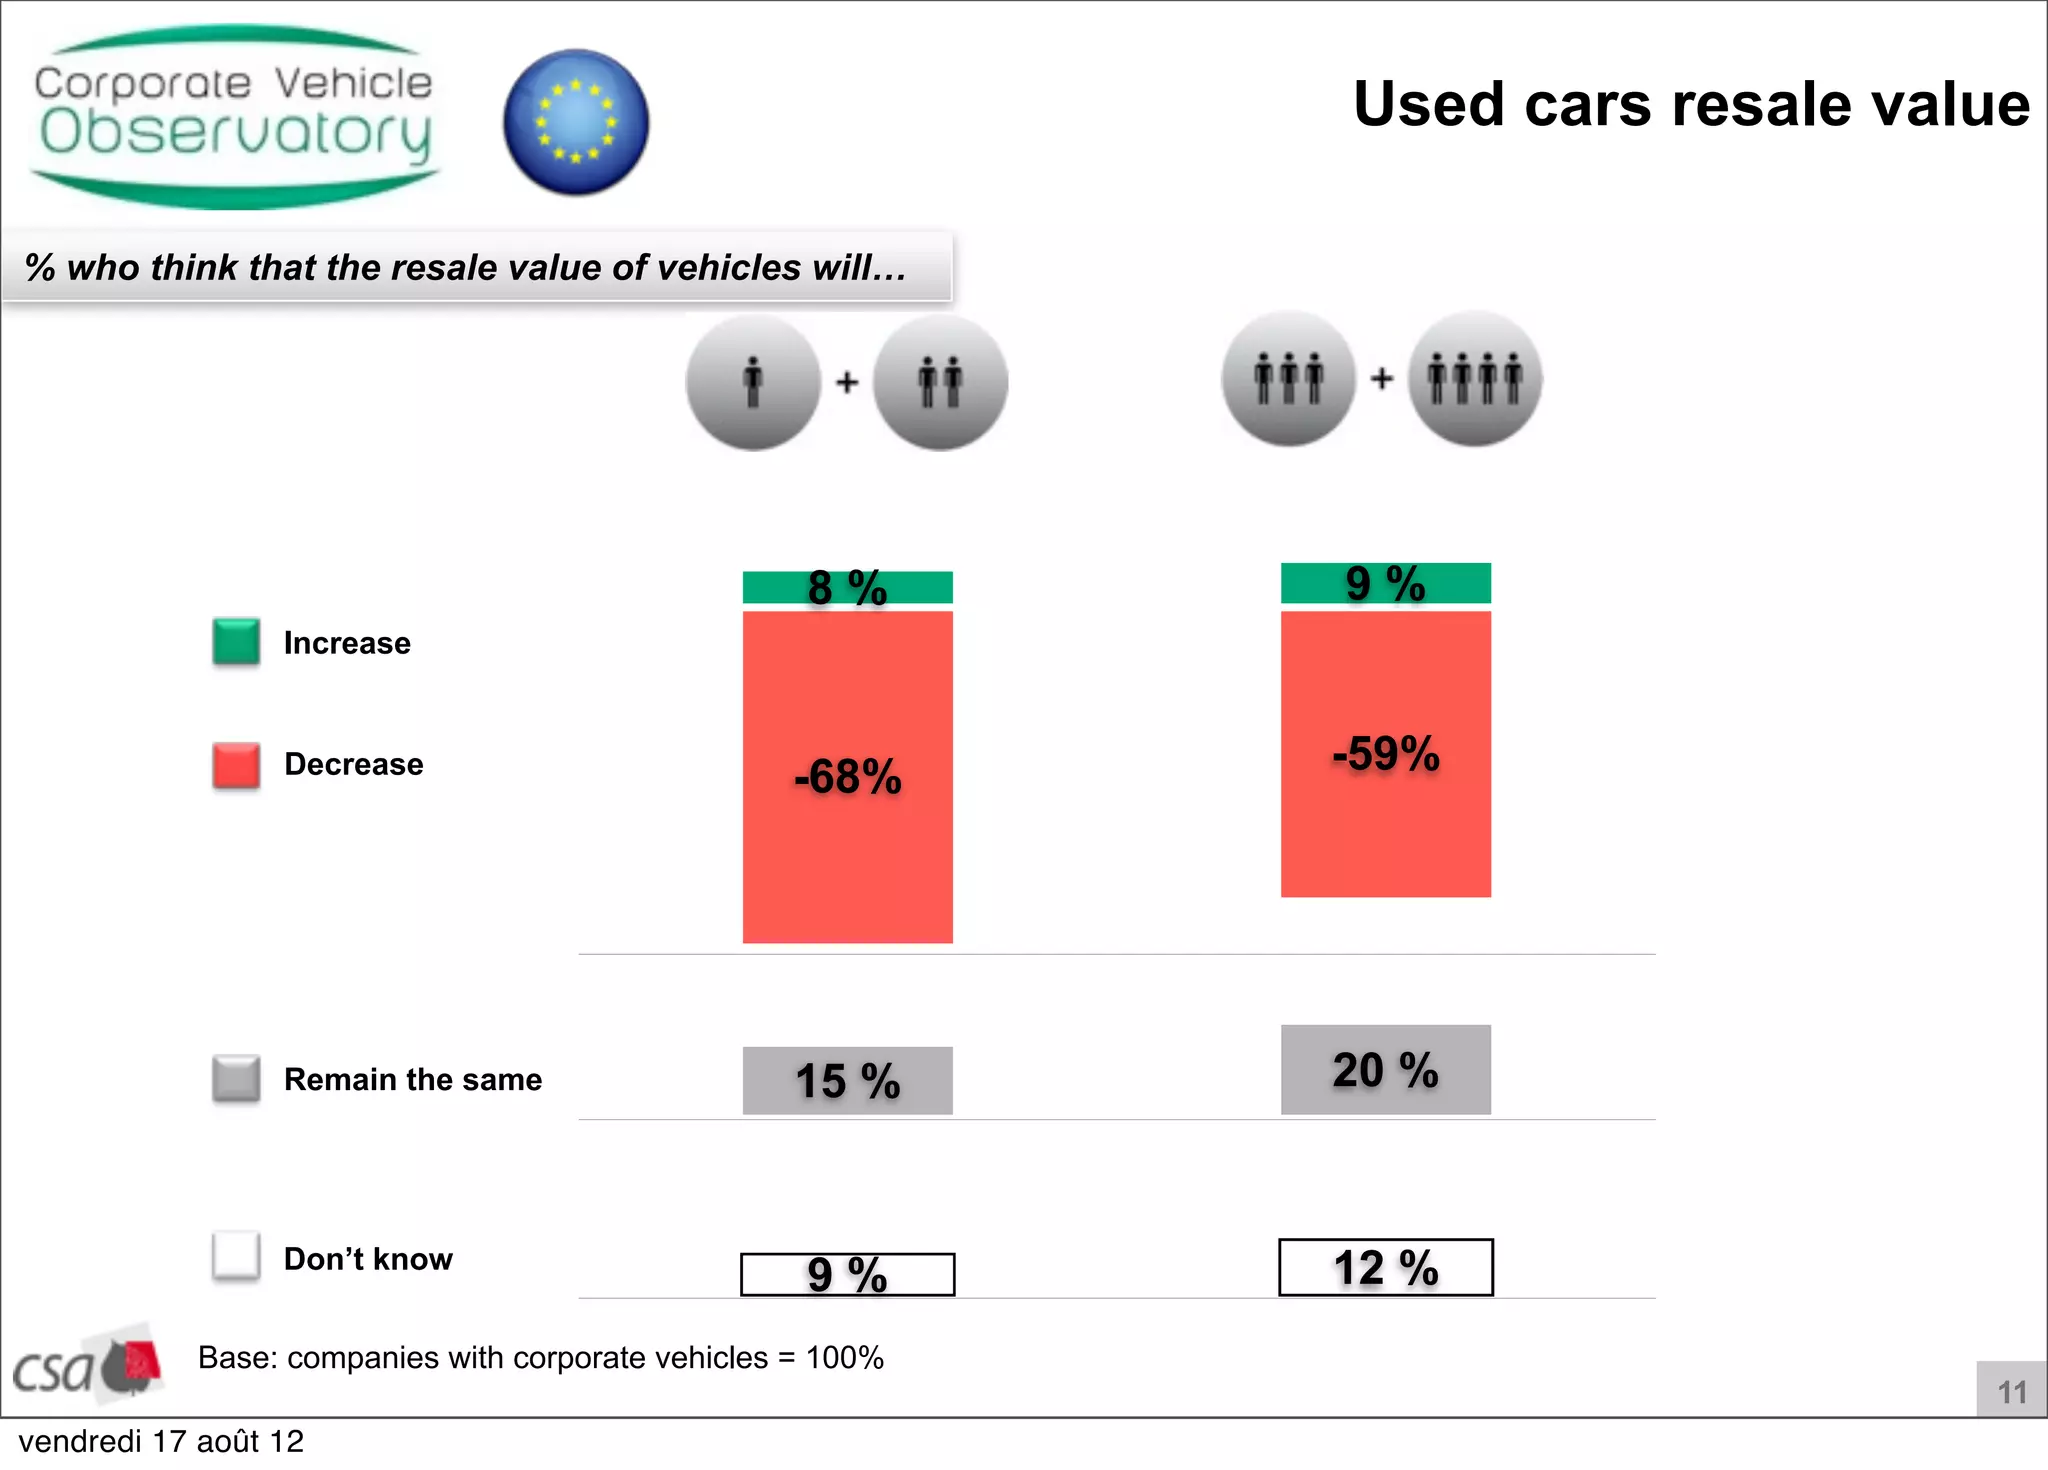
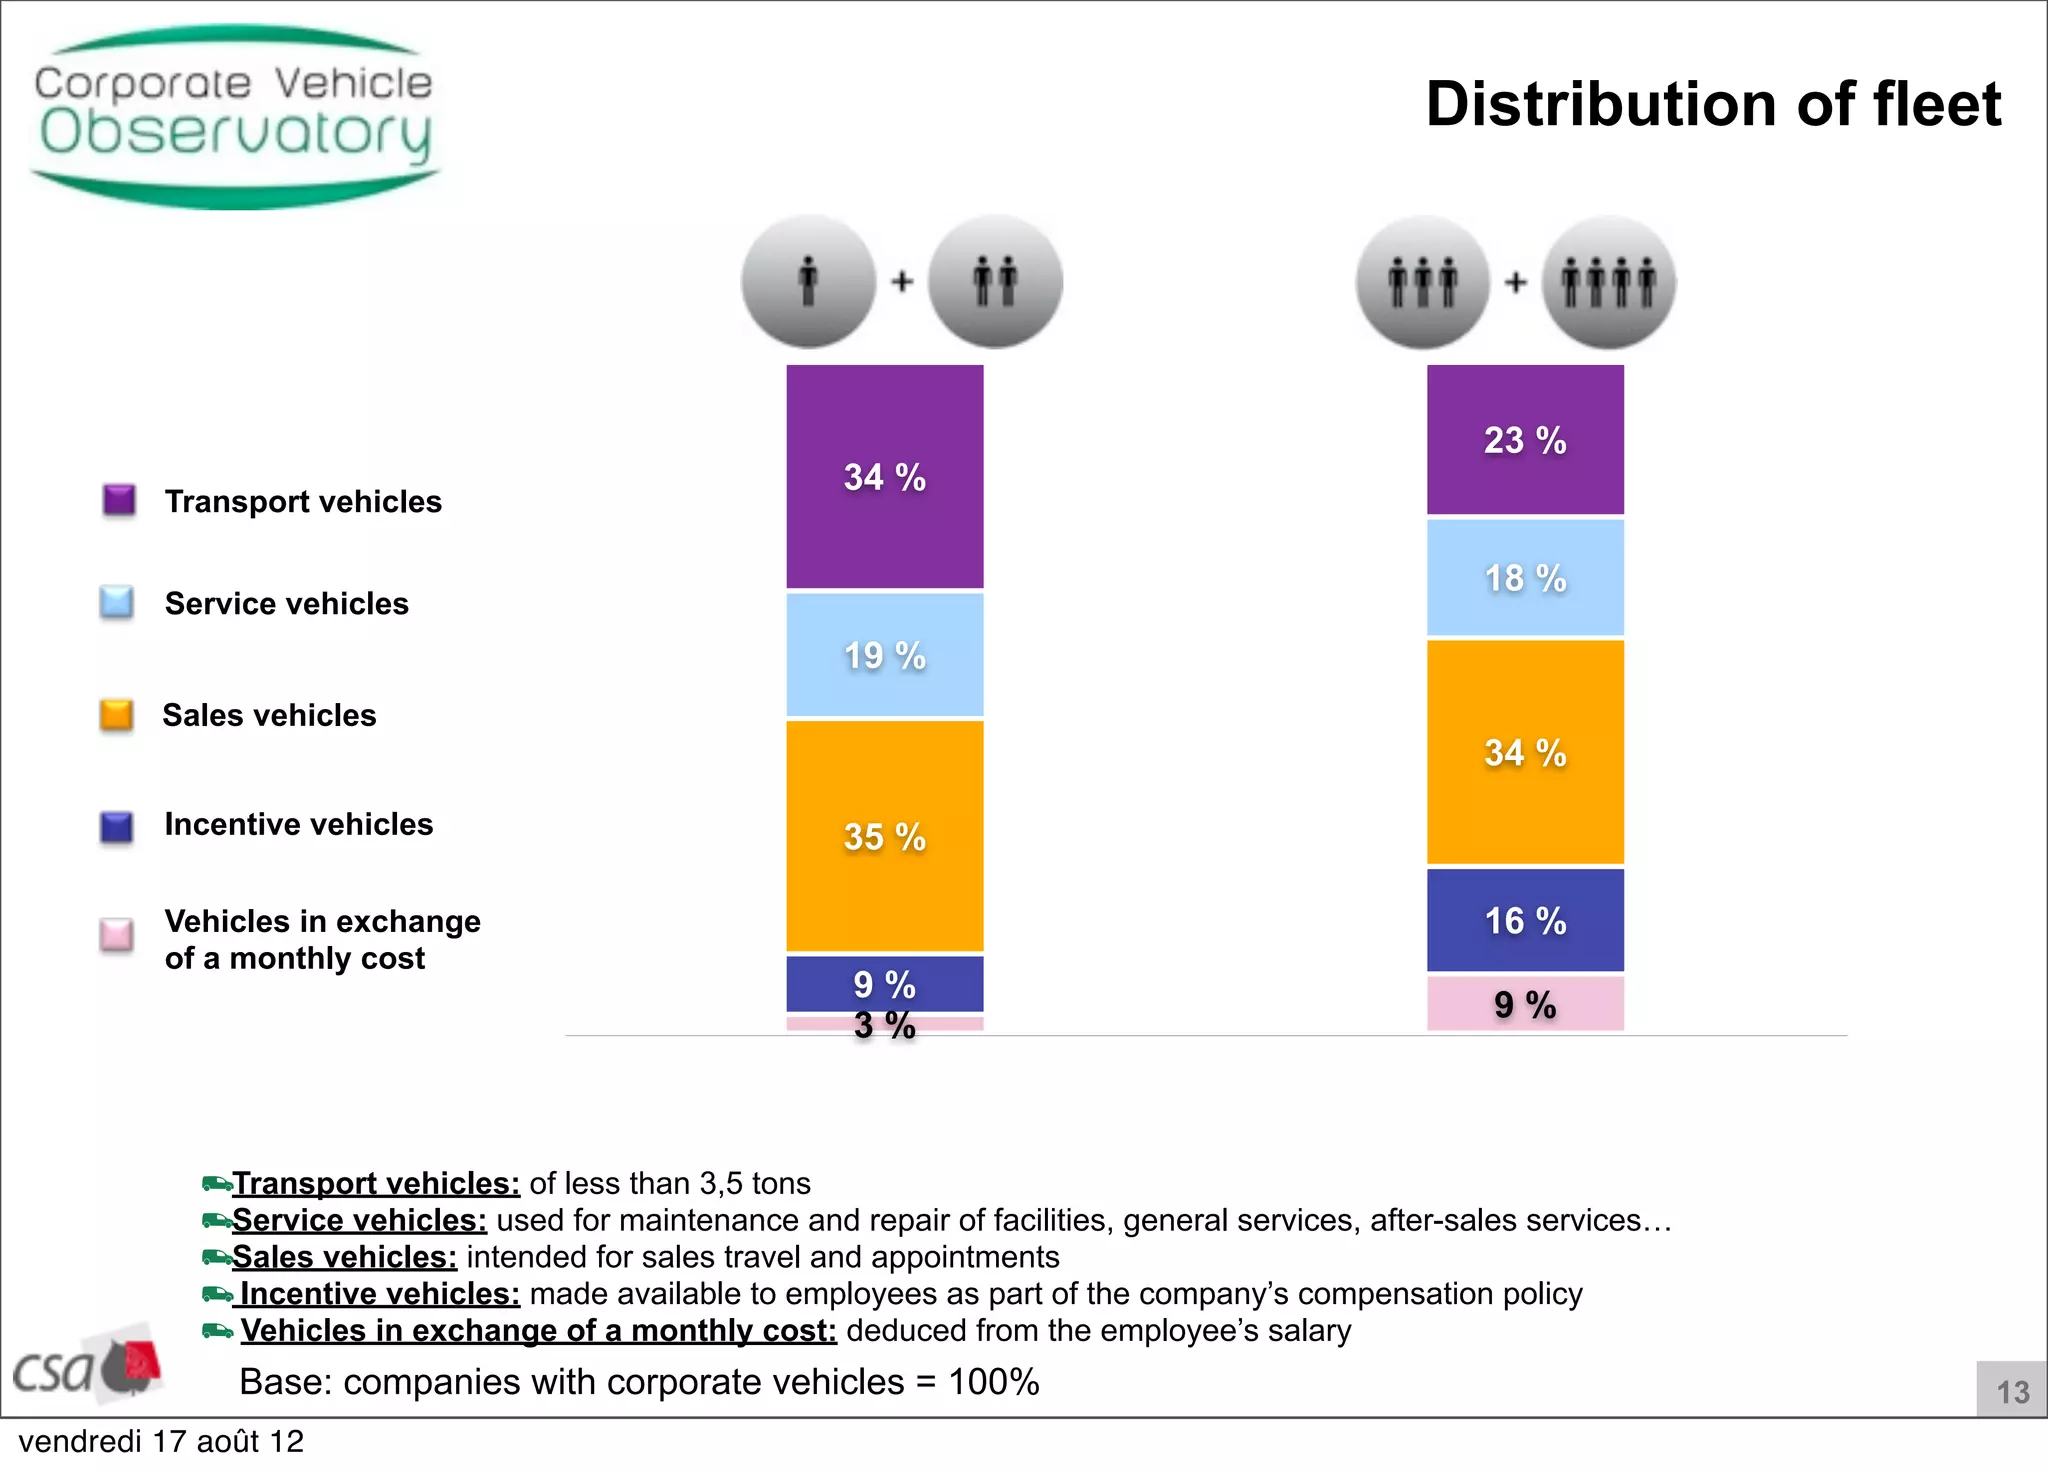

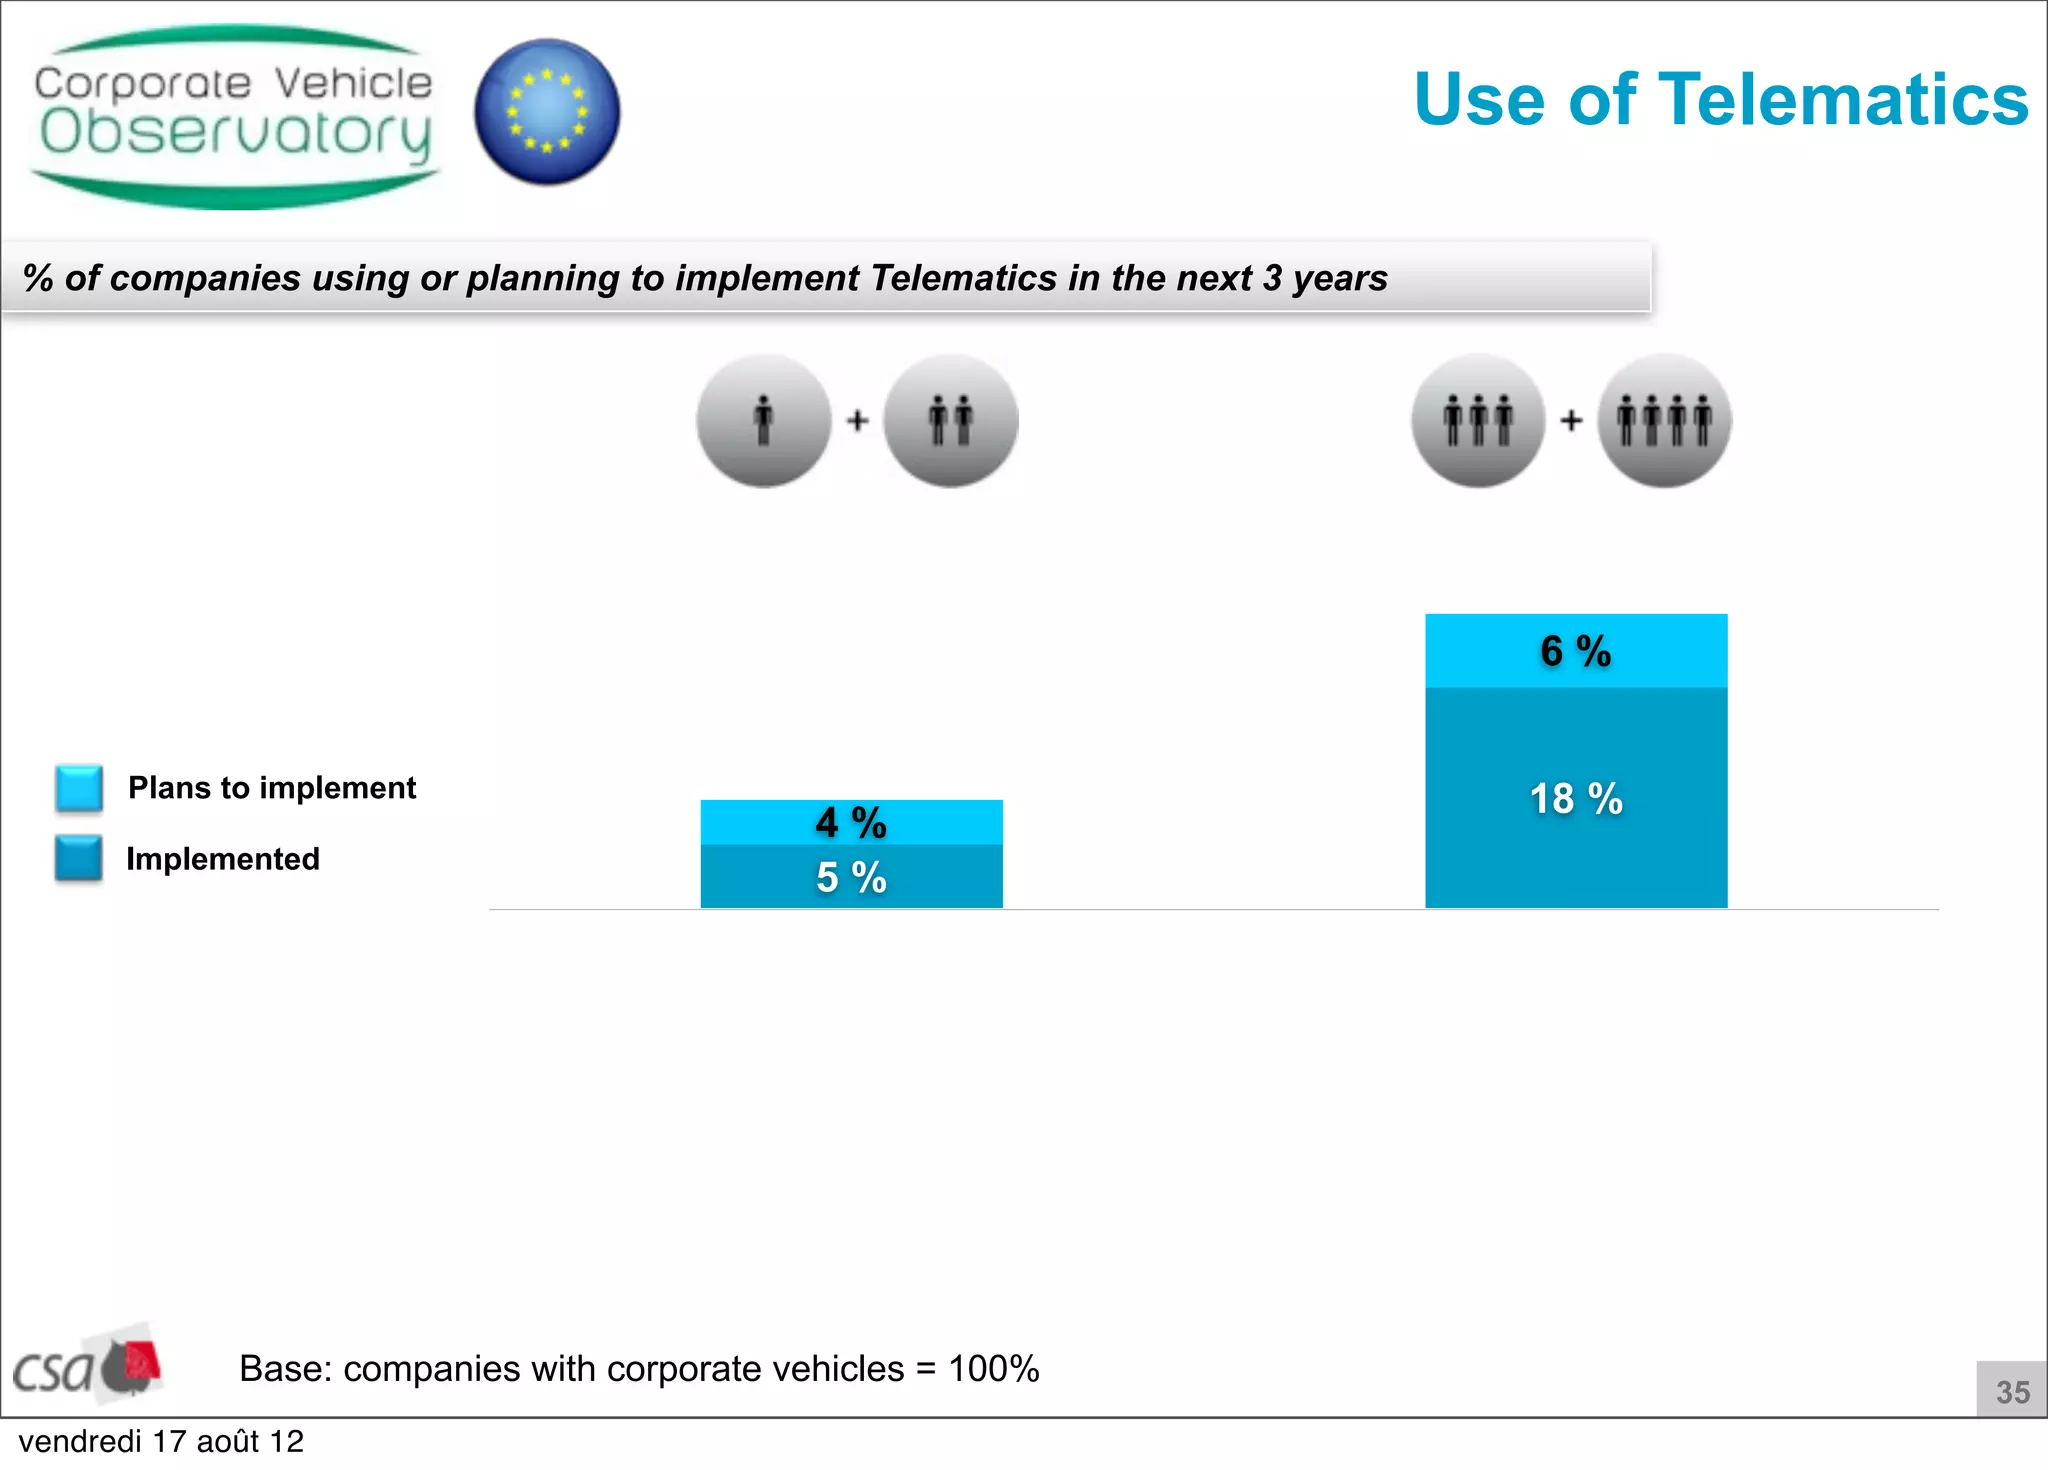
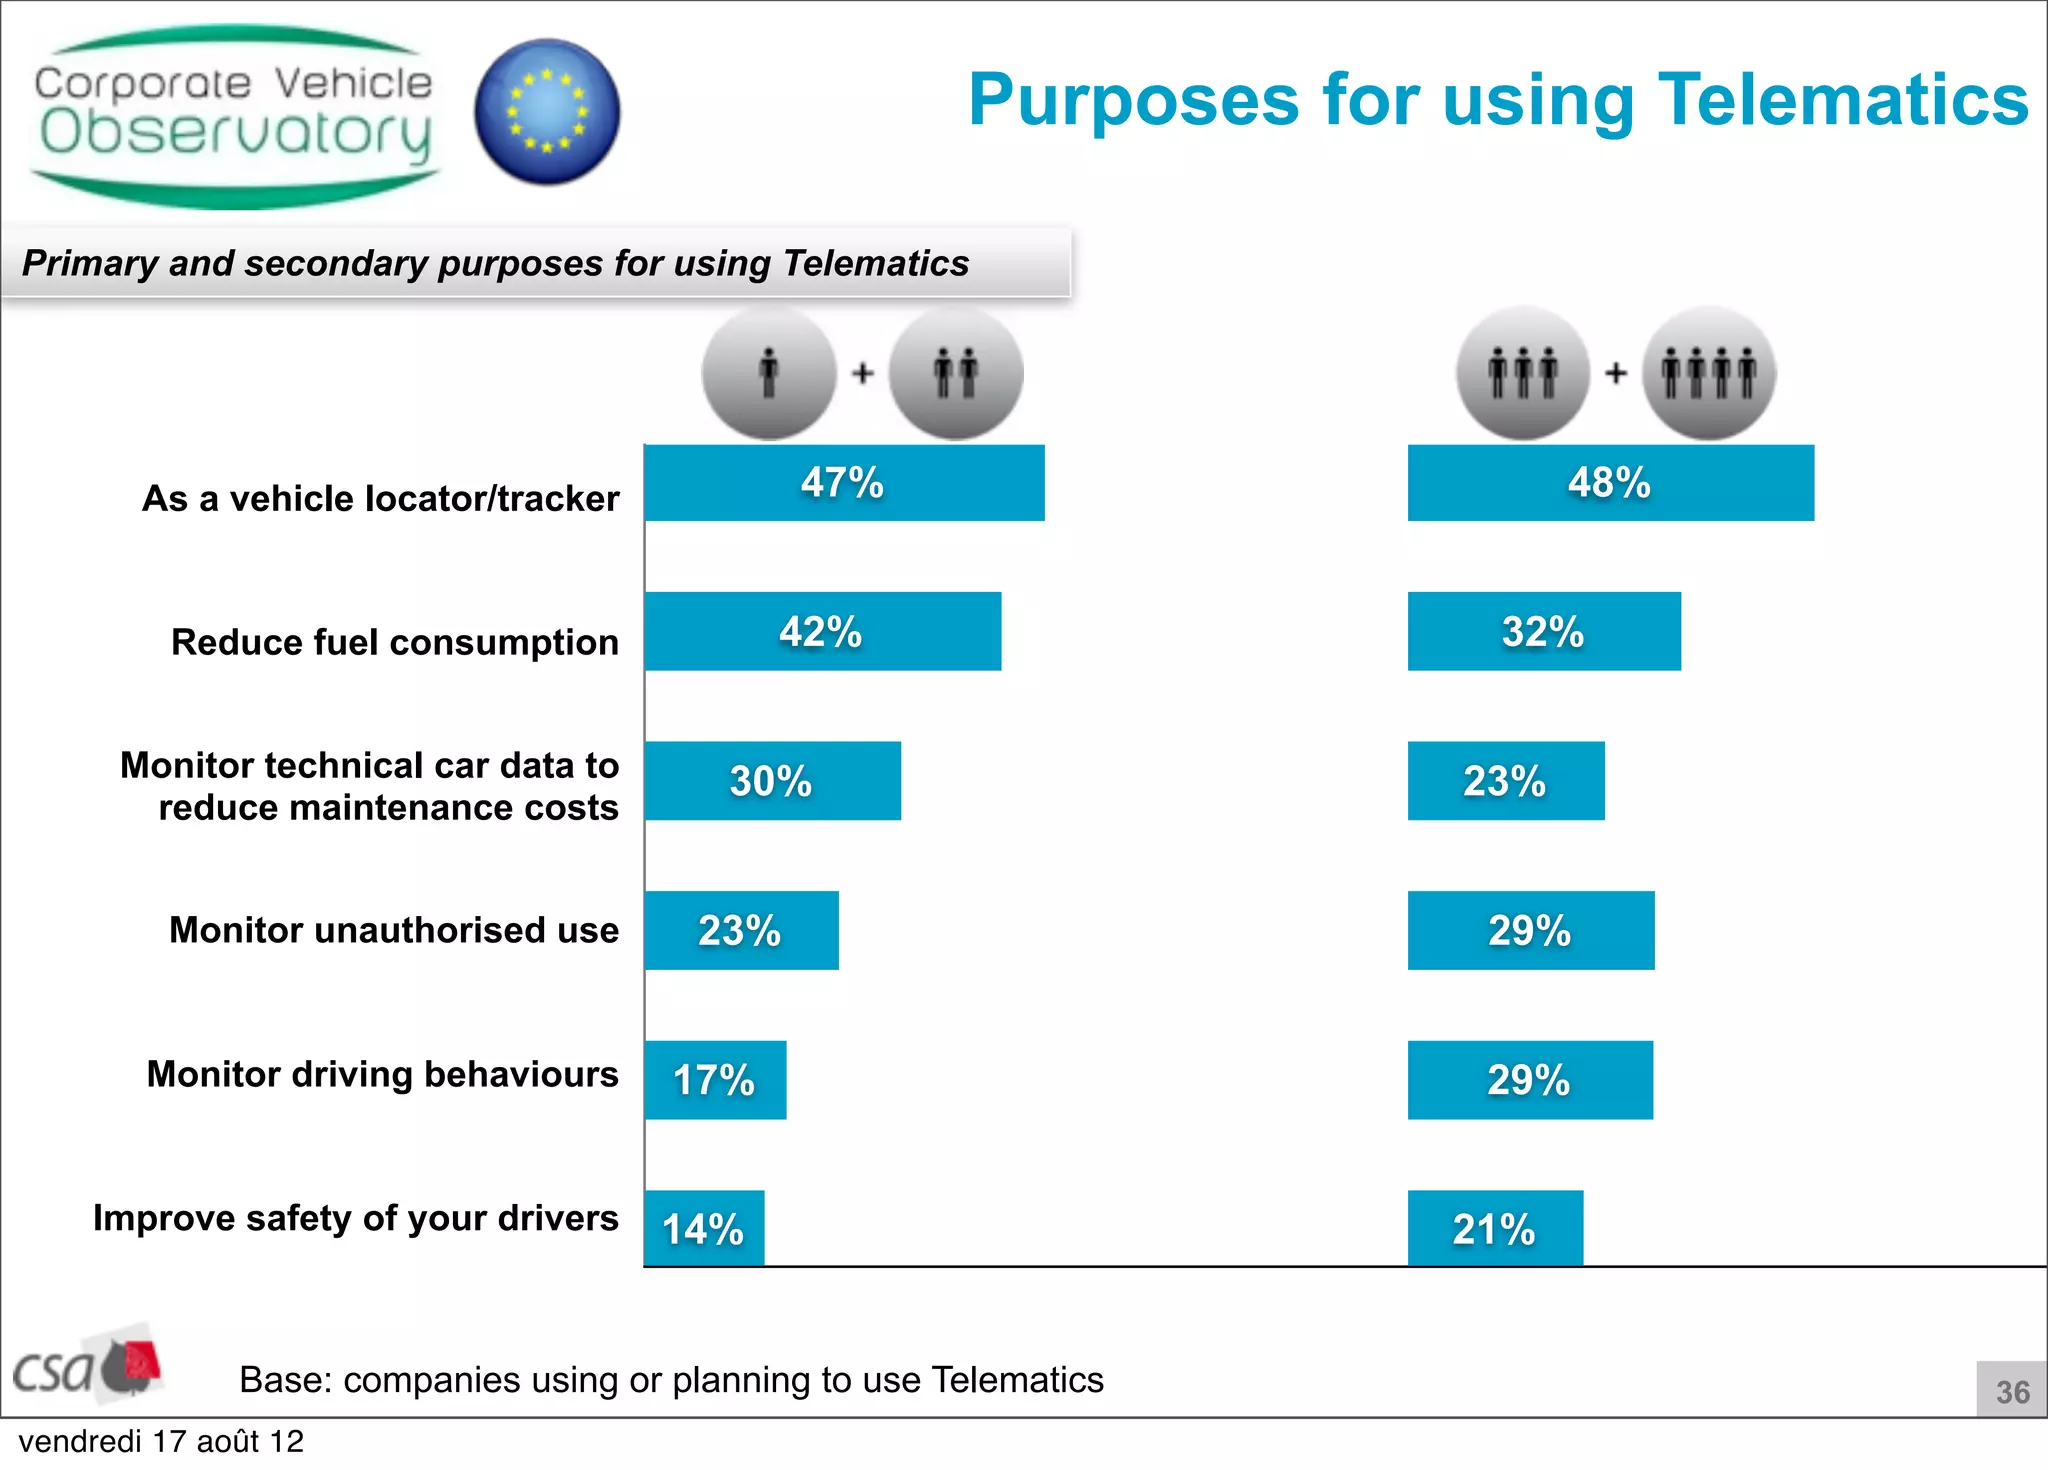
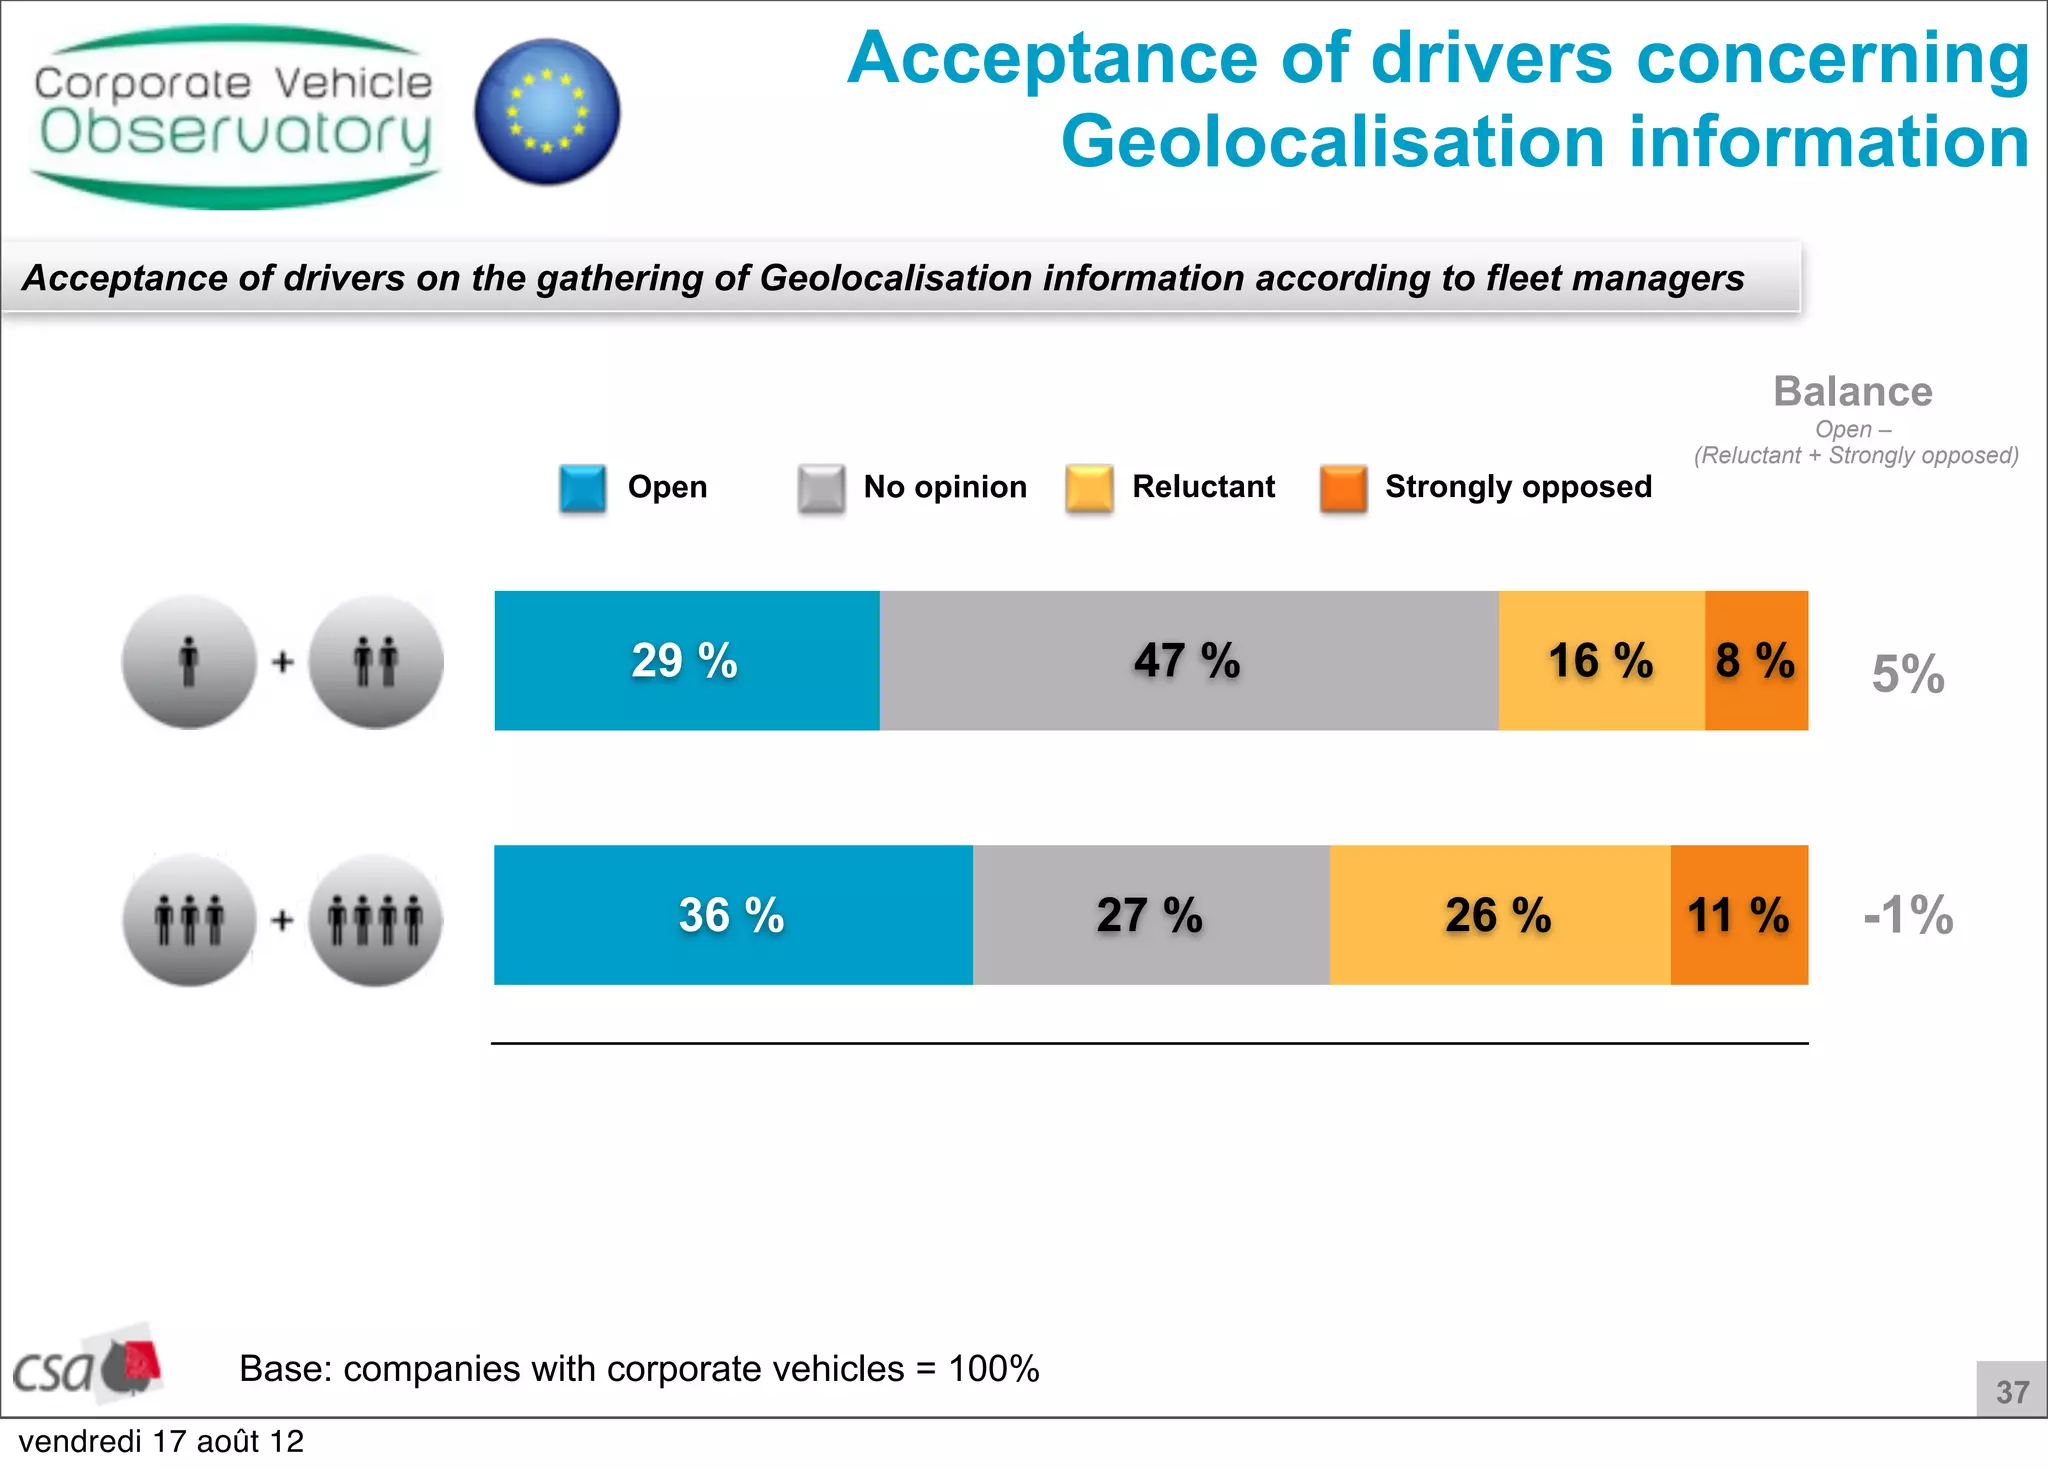
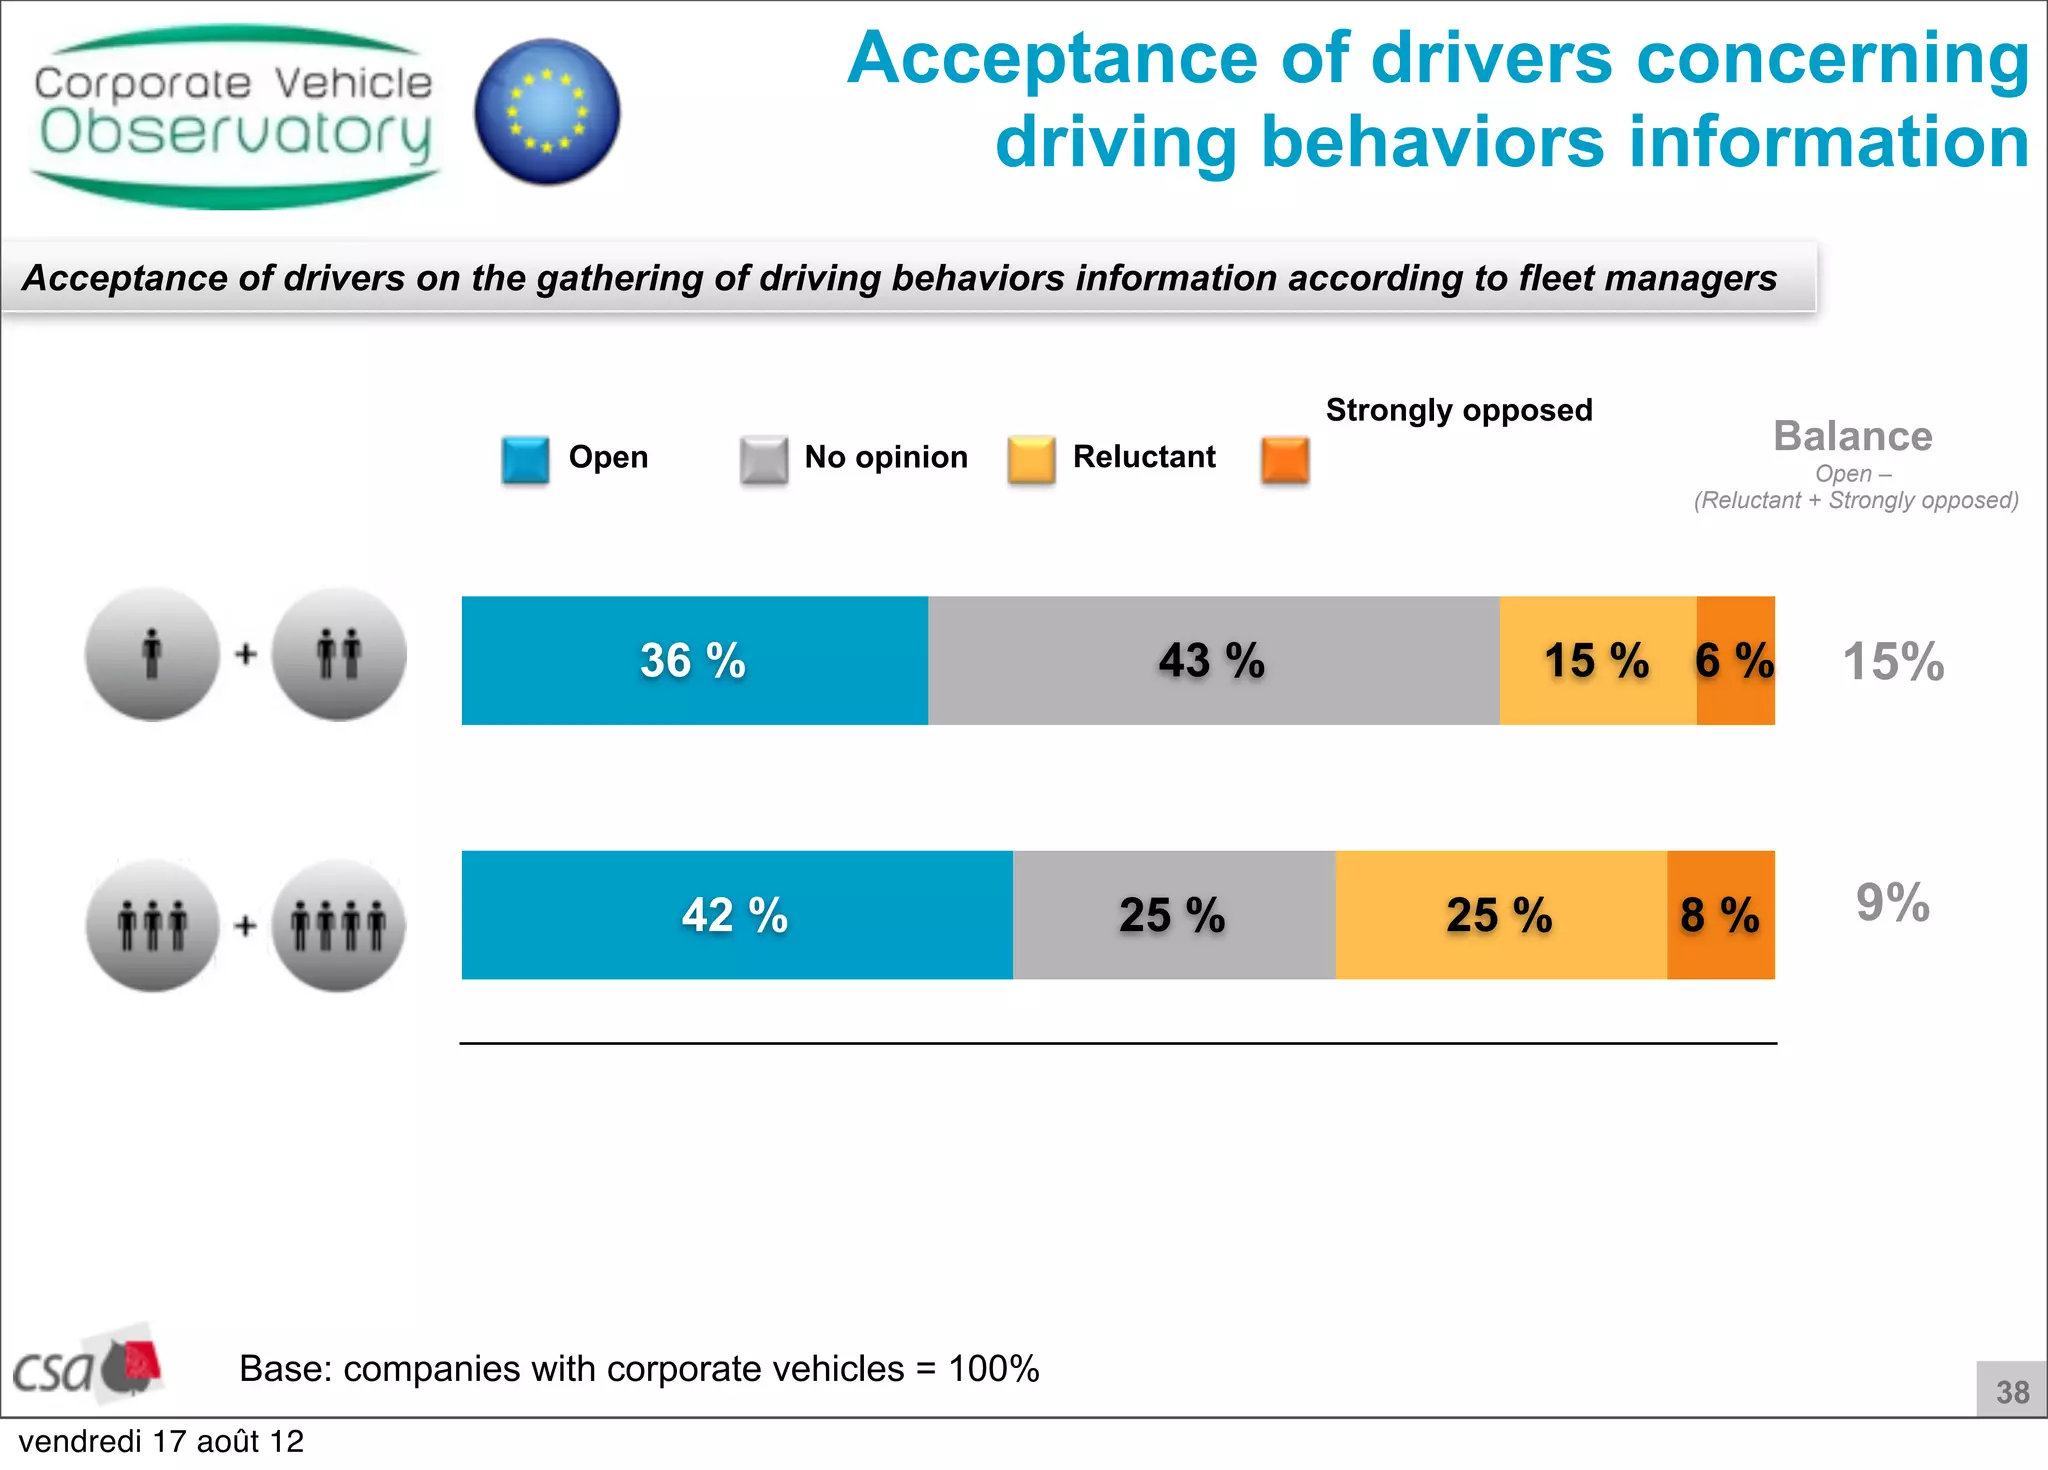

The 2012 International Fleet Barometer report is an expert platform initiated by Arval to analyze trends in professional mobility across Europe, focusing on fleet management and corporate vehicle usage. The report provides insights into decision-makers' attitudes, cost pressures, and the evolution of fleet policies, highlighting a shift towards electric vehicles and telematics usage. Methodology involved 4,823 interviews with fleet managers to gather data on various aspects of fleet management and operational efficiencies.


![Fy19 deloitte consulting llp ug case competition [team blue fountain]](https://cdn.slidesharecdn.com/ss_thumbnails/fy19deloitteconsultingllpugcasecompetition-teambluefountain-190209192048-thumbnail.jpg?width=640&height=640&fit=bounds)


