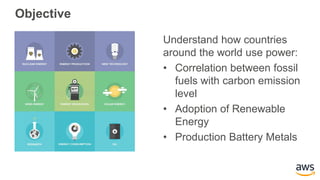
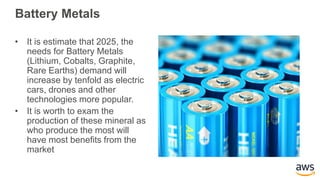
The document analyzes global energy usage, focusing on the relationship between fossil fuels and carbon emissions, the rise of renewable energy, and the demand for battery metals. It notes that major CO2 emissions come from developed nations like the USA, China, and India, despite claims attributing blame to developing countries. The report highlights the increasing consumption of renewable energy, particularly wind, with China leading in generation capacity, and emphasizes the growing demand for battery metals by 2025.


![[Custom Data] Ha Hoang](https://cdn.slidesharecdn.com/ss_thumbnails/hoanghaworkshopaws-211019041531-thumbnail.jpg?width=640&height=640&fit=bounds)

![[Provided Data - US] Khanh Ngo](https://cdn.slidesharecdn.com/ss_thumbnails/submition-211019042650-thumbnail.jpg?width=640&height=640&fit=bounds)
![[Provided Data - US] Chi Cuong Nguyen](https://cdn.slidesharecdn.com/ss_thumbnails/aws-datastorytellingwithquicksight-nguyenchicuong-211019041015-thumbnail.jpg?width=640&height=640&fit=bounds)
![[Provided Data - US] Thien Tran](https://cdn.slidesharecdn.com/ss_thumbnails/thientran-211019041901-thumbnail.jpg?width=640&height=640&fit=bounds)
![[Custom Data] Alice Nguyen](https://cdn.slidesharecdn.com/ss_thumbnails/alicenguyenawsdevax2021-211019042627-thumbnail.jpg?width=640&height=640&fit=bounds)

![[Custom data] Ngo Duy Vu](https://cdn.slidesharecdn.com/ss_thumbnails/ngoduyvupresentation-211019040032-thumbnail.jpg?width=640&height=640&fit=bounds)
![[Custom Data] Hy Dang](https://cdn.slidesharecdn.com/ss_thumbnails/datastory-tellingwithawsquicksightbyhydang-211019041800-thumbnail.jpg?width=640&height=640&fit=bounds)
![[Provided Data - US] Hang Le](https://cdn.slidesharecdn.com/ss_thumbnails/use-commercehangle-211019043253-thumbnail.jpg?width=640&height=640&fit=bounds)
![[Provided Data - US] ChiQuyen Dinh](https://cdn.slidesharecdn.com/ss_thumbnails/datastorytellingwithawsquicksightquyendinhpdf-211019041142-thumbnail.jpg?width=640&height=640&fit=bounds)
![[Provided Data - Brazil] Dương Hà Nguyễn Hoàng](https://cdn.slidesharecdn.com/ss_thumbnails/data-story-telling-ha-nguyen-hoang-duong-brasil-dataset-211019041642-thumbnail.jpg?width=640&height=640&fit=bounds)
![[Provided Data - Brazil] Hung Nguyen](https://cdn.slidesharecdn.com/ss_thumbnails/brazilecom-datastorytelling-211019043402-thumbnail.jpg?width=640&height=640&fit=bounds)
![[Provided Data - Brazil] Vuong.le](https://cdn.slidesharecdn.com/ss_thumbnails/vuong-211019040512-thumbnail.jpg?width=640&height=640&fit=bounds)
![[Custom Data] Alice Nguyen](https://cdn.slidesharecdn.com/ss_thumbnails/alicenguyenawsdevax2021-211019040708-thumbnail.jpg?width=640&height=640&fit=bounds)
![[Provided data - Brazil] Tran Manh Cuong](https://cdn.slidesharecdn.com/ss_thumbnails/cuong-211019040350-thumbnail.jpg?width=640&height=640&fit=bounds)
![[Provided Data - US] Thao Phi](https://cdn.slidesharecdn.com/ss_thumbnails/datastorytellingphilamphuongthao-211019030856-thumbnail.jpg?width=640&height=640&fit=bounds)
![[Provided Data - Brazil] Ethan Phan](https://cdn.slidesharecdn.com/ss_thumbnails/datastorytellingawsquicksight-ethan-211019041246-thumbnail.jpg?width=640&height=640&fit=bounds)
![[Provided Data - US] Tran Chau](https://cdn.slidesharecdn.com/ss_thumbnails/use-commerce-devax2-211019041347-thumbnail.jpg?width=640&height=640&fit=bounds)


![[DSC Europe 25] Milovan Jovicic - Beyond AI's Reach: The Enduring Value of Ev...](https://cdn.slidesharecdn.com/ss_thumbnails/pyeij0hurgwq5jugmtnv-2-milovan-jovicic-beyond-ais-reach-the-enduring-value-of-evergreen-design-v2-260120105856-d6ee57e5-thumbnail.jpg?width=640&height=640&fit=bounds)
![[DSC Europe 25] Borko Kozomora - Optimizing business workflows with advances ...](https://cdn.slidesharecdn.com/ss_thumbnails/hbgekyb0txw0xpo4yfml-borko-kozomora-leading-ai-transformation-260122103838-cc29ee38-thumbnail.jpg?width=640&height=640&fit=bounds)


![[DSC Europe 25] Bojan Banjac - AI is always right when it comes to the matter...](https://cdn.slidesharecdn.com/ss_thumbnails/syoxtqierpydwxm5srcb-4-bojan-banjac-ai-is-always-right-when-it-comes-to-the-matters-of-taste-260119101519-694ee7d7-thumbnail.jpg?width=640&height=640&fit=bounds)

![[DSC Europe 25] Laila Kakar - Leveraging AI for Strategic Excellence: Enhanci...](https://cdn.slidesharecdn.com/ss_thumbnails/eykmhrtsqmaaftwkexh7-dsc-lailakakar-1-260119101520-5f3b5616-thumbnail.jpg?width=640&height=640&fit=bounds)

![[DSC Europe 25] Dubravko Culibrk - Deep Learning for Mammography.pptx](https://cdn.slidesharecdn.com/ss_thumbnails/yiscimuktacgqoiu4dkp-deep-learning-for-mammography-260119121559-aad59182-thumbnail.jpg?width=640&height=640&fit=bounds)


