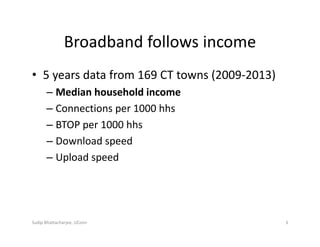
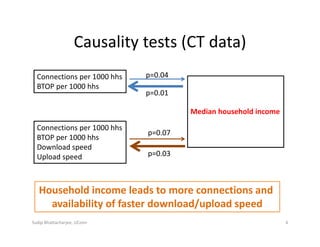
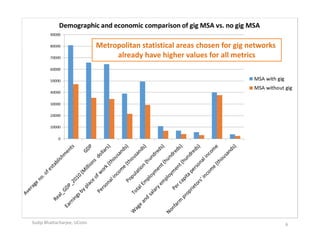
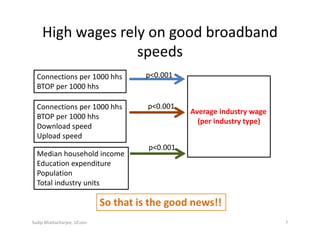
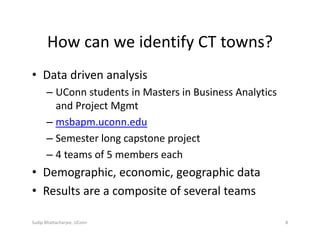
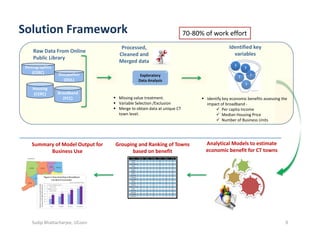
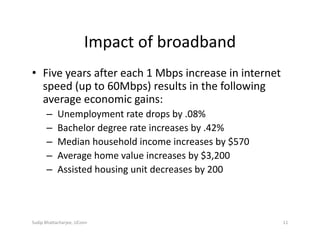
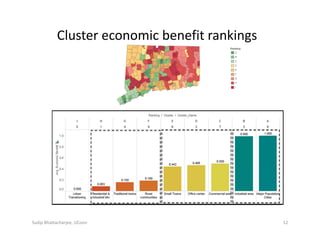
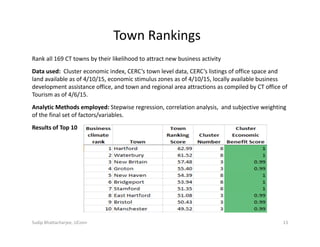
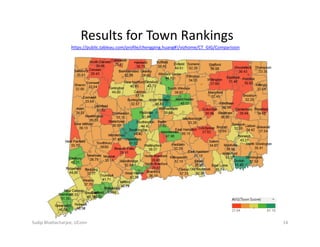
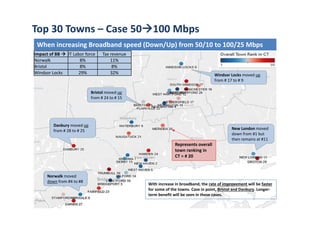
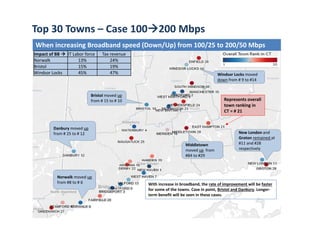
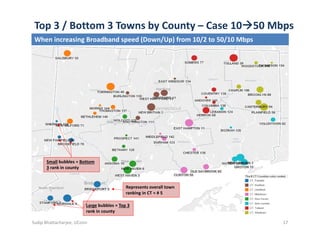
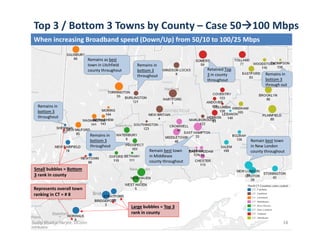
The Economic Impact of Gig Networks 
Sudip Bhattacharjee
Associate Professor
School of Business, University of Connecticut
sbhattacharjee@business.uconn.edu
Moving Towards A Gigabit State: 
Planning and Financing Municipal Ultra‐High‐Speed Internet Fiber Networks 
Through Public‐Private Partnerships
Yale School of Management
May 04, 2015
Presentation video at http://ct‐n.com/ctnplayer.asp?odID=11499 (copy & paste)
Starts at 2:45 hrs, with an introduction by Catherine Smith, Commissioner, 
Department of Economic and Community Development at 2:42 hrs. 
Does broadband lead to economic 
development?
Sudip Bhattacharjee, UConn 2
YES NO
Really?
Broadband follows income
• 5 years data from 169 CT towns (2009‐2013)
– Median household income
– Connections per 1000 hhs
– BTOP per 1000 hhs
– Download speed
– Upload speed
Sudip Bhattacharjee, UConn 3
Causality tests (CT data)
Connections per 1000 hhs
BTOP per 1000 hhs
Median household income
p=0.01
p=0.04
Connections per 1000 hhs
BTOP per 1000 hhs
Download speed
Upload speed p=0.03
p=0.07
Household income leads to more connections and 
availability of faster download/upload speed
Sudip Bhattacharjee, UConn 4
Google Fiber locations
Sudip Bhattacharjee, UConn 5
Sudip Bhattacharjee, UConn 6
Metropolitan statistical areas chosen for gig networks 
already have higher values for all metrics
High wages rely on good broadband 
speeds
Connections per 1000 hhs
BTOP per 1000 hhs
Average industry wage
(per industry type)
p<0.001
Connections per 1000 hhs
BTOP per 1000 hhs
Download speed
Upload speed
p<0.001
Median household income
Education expenditure
Population
Total industry units
p<0.001
So that is the good news!!
Sudip Bhattacharjee, UConn 7
How can we identify CT towns?
• Data driven analysis
– UConn students in Masters in Business Analytics 
and Project Mgmt
– msbapm.uconn.edu
– Semester long capstone project
– 4 teams of 5 members each
• Demographic, economic, geographic data
• Results are a composite of several teams
Sudip Bhattacharjee, UConn 8
Raw Data From Online 
Public Library
Exploratory 
Data Analysis
Identified key 
variables
Processed, 
Cleaned and 
Merged data
Demographics
(CERC)
Housing 
(CERC)
Occupation 
(DOL)
Broadband 
(FCC) 
Solution Framework 
 Missing value treatment.
 Variable Selection /Exclusion
 Merge to obtain data at unique CT 
town level.
 Identify key economic benefits assessing the 
impact of broadband ‐
 Per capita Income
 Median Housing Price
 Number of Business Units
Summary of Model Output for 
Business Use
Analytical Models to estimate 
economic benefit for CT towns
Grouping and Ranking of Towns 
based on benefit
70‐80% of work effort
Sudip Bhattacharjee, UConn 9
Data challenges
• Disparate sources
– FCC, US Census Bureau, Connecticut Economic 
Resources Center (CERC), US Dept of Labor, 
VisitCT.org, broadbandnow.com, CT Dept. of Housing, 
CT Dept. of Public Health, others
• Data matching/integration issues
– Census block, tract, zip code, town
• Missing data
– FCC: Broadband providers: 1, 4, 5, 6, 7, 8, 9, 10, …
– Price of broadband
Sudip Bhattacharjee, UConn 10
Impact of broadband
• Five years after each 1 Mbps increase in internet 
speed (up to 60Mbps) results in the following 
average economic gains:
– Unemployment rate drops by .08%
– Bachelor degree rate increases by .42%
– Median household income increases by $570
– Average home value increases by $3,200
– Assisted housing unit decreases by 200
Sudip Bhattacharjee, UConn 11
Cluster economic benefit rankings
12Sudip Bhattacharjee, UConn
Rank all 169 CT towns by their likelihood to attract new business activity
Data used:  Cluster economic index, CERC’s town level data, CERC’s listings of office space and 
land available as of 4/10/15, economic stimulus zones as of 4/10/15, locally available business 
development assistance office, and town and regional area attractions as compiled by CT office of 
Tourism as of 4/6/15.
Analytic Methods employed: Stepwise regression, correlation analysis,  and subjective weighting 
of the final set of factors/variables.
Results of Top 10
13
Town Rankings
Sudip Bhattacharjee, UConn
14
Results for Town Rankings
https://public.tableau.com/profile/chengping.huang#!/vizhome/CT_GIG/Comparision
Sudip Bhattacharjee, UConn
Top 30 Towns – Case 50100 Mbps
When increasing Broadband speed (Down/Up) from 50/10 to 100/25 Mbps
Impact of BB  IT Labor force Tax revenue
Norwalk 8% 11%
Bristol 8% 8%
Windsor Locks 29% 32%
New London moved 
down from #1 but 
then remains at #11
Bristol moved up
from # 24 to # 15
Danbury moved up
from # 28 to # 25
Norwalk moved 
down from #4 to #8
Windsor Locks moved up
from # 17 to # 9
Represents overall 
town ranking in 
CT = # 20
With increase in broadband, the rate of improvement will be faster
for some of the towns. Case in point, Bristol and Danbury. Longer‐
term benefit will be seen in these cases.
Top 30 Towns – Case 100200 Mbps
When increasing Broadband speed (Down/Up) from 100/25 to 200/50 Mbps
Danbury moved up
from # 25 to # 12
Middletown
moved up from 
#84 to #29
Windsor Locks moved 
down from # 9 to #14
Impact of BB  IT Labor force Tax revenue
Norwalk 13% 24%
Bristol 15% 19%
Windsor Locks 45% 47%
Norwalk moved up
from #8 to # 6
New London and 
Groton remained at 
#11 and #28 
respectively
Bristol moved up
from # 15 to # 10 Represents overall 
town ranking in 
CT = # 21
With increase in broadband, the rate of improvement will be faster
for some of the towns. Case in point, Bristol and Danbury. Longer‐
term benefit will be seen in these cases.
Top 3 / Bottom 3 Towns by County – Case 1050 Mbps
When increasing Broadband speed (Down/Up) from 10/2 to 50/10 Mbps
Large bubbles = Top 3
rank in county
Small bubbles = Bottom
3 rank in county
Represents overall town 
ranking in CT = # 5
Sudip Bhattacharjee, UConn 17
Top 3 / Bottom 3 Towns by County – Case 50100 Mbps
When increasing Broadband speed (Down/Up) from 50/10 to 100/25 Mbps
Large bubbles = Top 3
rank in county
Small bubbles = Bottom
3 rank in county
Retained Top
3 in county 
throughout
Remains as best
town in Litchfield 
county throughout
Remain best town 
in Middlesex 
county throughout
Remain best town 
in New London 
county throughout
Remains in 
bottom 3 
through out
Remains in 
bottom 3 
throughout
Remains in 
bottom 3 
throughout
Remains in 
bottom 3 
throughout
Represents overall town 
ranking in CT = # 8
Sudip Bhattacharjee, UConn 18
Top 3/Bottom 3 Towns by County – Case 100200 Mbps
When increasing Broadband speed (Down/Up) from 100/25 to 200/50 Mbps
Small bubbles = Bottom 
3 rank in county
Retained Top 3 in 
county AND overall 
rank up from #55
Remains in 
bottom 3 
throughout
Retained Top 
3 in county 
throughout
Remains in bottom 
3 through out
Remain best town 
in New London 
county throughout
Remains best town 
in Middlesex 
county throughout
Remains in 
bottom 3 
throughout
Remains in 
bottom 3 
throughout
Represents overall town 
ranking in CT = # 6
Large bubbles = Top 3
rank in county
Sudip Bhattacharjee, UConn 19
CTgig-YaleConf-4May2015

CTgig-YaleConf-4May2015