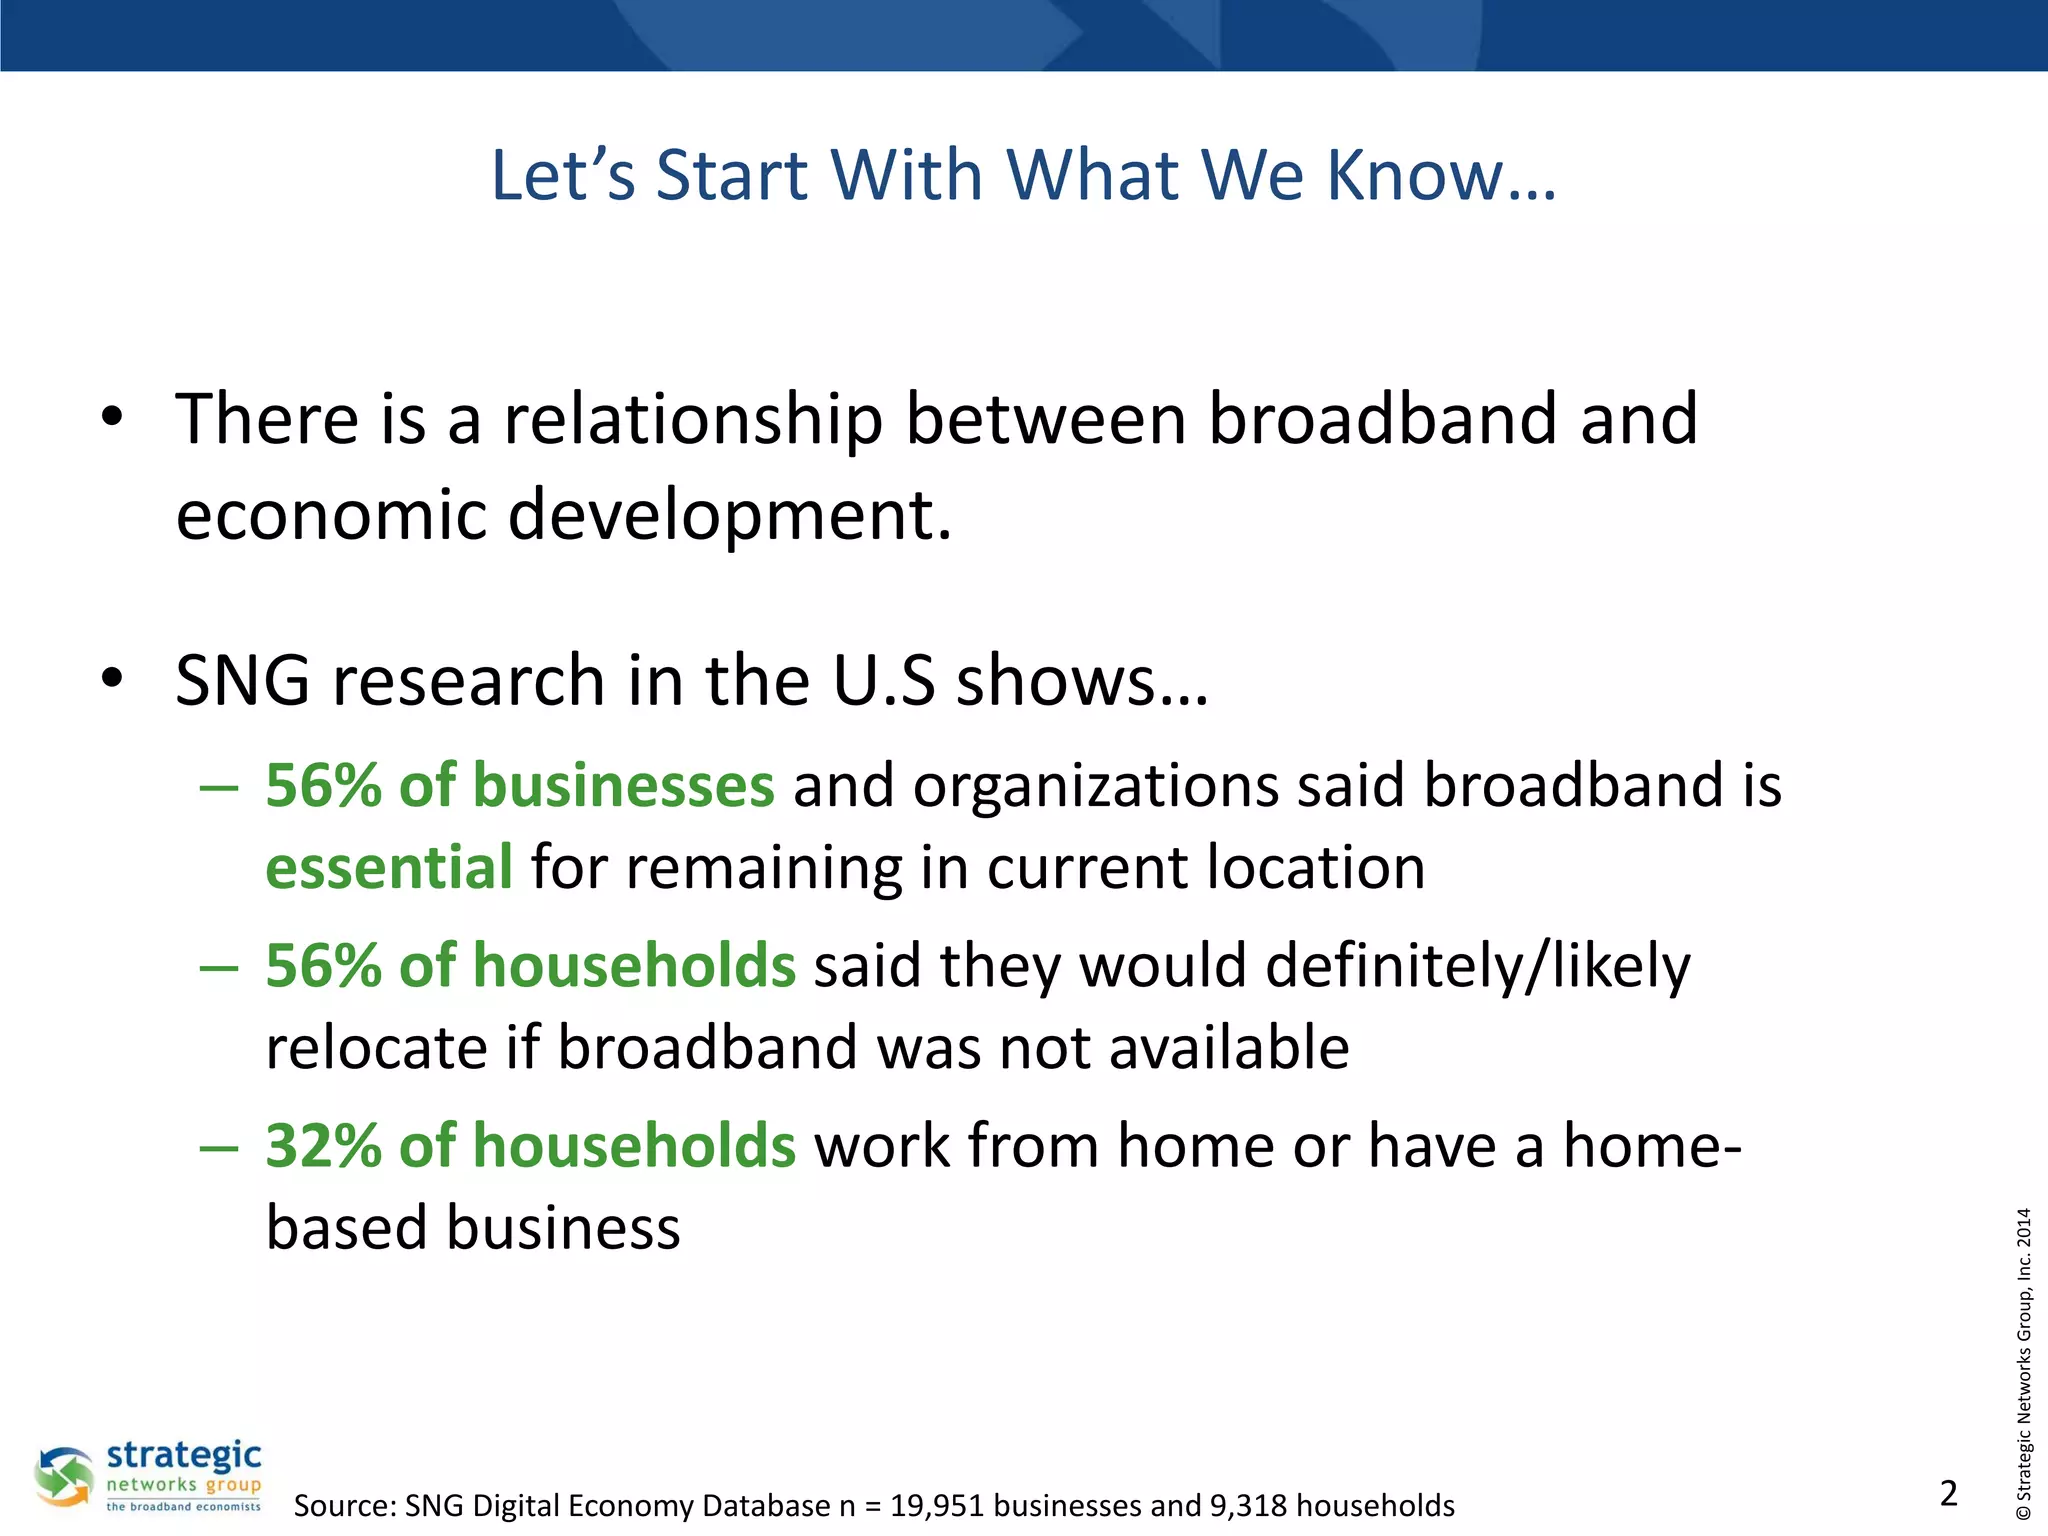
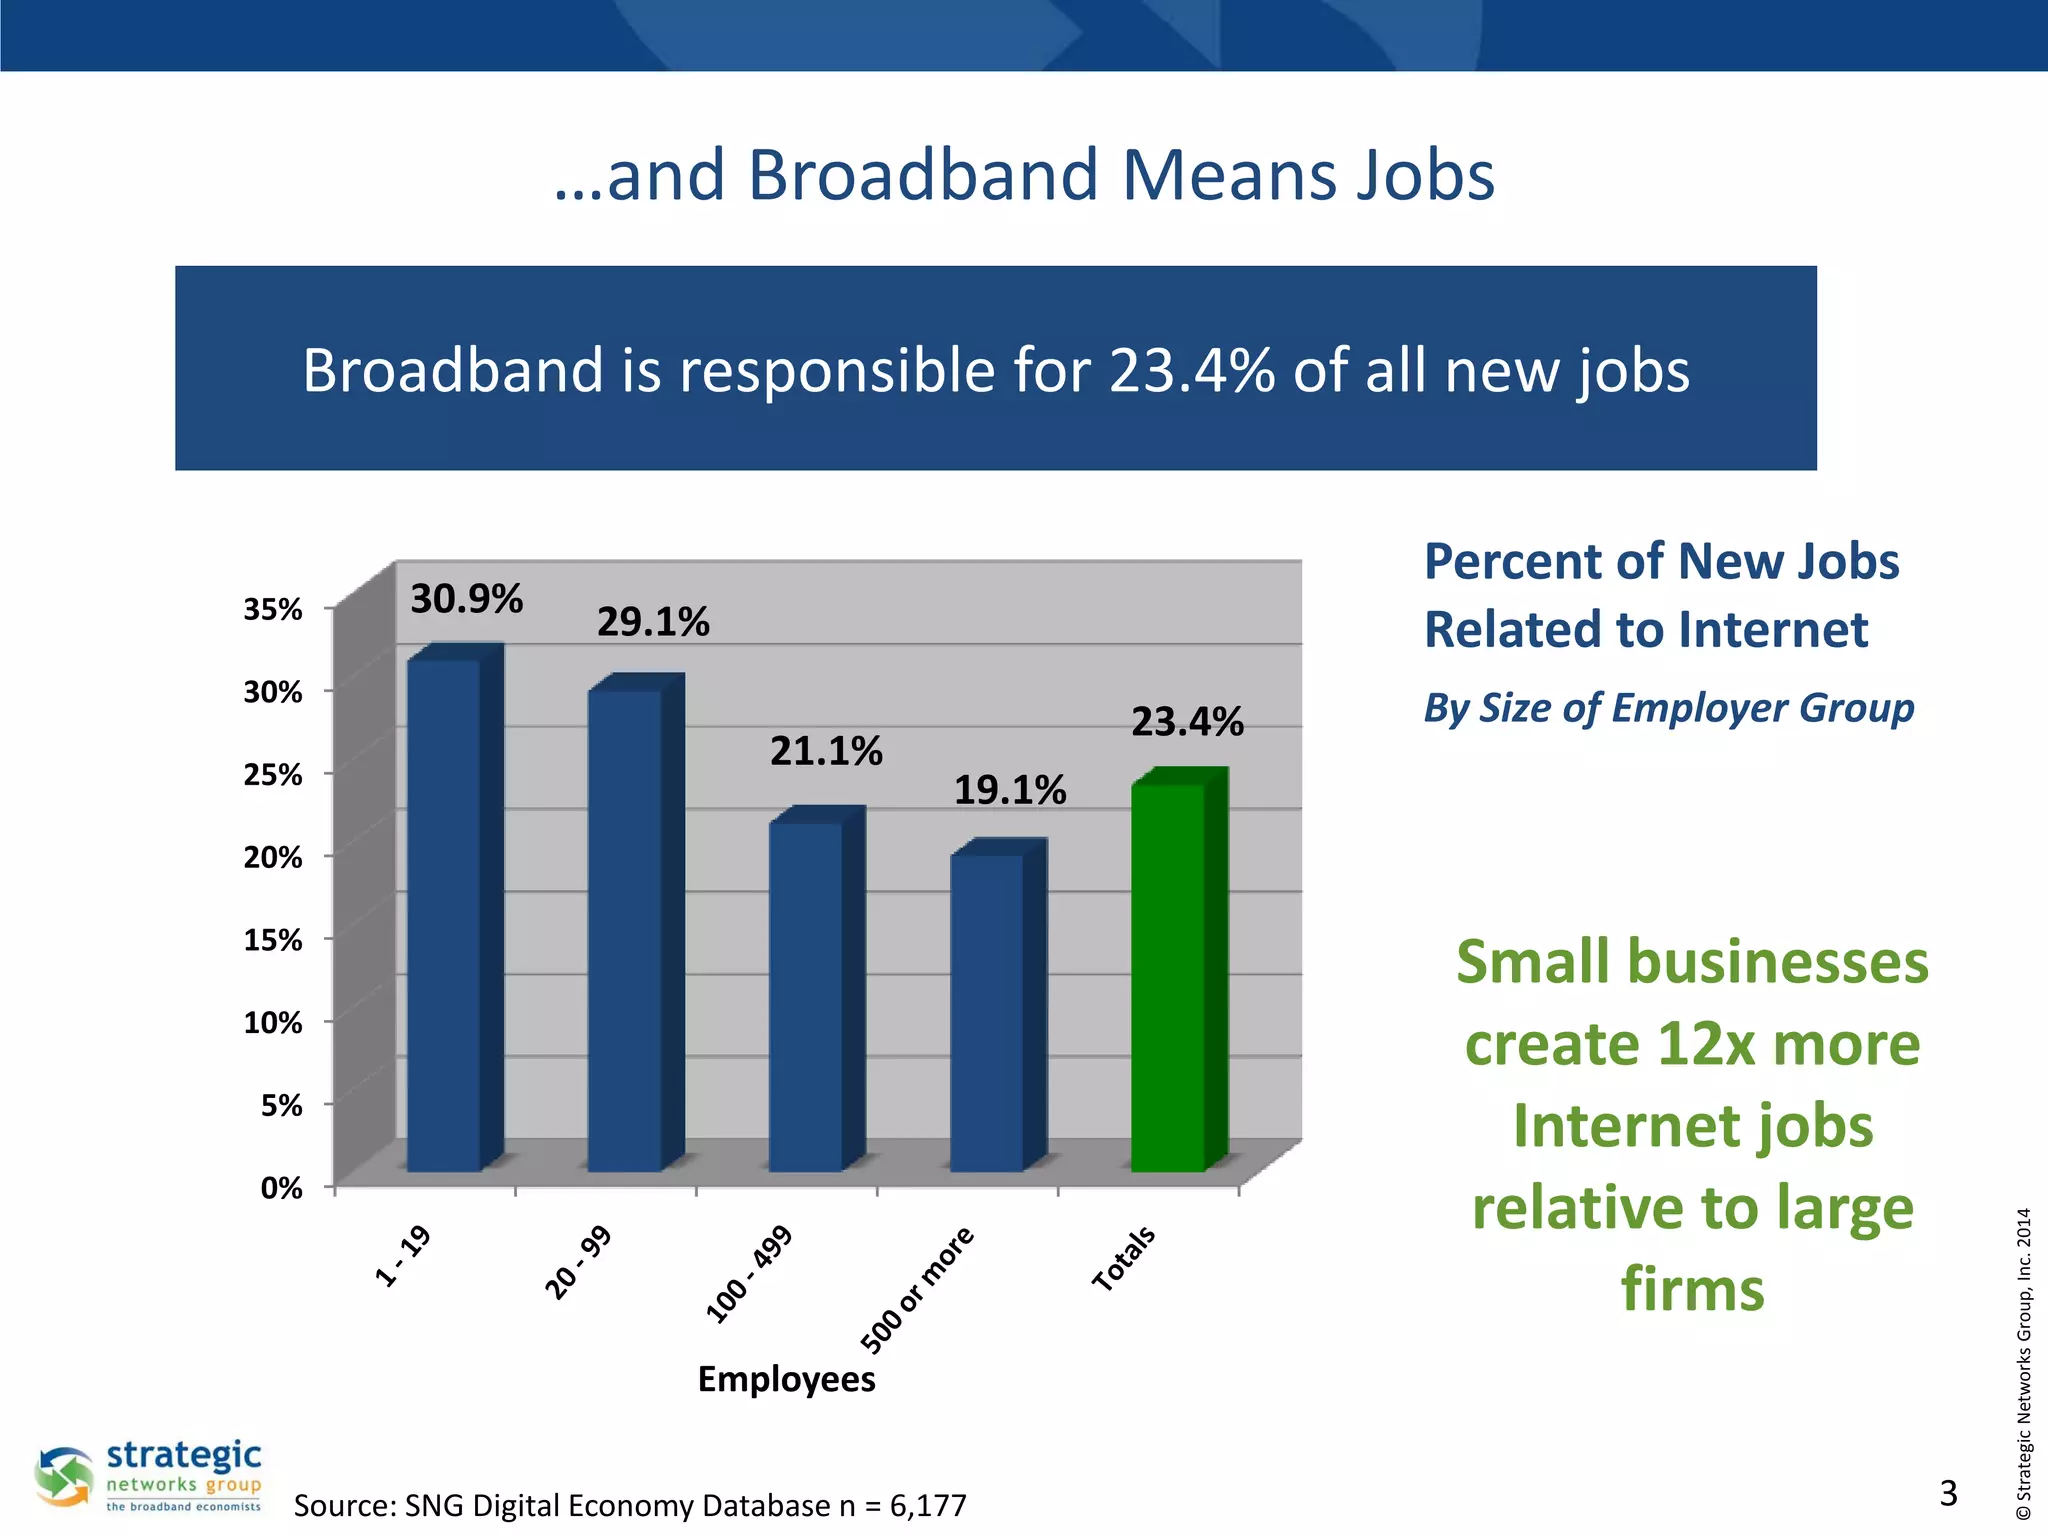
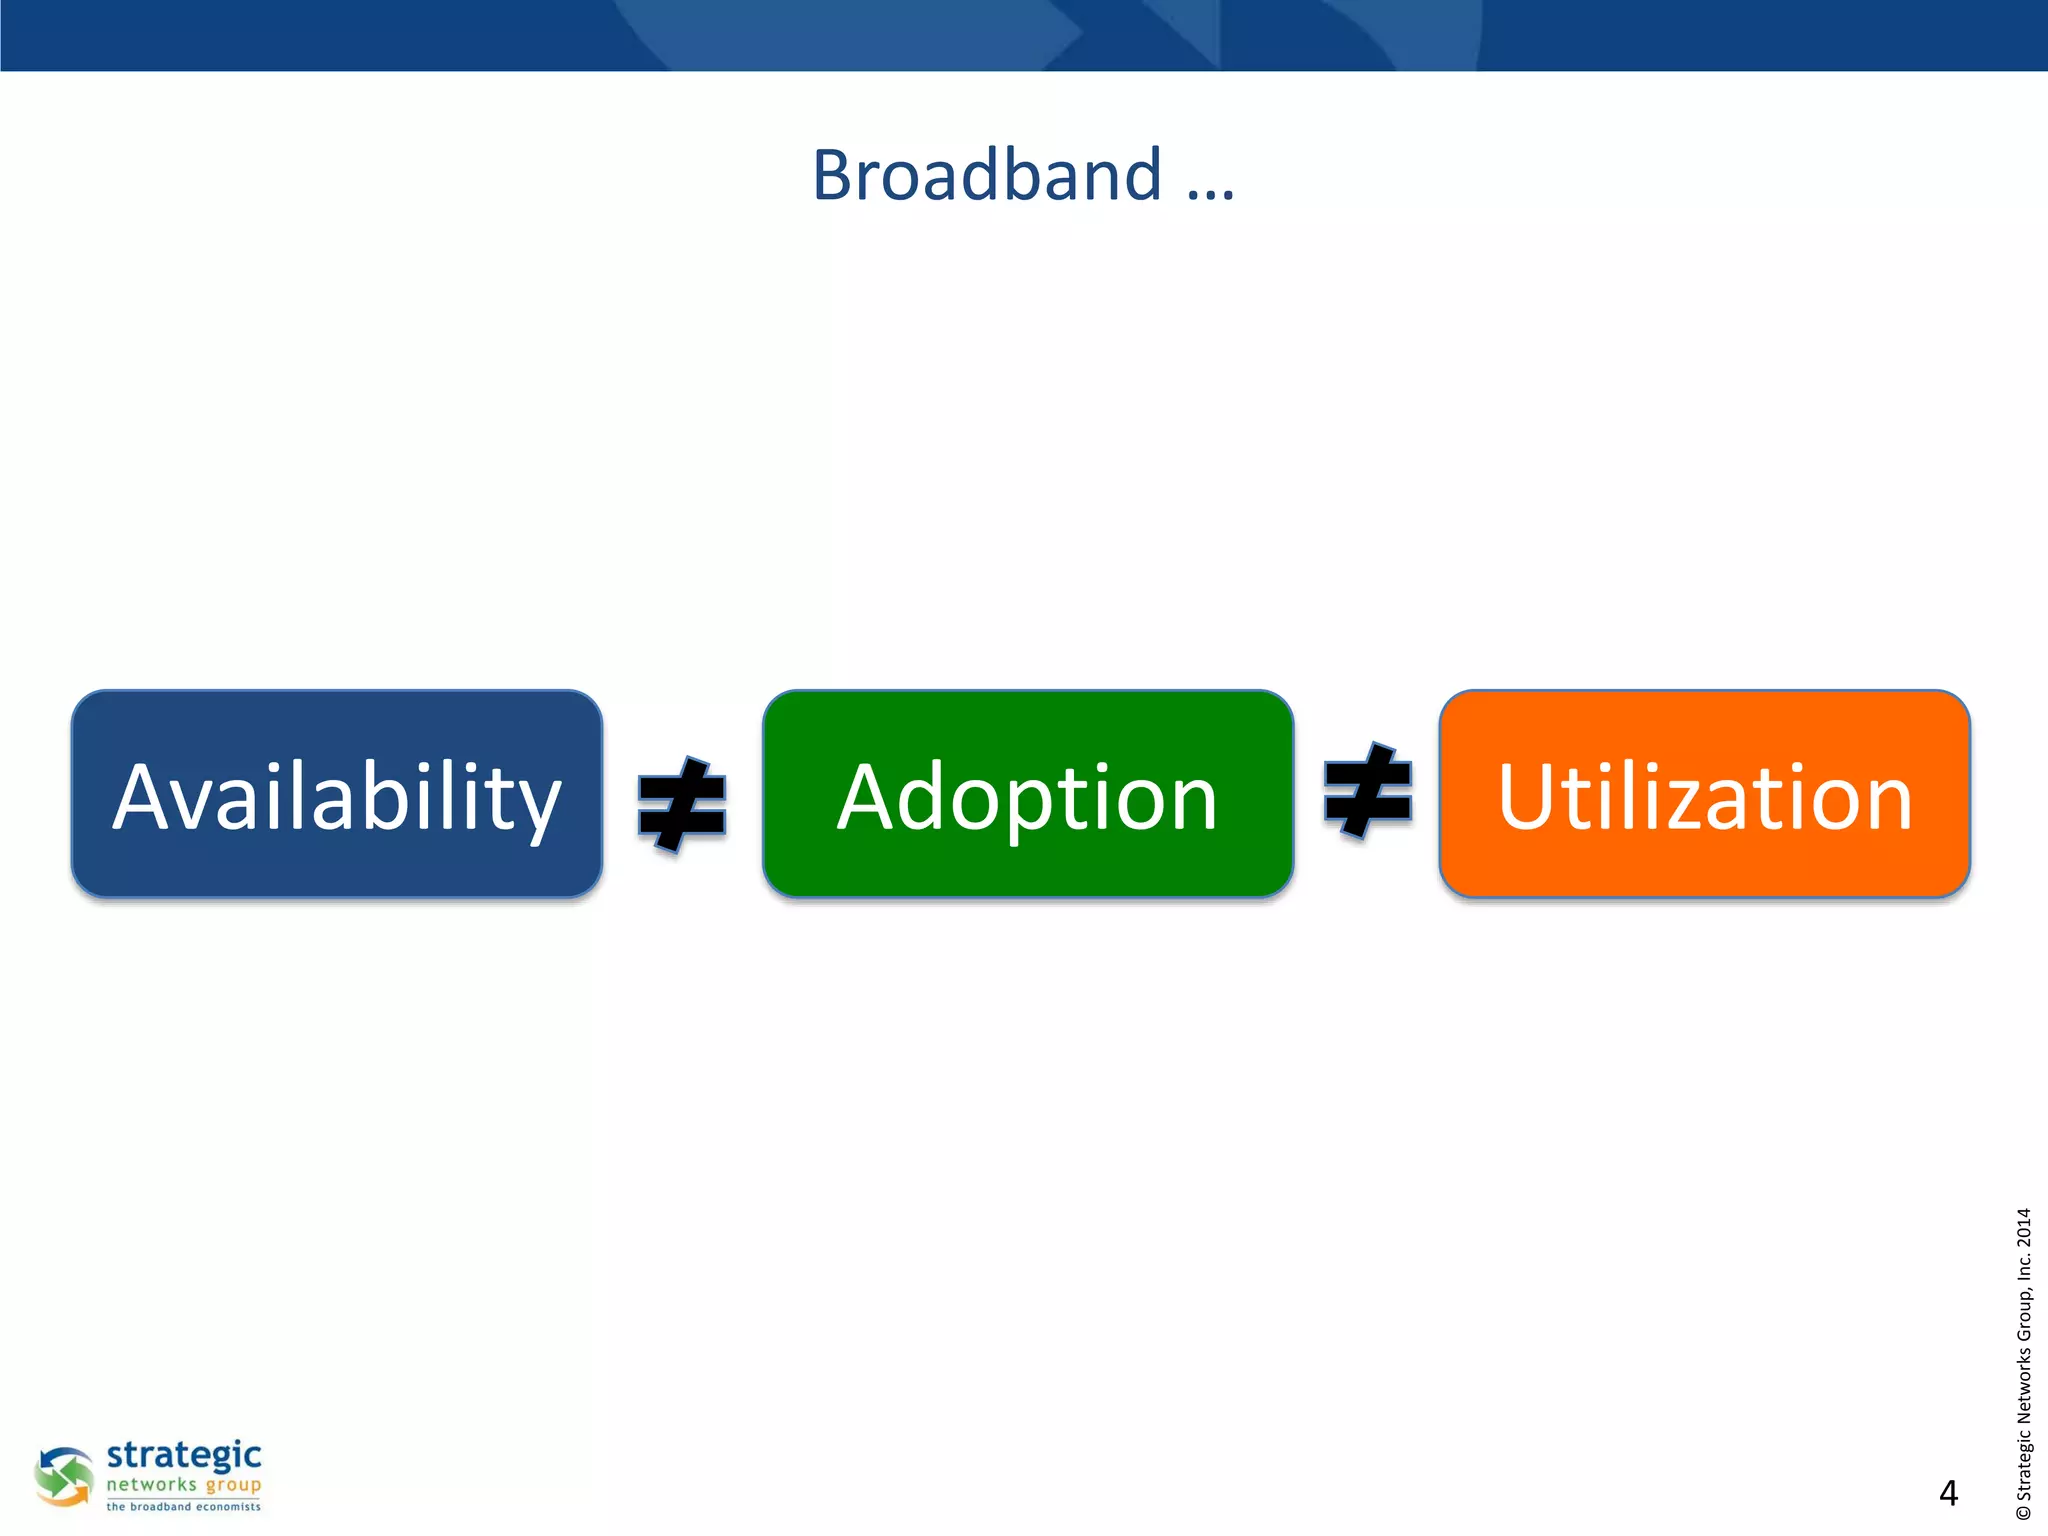
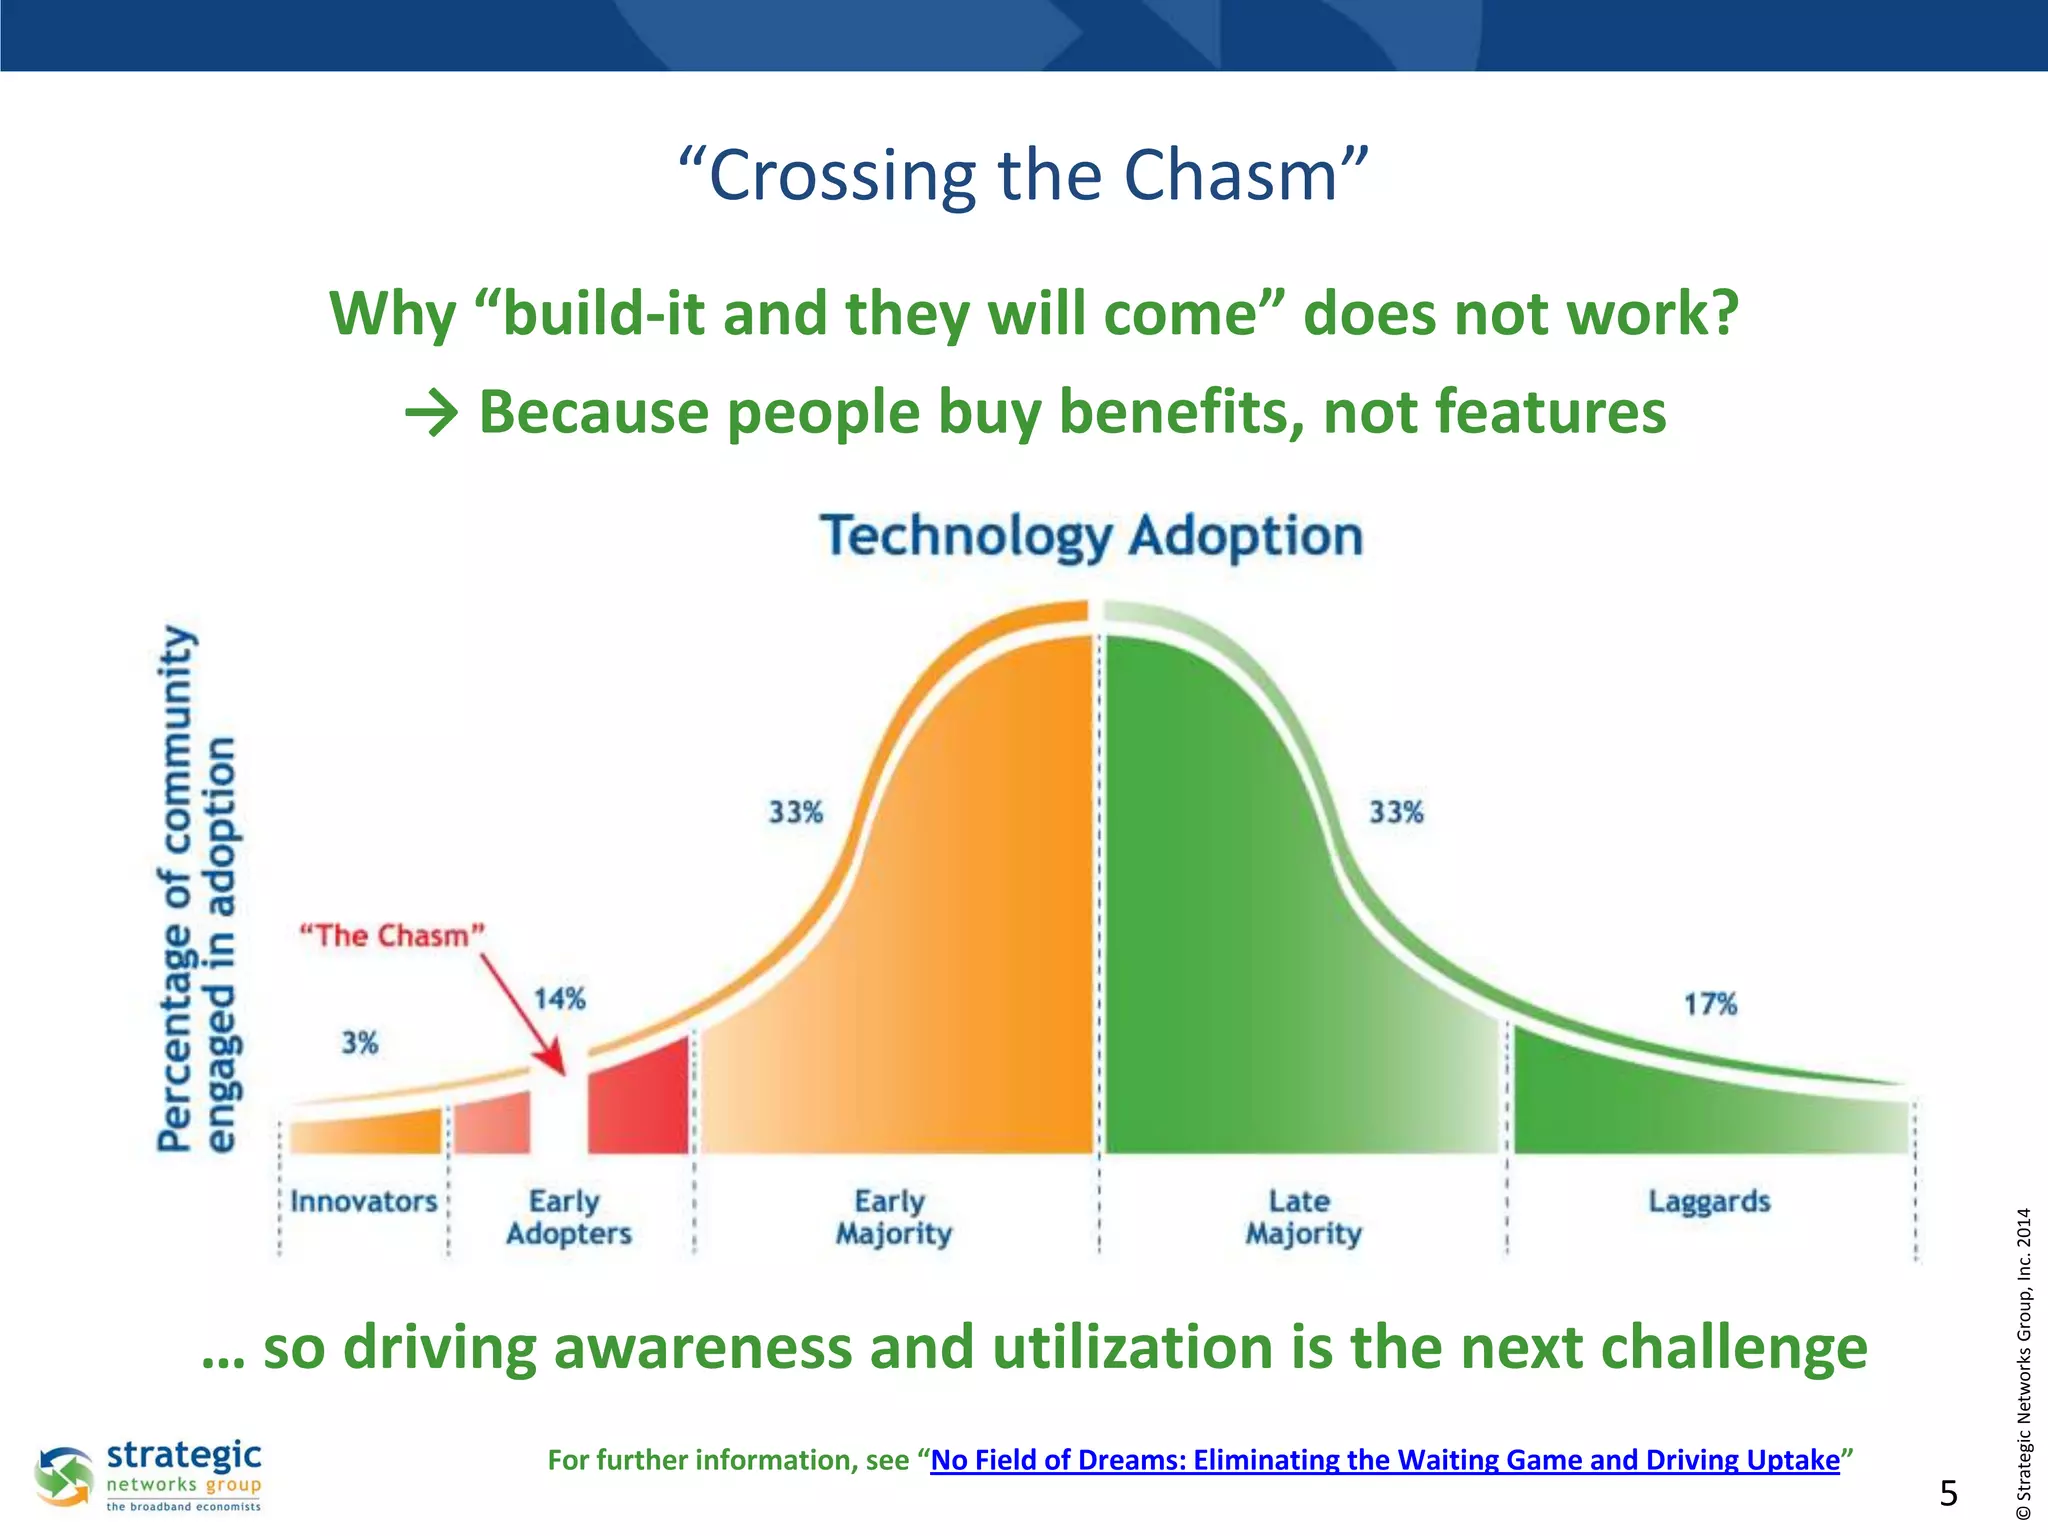
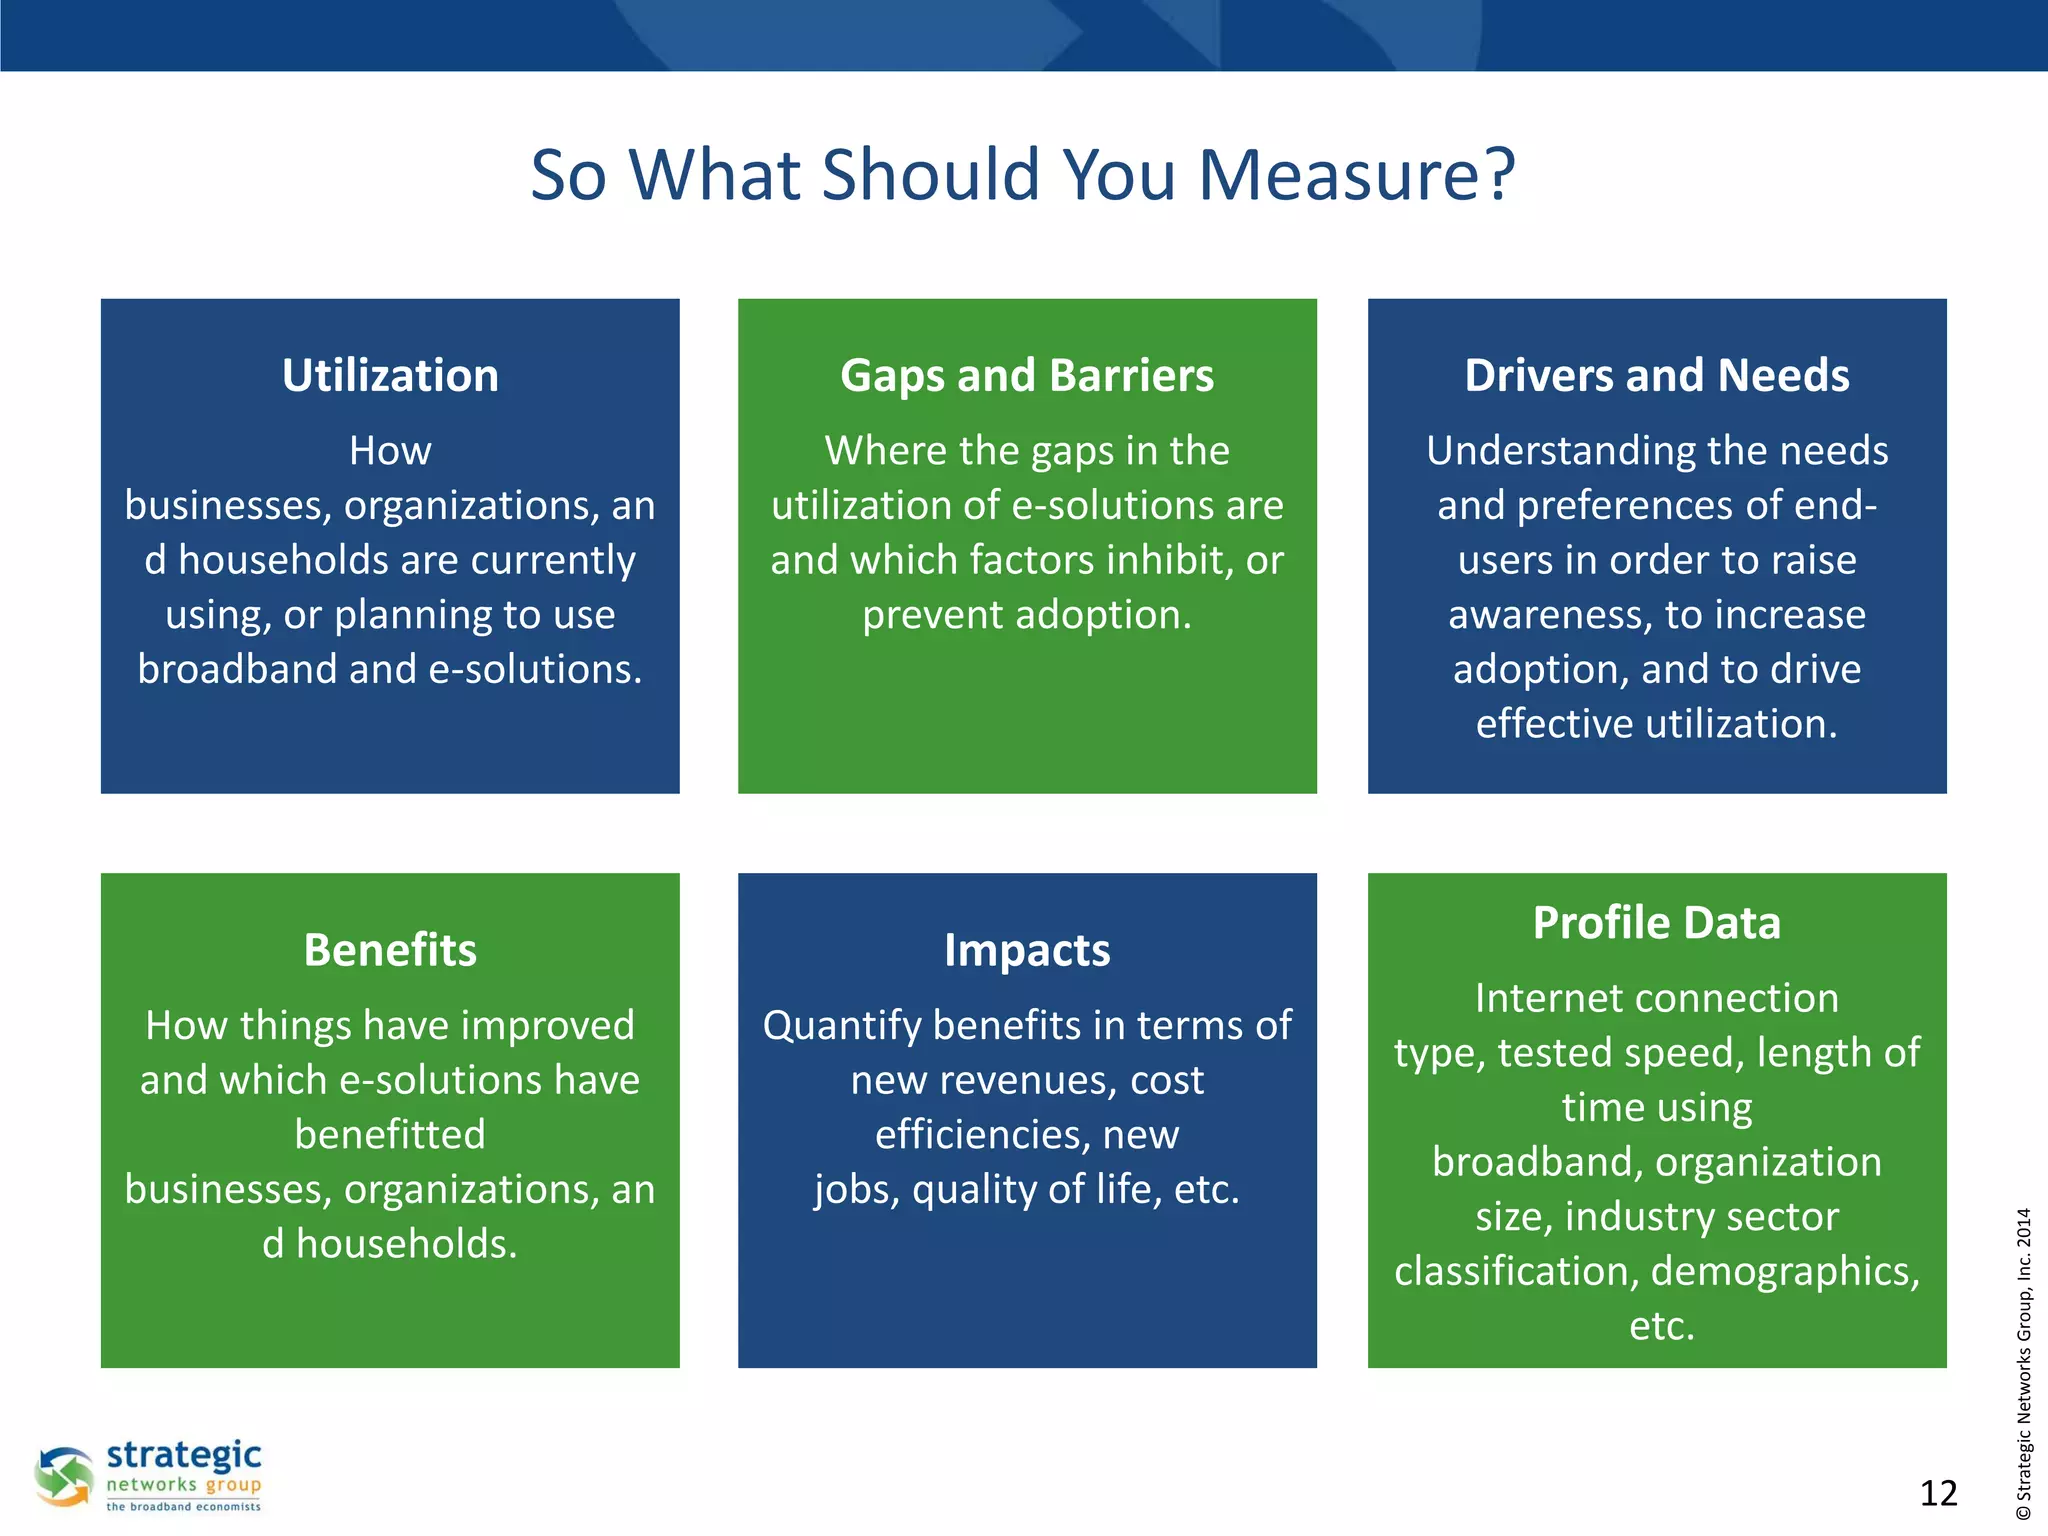
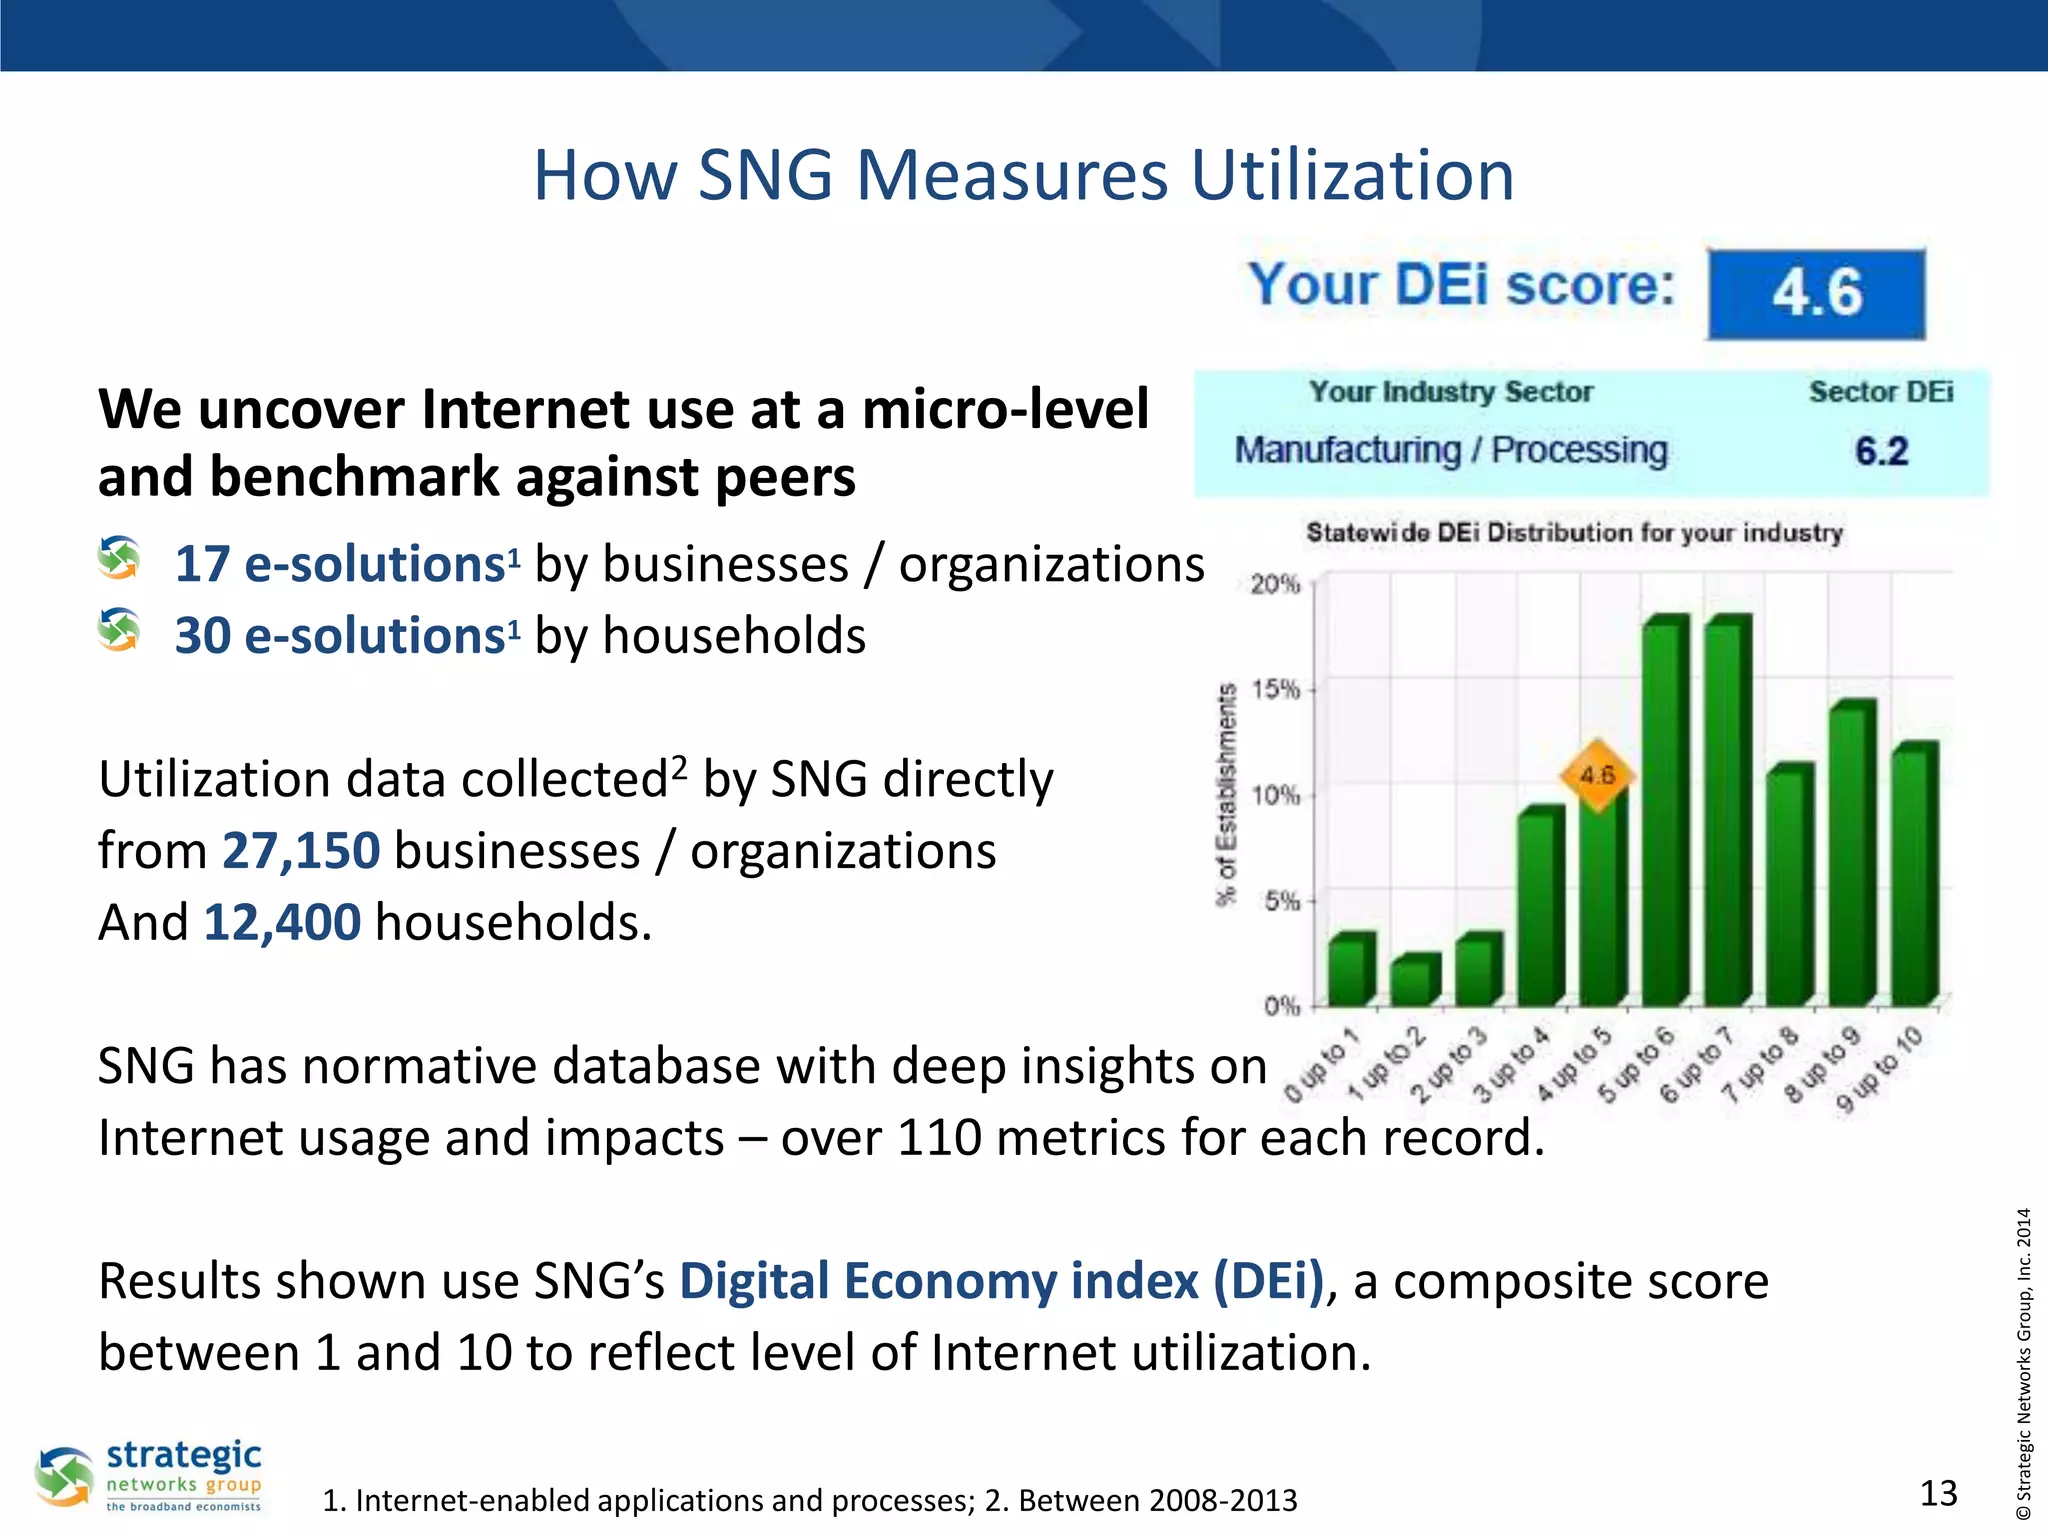
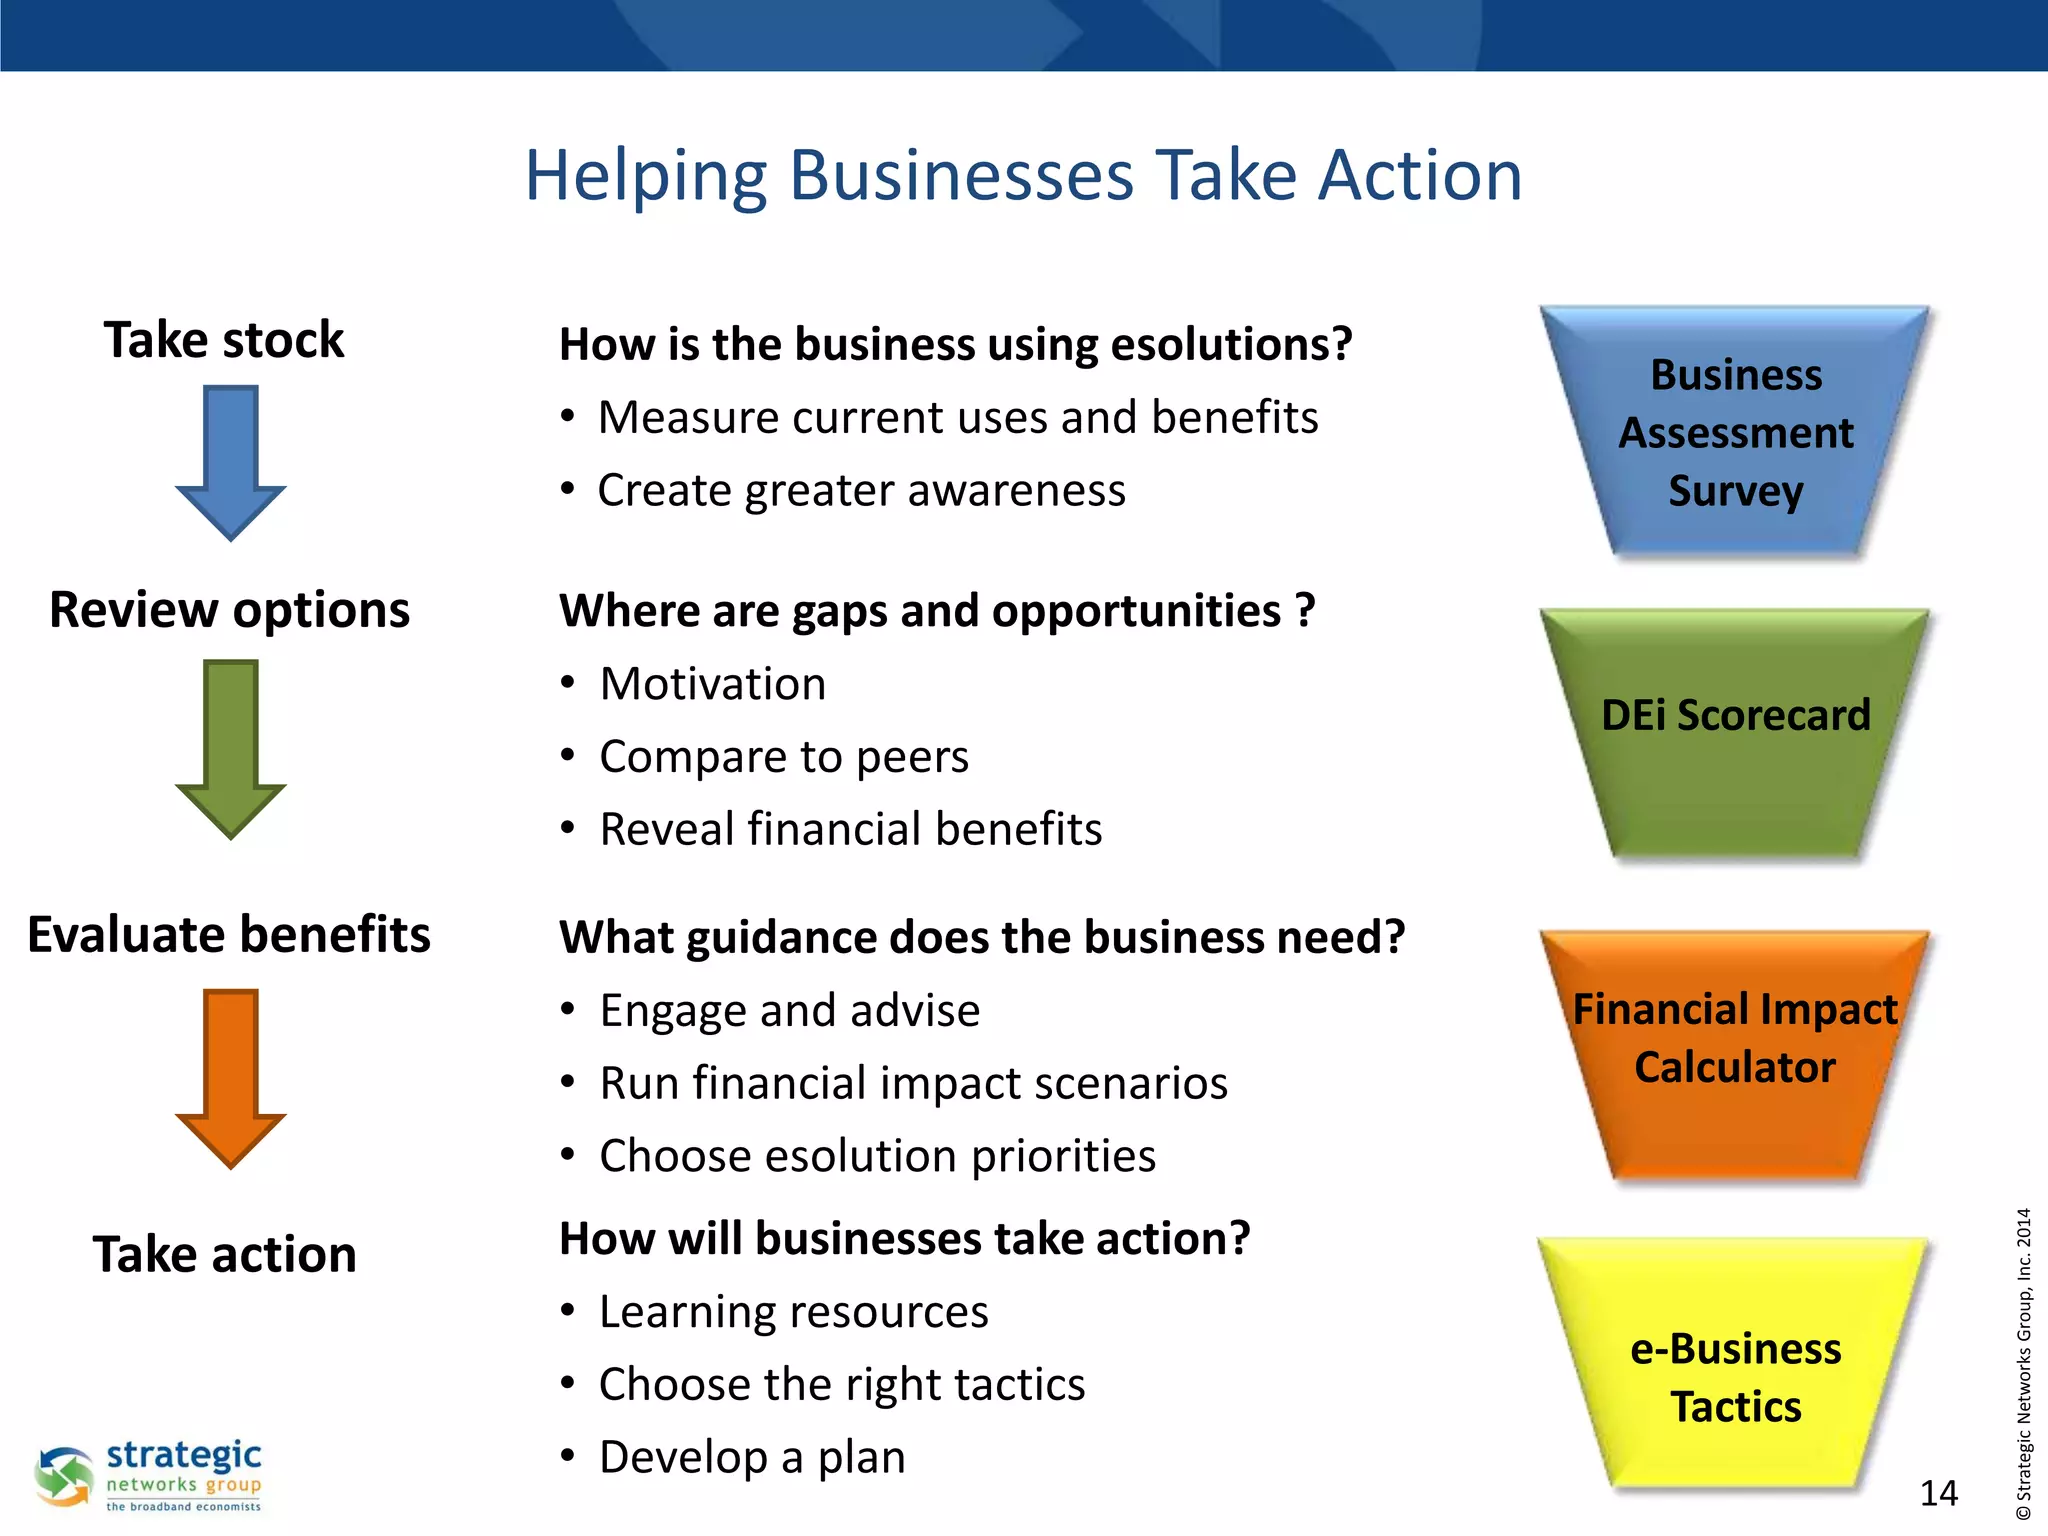
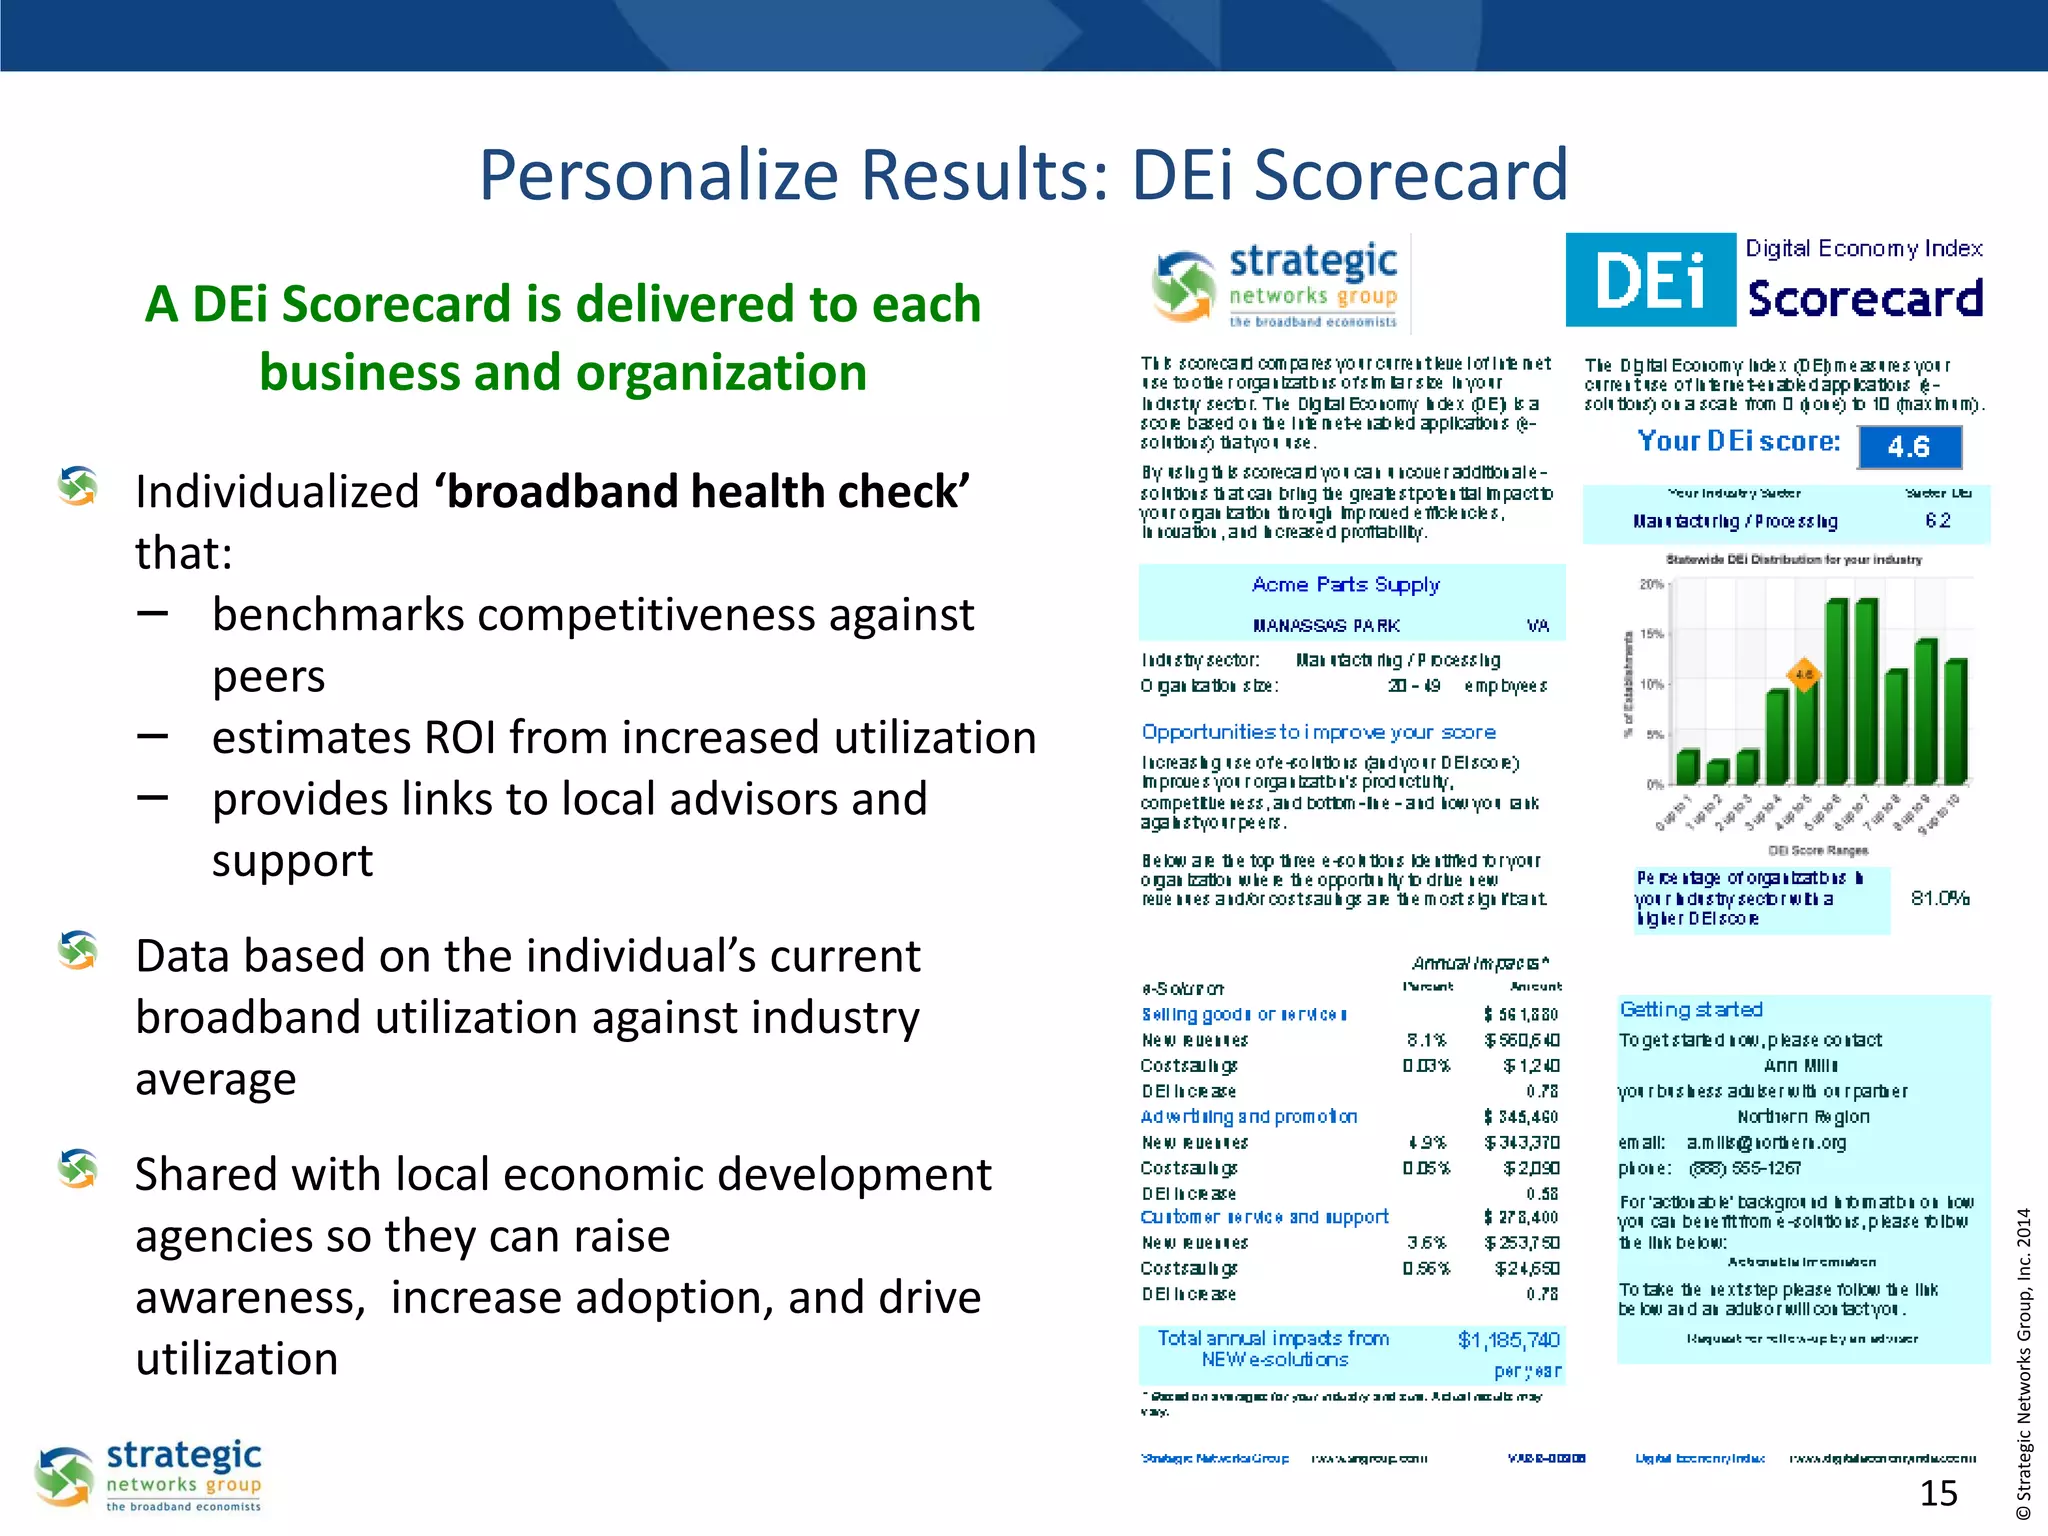
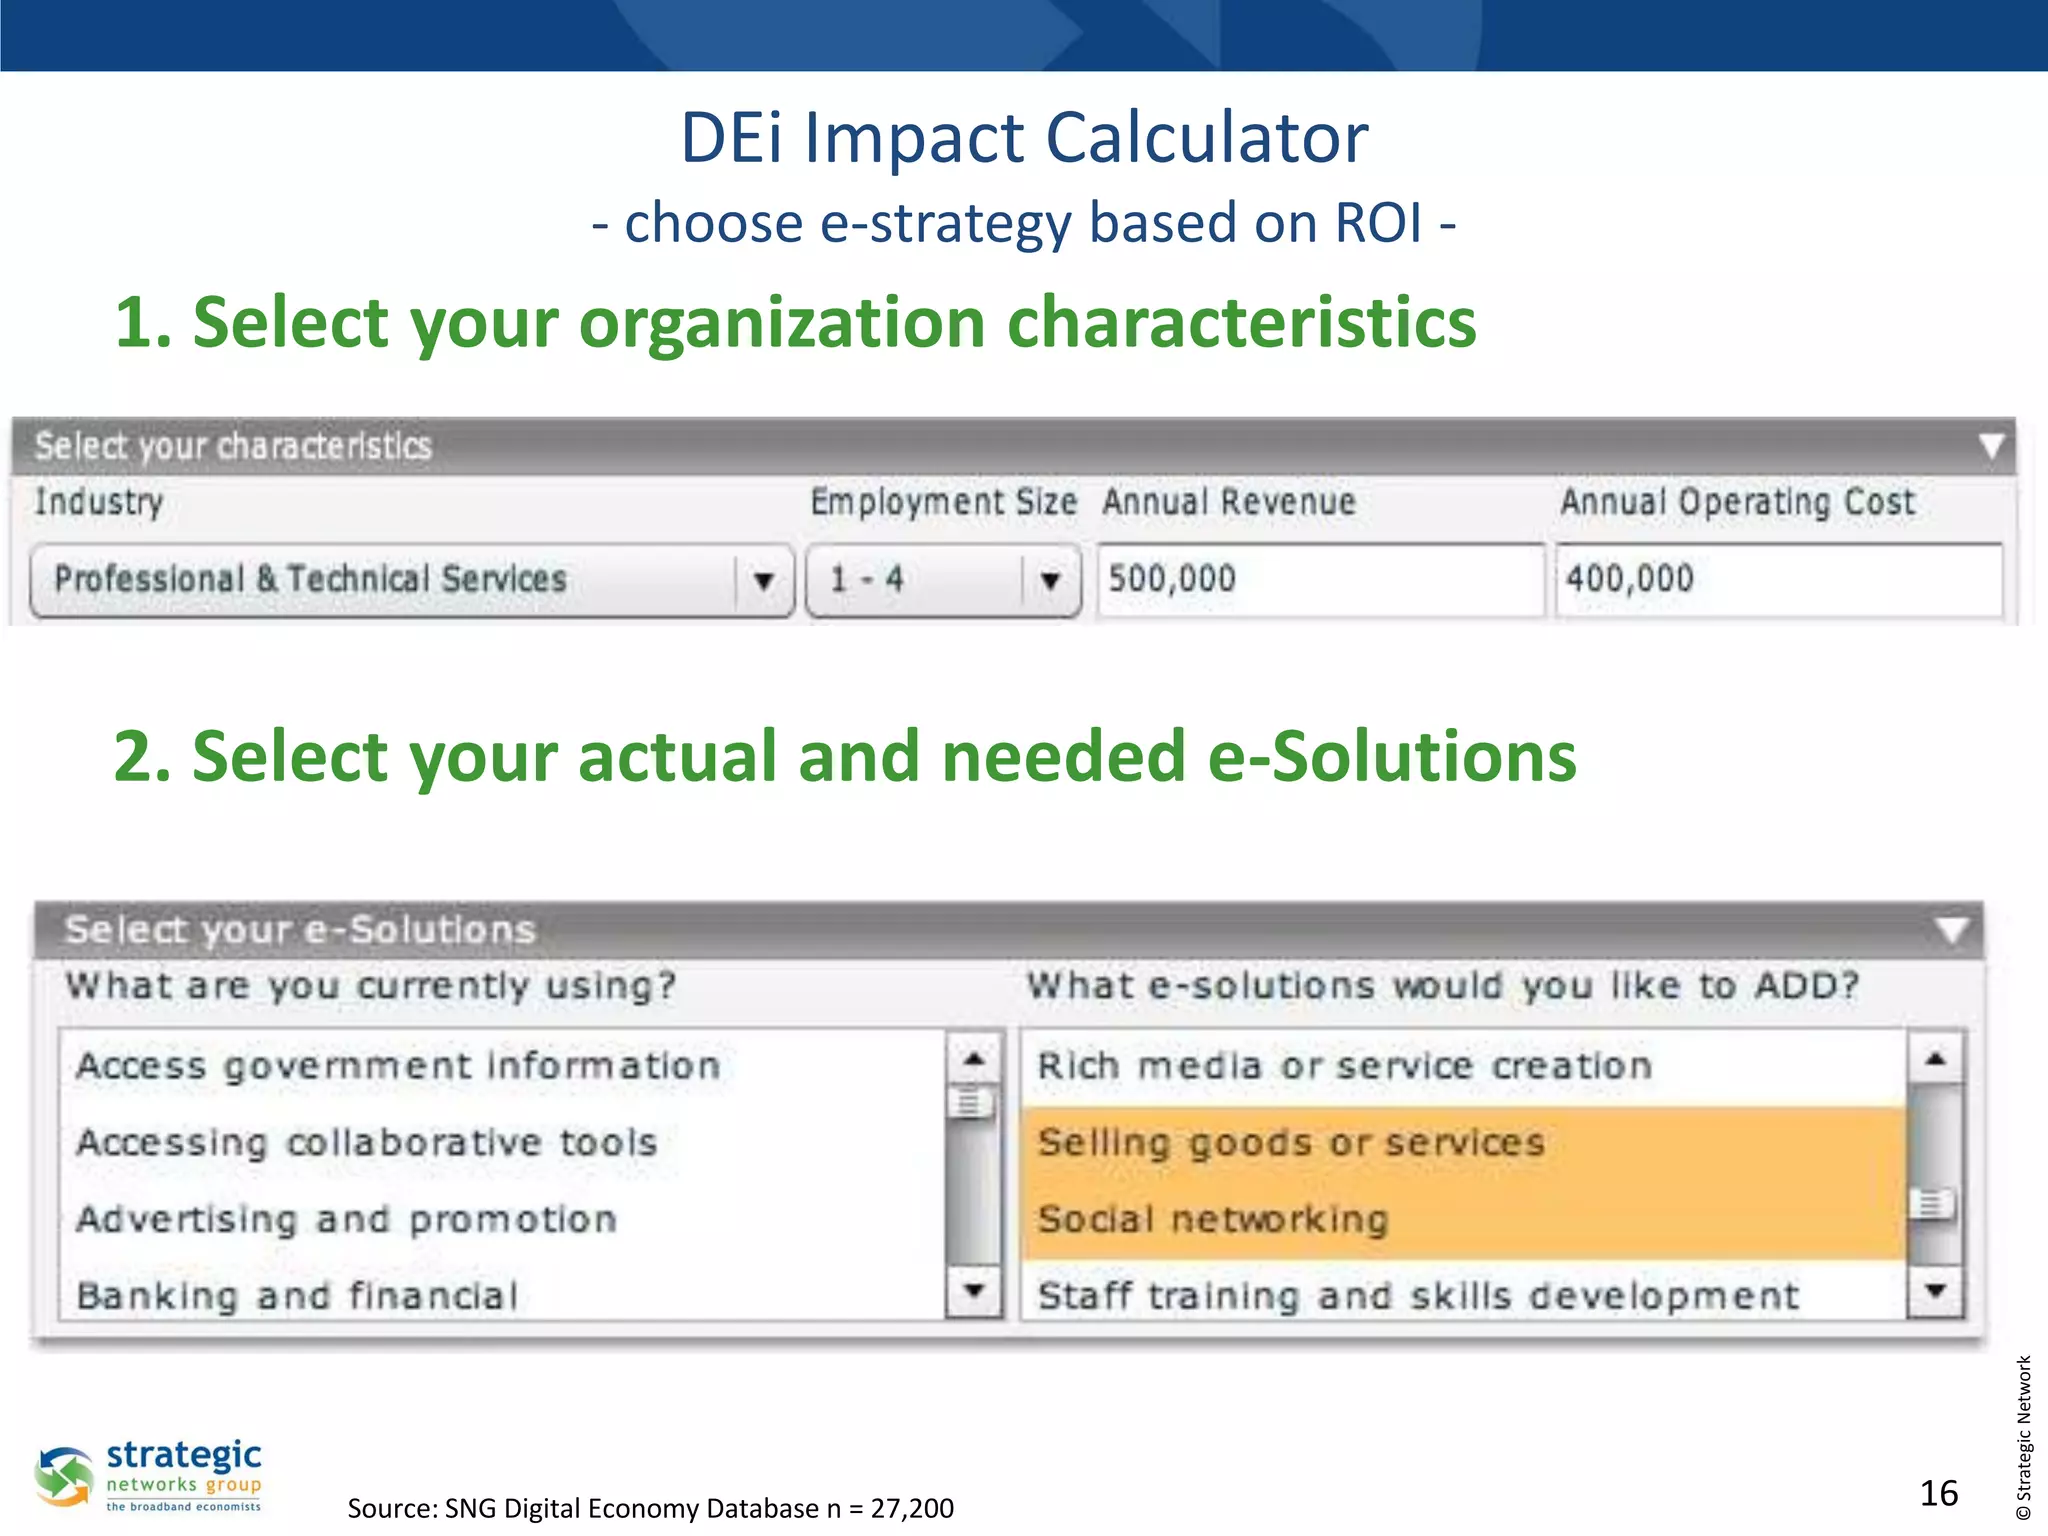
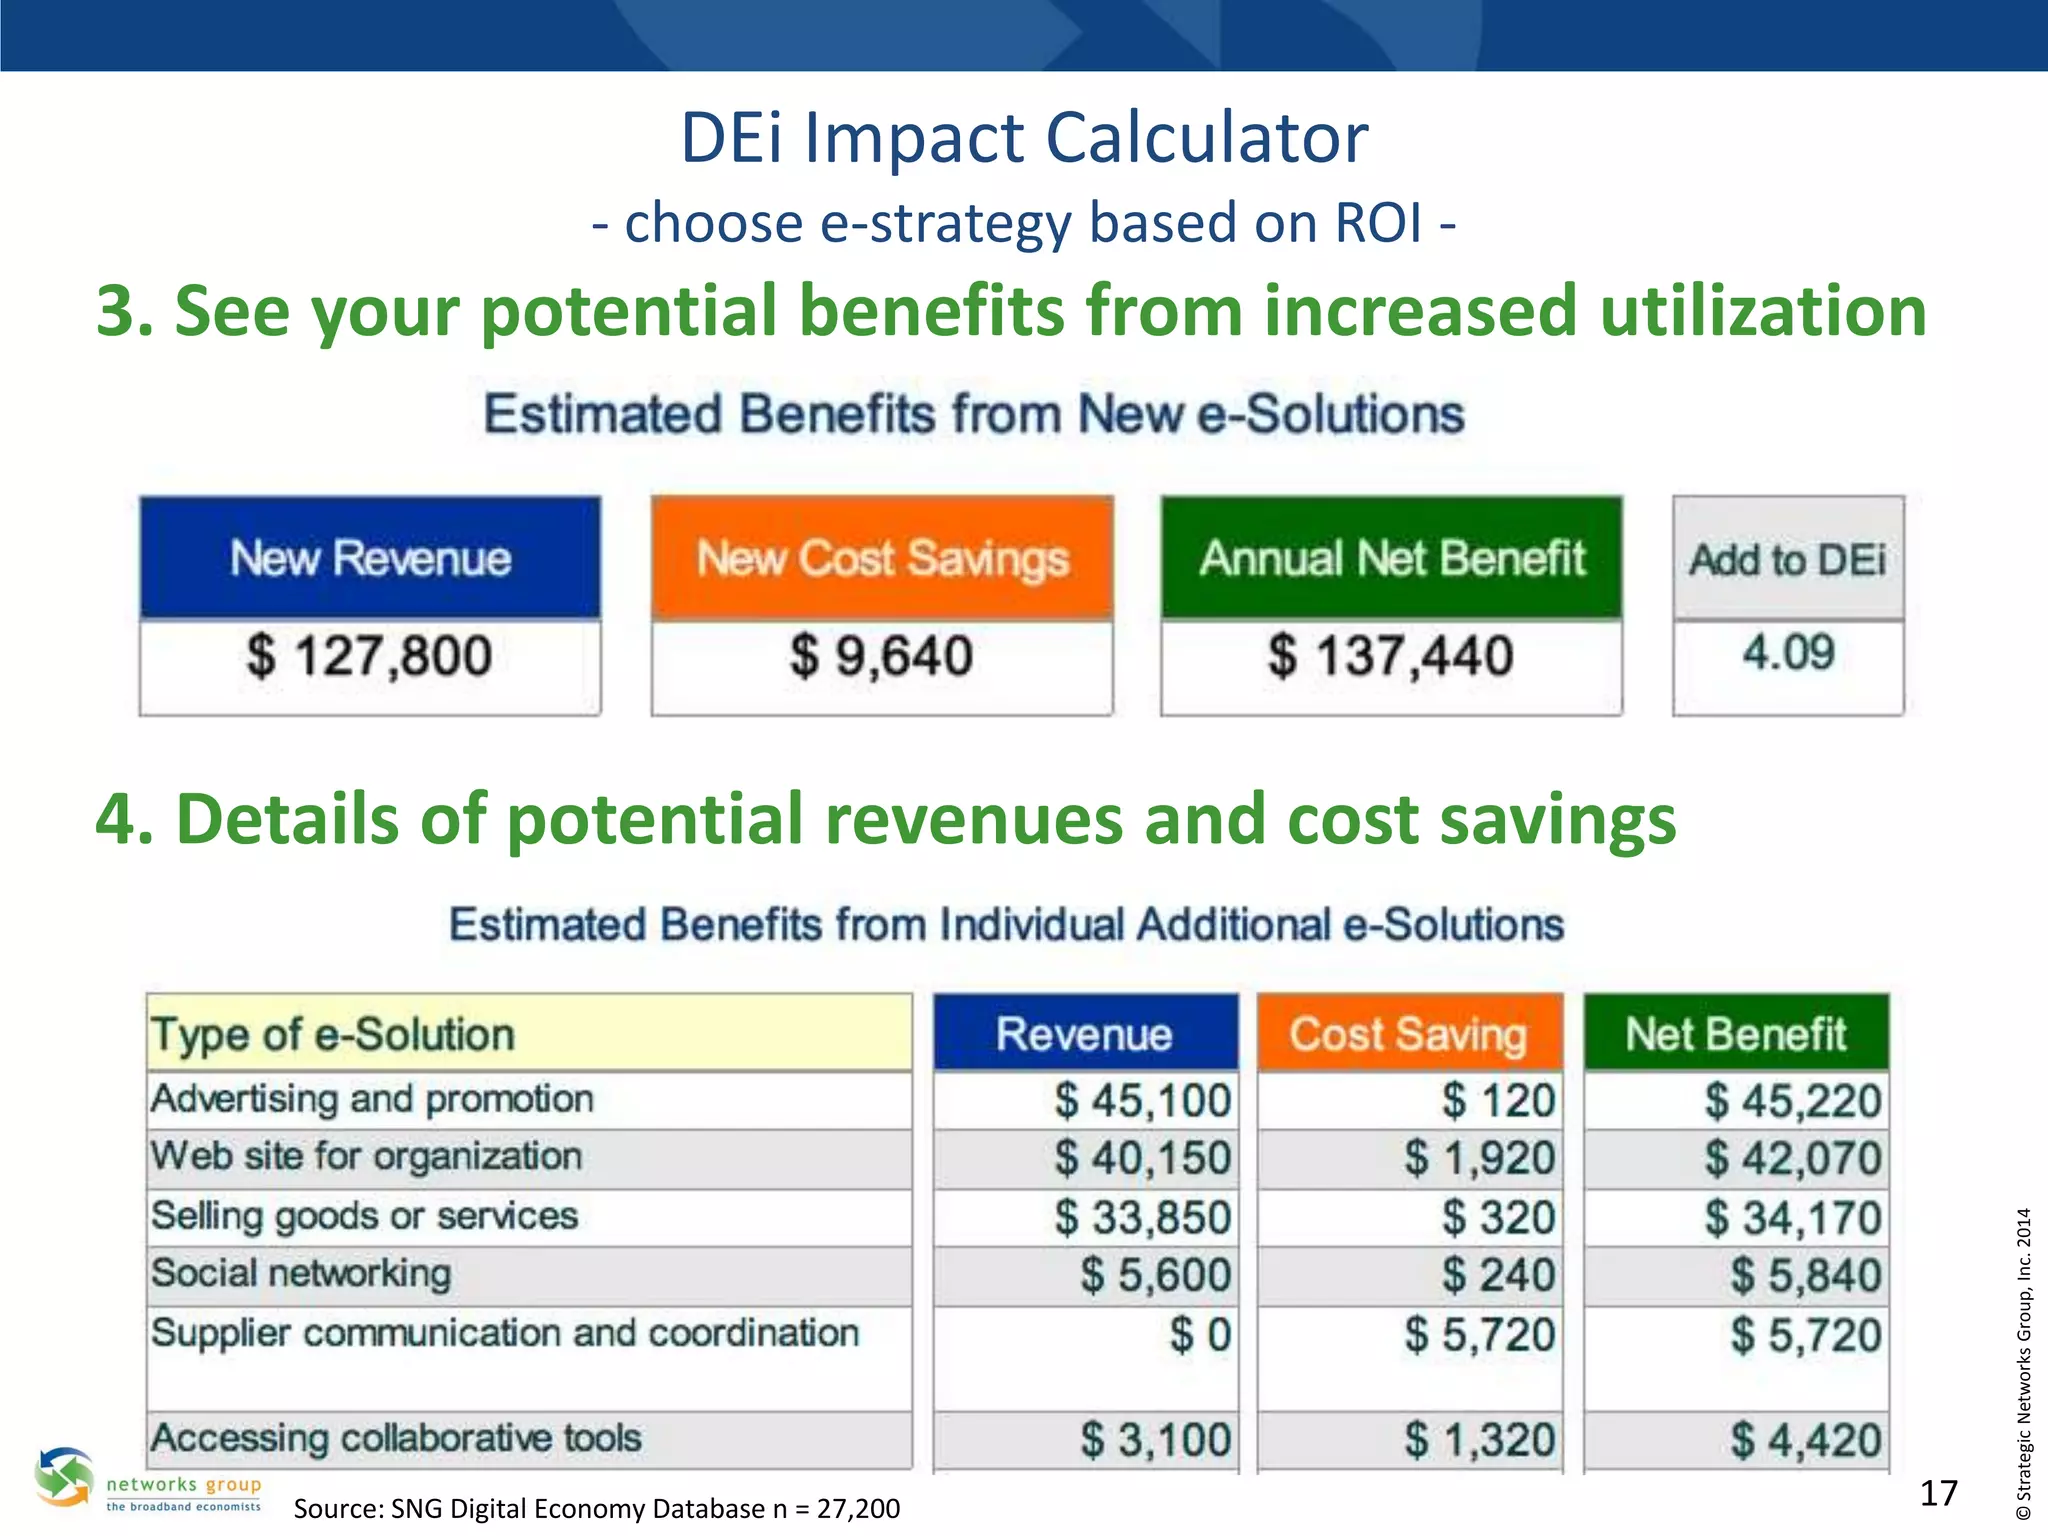
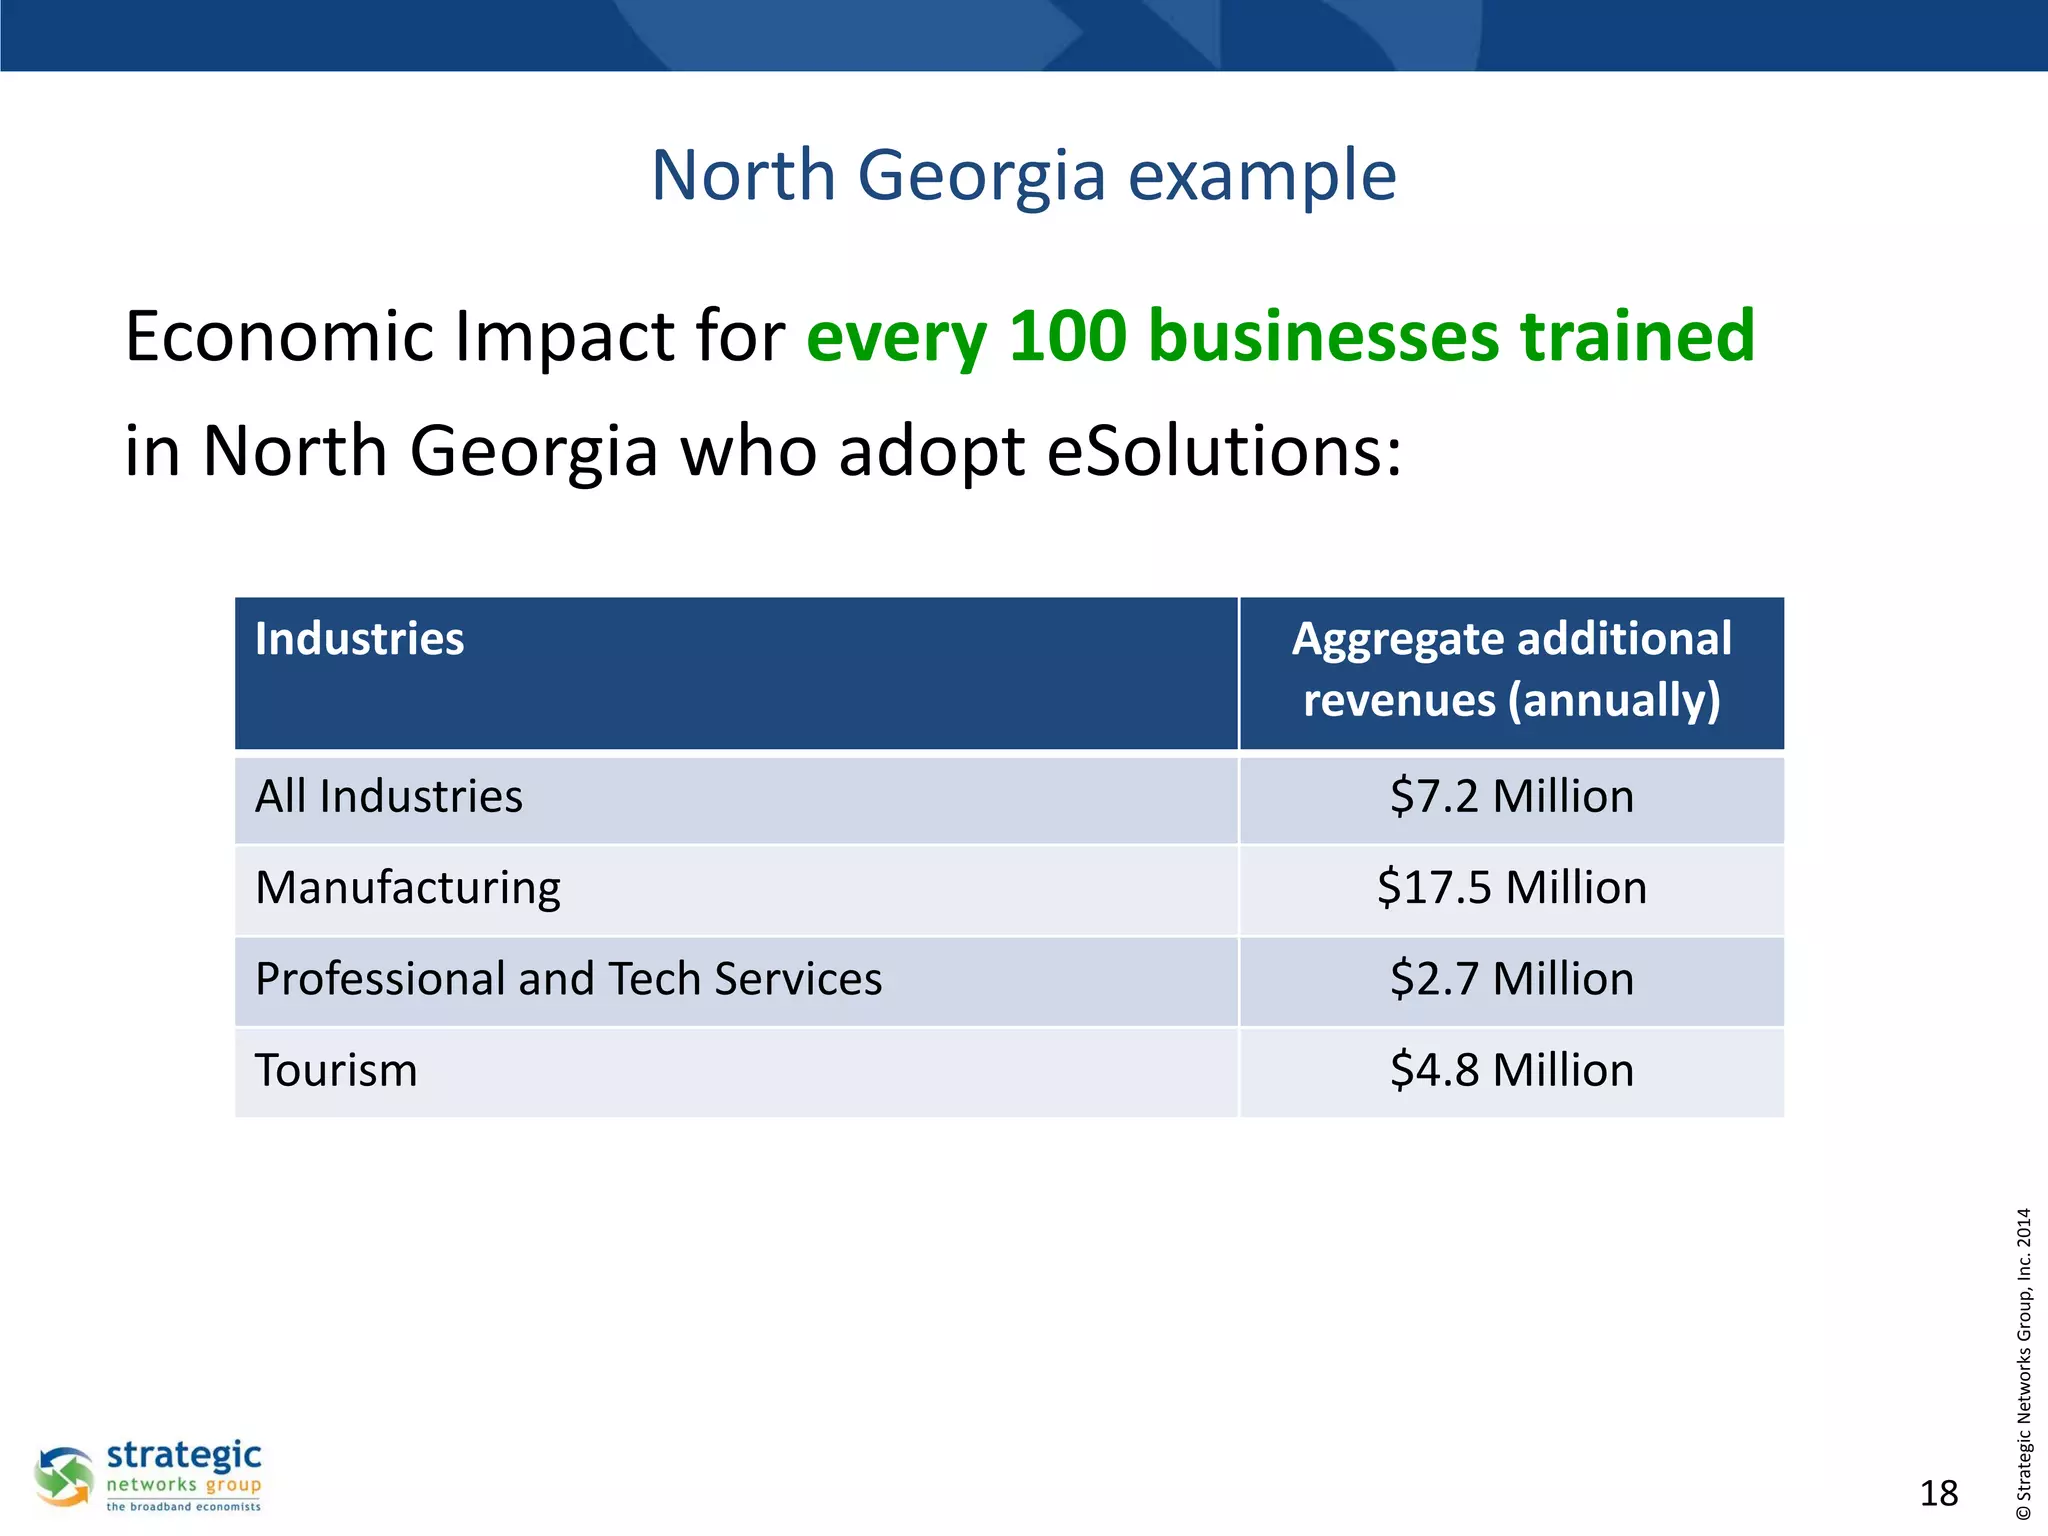
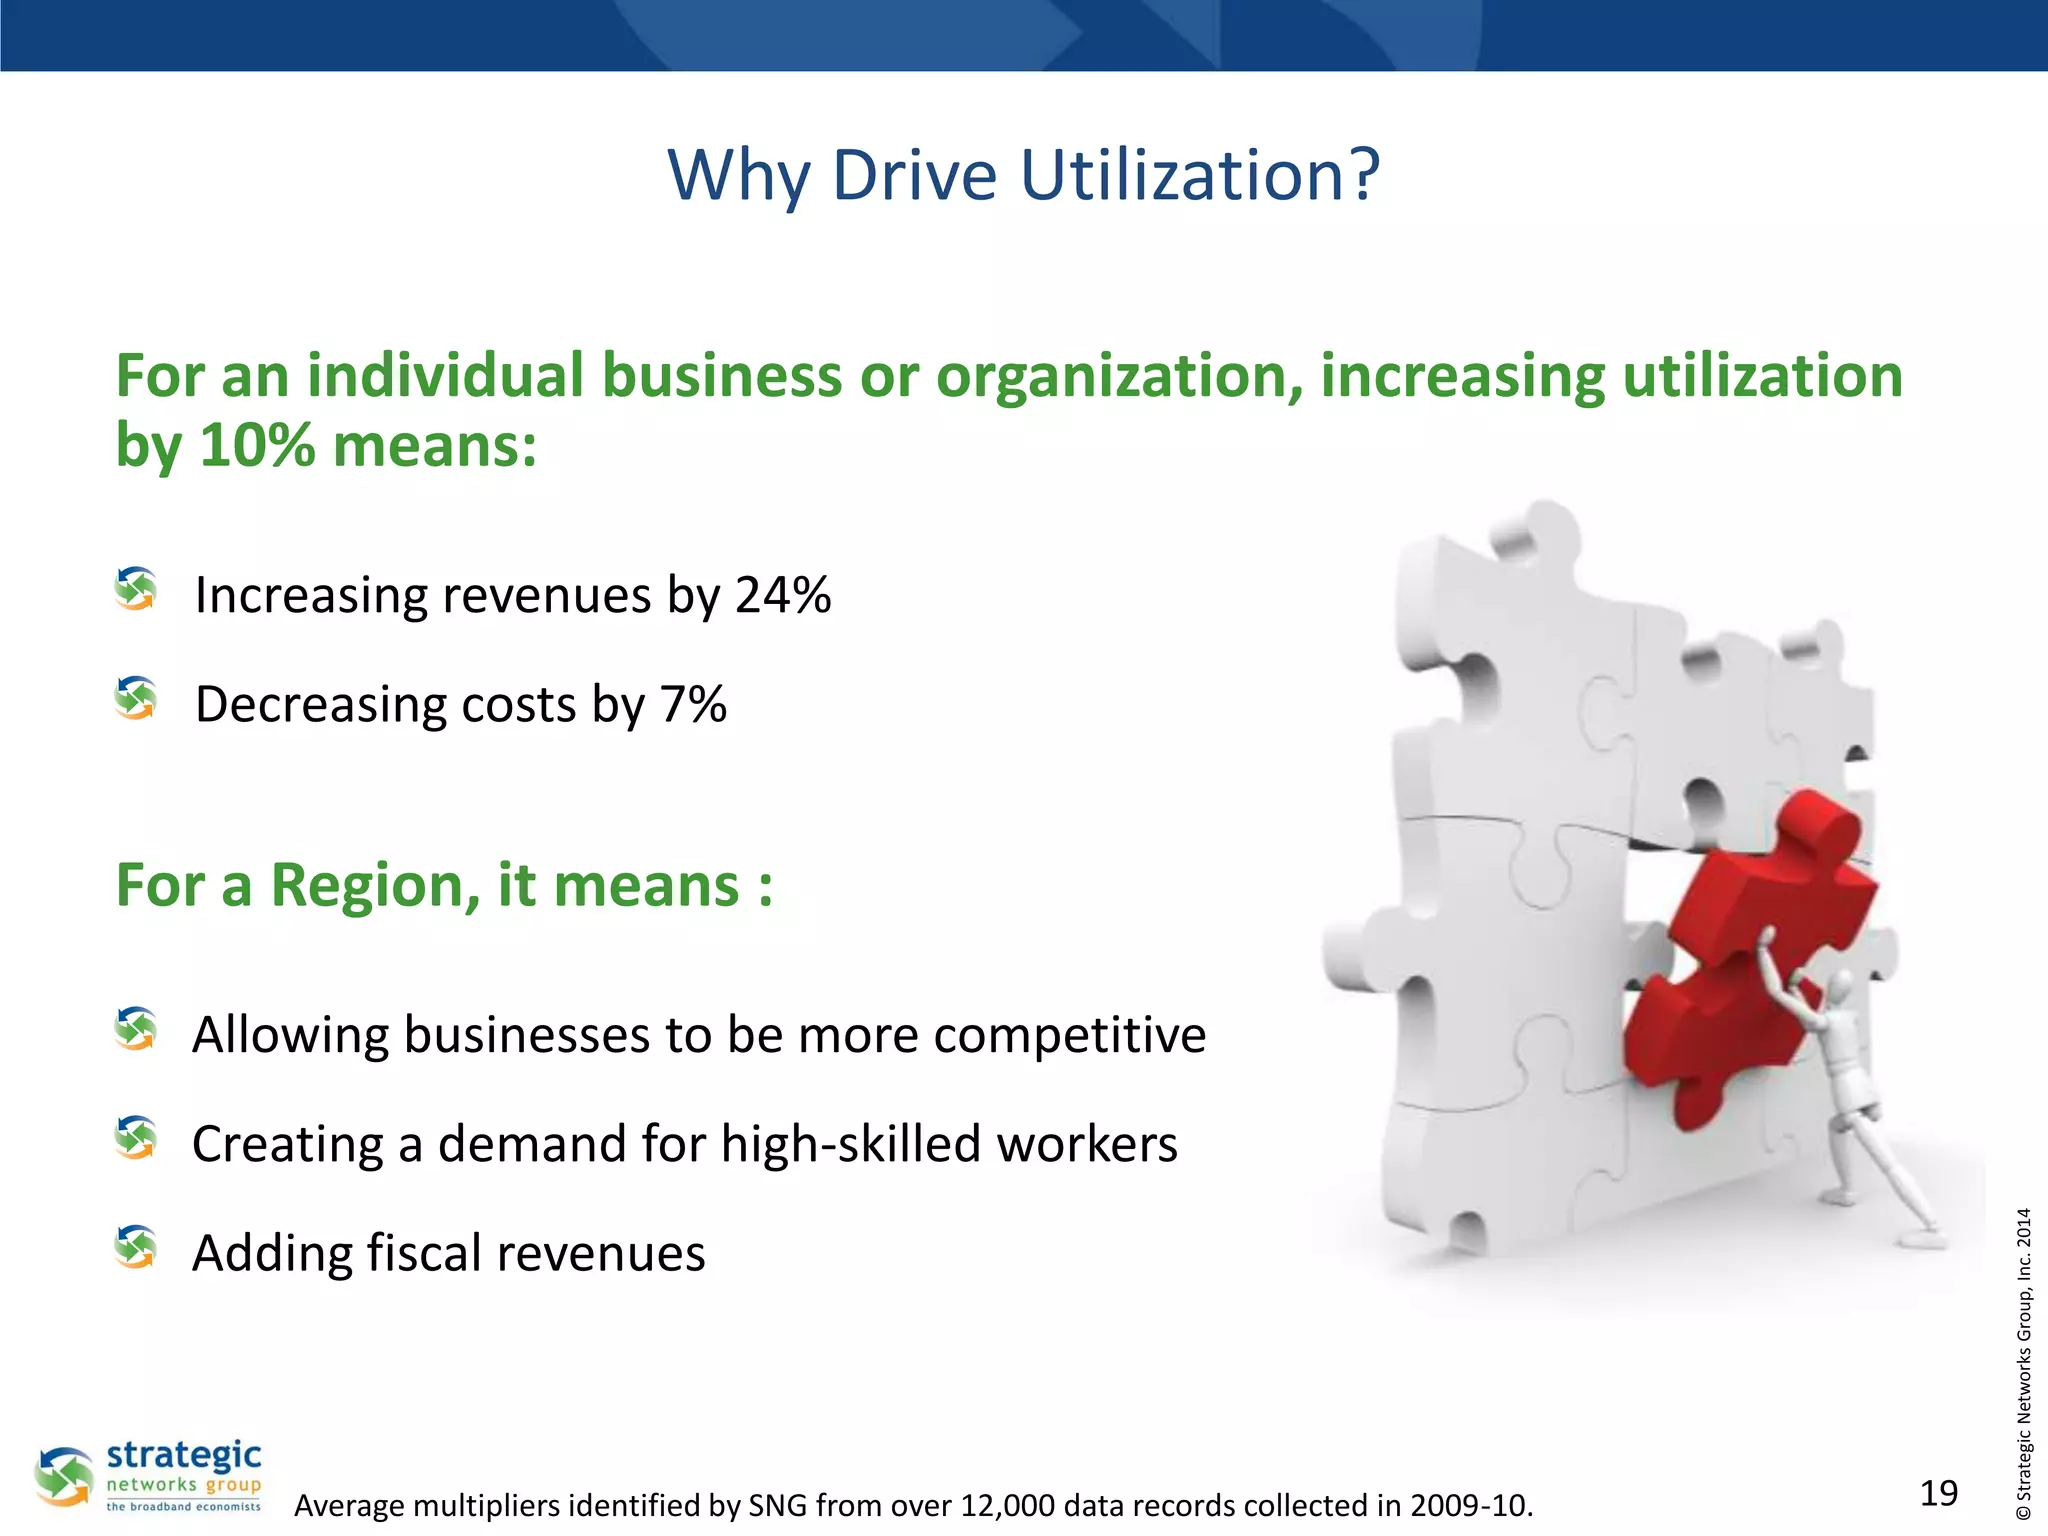
Border to Border Broadband: A Call to Action
February 5, 2014
Saint Paul, Minnesota

© Strategic Networks Group, Inc. 2014

Motivating Business
Broadband Utilization
Let’s Start With What We Know…
• There is a relationship between broadband and
economic development.
– 56% of businesses and organizations said broadband is
essential for remaining in current location
– 56% of households said they would definitely/likely
relocate if broadband was not available
– 32% of households work from home or have a homebased business

Source: SNG Digital Economy Database n = 19,951 businesses and 9,318 households

2

© Strategic Networks Group, Inc. 2014

• SNG research in the U.S shows…
…and Broadband Means Jobs
Broadband is responsible for 23.4% of all new jobs

35%

30.9%

Percent of New Jobs
Related to Internet

29.1%

30%
25%

21.1%

23.4%

By Size of Employer Group

19.1%

15%

Small businesses
create 12x more
Internet jobs
relative to large
firms

10%
5%
0%

Employees
Source: SNG Digital Economy Database n = 6,177

3

© Strategic Networks Group, Inc. 2014

20%
Broadband …

Adoption

Utilization

4

© Strategic Networks Group, Inc. 2014

Availability
“Crossing the Chasm”

… so driving awareness and utilization is the next challenge
For further information, see “No Field of Dreams: Eliminating the Waiting Game and Driving Uptake”

5

© Strategic Networks Group, Inc. 2014

Why “build-it and they will come” does not work?
→ Because people buy benefits, not features
What’s so hard about utilization?
Quick to Adopt
‘Laissez-faire’ approach “Okay”

Business Applications

Slow to Adopt
Need to ‘lead horse to water’

Business Applications

Buying Online

Selling Online

Basic Website

Online media (video)

e-mail
Document transfer
Household Applications
e-mail

Banking
News and Sports
Information gathering

Teleworking
Delivering Content and
Services

BIGGEST
BENEFITS

Social Networking
Household Applications
Entertainment

Investments and Trading
VoIP
Home Based Business
6

© Strategic Networks Group, Inc. 2014

Research and accessing
information
Increased Utilization Directly
Correlates to Revenue Growth
60%

50%

40%

30%

54.0%

20%

10%

20.7%

24.4%

31.1%

33.7%

0%

5 up to 6

6 up to 7

7 up to 8

8 up to 9

Level of Broadband Utilization (DEi score)

9 up to 10
N = 2,103

Businesses underutilizing the Internet miss significant revenue opportunities
7

© Strategic Networks Group, Inc. 2014

% of Revenues attributed from Internet usage

Contribution of Internet to Revenues / Level of utilization
How Can You Achieve Utilization?

© Strategic Networks Group, Inc. 2014

Lead with the BENEFITS of Applications
Active, Actionable Data Is the Key to Capitalizing on the
Transformative Economic Benefits of Broadband
The right metrics and data help you:
Understand the local market demand for broadband

•

Assess potential socio-economic impacts (community ROI)

•

Develop an action plan for regions and individual
businesses/organizations that will achieve desired results

9

© Strategic Networks Group, Inc. 2014

•
What are Broadband Metrics?
Census Data - good to have

Active broadband metrics - need to have

Type of connection

Measure broadband speed vs. advertised speed

Broadband speed

Broadband satisfaction by end-users

Material resources

Utilization of Internet enabled tools and processes
Benefits from broadband on daily operations

Barriers to adopt broadband and to use Internet enabled
tools and processes
Quantified impacts from broadband on revenues, cost savings

Quantified impacts on job creation
Digital Economy index scoring at an individual level - industry
sector level, regional level, etc.
Special use and daily benefits metrics for Community anchors
institutions
Industry sector focus studies, comparison and benchmarking
Regional focus studies and comparison

10
10

© Strategic Networks Group, Inc. 2014

Skills needed and preferred method of acquisitions
Metrics for:
…. where are we now?

11

© Strategic Networks Group, Inc. 2014

… and how much closer
are we to our goal?
So What Should You Measure?
Utilization

Gaps and Barriers

Drivers and Needs

How
businesses, organizations, an
d households are currently
using, or planning to use
broadband and e-solutions.

Where the gaps in the
utilization of e-solutions are
and which factors inhibit, or
prevent adoption.

Understanding the needs
and preferences of endusers in order to raise
awareness, to increase
adoption, and to drive
effective utilization.

Benefits

Impacts

How things have improved
and which e-solutions have
benefitted
businesses, organizations, an
d households.

Quantify benefits in terms of
new revenues, cost
efficiencies, new
jobs, quality of life, etc.

Internet connection
type, tested speed, length of
time using
broadband, organization
size, industry sector
classification, demographics,
etc.

12

© Strategic Networks Group, Inc. 2014

Profile Data
How SNG Measures Utilization
We uncover Internet use at a micro-level
and benchmark against peers
17 e-solutions1 by businesses / organizations
30 e-solutions1 by households
Utilization data collected2 by SNG directly
from 27,150 businesses / organizations
And 12,400 households.

Results shown use SNG’s Digital Economy index (DEi), a composite score
between 1 and 10 to reflect level of Internet utilization.
1. Internet-enabled applications and processes; 2. Between 2008-2013

13

© Strategic Networks Group, Inc. 2014

SNG has normative database with deep insights on
Internet usage and impacts – over 110 metrics for each record.
Helping Businesses Take Action

Review options

Evaluate benefits

Take action

How is the business using esolutions?
• Measure current uses and benefits
• Create greater awareness
Where are gaps and opportunities ?
• Motivation
• Compare to peers
• Reveal financial benefits
What guidance does the business need?
• Engage and advise
• Run financial impact scenarios
• Choose esolution priorities
How will businesses take action?
• Learning resources
• Choose the right tactics
• Develop a plan

Business
Assessment
Survey

DEi Scorecard

Financial Impact
Calculator

e-Business
Tactics
14

© Strategic Networks Group, Inc. 2014

Take stock
Personalize Results: DEi Scorecard
A DEi Scorecard is delivered to each
business and organization
Individualized ‘broadband health check’
that:
‒ benchmarks competitiveness against
peers
‒ estimates ROI from increased utilization
‒ provides links to local advisors and
support

Shared with local economic development
agencies so they can raise
awareness, increase adoption, and drive
utilization
15

© Strategic Networks Group, Inc. 2014

Data based on the individual’s current
broadband utilization against industry
average
DEi Impact Calculator
- choose e-strategy based on ROI -

1. Select your organization characteristics

Source: SNG Digital Economy Database n = 27,200

16

© Strategic Networks Group, Inc. 2014

2. Select your actual and needed e-Solutions
DEi Impact Calculator
- choose e-strategy based on ROI -

3. See your potential benefits from increased utilization

Source: SNG Digital Economy Database n = 27,200

17

© Strategic Networks Group, Inc. 2014

4. Details of potential revenues and cost savings
North Georgia example
Economic Impact for every 100 businesses trained
in North Georgia who adopt eSolutions:
Industries

Aggregate additional
revenues (annually)
$7.2 Million

Manufacturing

$17.5 Million

Professional and Tech Services

$2.7 Million

Tourism

$4.8 Million

18

© Strategic Networks Group, Inc. 2014

All Industries
Why Drive Utilization?
For an individual business or organization, increasing utilization
by 10% means:
Increasing revenues by 24%
Decreasing costs by 7%

For a Region, it means :
Allowing businesses to be more competitive

Adding fiscal revenues

Average multipliers identified by SNG from over 12,000 data records collected in 2009-10.

19

© Strategic Networks Group, Inc. 2014

Creating a demand for high-skilled workers
Thank You

Let’s connect !
www.sngroup.com
20

© Strategic Networks Group, Inc. 2014

Michael Curri, President
Strategic Networks Group, Inc.
+1 202.558.2128
mcurri@sngroup.com

SNG Minnesota - Motivating Broadband Utilization

  • 1.
    Border to BorderBroadband: A Call to Action February 5, 2014 Saint Paul, Minnesota © Strategic Networks Group, Inc. 2014 Motivating Business Broadband Utilization
  • 2.
    Let’s Start WithWhat We Know… • There is a relationship between broadband and economic development. – 56% of businesses and organizations said broadband is essential for remaining in current location – 56% of households said they would definitely/likely relocate if broadband was not available – 32% of households work from home or have a homebased business Source: SNG Digital Economy Database n = 19,951 businesses and 9,318 households 2 © Strategic Networks Group, Inc. 2014 • SNG research in the U.S shows…
  • 3.
    …and Broadband MeansJobs Broadband is responsible for 23.4% of all new jobs 35% 30.9% Percent of New Jobs Related to Internet 29.1% 30% 25% 21.1% 23.4% By Size of Employer Group 19.1% 15% Small businesses create 12x more Internet jobs relative to large firms 10% 5% 0% Employees Source: SNG Digital Economy Database n = 6,177 3 © Strategic Networks Group, Inc. 2014 20%
  • 4.
    Broadband … Adoption Utilization 4 © StrategicNetworks Group, Inc. 2014 Availability
  • 5.
    “Crossing the Chasm” …so driving awareness and utilization is the next challenge For further information, see “No Field of Dreams: Eliminating the Waiting Game and Driving Uptake” 5 © Strategic Networks Group, Inc. 2014 Why “build-it and they will come” does not work? → Because people buy benefits, not features
  • 6.
    What’s so hardabout utilization? Quick to Adopt ‘Laissez-faire’ approach “Okay” Business Applications Slow to Adopt Need to ‘lead horse to water’ Business Applications Buying Online Selling Online Basic Website Online media (video) e-mail Document transfer Household Applications e-mail Banking News and Sports Information gathering Teleworking Delivering Content and Services BIGGEST BENEFITS Social Networking Household Applications Entertainment Investments and Trading VoIP Home Based Business 6 © Strategic Networks Group, Inc. 2014 Research and accessing information
  • 7.
    Increased Utilization Directly Correlatesto Revenue Growth 60% 50% 40% 30% 54.0% 20% 10% 20.7% 24.4% 31.1% 33.7% 0% 5 up to 6 6 up to 7 7 up to 8 8 up to 9 Level of Broadband Utilization (DEi score) 9 up to 10 N = 2,103 Businesses underutilizing the Internet miss significant revenue opportunities 7 © Strategic Networks Group, Inc. 2014 % of Revenues attributed from Internet usage Contribution of Internet to Revenues / Level of utilization
  • 8.
    How Can YouAchieve Utilization? © Strategic Networks Group, Inc. 2014 Lead with the BENEFITS of Applications
  • 9.
    Active, Actionable DataIs the Key to Capitalizing on the Transformative Economic Benefits of Broadband The right metrics and data help you: Understand the local market demand for broadband • Assess potential socio-economic impacts (community ROI) • Develop an action plan for regions and individual businesses/organizations that will achieve desired results 9 © Strategic Networks Group, Inc. 2014 •
  • 10.
    What are BroadbandMetrics? Census Data - good to have Active broadband metrics - need to have Type of connection Measure broadband speed vs. advertised speed Broadband speed Broadband satisfaction by end-users Material resources Utilization of Internet enabled tools and processes Benefits from broadband on daily operations Barriers to adopt broadband and to use Internet enabled tools and processes Quantified impacts from broadband on revenues, cost savings Quantified impacts on job creation Digital Economy index scoring at an individual level - industry sector level, regional level, etc. Special use and daily benefits metrics for Community anchors institutions Industry sector focus studies, comparison and benchmarking Regional focus studies and comparison 10 10 © Strategic Networks Group, Inc. 2014 Skills needed and preferred method of acquisitions
  • 11.
    Metrics for: …. whereare we now? 11 © Strategic Networks Group, Inc. 2014 … and how much closer are we to our goal?
  • 12.
    So What ShouldYou Measure? Utilization Gaps and Barriers Drivers and Needs How businesses, organizations, an d households are currently using, or planning to use broadband and e-solutions. Where the gaps in the utilization of e-solutions are and which factors inhibit, or prevent adoption. Understanding the needs and preferences of endusers in order to raise awareness, to increase adoption, and to drive effective utilization. Benefits Impacts How things have improved and which e-solutions have benefitted businesses, organizations, an d households. Quantify benefits in terms of new revenues, cost efficiencies, new jobs, quality of life, etc. Internet connection type, tested speed, length of time using broadband, organization size, industry sector classification, demographics, etc. 12 © Strategic Networks Group, Inc. 2014 Profile Data
  • 13.
    How SNG MeasuresUtilization We uncover Internet use at a micro-level and benchmark against peers 17 e-solutions1 by businesses / organizations 30 e-solutions1 by households Utilization data collected2 by SNG directly from 27,150 businesses / organizations And 12,400 households. Results shown use SNG’s Digital Economy index (DEi), a composite score between 1 and 10 to reflect level of Internet utilization. 1. Internet-enabled applications and processes; 2. Between 2008-2013 13 © Strategic Networks Group, Inc. 2014 SNG has normative database with deep insights on Internet usage and impacts – over 110 metrics for each record.
  • 14.
    Helping Businesses TakeAction Review options Evaluate benefits Take action How is the business using esolutions? • Measure current uses and benefits • Create greater awareness Where are gaps and opportunities ? • Motivation • Compare to peers • Reveal financial benefits What guidance does the business need? • Engage and advise • Run financial impact scenarios • Choose esolution priorities How will businesses take action? • Learning resources • Choose the right tactics • Develop a plan Business Assessment Survey DEi Scorecard Financial Impact Calculator e-Business Tactics 14 © Strategic Networks Group, Inc. 2014 Take stock
  • 15.
    Personalize Results: DEiScorecard A DEi Scorecard is delivered to each business and organization Individualized ‘broadband health check’ that: ‒ benchmarks competitiveness against peers ‒ estimates ROI from increased utilization ‒ provides links to local advisors and support Shared with local economic development agencies so they can raise awareness, increase adoption, and drive utilization 15 © Strategic Networks Group, Inc. 2014 Data based on the individual’s current broadband utilization against industry average
  • 16.
    DEi Impact Calculator -choose e-strategy based on ROI - 1. Select your organization characteristics Source: SNG Digital Economy Database n = 27,200 16 © Strategic Networks Group, Inc. 2014 2. Select your actual and needed e-Solutions
  • 17.
    DEi Impact Calculator -choose e-strategy based on ROI - 3. See your potential benefits from increased utilization Source: SNG Digital Economy Database n = 27,200 17 © Strategic Networks Group, Inc. 2014 4. Details of potential revenues and cost savings
  • 18.
    North Georgia example EconomicImpact for every 100 businesses trained in North Georgia who adopt eSolutions: Industries Aggregate additional revenues (annually) $7.2 Million Manufacturing $17.5 Million Professional and Tech Services $2.7 Million Tourism $4.8 Million 18 © Strategic Networks Group, Inc. 2014 All Industries
  • 19.
    Why Drive Utilization? Foran individual business or organization, increasing utilization by 10% means: Increasing revenues by 24% Decreasing costs by 7% For a Region, it means : Allowing businesses to be more competitive Adding fiscal revenues Average multipliers identified by SNG from over 12,000 data records collected in 2009-10. 19 © Strategic Networks Group, Inc. 2014 Creating a demand for high-skilled workers
  • 20.
    Thank You Let’s connect! www.sngroup.com 20 © Strategic Networks Group, Inc. 2014 Michael Curri, President Strategic Networks Group, Inc. +1 202.558.2128 mcurri@sngroup.com

Editor's Notes