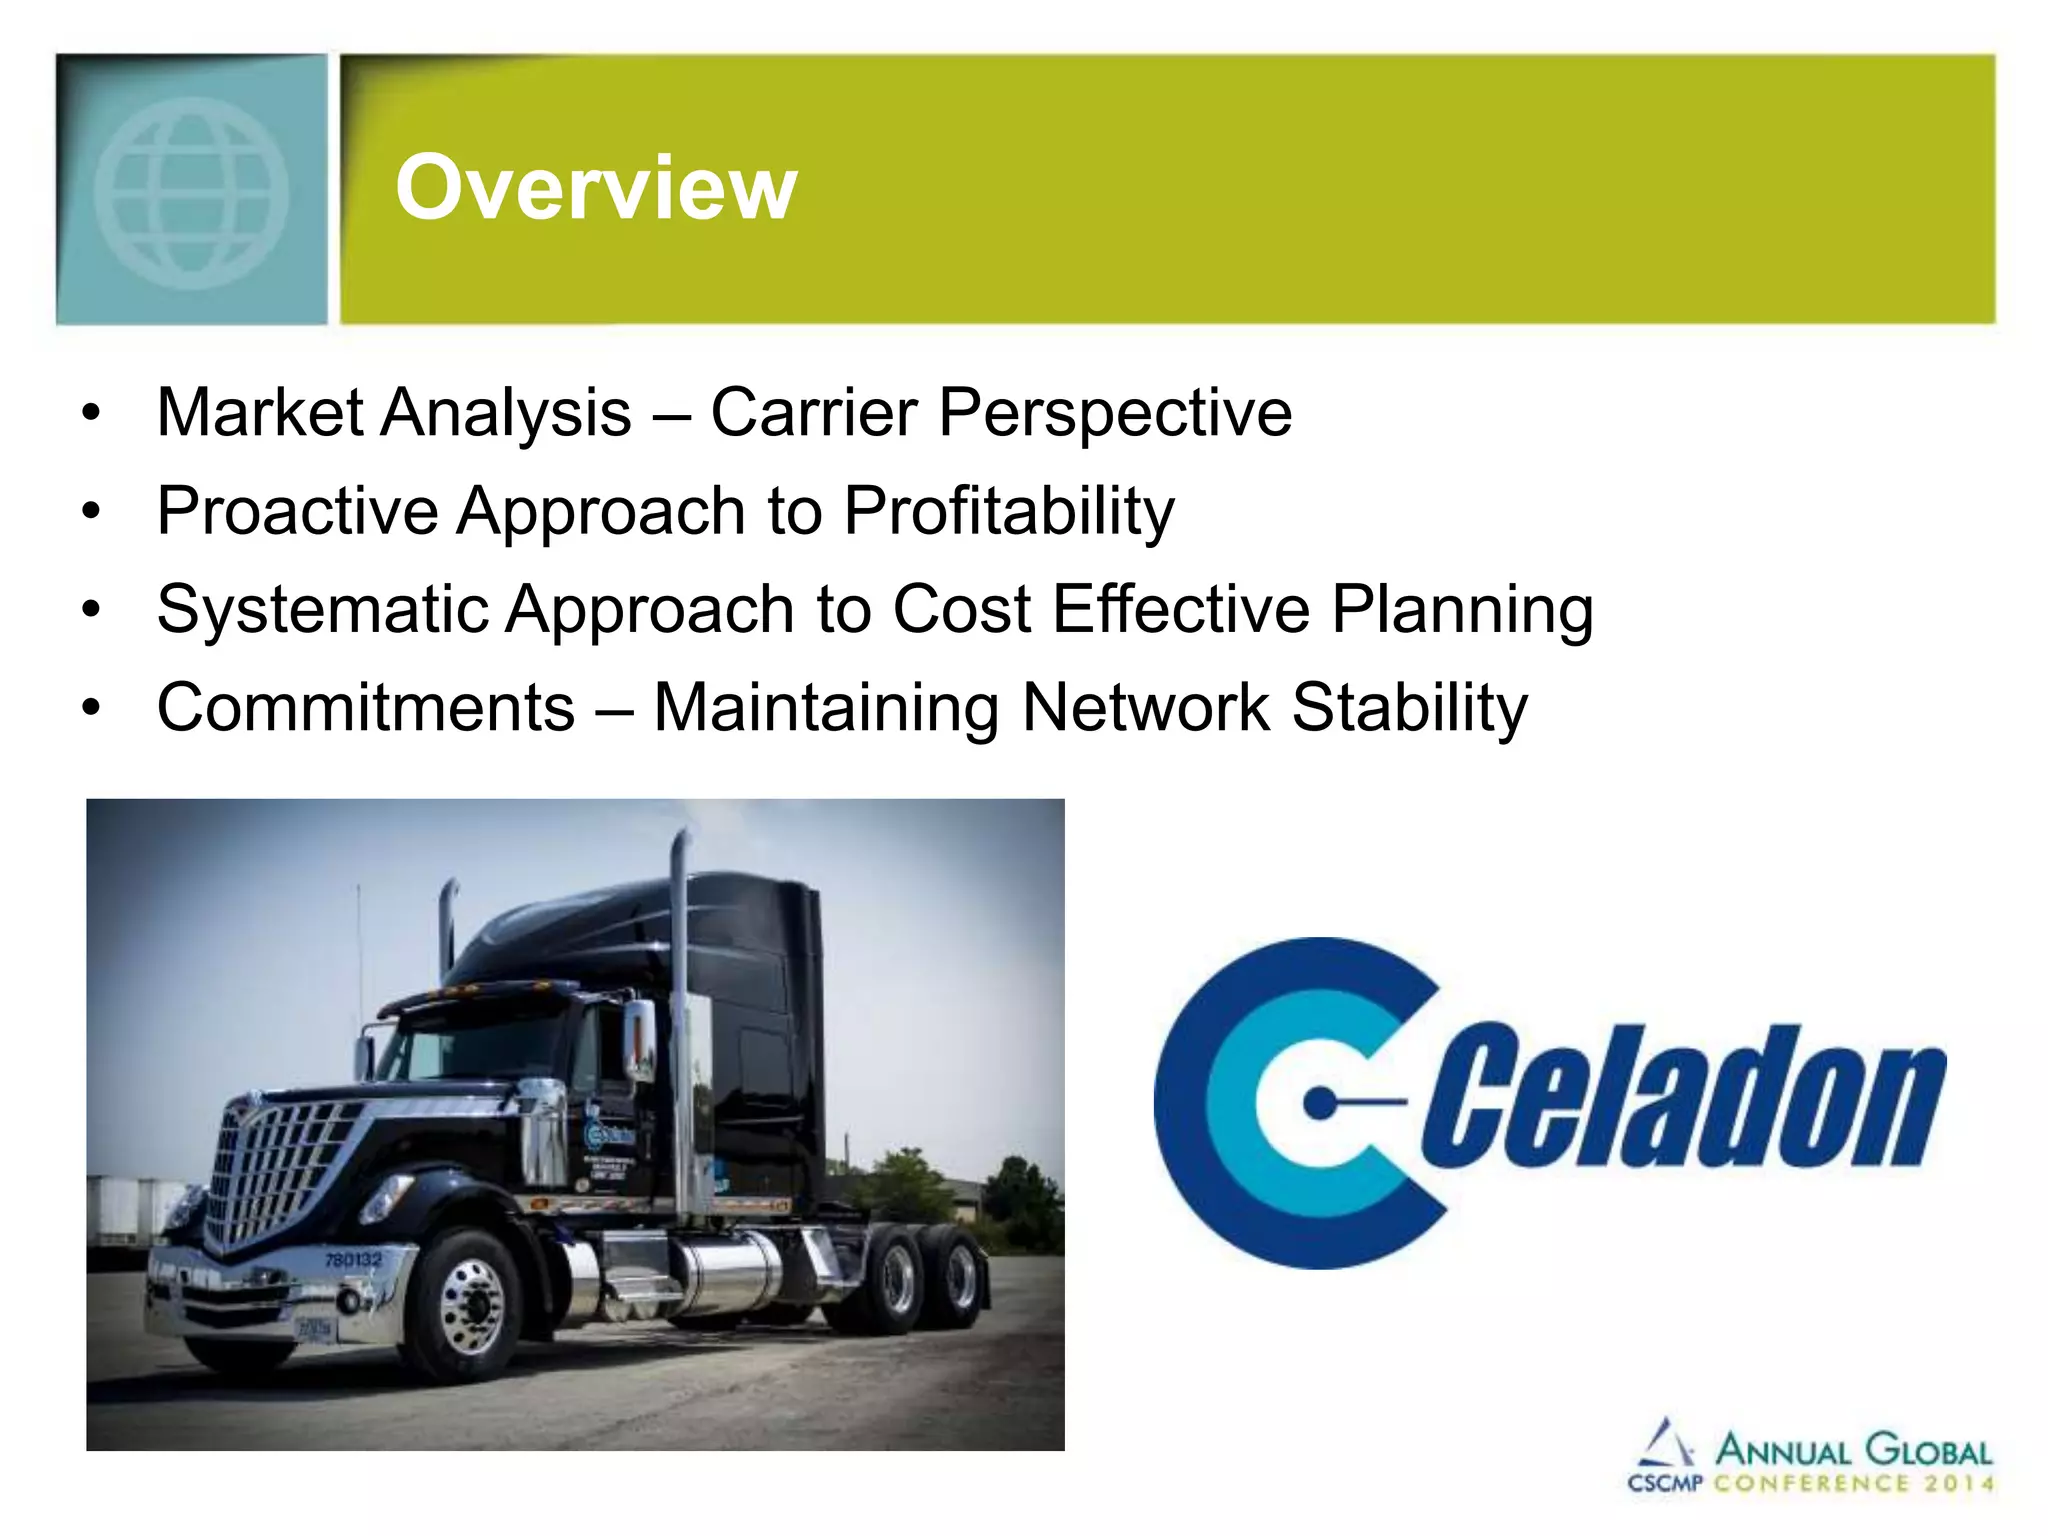
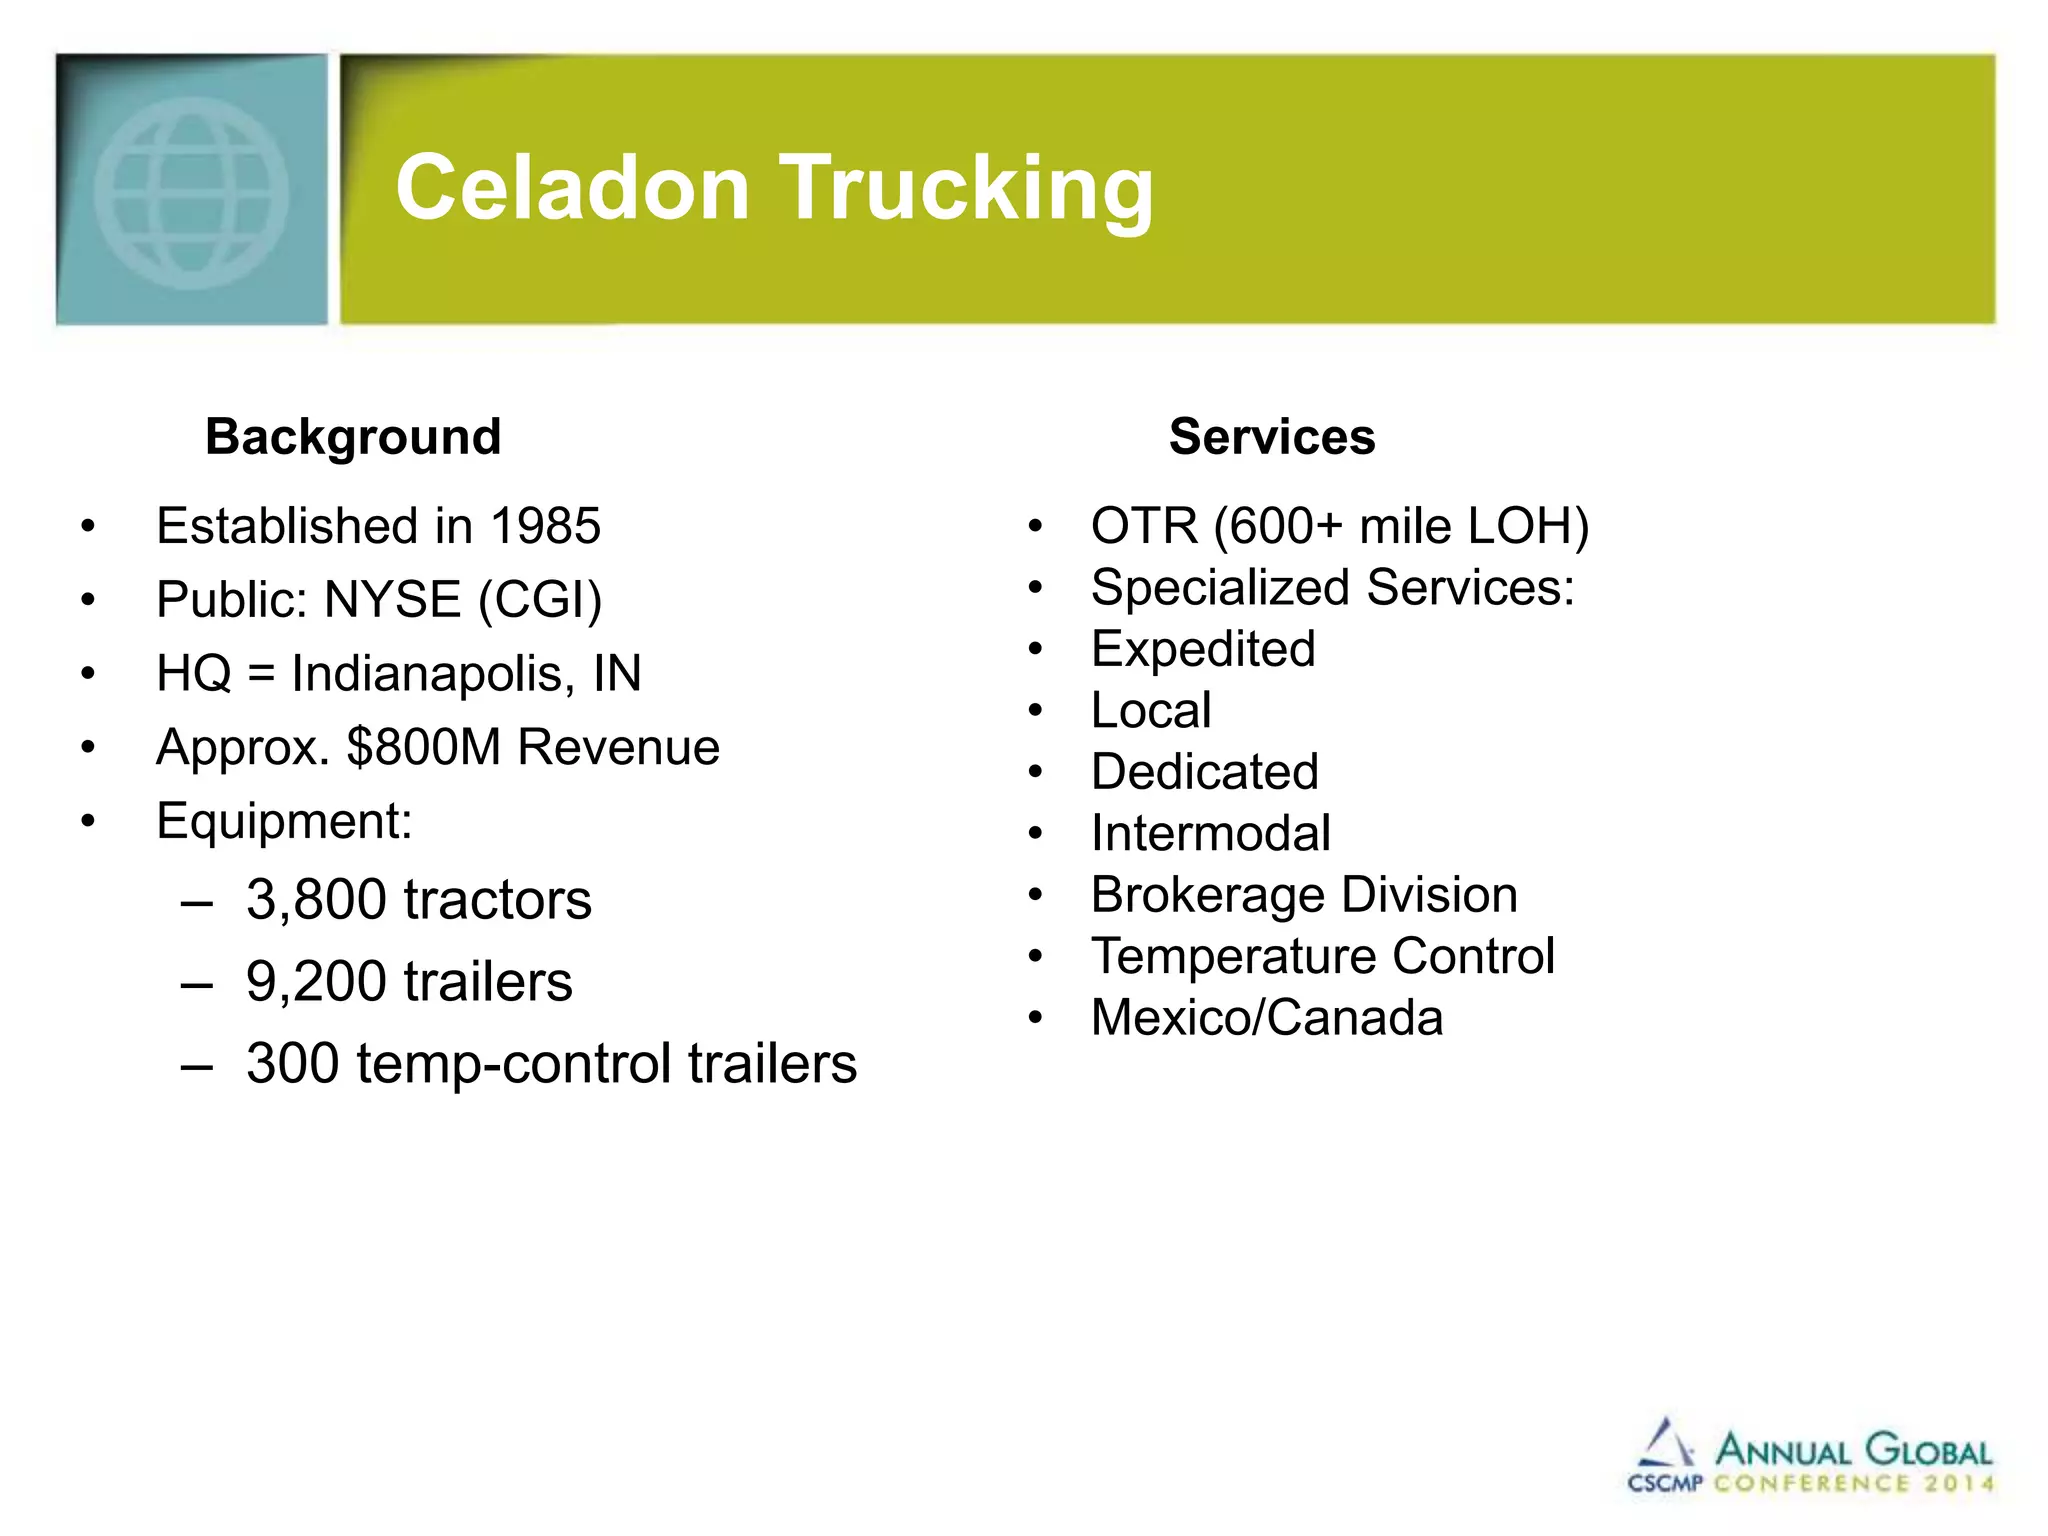
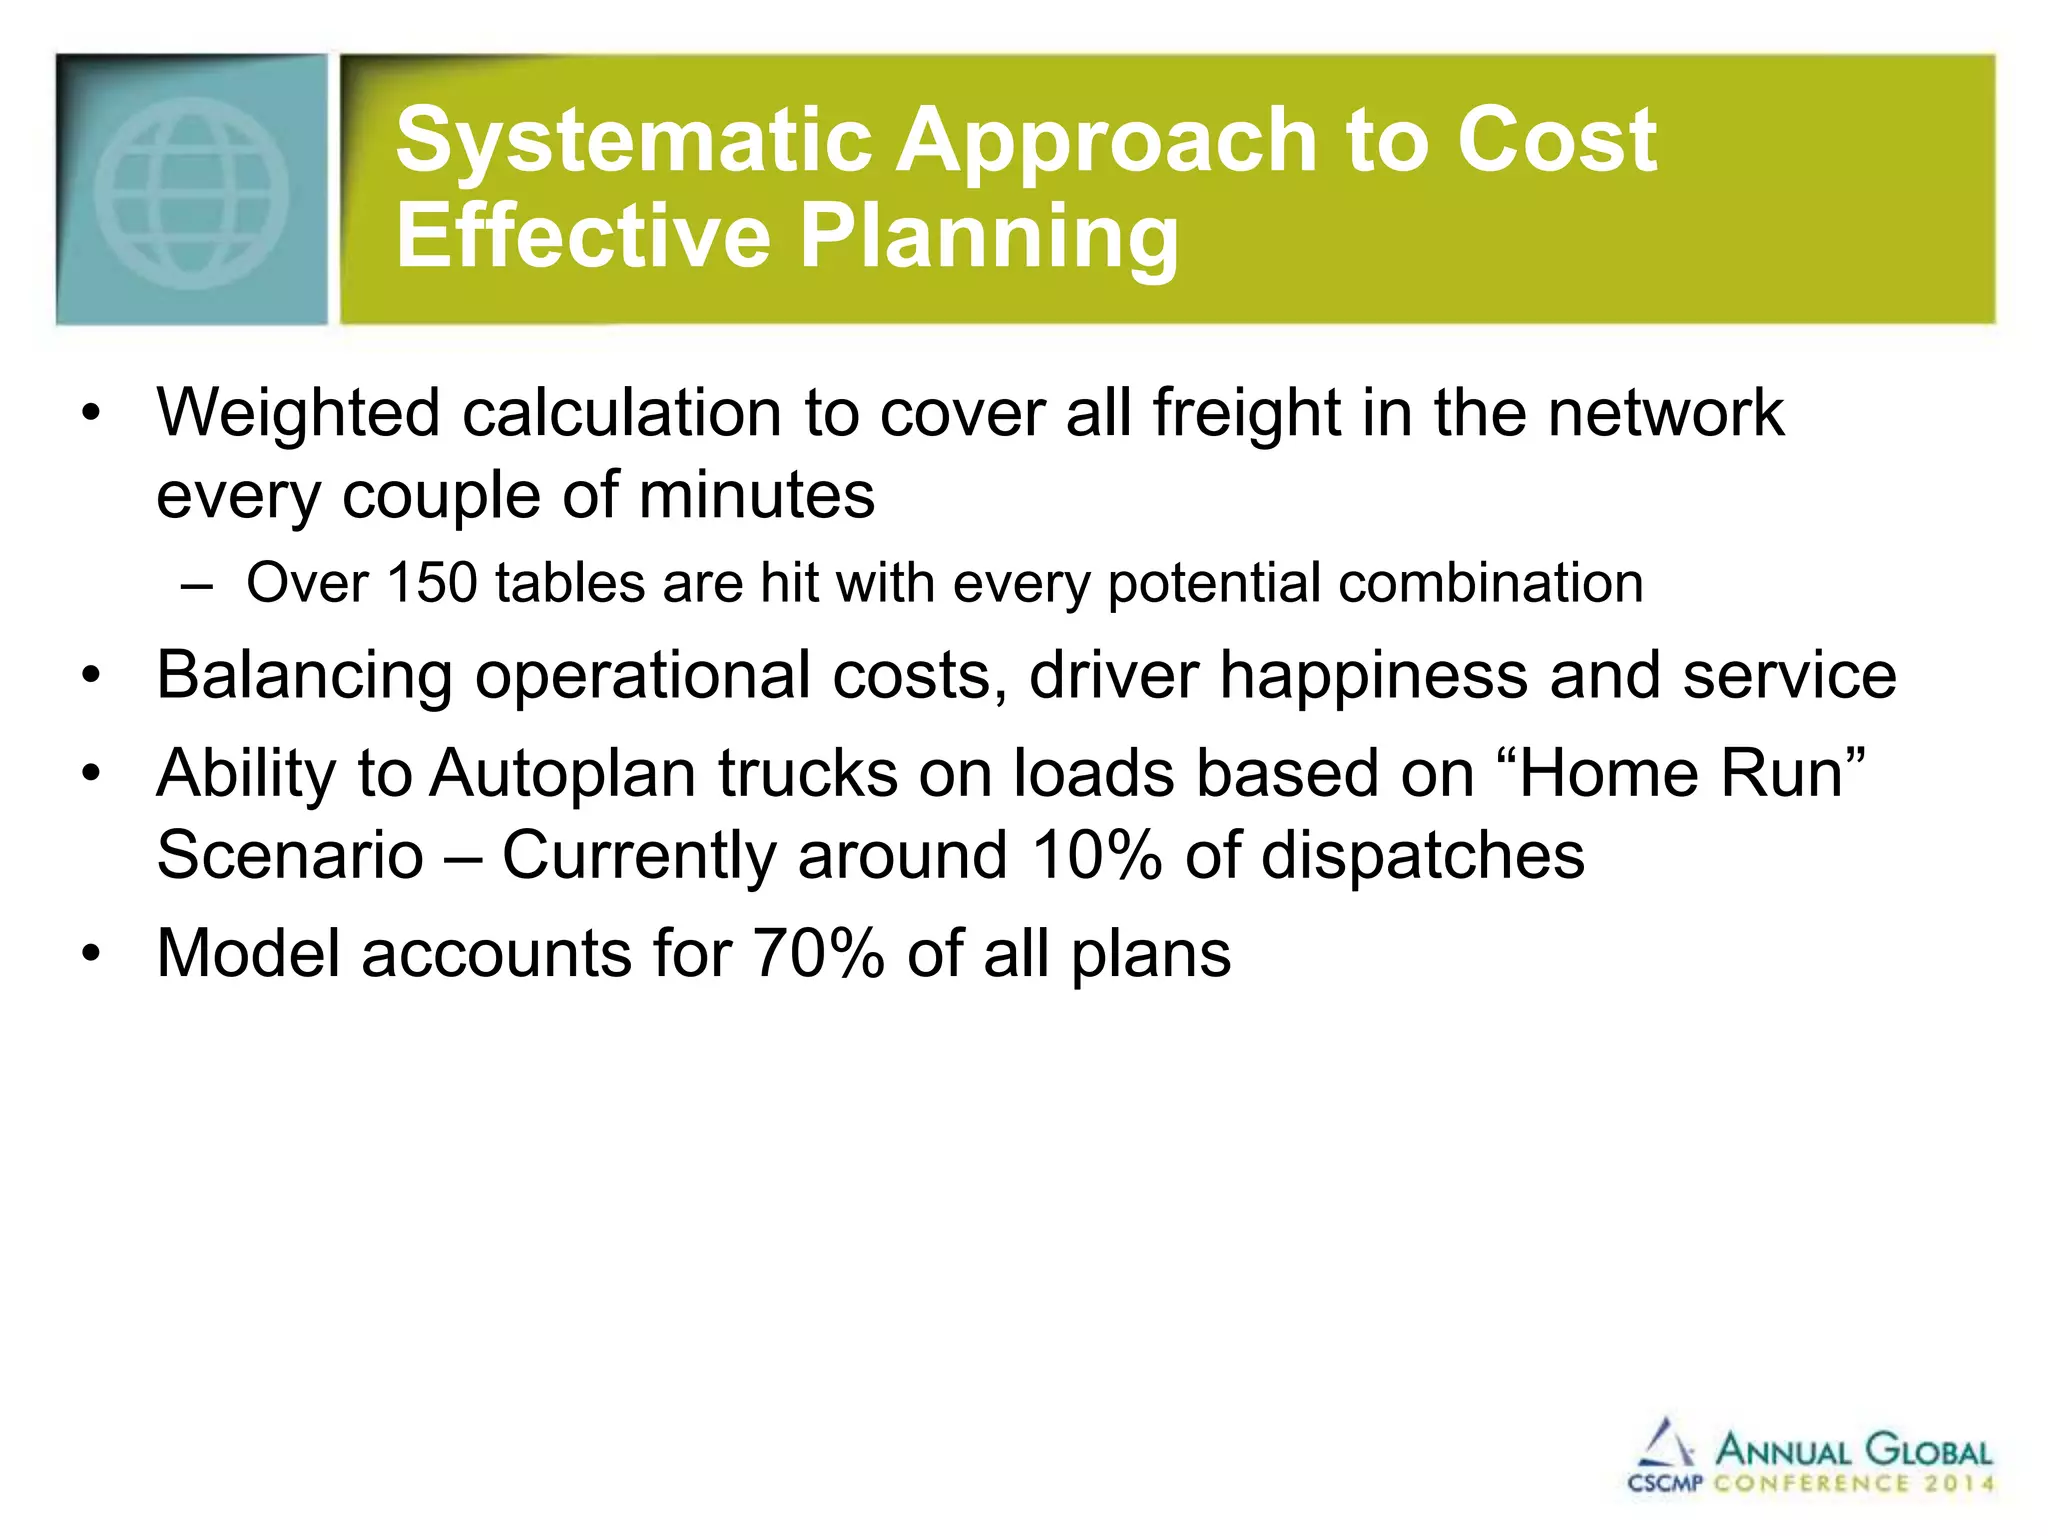
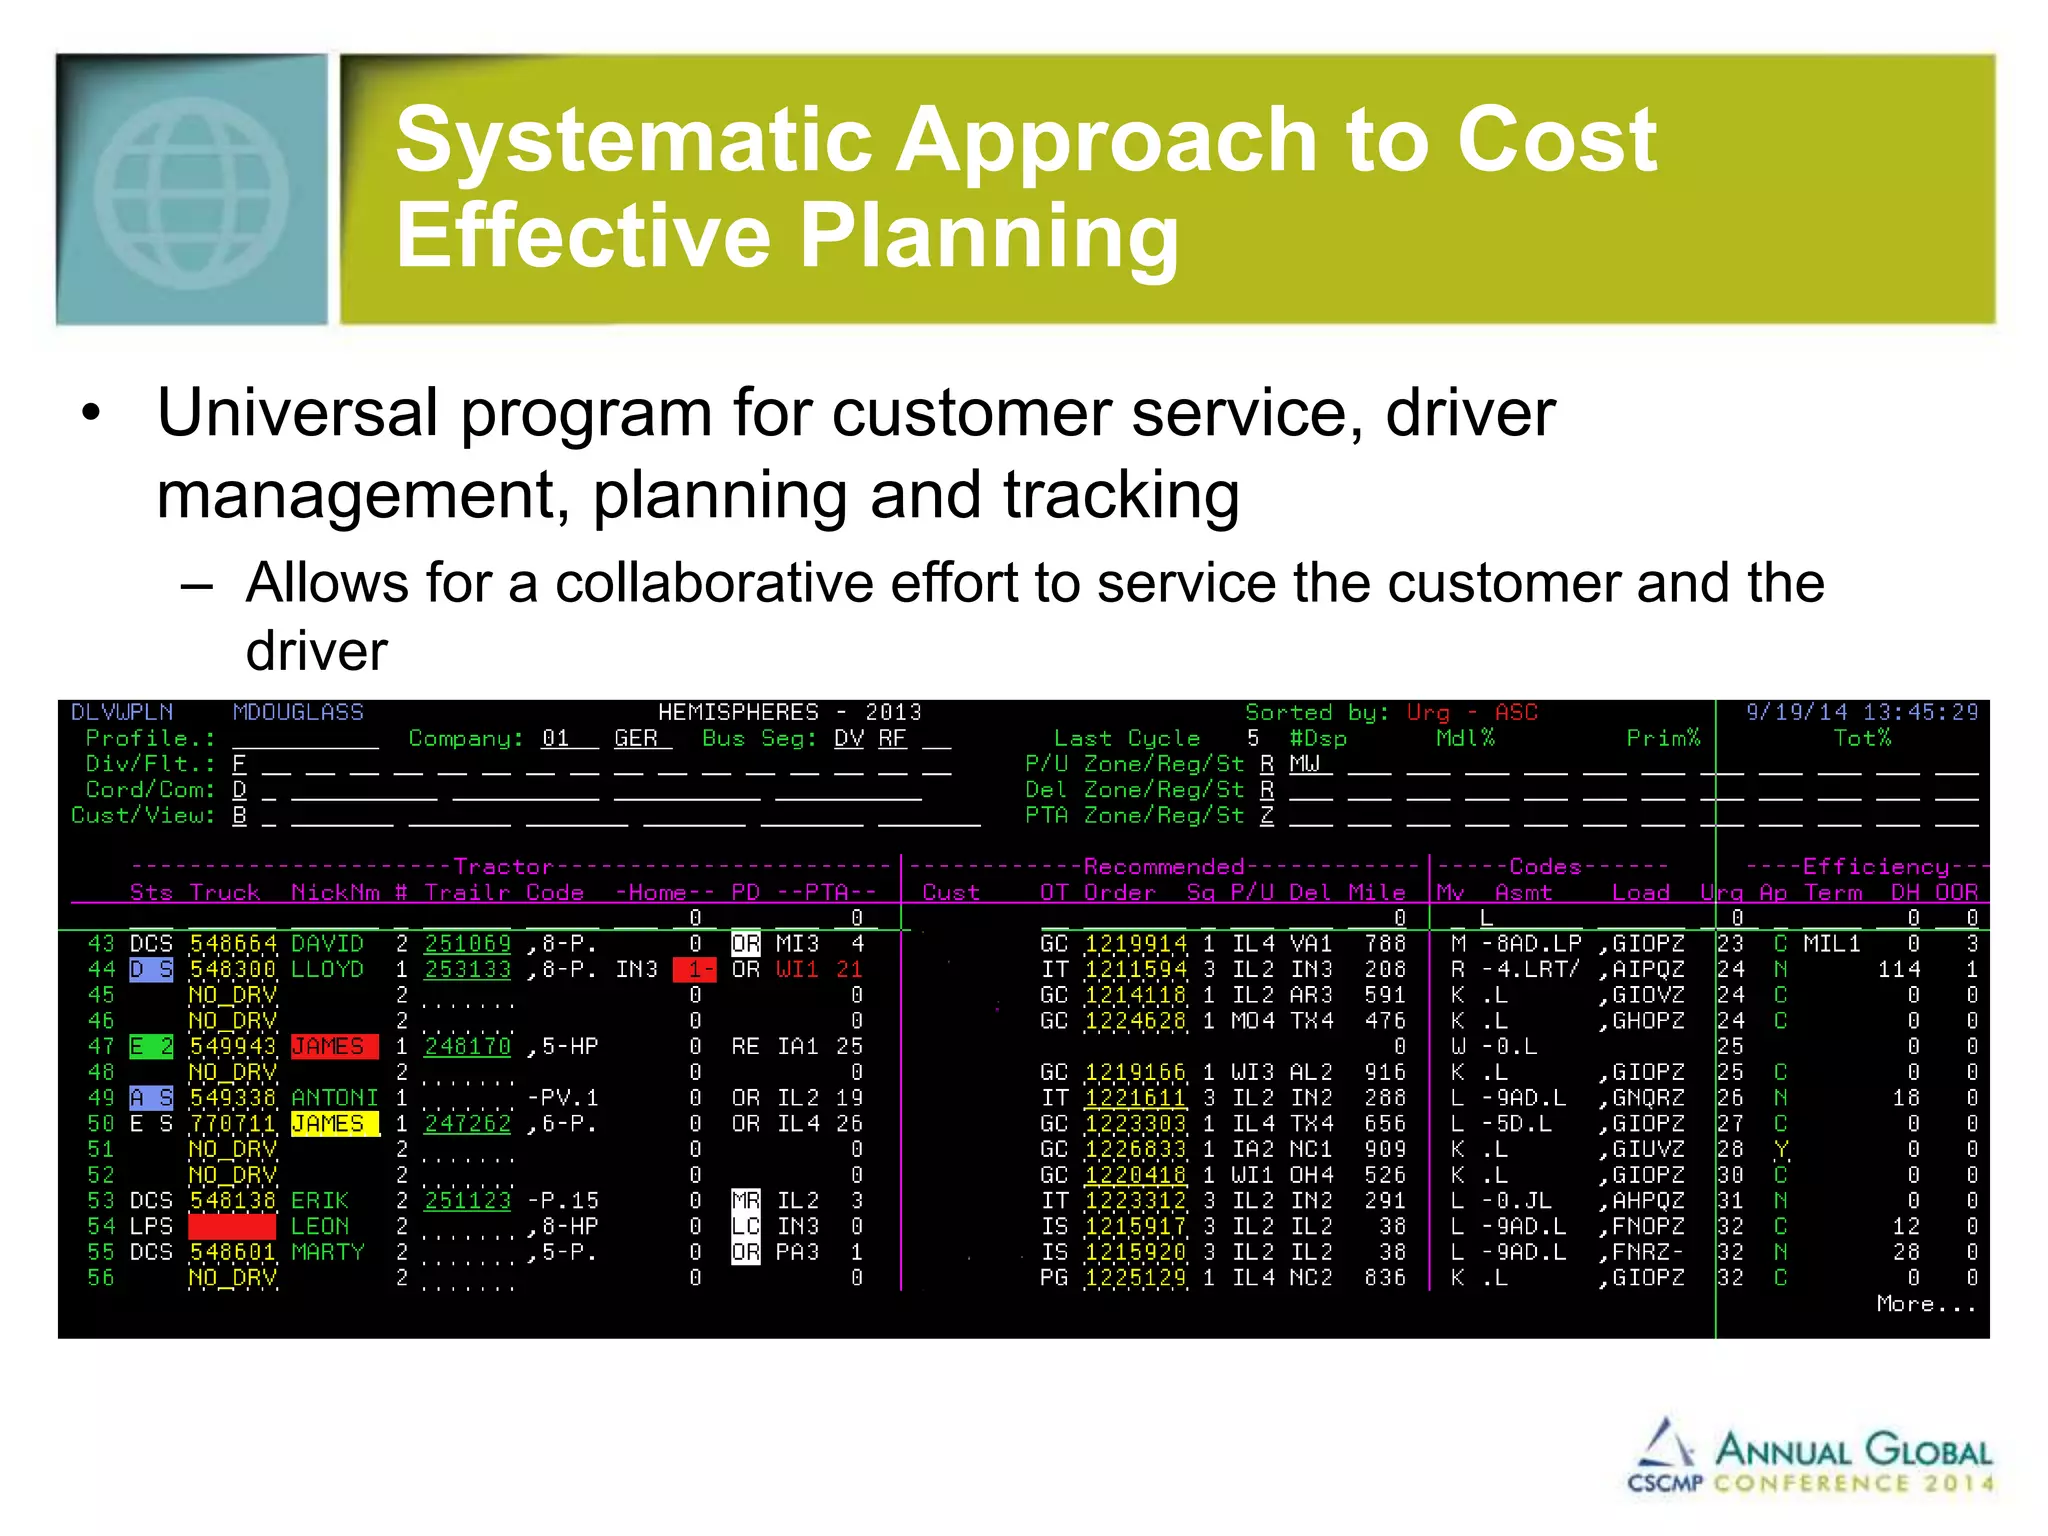
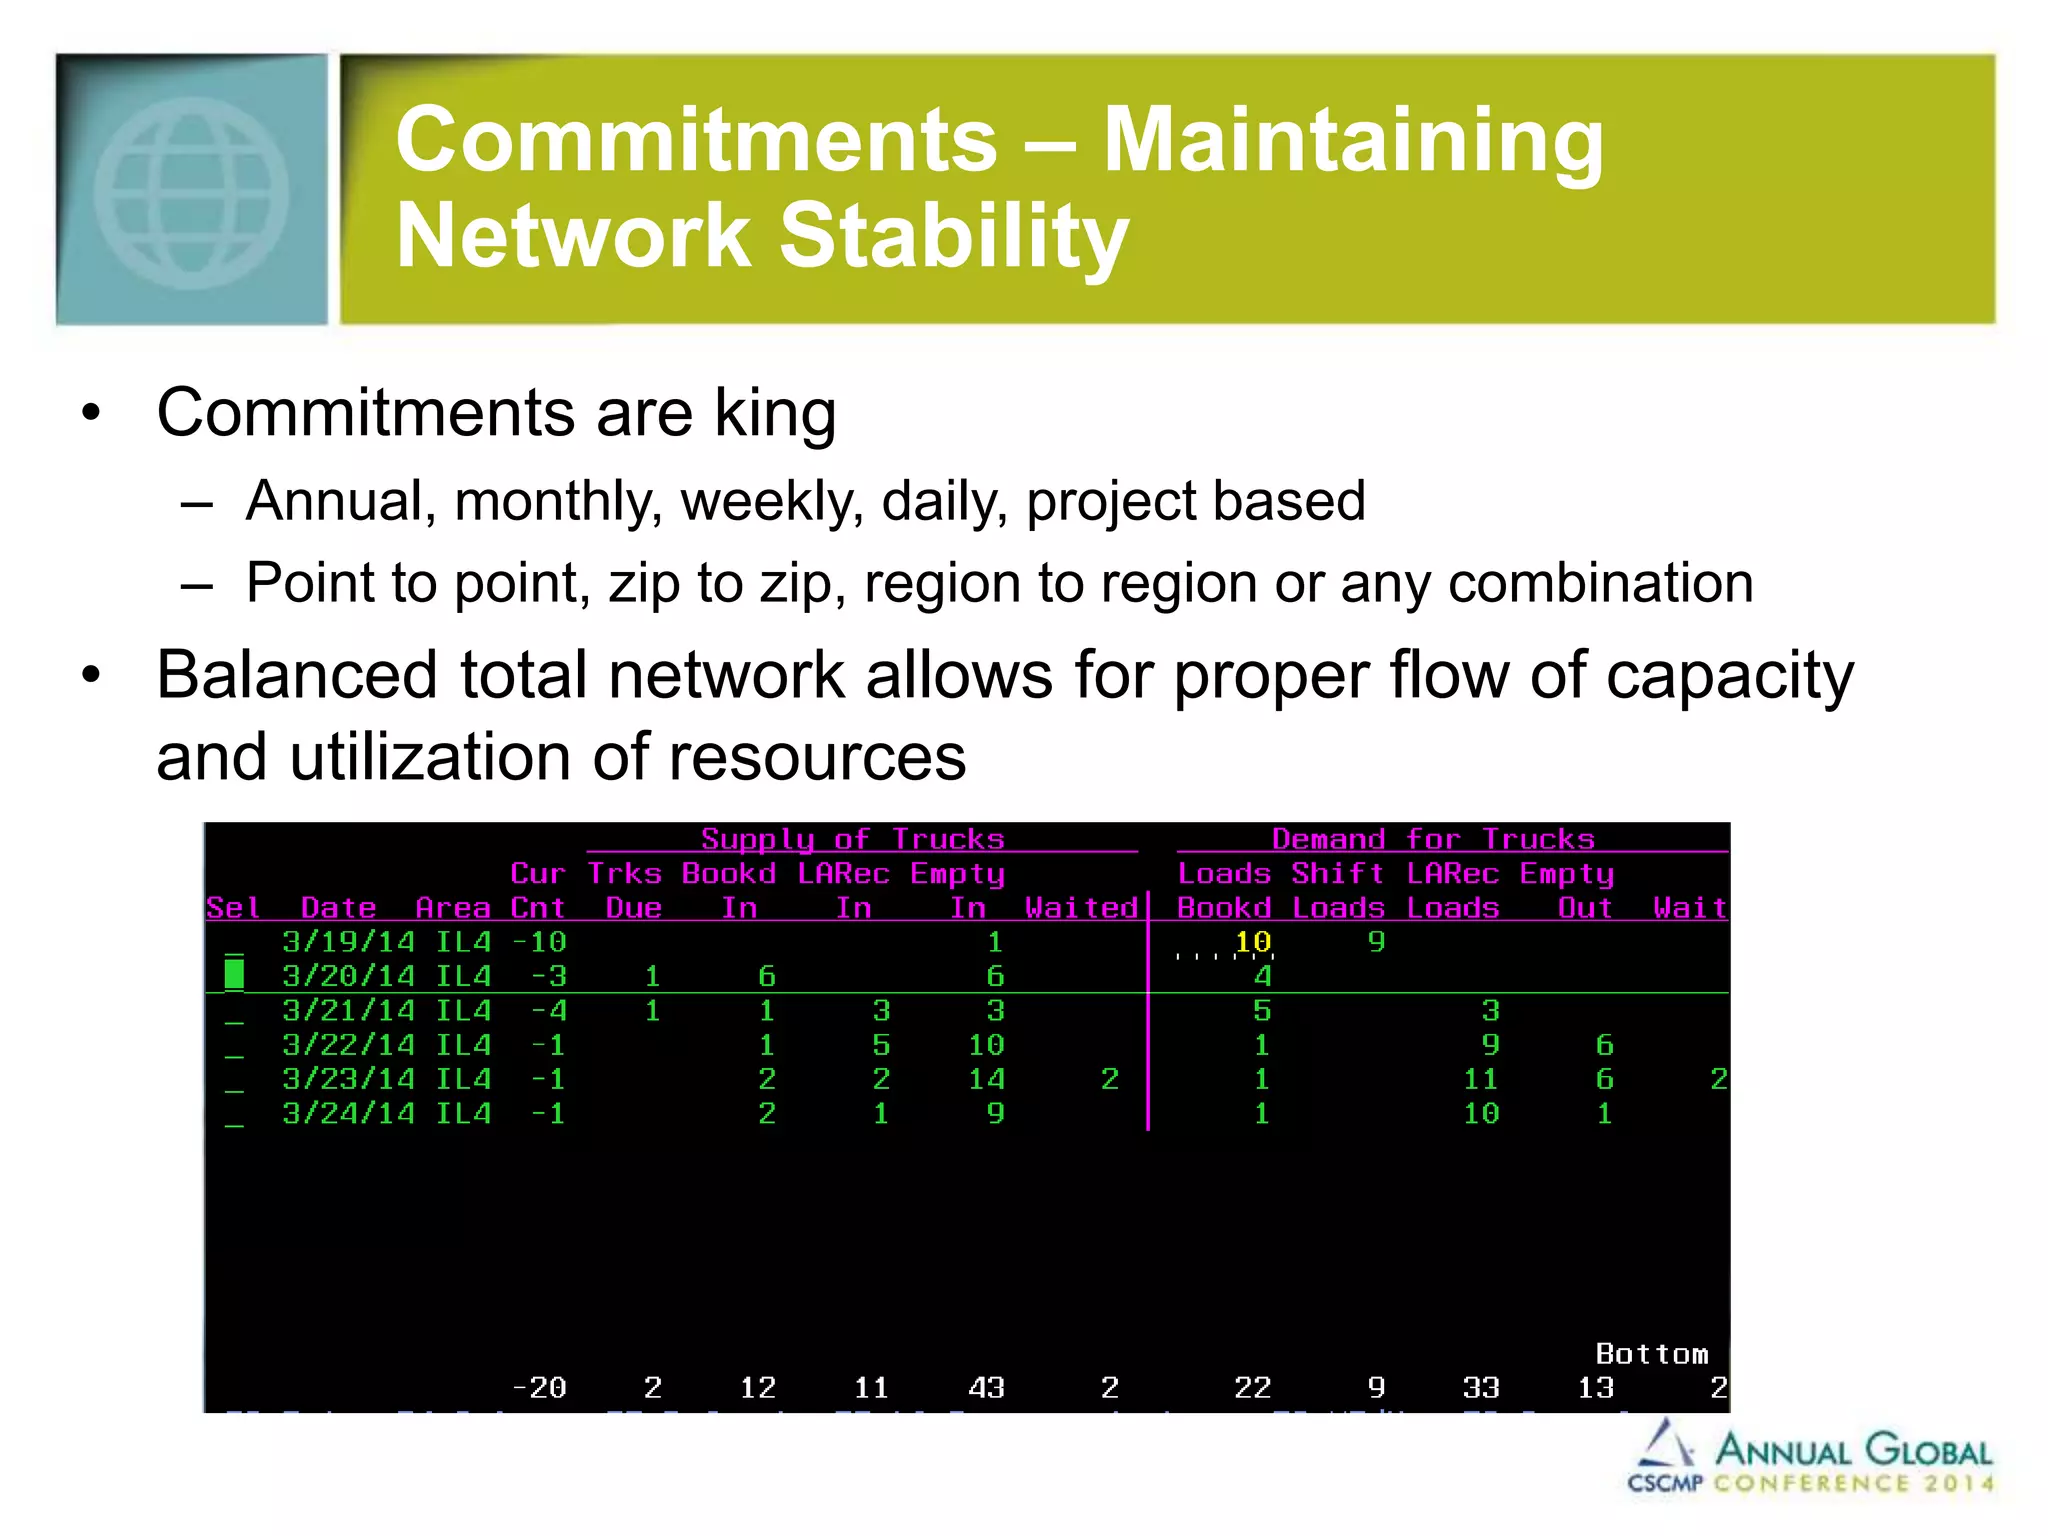
Technology and 
Transportation—Creating, 
Deploying, and Benefiting 
from Innovation 
Matt Douglass 
Director of Planning & Optimization 
Celadon Trucking
Overview 
• Market Analysis – Carrier Perspective 
• Proactive Approach to Profitability 
• Systematic Approach to Cost Effective Planning 
• Commitments – Maintaining Network Stability
Celadon Trucking 
Background Services 
• Established in 1985 
• Public: NYSE (CGI) 
• HQ = Indianapolis, IN 
• Approx. $800M Revenue 
• Equipment: 
– 3,800 tractors 
– 9,200 trailers 
– 300 temp-control trailers 
• OTR (600+ mile LOH) 
• Specialized Services: 
• Expedited 
• Local 
• Dedicated 
• Intermodal 
• Brokerage Division 
• Temperature Control 
• Mexico/Canada
Market Analysis – Carrier 
Perspective
Customer Questionnaire 
0% 50% 100% 
Have you noticed a shortage within 
the last 6 months? 
Do you think there is value in a 
Core Carrier program? 
Do you discuss the relationship 
with your shipping partners? 
Yes 
No
Current State of the Industry 
• Average Driver Age = 55 
• Estimated Driver Shortage in 
2014 = 125,000-250,000 
• Driver Shortage by 2020 = 
330,000 
• Stagnant Fleet Growth 
• Increased Equipment Costs 
• ~ 3-7% Decrease in Utilization
Proactive Approach to 
Profitability
Proactive Approach to Profitability 
• Traditional Methods – Rate and Volume 
• Non-traditional Methods – Multiple Solutions 
– Rail and brokerage 
• Data Driven Methods – Profit Analyzer 
– Identifying lanes that are profitable not only for the current move but 
where will you go in the future
Proactive Approach to Profitability 
• Historical Analysis – Profit Analyzer 
– Identifying lane level Operating ratio 
– Identifying lane level Opportunity cost
Celadon’s Customer Scorecard 
Metrics 
1. Profitability 
2. Fuel Surcharge 
3. Accounts Receivable 
4. EDI Capability 
5. Transit 
6. Empty Miles 
7. Drop & Hook 
8. 24/7 Access 
Uses 
• Feeds Freight Selection Tool 
• Drives Pricing Decisions 
• Identifies Growth/Partner 
Accounts
Systematic Approach to 
Cost Effective Planning
Systematic Approach to Cost 
Effective Planning 
• Weighted calculation to cover all freight in the network 
every couple of minutes 
– Over 150 tables are hit with every potential combination 
• Balancing operational costs, driver happiness and service 
• Ability to Autoplan trucks on loads based on “Home Run” 
Scenario – Currently around 10% of dispatches 
• Model accounts for 70% of all plans
Systematic Approach to Cost 
Effective Planning 
• Universal program for customer service, driver 
management, planning and tracking 
– Allows for a collaborative effort to service the customer and the 
driver
Commitments – 
Maintaining Network 
Stability
Commitments – Maintaining 
Network Stability 
• Commitments are king 
– Annual, monthly, weekly, daily, project based 
– Point to point, zip to zip, region to region or any combination 
• Balanced total network allows for proper flow of capacity 
and utilization of resources
Commitments – Maintaining 
Network Stability 
• Network Balance 
– Clear view of what is being recommended to balance each individual 
region as they interact with each other 
– The map constantly updates with new data (~1-2 minute cycle times) 
– LA takes into 
consideration the 
most profitable 
decisions that can be 
made with 
commitments and 
historical volume
Commitments – Maintaining 
Network Stability 
• Load Solicitation • Chosen based on need – 
What will balance the 
network while generating 
the most profit? 
• Need also determined by: 
– Existing Commitments 
– Profitability 
– Tractor capacity 
– Weekly historical volumes 
– Regional values
Commitments – Maintaining 
Network Stability 
• Capacity shifts 
– Excess tractor capacity in a region that is near an overbooked 
market will lead to shift recommendations 
– Pre-emptive recommendations to communicate network balance 
needs 
– Assists with planning when determining what to do with additional 
capacity or when trying to plan for a region that will be overbooked 
the next day
Matt Douglass 
Director of Planning & Optimization 
Celadon Trucking 
MDouglass@celadontrucking.com 
9503 E 33rd Street 
Indianapolis, IN 46235 
317.972.7000 x22047
Don’t Forget to Complete the 
Evaluation! 
Download the conference app and rate this session. 
Start by choosing: “Cornerstones and Tracks” on the main 
menu and follow the prompts to this session’s landing page.

Cscmp 2014 technology and transportation—creating, deploying, and benefiting from innovation - c eladon

  • 1.
    Technology and Transportation—Creating, Deploying, and Benefiting from Innovation Matt Douglass Director of Planning & Optimization Celadon Trucking
  • 2.
    Overview • MarketAnalysis – Carrier Perspective • Proactive Approach to Profitability • Systematic Approach to Cost Effective Planning • Commitments – Maintaining Network Stability
  • 3.
    Celadon Trucking BackgroundServices • Established in 1985 • Public: NYSE (CGI) • HQ = Indianapolis, IN • Approx. $800M Revenue • Equipment: – 3,800 tractors – 9,200 trailers – 300 temp-control trailers • OTR (600+ mile LOH) • Specialized Services: • Expedited • Local • Dedicated • Intermodal • Brokerage Division • Temperature Control • Mexico/Canada
  • 4.
    Market Analysis –Carrier Perspective
  • 5.
    Customer Questionnaire 0%50% 100% Have you noticed a shortage within the last 6 months? Do you think there is value in a Core Carrier program? Do you discuss the relationship with your shipping partners? Yes No
  • 6.
    Current State ofthe Industry • Average Driver Age = 55 • Estimated Driver Shortage in 2014 = 125,000-250,000 • Driver Shortage by 2020 = 330,000 • Stagnant Fleet Growth • Increased Equipment Costs • ~ 3-7% Decrease in Utilization
  • 7.
    Proactive Approach to Profitability
  • 8.
    Proactive Approach toProfitability • Traditional Methods – Rate and Volume • Non-traditional Methods – Multiple Solutions – Rail and brokerage • Data Driven Methods – Profit Analyzer – Identifying lanes that are profitable not only for the current move but where will you go in the future
  • 9.
    Proactive Approach toProfitability • Historical Analysis – Profit Analyzer – Identifying lane level Operating ratio – Identifying lane level Opportunity cost
  • 10.
    Celadon’s Customer Scorecard Metrics 1. Profitability 2. Fuel Surcharge 3. Accounts Receivable 4. EDI Capability 5. Transit 6. Empty Miles 7. Drop & Hook 8. 24/7 Access Uses • Feeds Freight Selection Tool • Drives Pricing Decisions • Identifies Growth/Partner Accounts
  • 11.
    Systematic Approach to Cost Effective Planning
  • 12.
    Systematic Approach toCost Effective Planning • Weighted calculation to cover all freight in the network every couple of minutes – Over 150 tables are hit with every potential combination • Balancing operational costs, driver happiness and service • Ability to Autoplan trucks on loads based on “Home Run” Scenario – Currently around 10% of dispatches • Model accounts for 70% of all plans
  • 13.
    Systematic Approach toCost Effective Planning • Universal program for customer service, driver management, planning and tracking – Allows for a collaborative effort to service the customer and the driver
  • 14.
    Commitments – MaintainingNetwork Stability
  • 15.
    Commitments – Maintaining Network Stability • Commitments are king – Annual, monthly, weekly, daily, project based – Point to point, zip to zip, region to region or any combination • Balanced total network allows for proper flow of capacity and utilization of resources
  • 16.
    Commitments – Maintaining Network Stability • Network Balance – Clear view of what is being recommended to balance each individual region as they interact with each other – The map constantly updates with new data (~1-2 minute cycle times) – LA takes into consideration the most profitable decisions that can be made with commitments and historical volume
  • 17.
    Commitments – Maintaining Network Stability • Load Solicitation • Chosen based on need – What will balance the network while generating the most profit? • Need also determined by: – Existing Commitments – Profitability – Tractor capacity – Weekly historical volumes – Regional values
  • 18.
    Commitments – Maintaining Network Stability • Capacity shifts – Excess tractor capacity in a region that is near an overbooked market will lead to shift recommendations – Pre-emptive recommendations to communicate network balance needs – Assists with planning when determining what to do with additional capacity or when trying to plan for a region that will be overbooked the next day
  • 19.
    Matt Douglass Directorof Planning & Optimization Celadon Trucking MDouglass@celadontrucking.com 9503 E 33rd Street Indianapolis, IN 46235 317.972.7000 x22047
  • 20.
    Don’t Forget toComplete the Evaluation! Download the conference app and rate this session. Start by choosing: “Cornerstones and Tracks” on the main menu and follow the prompts to this session’s landing page.