SlideShare a Scribd company logo
RESEARCH POSTER PRESENTATION DESIGN © 2015
www.PosterPresentations.com
Quality by design (QbD) is strategically crucial to implement early in formulation development to
achieve superior product performance (1). To maintain aggressive timelines one factor at a time
(OFAT) has been superseded by multivariate Design of Experiments (DoE) (2). DoE is a
powerful tool that identifies first and second order interactions within the design space. Although
DoE reduces experimentation required as compared to OFAT analytical analysis becomes the rate
limiting step. Technological advancements must be co-employed with DoE to reduce total
development time. This study demonstrates the coupling of 2 multivariate DoEs with live in-situ
dissolution monitoring by fiber optic (FO) probes resulting in reduced development time. Herein
an oral suspension containing a poorly water soluble API (BCS Class IV) underwent reverse
engineering to match the RLD dissolution profile. Pre and post formulation multivariate DoE
analysis was used to match the dissolution profile of the reference listed drug (RLD) per USP
parameters.
Abstract
Dissolution media: 10% 0.1M Sodium Methoxide/H2O 900mL.
Dissolution: Vankel Dissolution Bath (VK700)- Dissolution bath with apparatus 2, vessel
temperature 37°C, RPM 50 , run time 2 hrs.
PION Rainbow®: In situ fiber optic probes with dedicated PDA (200-720 nm) for each channel
with 2 mm stainless steel probes, sampled every 5 min for 2 hrs. Representative set up is shown in
Figure 1.
Microfluidizer LM10: Pre-processing DoE formulations were individually micro-fluidized
suspensions and diluted in stock vehicle. Post-processing DoE formulations were prepared by
microfluidizing a stock suspension and aliquoted to individually prepared vehicles.
Minitab®: Statistical processing software.
Reagents: Poloxamer 188 BASF (Greenville OH), simethicone emulsion (Dow Corning Midland
MI), xanthan gum (Vanderbilt Minerals Norwalk CT).
Simulated Intestinal Fluid (SIF): Sodium Taurocholate (Spectrum Chemical New Brunswick NJ) ,
Lecithin (TCI Cambridge MA), NaOH (Amresco Solon OH), Sodium Phosphate Monobasic (J.T.
Baker Phillipsburg, NJ), Sodium Chloride (Spectrum Chemical New Brunswick NJ), DI H2O.
Simulated gastric fluid (SGF): Sodium Laurel Sulfate (Spectrum Chemical New Brunswick NJ),
Sodium Chloride (Spectrum Chemical New Brunswick NJ), 12M HCl (J.T. Baker Phillipsburg,
NJ), DI H2O.
Methods
Results Continued
Conclusions
Statistical analysis for the 2 DoE experiments, provided main effects of CQAs which directly
affected the dissolution profile. Through regression analysis an equation was obtained and a
second prototype (16002) was prepared which showed a good match to the RLD dissolution
profile, Figure 7. An additional batch (16003) was manufactured and confirms RLD match in
SGF and SIF, Figure 7 a&b. The Pion Rainbow fiber optic dissolution monitoring system showed
parity with USP testing by HPLC, Figure 6. The use of PION allowed the collection of more data
than possible by HPLC while eliminated costly solvent usage and analyst time. The entire
project was completed in 72 hours with Pion in-situ fiber optic probes. This would not be
possible with traditional HPLC methods.
References
1.Yu, L.X. et al. AAPS 2014, 16, (4), 771-783.
2.Weissman S.A., Anderson, N.G. Org Process Res. Dev. 2015, 19, (11), 1605-1633.
1CoreRx , Clearwater, Florida, 33710, United States of America;
Travis.Webb@corerxpharma.com
T.Webb1, M. Favero1, J. Maxwell1, B. Hilker1, and J. Cacace1
Multivariate DoE & Live in-situ Dissolution Monitoring: Strategy for Reverse Engineering Success.
0
10
20
30
40
50
60
70
80
90
100
110
0 15 30 45 60 75 90 105 120
%D
Time (min)
DISSOLUTION PROFILE
RLD
16001 (Pre-DOE)
30.0
40.0
50.0
60.0
70.0
80.0
90.0
100.0
110.0
0 20 40 60 80 100 120 140 160 180 200
%D
Time (minutes)
DISSOLUTION PROFILE HPLC VERIFICATION
RLD Pion
16002 Pion
16002 HPLC
HPLC Samples (N)/sample Run Time Hours
ASSAY 20 1 7 2.33
DISSO 20 6 30 60
Results
Initial prototype: Using common reference sources such as: FDA Inactive Ingredient Guideline
(IIG) Database, patent information, and drug label insert an initial generic prototype was
manufactured. The prototype (16001) dissolution profile was compared to the reference listed
drug (RLD), Figure 2. 16001 showed slower release compared to RLD.
Figure 2. Initial generic prototype 16001 (pre-DOE) vs. RLD
DOE & Critical Quality Attributes (CQA): A review of formulation parameters and materials
identified xanthan gum and poloxamer as CQAs for “pre-processing”. While xanthan gum,
poloxamer , and simethicone are CQAs for “post-processing”. Employed Minitab® 2 full
factorial with center point and main effects consistency index (CI) plot pre-processing are shown
in Figures 3 a&b respectively.
PION
Rainbow FO
Probe
Figure 1. Pion FO probe in dissolution bath
DOE full factorial run results: Figure 5 pre-processing DOE results shows the plotted rheology
results of 2 full factorial and center point formulations compared to the RLD. Figure 6 post-
processing DOE results provides the in-situ Pion FO dissolution results for 3 full factorial and
center point formulations compared to the RLD.
Figure 5. Pre-processing 2 full factorial with center point results
Figure 6. Post-processing 3 full factorial with center point results
Minitab DOE Finalization: Results obtained for the 2 DOE factorials, shown above, were
processed in Minitab® and the design space was mapped. From the Minitab® design space
analysis a new formulation was identified and manufactured (16002 “After DOE”). The
dissolution profile was obtained and compared to the RLD and 16001 “Before DOE” formulations
using Pion Rainbow, Figure 7.
Figure 7. Dissolution profile comparisons , before DOE, after DOE, and RLD.
Results Continued
USP Compendial Testing Verification: Pion Rainbow FO dissolution data was then compared to
USP dissolution testing via HPLC. Figure 8 shows the comparison of Pion Rainbow in-situ FO
probe and USP dissolution testing by HPLC.
Figure 8. HPLC backend comparison to Pion Rainbow dissolution profile.
Formulation robustness: To ensure the formulation obtained was indeed similar to the RLD an
addition batch was manufactured per Minitab DOE results (16003). Dissolution profiles of 16003
and the RLD were compared using SGF and SIF media. Figures 9 a&b show RLD versus 16003
in SIF and SGF respectively.
0
10
20
30
40
50
60
0 25 50 75 100 125 150 175 200
%D
Time (min)
DISSOLUTION SGF
16003
RLD
0
10
20
30
40
50
60
70
80
90
0 25 50 75 100 125 150 175 200
%D
Time (min)
DISSOLUTION SIF
16003
RLD
Figure 9. (a) Simulated gastric fluid (b) simulated intestinal fluid dissolution profile comparisons with PION Rainbow.
(7a)
(7b)
Time Savings: Utilizing novel technology, the PION rainbow eliminated the need for costly and
time consuming HPLC backend work. Table 1 shows estimated runs times for the USP HPLC
methods. The initial work saved over 60+ hours of physical HPLC pumping time.
Table 1. USP HPLC run time saved by using PION Rainbow which removes HPLC back end.
Presenter: Sr. Formulator
Travis.Webb@corerxpharma.com
727-259-6950
0
50
100
150
200
250
300
100 200 300 400 500
SHEARRATE(1/S)
VISCOSITY (CP)
PRE-PROCESSING RHEOLOGY
Formulation 1
Formulation 2
Formulation 3
Formulation 4
Formulation 5
RLD
0
20
40
60
80
100
5 15 25 35 45 55 65 75 85 95 105 115
%D
TIME (MIN)
POST-PROCESSING DISSOLUTON PROFILE
Form 1
Form 2
Form 5
Form 6
Form 7
Form 8
Form 9
RLD
(POST PROCESSING )Final Formulation Composition
StdOrder RunOrder CenterPt Blocks Xanthan Gum Poloxamer Simethicone
2 1 1 1 1.30 1.0 0.00
5 2 1 1 0.80 1.0 0.50
8 3 1 1 1.30 2.0 0.50
3 4 1 1 0.80 2.0 0.00
7 5 1 1 0.80 2.0 0.50
1 6 1 1 0.80 1.0 0.00
4 7 1 1 1.30 2.0 0.00
9 8 0 1 1.05 1.5 0.25
6 9 1 1 1.30 1.0 0.50
Responses Acceptable Range
% dissolution at 30 minutes Maximize
% dissolution at 60 minutes Match RLD
Viscosity at 0 Shear Define Design Space
1.301.050.80
70
65
60
55
50
45
40
2.01.51.0 0.500.250.00
Xanthan Gum
Meanof30minDisso
Poloxamer Simethicone
Corner
Center
Point Type
Main Effects Plot for 30 min Disso
Fitted Means
(Pre-Processing) Pre Microfluidization Composition
StdOrder RunOrder CenterPt Blocks Xanthan gum Poloxamer
4 1 1 1 0.00 0.2
2 2 1 1 0.00 1.0
1 3 1 1 0.04 0.2
3 4 1 1 0.04 1.0
5 5 0 1 0.02 0.6
Responses Acceptable Range
% dissolution at 30 minutes Maximize
% dissolution at 60 minutes Match RLD
Viscosity at 0 Shear Define Design Space 0.040.020.00
8000
7500
7000
6500
6000
1.00.60.2
Xanthan gum
MeanofCI
Poloxamer
Corner
Center
Point Type
Main Effects Plot for CI
Fitted Means
Minitab Post-processing 3 full factorial with center point and post-processing main effects
plots from 30 and 60 minute dissolution are shown in Figures 4 a, b, and c respectively.
Figure 3a. Pre-processing full factorial with center point Figure 3b. Main effects plot pre-processing.
1.301.050.80
95
90
85
80
75
70
65
60
2.01.51.0 0.500.250.00
Xanthan Gum
Meanof60mindisso
Poloxamer Simethicone
Corner
Center
Point Type
Main Effects Plot for 60 min disso
Fitted Means
Figure 4b. Main effects dissolution 30 min.
Figure 4a. Pre-processing full factorial with center point
Figure 4c. Main effects dissolution 60 min.
20
30
40
50
60
70
80
90
100
110
0 50 100 150
%D
Time (Min)
DISSOLUTION PROFILE
RLD
After DOE (16002)
Before DOE (16001)

More Related Content

What's hot

Synthesis and Characterization of Various Acid Doped Polyaniline Nanofibers
Synthesis and Characterization of Various Acid Doped Polyaniline NanofibersSynthesis and Characterization of Various Acid Doped Polyaniline Nanofibers
Synthesis and Characterization of Various Acid Doped Polyaniline Nanofibers
IRJET Journal
 
HPLC and GC
HPLC and GCHPLC and GC
HPLC and GC
Swayambhu Ghose
 
Cell Culture Techniques and Best Practices
Cell Culture Techniques and Best PracticesCell Culture Techniques and Best Practices
Cell Culture Techniques and Best Practices
Thermo Fisher Scientific
 
India; Studies on Estimation Of Fluoride and Defluoridation of Drinking Water
India;  Studies on Estimation Of Fluoride and Defluoridation of Drinking WaterIndia;  Studies on Estimation Of Fluoride and Defluoridation of Drinking Water
India; Studies on Estimation Of Fluoride and Defluoridation of Drinking Water
D5Z
 
BioInnovation Leader Summit Transforming Process Efficiency
 BioInnovation Leader Summit Transforming Process Efficiency BioInnovation Leader Summit Transforming Process Efficiency
BioInnovation Leader Summit Transforming Process Efficiency
GBX Summits
 
Analytical method development and validation for the estimation of quinapril ...
Analytical method development and validation for the estimation of quinapril ...Analytical method development and validation for the estimation of quinapril ...
Analytical method development and validation for the estimation of quinapril ...
SriramNagarajan19
 
Out of the Shadows: Identifying Impurities in Cannabis Products
Out of the Shadows: Identifying Impurities in Cannabis ProductsOut of the Shadows: Identifying Impurities in Cannabis Products
Out of the Shadows: Identifying Impurities in Cannabis Products
Markus Roggen
 
Deep Purple: Discolouration in CBD products
Deep Purple: Discolouration in CBD productsDeep Purple: Discolouration in CBD products
Deep Purple: Discolouration in CBD products
Markus Roggen
 
Diazo coupling for the determination of selexipag by visible spectrophotometry
Diazo coupling for the determination of selexipag by visible spectrophotometryDiazo coupling for the determination of selexipag by visible spectrophotometry
Diazo coupling for the determination of selexipag by visible spectrophotometry
Ratnakaram Venkata Nadh
 
Artigo materials research
Artigo materials researchArtigo materials research
Artigo materials research
Amanda Alves
 
Sathityatiwat ChIR thesis defense
Sathityatiwat ChIR thesis defense Sathityatiwat ChIR thesis defense
Sathityatiwat ChIR thesis defense
Suthapat Sathityatiwat
 
Iptc 14285 Presentation
Iptc 14285  PresentationIptc 14285  Presentation
Iptc 14285 Presentation
jdowns
 
Modification & Application of Borate Zirconia Catalyst
Modification & Application of Borate Zirconia CatalystModification & Application of Borate Zirconia Catalyst
Modification & Application of Borate Zirconia Catalyst
Ranjeet Kumar
 
Slideshare Royce Epoxy Accelerators 2010 TRFA
Slideshare Royce Epoxy Accelerators 2010 TRFASlideshare Royce Epoxy Accelerators 2010 TRFA
Slideshare Royce Epoxy Accelerators 2010 TRFARoyceIntl
 
Process-Properties and Correlation in Hydroxyapatite Bioceramics
Process-Properties and Correlation in Hydroxyapatite BioceramicsProcess-Properties and Correlation in Hydroxyapatite Bioceramics
Process-Properties and Correlation in Hydroxyapatite Bioceramics
IJERA Editor
 
Japan, National Agriculture and Food Research Organization (NARO)
Japan, National Agriculture and Food Research Organization (NARO)Japan, National Agriculture and Food Research Organization (NARO)
Japan, National Agriculture and Food Research Organization (NARO)
ExternalEvents
 

What's hot (19)

Synthesis and Characterization of Various Acid Doped Polyaniline Nanofibers
Synthesis and Characterization of Various Acid Doped Polyaniline NanofibersSynthesis and Characterization of Various Acid Doped Polyaniline Nanofibers
Synthesis and Characterization of Various Acid Doped Polyaniline Nanofibers
 
HPLC and GC
HPLC and GCHPLC and GC
HPLC and GC
 
Global Comparator Standards
Global Comparator StandardsGlobal Comparator Standards
Global Comparator Standards
 
Cell Culture Techniques and Best Practices
Cell Culture Techniques and Best PracticesCell Culture Techniques and Best Practices
Cell Culture Techniques and Best Practices
 
202493 02
202493 02202493 02
202493 02
 
India; Studies on Estimation Of Fluoride and Defluoridation of Drinking Water
India;  Studies on Estimation Of Fluoride and Defluoridation of Drinking WaterIndia;  Studies on Estimation Of Fluoride and Defluoridation of Drinking Water
India; Studies on Estimation Of Fluoride and Defluoridation of Drinking Water
 
BioInnovation Leader Summit Transforming Process Efficiency
 BioInnovation Leader Summit Transforming Process Efficiency BioInnovation Leader Summit Transforming Process Efficiency
BioInnovation Leader Summit Transforming Process Efficiency
 
Service Analytics A4
Service Analytics A4Service Analytics A4
Service Analytics A4
 
Analytical method development and validation for the estimation of quinapril ...
Analytical method development and validation for the estimation of quinapril ...Analytical method development and validation for the estimation of quinapril ...
Analytical method development and validation for the estimation of quinapril ...
 
Out of the Shadows: Identifying Impurities in Cannabis Products
Out of the Shadows: Identifying Impurities in Cannabis ProductsOut of the Shadows: Identifying Impurities in Cannabis Products
Out of the Shadows: Identifying Impurities in Cannabis Products
 
Deep Purple: Discolouration in CBD products
Deep Purple: Discolouration in CBD productsDeep Purple: Discolouration in CBD products
Deep Purple: Discolouration in CBD products
 
Diazo coupling for the determination of selexipag by visible spectrophotometry
Diazo coupling for the determination of selexipag by visible spectrophotometryDiazo coupling for the determination of selexipag by visible spectrophotometry
Diazo coupling for the determination of selexipag by visible spectrophotometry
 
Artigo materials research
Artigo materials researchArtigo materials research
Artigo materials research
 
Sathityatiwat ChIR thesis defense
Sathityatiwat ChIR thesis defense Sathityatiwat ChIR thesis defense
Sathityatiwat ChIR thesis defense
 
Iptc 14285 Presentation
Iptc 14285  PresentationIptc 14285  Presentation
Iptc 14285 Presentation
 
Modification & Application of Borate Zirconia Catalyst
Modification & Application of Borate Zirconia CatalystModification & Application of Borate Zirconia Catalyst
Modification & Application of Borate Zirconia Catalyst
 
Slideshare Royce Epoxy Accelerators 2010 TRFA
Slideshare Royce Epoxy Accelerators 2010 TRFASlideshare Royce Epoxy Accelerators 2010 TRFA
Slideshare Royce Epoxy Accelerators 2010 TRFA
 
Process-Properties and Correlation in Hydroxyapatite Bioceramics
Process-Properties and Correlation in Hydroxyapatite BioceramicsProcess-Properties and Correlation in Hydroxyapatite Bioceramics
Process-Properties and Correlation in Hydroxyapatite Bioceramics
 
Japan, National Agriculture and Food Research Organization (NARO)
Japan, National Agriculture and Food Research Organization (NARO)Japan, National Agriculture and Food Research Organization (NARO)
Japan, National Agriculture and Food Research Organization (NARO)
 

Similar to CRS_2016_44x44_FINAL_111JUL2016_BH (1) (1)

Diclofenac rabeprazole hplc
Diclofenac rabeprazole hplcDiclofenac rabeprazole hplc
Diclofenac rabeprazole hplcDeepak Gadade
 
Chromatography: Trends and Developments in MAb Screening and Characterization
Chromatography: Trends and Developments in MAb Screening and CharacterizationChromatography: Trends and Developments in MAb Screening and Characterization
Chromatography: Trends and Developments in MAb Screening and Characterization
Chromatography & Mass Spectrometry Solutions
 
Rajaguru ppt
Rajaguru pptRajaguru ppt
Rajaguru ppt
rajaguru555
 
PPT 10.pptx
PPT 10.pptxPPT 10.pptx
PPT 10.pptx
DrVivekChauhan1
 
Epa Epd06084 Final Report
Epa Epd06084 Final ReportEpa Epd06084 Final Report
Epa Epd06084 Final Reportinscore
 
ESTIMATION OF SODIUM IN TAP WATER SAMPLE BY FLAME EMISSION SPECTROPHOTOMETER ...
ESTIMATION OF SODIUM IN TAP WATER SAMPLE BY FLAME EMISSION SPECTROPHOTOMETER ...ESTIMATION OF SODIUM IN TAP WATER SAMPLE BY FLAME EMISSION SPECTROPHOTOMETER ...
ESTIMATION OF SODIUM IN TAP WATER SAMPLE BY FLAME EMISSION SPECTROPHOTOMETER ...
Sadia Rahat
 
OPHTHALMIC NANOSUSPENSION OF PREDNISOLONE ACETATE
OPHTHALMIC NANOSUSPENSION OF PREDNISOLONE ACETATE OPHTHALMIC NANOSUSPENSION OF PREDNISOLONE ACETATE
OPHTHALMIC NANOSUSPENSION OF PREDNISOLONE ACETATE
Yash Nandwani
 
Itz nanosponge
Itz nanospongeItz nanosponge
Itz nanosponge
Mahewash Sana Pathan
 
NYSAS Seminar LC-IR To Characterize Polymeric Excipients In Pharmaceutical F...
NYSAS Seminar  LC-IR To Characterize Polymeric Excipients In Pharmaceutical F...NYSAS Seminar  LC-IR To Characterize Polymeric Excipients In Pharmaceutical F...
NYSAS Seminar LC-IR To Characterize Polymeric Excipients In Pharmaceutical F...
mzhou45
 
Ijetcas14 550
Ijetcas14 550Ijetcas14 550
Ijetcas14 550
Iasir Journals
 
Yan, Miao-Yi _ Conference Proposal
Yan, Miao-Yi _ Conference Proposal Yan, Miao-Yi _ Conference Proposal
Yan, Miao-Yi _ Conference Proposal Mia (Miaoyi) Yan
 
Formulation of Mometasone Furoate Emulgel
Formulation of Mometasone Furoate EmulgelFormulation of Mometasone Furoate Emulgel
Formulation of Mometasone Furoate Emulgel
Aman Dube
 
Biochemical Process as a means to Control and Mitigate Industrial Wastewate...
Biochemical Process as a means  to Control and Mitigate  Industrial Wastewate...Biochemical Process as a means  to Control and Mitigate  Industrial Wastewate...
Biochemical Process as a means to Control and Mitigate Industrial Wastewate...
Mohammad Dain Shah Munna
 
Tosoh BILS 2016
Tosoh BILS 2016Tosoh BILS 2016
Tosoh BILS 2016
GBX Events
 
IOSRPHR(www.iosrphr.org) IOSR Journal of Pharmacy
IOSRPHR(www.iosrphr.org) IOSR Journal of PharmacyIOSRPHR(www.iosrphr.org) IOSR Journal of Pharmacy
IOSRPHR(www.iosrphr.org) IOSR Journal of Pharmacyiosrphr_editor
 
IOSRPHR(www.iosrphr.org) IOSR Journal of Pharmacy
IOSRPHR(www.iosrphr.org) IOSR Journal of PharmacyIOSRPHR(www.iosrphr.org) IOSR Journal of Pharmacy
IOSRPHR(www.iosrphr.org) IOSR Journal of Pharmacyiosrphr_editor
 
PattersonEWRI2014 (1)
PattersonEWRI2014 (1)PattersonEWRI2014 (1)
PattersonEWRI2014 (1)John Maziuk
 
Analysis of Phenolic Antioxidants in Edible Oil/Shortening Using the PerkinEl...
Analysis of Phenolic Antioxidants in Edible Oil/Shortening Using the PerkinEl...Analysis of Phenolic Antioxidants in Edible Oil/Shortening Using the PerkinEl...
Analysis of Phenolic Antioxidants in Edible Oil/Shortening Using the PerkinEl...
PerkinElmer, Inc.
 
Polymeric nanoparticles for encapsulation and controlled release of bioactive...
Polymeric nanoparticles for encapsulation and controlled release of bioactive...Polymeric nanoparticles for encapsulation and controlled release of bioactive...
Polymeric nanoparticles for encapsulation and controlled release of bioactive...
Tomsk Polytechnic University
 

Similar to CRS_2016_44x44_FINAL_111JUL2016_BH (1) (1) (20)

Diclofenac rabeprazole hplc
Diclofenac rabeprazole hplcDiclofenac rabeprazole hplc
Diclofenac rabeprazole hplc
 
Chromatography: Trends and Developments in MAb Screening and Characterization
Chromatography: Trends and Developments in MAb Screening and CharacterizationChromatography: Trends and Developments in MAb Screening and Characterization
Chromatography: Trends and Developments in MAb Screening and Characterization
 
Rajaguru ppt
Rajaguru pptRajaguru ppt
Rajaguru ppt
 
PPT 10.pptx
PPT 10.pptxPPT 10.pptx
PPT 10.pptx
 
Epa Epd06084 Final Report
Epa Epd06084 Final ReportEpa Epd06084 Final Report
Epa Epd06084 Final Report
 
ESTIMATION OF SODIUM IN TAP WATER SAMPLE BY FLAME EMISSION SPECTROPHOTOMETER ...
ESTIMATION OF SODIUM IN TAP WATER SAMPLE BY FLAME EMISSION SPECTROPHOTOMETER ...ESTIMATION OF SODIUM IN TAP WATER SAMPLE BY FLAME EMISSION SPECTROPHOTOMETER ...
ESTIMATION OF SODIUM IN TAP WATER SAMPLE BY FLAME EMISSION SPECTROPHOTOMETER ...
 
OPHTHALMIC NANOSUSPENSION OF PREDNISOLONE ACETATE
OPHTHALMIC NANOSUSPENSION OF PREDNISOLONE ACETATE OPHTHALMIC NANOSUSPENSION OF PREDNISOLONE ACETATE
OPHTHALMIC NANOSUSPENSION OF PREDNISOLONE ACETATE
 
Itz nanosponge
Itz nanospongeItz nanosponge
Itz nanosponge
 
NYSAS Seminar LC-IR To Characterize Polymeric Excipients In Pharmaceutical F...
NYSAS Seminar  LC-IR To Characterize Polymeric Excipients In Pharmaceutical F...NYSAS Seminar  LC-IR To Characterize Polymeric Excipients In Pharmaceutical F...
NYSAS Seminar LC-IR To Characterize Polymeric Excipients In Pharmaceutical F...
 
Ijetcas14 550
Ijetcas14 550Ijetcas14 550
Ijetcas14 550
 
Yan, Miao-Yi _ Conference Proposal
Yan, Miao-Yi _ Conference Proposal Yan, Miao-Yi _ Conference Proposal
Yan, Miao-Yi _ Conference Proposal
 
Formulation of Mometasone Furoate Emulgel
Formulation of Mometasone Furoate EmulgelFormulation of Mometasone Furoate Emulgel
Formulation of Mometasone Furoate Emulgel
 
VS-New
VS-NewVS-New
VS-New
 
Biochemical Process as a means to Control and Mitigate Industrial Wastewate...
Biochemical Process as a means  to Control and Mitigate  Industrial Wastewate...Biochemical Process as a means  to Control and Mitigate  Industrial Wastewate...
Biochemical Process as a means to Control and Mitigate Industrial Wastewate...
 
Tosoh BILS 2016
Tosoh BILS 2016Tosoh BILS 2016
Tosoh BILS 2016
 
IOSRPHR(www.iosrphr.org) IOSR Journal of Pharmacy
IOSRPHR(www.iosrphr.org) IOSR Journal of PharmacyIOSRPHR(www.iosrphr.org) IOSR Journal of Pharmacy
IOSRPHR(www.iosrphr.org) IOSR Journal of Pharmacy
 
IOSRPHR(www.iosrphr.org) IOSR Journal of Pharmacy
IOSRPHR(www.iosrphr.org) IOSR Journal of PharmacyIOSRPHR(www.iosrphr.org) IOSR Journal of Pharmacy
IOSRPHR(www.iosrphr.org) IOSR Journal of Pharmacy
 
PattersonEWRI2014 (1)
PattersonEWRI2014 (1)PattersonEWRI2014 (1)
PattersonEWRI2014 (1)
 
Analysis of Phenolic Antioxidants in Edible Oil/Shortening Using the PerkinEl...
Analysis of Phenolic Antioxidants in Edible Oil/Shortening Using the PerkinEl...Analysis of Phenolic Antioxidants in Edible Oil/Shortening Using the PerkinEl...
Analysis of Phenolic Antioxidants in Edible Oil/Shortening Using the PerkinEl...
 
Polymeric nanoparticles for encapsulation and controlled release of bioactive...
Polymeric nanoparticles for encapsulation and controlled release of bioactive...Polymeric nanoparticles for encapsulation and controlled release of bioactive...
Polymeric nanoparticles for encapsulation and controlled release of bioactive...
 

CRS_2016_44x44_FINAL_111JUL2016_BH (1) (1)

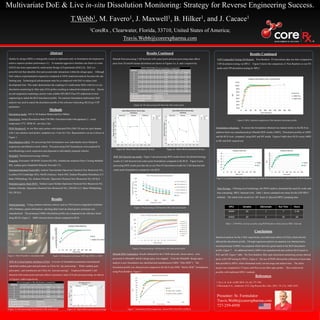
  • 1. RESEARCH POSTER PRESENTATION DESIGN © 2015 www.PosterPresentations.com Quality by design (QbD) is strategically crucial to implement early in formulation development to achieve superior product performance (1). To maintain aggressive timelines one factor at a time (OFAT) has been superseded by multivariate Design of Experiments (DoE) (2). DoE is a powerful tool that identifies first and second order interactions within the design space. Although DoE reduces experimentation required as compared to OFAT analytical analysis becomes the rate limiting step. Technological advancements must be co-employed with DoE to reduce total development time. This study demonstrates the coupling of 2 multivariate DoEs with live in-situ dissolution monitoring by fiber optic (FO) probes resulting in reduced development time. Herein an oral suspension containing a poorly water soluble API (BCS Class IV) underwent reverse engineering to match the RLD dissolution profile. Pre and post formulation multivariate DoE analysis was used to match the dissolution profile of the reference listed drug (RLD) per USP parameters. Abstract Dissolution media: 10% 0.1M Sodium Methoxide/H2O 900mL. Dissolution: Vankel Dissolution Bath (VK700)- Dissolution bath with apparatus 2, vessel temperature 37°C, RPM 50 , run time 2 hrs. PION Rainbow®: In situ fiber optic probes with dedicated PDA (200-720 nm) for each channel with 2 mm stainless steel probes, sampled every 5 min for 2 hrs. Representative set up is shown in Figure 1. Microfluidizer LM10: Pre-processing DoE formulations were individually micro-fluidized suspensions and diluted in stock vehicle. Post-processing DoE formulations were prepared by microfluidizing a stock suspension and aliquoted to individually prepared vehicles. Minitab®: Statistical processing software. Reagents: Poloxamer 188 BASF (Greenville OH), simethicone emulsion (Dow Corning Midland MI), xanthan gum (Vanderbilt Minerals Norwalk CT). Simulated Intestinal Fluid (SIF): Sodium Taurocholate (Spectrum Chemical New Brunswick NJ) , Lecithin (TCI Cambridge MA), NaOH (Amresco Solon OH), Sodium Phosphate Monobasic (J.T. Baker Phillipsburg, NJ), Sodium Chloride (Spectrum Chemical New Brunswick NJ), DI H2O. Simulated gastric fluid (SGF): Sodium Laurel Sulfate (Spectrum Chemical New Brunswick NJ), Sodium Chloride (Spectrum Chemical New Brunswick NJ), 12M HCl (J.T. Baker Phillipsburg, NJ), DI H2O. Methods Results Continued Conclusions Statistical analysis for the 2 DoE experiments, provided main effects of CQAs which directly affected the dissolution profile. Through regression analysis an equation was obtained and a second prototype (16002) was prepared which showed a good match to the RLD dissolution profile, Figure 7. An additional batch (16003) was manufactured and confirms RLD match in SGF and SIF, Figure 7 a&b. The Pion Rainbow fiber optic dissolution monitoring system showed parity with USP testing by HPLC, Figure 6. The use of PION allowed the collection of more data than possible by HPLC while eliminated costly solvent usage and analyst time. The entire project was completed in 72 hours with Pion in-situ fiber optic probes. This would not be possible with traditional HPLC methods. References 1.Yu, L.X. et al. AAPS 2014, 16, (4), 771-783. 2.Weissman S.A., Anderson, N.G. Org Process Res. Dev. 2015, 19, (11), 1605-1633. 1CoreRx , Clearwater, Florida, 33710, United States of America; Travis.Webb@corerxpharma.com T.Webb1, M. Favero1, J. Maxwell1, B. Hilker1, and J. Cacace1 Multivariate DoE & Live in-situ Dissolution Monitoring: Strategy for Reverse Engineering Success. 0 10 20 30 40 50 60 70 80 90 100 110 0 15 30 45 60 75 90 105 120 %D Time (min) DISSOLUTION PROFILE RLD 16001 (Pre-DOE) 30.0 40.0 50.0 60.0 70.0 80.0 90.0 100.0 110.0 0 20 40 60 80 100 120 140 160 180 200 %D Time (minutes) DISSOLUTION PROFILE HPLC VERIFICATION RLD Pion 16002 Pion 16002 HPLC HPLC Samples (N)/sample Run Time Hours ASSAY 20 1 7 2.33 DISSO 20 6 30 60 Results Initial prototype: Using common reference sources such as: FDA Inactive Ingredient Guideline (IIG) Database, patent information, and drug label insert an initial generic prototype was manufactured. The prototype (16001) dissolution profile was compared to the reference listed drug (RLD), Figure 2. 16001 showed slower release compared to RLD. Figure 2. Initial generic prototype 16001 (pre-DOE) vs. RLD DOE & Critical Quality Attributes (CQA): A review of formulation parameters and materials identified xanthan gum and poloxamer as CQAs for “pre-processing”. While xanthan gum, poloxamer , and simethicone are CQAs for “post-processing”. Employed Minitab® 2 full factorial with center point and main effects consistency index (CI) plot pre-processing are shown in Figures 3 a&b respectively. PION Rainbow FO Probe Figure 1. Pion FO probe in dissolution bath DOE full factorial run results: Figure 5 pre-processing DOE results shows the plotted rheology results of 2 full factorial and center point formulations compared to the RLD. Figure 6 post- processing DOE results provides the in-situ Pion FO dissolution results for 3 full factorial and center point formulations compared to the RLD. Figure 5. Pre-processing 2 full factorial with center point results Figure 6. Post-processing 3 full factorial with center point results Minitab DOE Finalization: Results obtained for the 2 DOE factorials, shown above, were processed in Minitab® and the design space was mapped. From the Minitab® design space analysis a new formulation was identified and manufactured (16002 “After DOE”). The dissolution profile was obtained and compared to the RLD and 16001 “Before DOE” formulations using Pion Rainbow, Figure 7. Figure 7. Dissolution profile comparisons , before DOE, after DOE, and RLD. Results Continued USP Compendial Testing Verification: Pion Rainbow FO dissolution data was then compared to USP dissolution testing via HPLC. Figure 8 shows the comparison of Pion Rainbow in-situ FO probe and USP dissolution testing by HPLC. Figure 8. HPLC backend comparison to Pion Rainbow dissolution profile. Formulation robustness: To ensure the formulation obtained was indeed similar to the RLD an addition batch was manufactured per Minitab DOE results (16003). Dissolution profiles of 16003 and the RLD were compared using SGF and SIF media. Figures 9 a&b show RLD versus 16003 in SIF and SGF respectively. 0 10 20 30 40 50 60 0 25 50 75 100 125 150 175 200 %D Time (min) DISSOLUTION SGF 16003 RLD 0 10 20 30 40 50 60 70 80 90 0 25 50 75 100 125 150 175 200 %D Time (min) DISSOLUTION SIF 16003 RLD Figure 9. (a) Simulated gastric fluid (b) simulated intestinal fluid dissolution profile comparisons with PION Rainbow. (7a) (7b) Time Savings: Utilizing novel technology, the PION rainbow eliminated the need for costly and time consuming HPLC backend work. Table 1 shows estimated runs times for the USP HPLC methods. The initial work saved over 60+ hours of physical HPLC pumping time. Table 1. USP HPLC run time saved by using PION Rainbow which removes HPLC back end. Presenter: Sr. Formulator Travis.Webb@corerxpharma.com 727-259-6950 0 50 100 150 200 250 300 100 200 300 400 500 SHEARRATE(1/S) VISCOSITY (CP) PRE-PROCESSING RHEOLOGY Formulation 1 Formulation 2 Formulation 3 Formulation 4 Formulation 5 RLD 0 20 40 60 80 100 5 15 25 35 45 55 65 75 85 95 105 115 %D TIME (MIN) POST-PROCESSING DISSOLUTON PROFILE Form 1 Form 2 Form 5 Form 6 Form 7 Form 8 Form 9 RLD (POST PROCESSING )Final Formulation Composition StdOrder RunOrder CenterPt Blocks Xanthan Gum Poloxamer Simethicone 2 1 1 1 1.30 1.0 0.00 5 2 1 1 0.80 1.0 0.50 8 3 1 1 1.30 2.0 0.50 3 4 1 1 0.80 2.0 0.00 7 5 1 1 0.80 2.0 0.50 1 6 1 1 0.80 1.0 0.00 4 7 1 1 1.30 2.0 0.00 9 8 0 1 1.05 1.5 0.25 6 9 1 1 1.30 1.0 0.50 Responses Acceptable Range % dissolution at 30 minutes Maximize % dissolution at 60 minutes Match RLD Viscosity at 0 Shear Define Design Space 1.301.050.80 70 65 60 55 50 45 40 2.01.51.0 0.500.250.00 Xanthan Gum Meanof30minDisso Poloxamer Simethicone Corner Center Point Type Main Effects Plot for 30 min Disso Fitted Means (Pre-Processing) Pre Microfluidization Composition StdOrder RunOrder CenterPt Blocks Xanthan gum Poloxamer 4 1 1 1 0.00 0.2 2 2 1 1 0.00 1.0 1 3 1 1 0.04 0.2 3 4 1 1 0.04 1.0 5 5 0 1 0.02 0.6 Responses Acceptable Range % dissolution at 30 minutes Maximize % dissolution at 60 minutes Match RLD Viscosity at 0 Shear Define Design Space 0.040.020.00 8000 7500 7000 6500 6000 1.00.60.2 Xanthan gum MeanofCI Poloxamer Corner Center Point Type Main Effects Plot for CI Fitted Means Minitab Post-processing 3 full factorial with center point and post-processing main effects plots from 30 and 60 minute dissolution are shown in Figures 4 a, b, and c respectively. Figure 3a. Pre-processing full factorial with center point Figure 3b. Main effects plot pre-processing. 1.301.050.80 95 90 85 80 75 70 65 60 2.01.51.0 0.500.250.00 Xanthan Gum Meanof60mindisso Poloxamer Simethicone Corner Center Point Type Main Effects Plot for 60 min disso Fitted Means Figure 4b. Main effects dissolution 30 min. Figure 4a. Pre-processing full factorial with center point Figure 4c. Main effects dissolution 60 min. 20 30 40 50 60 70 80 90 100 110 0 50 100 150 %D Time (Min) DISSOLUTION PROFILE RLD After DOE (16002) Before DOE (16001)