
Recommended
Recommended
More Related Content
Similar to Criminology Essay Questions: Family Size, Type & Student Achievement
Similar to Criminology Essay Questions: Family Size, Type & Student Achievement (20)
More from faithxdunce63732
More from faithxdunce63732 (20)
Recently uploaded
Recently uploaded (20)
Criminology Essay Questions: Family Size, Type & Student Achievement
- 1. Criminology Essay Questions Please answer the following questions using APA citation in one or two paragraphs: 1. In what fundamental ways does conflict theory differ from the other theories we have covered (choice, trait, social structure, social process)? 2. Which social process theory does the best job of explaining adult criminality? Which social process theory does the best job of explaining juvenile delinquency? (These cannot be the same theories.) What do both of these theories have in common? Family Size, Family Type and Student Achievement: Cross-National Differences and the Role of Socioeconomic and School factors GARY N.MARKS* BNTRODUCnON The finding that students from larger families have less favorable educational outcomes is well established in the United States (Blake, 1989; Mare and Chen, 1986; Powell and Parcel, 1999). Negative effects for family size or the tiumber of siblings on educational attainment have been also found in Australia, Finland, Hong Kong and Israel (Le and Miller, 2001; Post and Pong, 1998; Riala, et al., 2003; Shavit and Pierce, 1991).
- 2. With regard to family type, it is generally concluded that in the United States children from divorced families show poorer educational outcomes than children from intact families (Amato, 2000; Jeynes, 2002:13-18). Lower educational attainments of students from divorced or single-patent families have also been found in Finland and Great Britain (Powell and Parcel, 1999; Riala, et al., 2003). In the United States, children from reconstituted families — that is, families with a stepparent — tend to have lower educational attainments than children from two-parent families, and, in quite often, single-parent families (Biblarz and Raferty, 1999; Jeynes, 1999). It is not possible to conclude if the effects of family size and type on educational outcomes are similar or very different across countries, even with a large number of single country studies, due to differences in sampling and measurement. However, cross-national comparisons are possible with international studies of student achievement, which select comparable samples and use identical outcome measures. In the first international reading study, Thomdike (1973:74-79) reported consistently negative correlations between the number of siblings and reading achievement among 14-year-olds. The median correlation was -0.11, with stronger negative effects in Scotland, England and Hungary, but very weak correlations in other countries. In the first international science study, the negative correlation between family size and science achievement was strongest iti Scotland, England and Japan, and
- 3. weakest in Belgium, Italy and Sweden (Comber and Keeves, 1973:258). The more recent international achievement studies have not been employed to extensively examine the relationship between family size and achievement. However, they have been used to investigate the effects of single-parent families. Using data from the Third International Mathematics and Science Study (TIMSS), Pong et al. (2003) found negative effects on •Melbourne Institute for Applied Economic and Social Research, University of Melboume, Vietoria 3010, Australia * Australian Council for Educational Research, 347 Camberwell Rd. Camberwell, Vietoria 3124, Australia 2 Journal of Comparative Family Studies achievement in mathematics and science for a single-parent family in most ofthe 12 eountries examined. The largest effects were found for the United States and New Zealand. In most countries in the OECD's 2000 Program for International Student Assessment (PISA), students from single-parent households had lower reading scores than other students. Larger differences were found in the United States, Finland, the United Kingdom and the Netherlands (OECD,2001:152,194,292). One explanation for differences in educational outcomes according to family size or type is
- 4. simply socioeconomic background. Larger and single-parent families tend to have lower socioeconomic status, so the effects of family size and family type may be due largely to socioeconomic background. In the United States, socioeconomic status and race accounted for most of the lower scores of eighth grade students from single-parent families (Finn and Owings, 1994). Similarly, Thompson et al. (1994) concluded that economic disadvantage was responsible for the poorer outcomes of children from single- parent families. Downey (1995a) found that parents' economic and cultural resources, together with their participation in their child's activities, largely explained achievement differences between students from step- and intact families. Jeynes (2002:72-77) found that post-divorce socioeconomic status almost completely explained the negative effects of divorce on educational attainment. Blake (1989) formulated the resource dilution hypothesis to explain the finding that students from larger families perform less well academically. Larger families will have less material resources for a given income level and parents have less time spend on each child. Downey (1995b) found that measures of economic resources and time spent talking with the student could account for the effects of sibship size, largely confirming the dilution hypothesis. Although Downey (2001) notes problems with the resources dilution theory, he concludes that it useful for explaining the inverse relationship between family size and achievement in the United States.
- 5. Educational systems may also play a role. Students from larger and non-intact families tend to be concentrated in less demanding school programs (or schools) and therefore have weaker educational outcomes. For the United States, Pong (1997; 1998) noted that students from single-parent families are clustered in particular schools and these schools tend to have lower educational attainments. The clustering of students from larger, single-parent or reconstituted families may be particularly important in European countries with tracked education systems, where there are larger achievement differences between schools. Endeavoring to explain differences hetween countries in the effects of family type, Schiller et al. (2002) concluded that the benefits of living in a traditional (intact) family were stronger in more-economically developed economies. They speculated that greater resources were required to educate children in economically developed countries. Riala et al. (2003), after finding only weak effects for a single-parent family in Finland, concluded that the effects of family type are likely to be smaller in welfare states with highly educated populations. Pong (2003) concluded that differences in the government provision of resources to single-parent families accounted for differences between countries. The main purpose of this paper is to cross-nationally compare the effects of family size and
- 6. Family size. Family type and Student Achievement 3 family type on student achievement, and to examine the extent that these effects can be accounted for by socioeconomic background, resources in the home and school factors. The research questions addressed in this study are: What are the cross-national patterns in the effects of family size and family type on student achievement in reading and mathematics? To what extent can the effects of family size and family type be attributed to socioeconomic background? Is the resource dilution hypothesis supported in most countries? In other words, do more limited material resources and social resources (including parent time spent with the child) account for the negative relationship between family size and student achievement? Are students from larger and non-traditional families more likely to be found in academically weaker locations in the school system, especially in countries with tracked school systems? * Can cross-national differences in the effects of family size and family type be attributed to economic development, the size of the welfare state or other characteristics of countries?
- 7. This study addresses these questions with data from 30 countries. In contrast to the OECD (2002b) and the Pong et al. (2003) studies of family effects, this study examines the effects of reconstituted families as well as single-parent families. A much stronger measure of socioeconomic background (father's and mother's occupation and education) is used than was possible in the Pong et al. (2003) study. Furthermore, the study distinguishes between socioeconomic background and the material resources (possessions) in the home because the resource-dilution hypothesis directly applies to material resources in the home; larger families will have less of them. DATA AND MEASURES The data is from the OECD 2000 Program for International, Student Assessment (PISA) study that examined student achievement in reading, mathematics and science for over 172,000 15-year-old students in 6,000 schools across 32 countries. Participating in the survey were all OECD countries except Turkey, and several non-OECD countries: Brazil, Latvia and the Russian Federation. Within each country, a two-stage sampling procedure was employed, first randomly selecting schools with probabilities proportional to size and second, randomly selecting 15-year-old students. In some countries;schools were stratified by type or location. Details on the sampling and procedures can be found in the initial and technical reports (OECD, 2001; OECD, 2002a). Japan was excluded from the
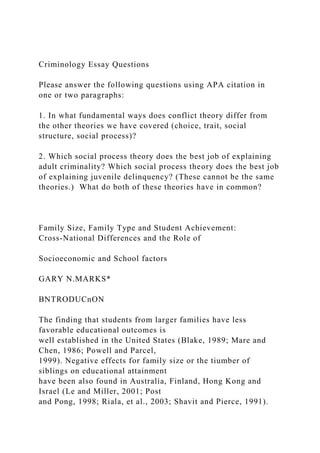
- 8. analyses for this paper because there was too much missing data on the components of socioeconomic background, parents' occupations and education. Liechtenstein was also excluded, because of the small sample size. 4 Journal of Comparative Family Studies MEASURES Family Size and Family Type The measure of 'family size' was constructed from a question on the number of the student's brothers and sisters. The question asked 'How many brothers and sisters do you have?' and the students were asked to distinguish siblings of older, younger and the same age. The question did not exclude stepbrothers and stepsisters. Summary statistics on family size are presented in Table 1. In almost all countries, the modal number of siblings is one or two, with the exception of Mexico, where the modal number of siblings is three. The column headed 'Mean' shows that the largest families of 15-year-olds are in Mexico, followed by Ireland, Iceland, the United States and Brazil. The smallest families are in Italy and Korea. 'Family type' is comprised of four categories: intact, single- parent, reconstituted and other families. 'Intact' is defined as when the student lives in the same
- 9. household as both parents; where on the questionnaire the student indicated they were living with their mother and their father. 'Single-parent' families refer to both single-mother and single-father families. 'Reconstituted' families comprise families where the student is living with a parent and a stepparent. In these cases, students indicated they were living with a mother or father and a stepmother or stepfather. 'Other' is a residual group which includes students living with two stepparents of opposite sex (32 per cent), students living with one or more grandparents but no parent or stepparent (30 per cent) and students living with siblings but without parents, stepparents or grandparents (38 per cent). Table 1 shows the unweighted frequency distributions for family type. In most countries between 70 and 80 per cent of 15-year-olds live in intact families. Korea shows the highest proportion at 87 per cent and the United States shows the lowest proportion at around 50 per cent. The proportion of students living in single-parent households was under 10 per cent in Greece, Korea and the Netherlands, over 20 per cent, in Latvia, New Zealand and the United States, and between 10 and 20 per cent in the other countries. The proportion living in reconstituted families is highest in the United States at around 15 per cent. In Australia, Denmark, Iceland, Latvia and New Zealand over 10 per cent of 15 year-olds live in reconstituted families. The proportion living in reconstituted families is very low in Greece, Ireland, Italy, Korea and Mexico. In the other countries the proportion is between 5 and 10 per cent. The
- 10. proportions living in 'other' family types are much lower, below 2 per cent in all countries except Brazil and the United States. Reading and Mathematics Achievement The two measures of student performance analyzed here are reading achievement and mathematics achievement. Item Response Theory (IRT) modeling was used to create scores standardized at an international OECD mean of 500 and standard deviation of 100. The country means and standard deviations can be found in the OECD's initial PISA report (OECD, 2001:253,259). Students' scores are in the form of five plausible values rather than a single score. The technical report (OECD, 2002a) details the development and construction of the achievement measures. Family size. Family type and Student Achievement i ta. O o I 8 a ct
- 11. t~~; ^ en , en ^ O ^ r-. cn. oq r~; >/̂ o r-; Tt oq Os •^ ' ^ ' — i ^ H e n t N ' H c n ' ^ ^ o ( v 4 . - H ( v i ^ ( r ^ o _ H ' c N S s tN en ^ F= 16 7 so oq so i>. oq in r-. so. >r) Tt Tt en r^ >o r~- ON Tt (̂ O O O C N l O O O C J O C J o — ^ O O ^ ' O ^ ' O en en *o O en tN '—̂ en oo O oo' ON OS O O ^ O O ^ O O N T t S p O N . — ^ r ^ C N Os OS CN' r-̂ (N' cN CN' en -̂ ' o -T; 00 Q g ^ en cf> •^ r~- fN Tt •—I >o o 0*1 en so -^ Q in ^ 42 0 19 14 5 36 1 tN oq IT) oq
- 12. S tN tN od o q s o s q t N O s O s c s t N i r j s q o ^ o 6 i / S - ^ ' o 6 r ~ e n t N O s 00 OS Q d o r^ ' o ^ cN r^ r~- "-H rj- rj- vo CN --H rsi r^ r— r̂ * ^o t̂ ^ r̂ - 'sO r̂ * r^ r^ oo t̂ ^ r^ oo iri Csi »n 5̂ o3Ŝ ^ tN OS •^' iri so r^ oo in lo 00 tN •-H so so en - i tN >O T t - H en CN en o o q o q s o o s T t . ' n t n i n r ^ o s s O ' — ' e n s o o s o o o s o o o o o c ; c 5 c 5 o c 5 o c 5 < ^ c J c ) o o d tN OS OS en ^ ^ ^ ^ en tN
- 13. cn so en " Q so oq (N ^ ' ^ ON OS Tt en d o --H' —; so en en s© so csi —; « rt _ ; ^ C N t N - H ( N t N t N ^ — — c t N C S ^ $ lg iu « °̂ 1 -a w u q c3 5? «" "2 -a 00 ^ ""C c =S i2 J ^ Si !s .2 6 a 1/3z o
- 14. •S o f2 00 ' -s: O I 8 §. Journal of Comparative Family Studies oo sD r— ON t— ^ ""̂ 00 ^ C^ ""̂ ON rr*; : 3 ; : 5 , _ H r - i o o c n c o c N ' © 0 c s o Q g cr ' ^ '"^ r ^ ^ f̂ " ^ ^ ^^ t ^ ^ ^ ^ r-J o '—<' C> O '-̂ * '—** ^ O O O r*S O r ^ l-w ON OQ OJ f̂ ^ IT" CD ^ HI} ^ t ^ 00 ""̂ r o CN CN l o ON r ^ CN "^ ^ ' ^ ^ 1-H c ^ o o v o c s r ^ o s O N c ^ r ^ r ^ o s ' — ; O ^ • ^ O * o ^ ^ 0 Q c : ^ ^ Q C r ; C r J QG ) S " ^ c F C s c 3 N Q c N ' ^ r - ; 3 ; r ^ ^ g o o N r ^ c ^ o o ^ o o c ' ^ O ' / ^ f N T t c - j r ^ O N O ^ o ' - ^ O N ^ i > ^ O N C S i £ j
- 15. i ~ 5 r ^ o o f O O N O O ' ^ r O i — < ' — ^ C S O ^ , - H ^ H 1—t O c s c o ^ O v ^ v ^ O N ^ c ^ i O * — ; ' — j v ^ c s i ( r ^ - ^ O T f O v o o ' ' C O t - ^ Q N Q C r o r*̂ 00 ^o r*̂ 00 r*̂ <̂o r̂ ^ r*̂ t~̂ ^c '̂ r r^ HN i/^ fO fN [— "^ ON ^ '"̂ O r̂ * "̂̂ ^ cT) G ^ ^ <^ ^ D t-^ ^-~* ty "^ <^ ^ V ^ 1-H Q O c*^ CN C*̂ t—• CN r ^ • ^ ^ t~^ O O C J O r O i — ^ ' ' — ^ O O O O O O r ^ r ^ ' ^ CO CO cN_ r ^ ^ Tf, ^ •^. v p CO o s O s c N Q o q ' o r ^ < o o ) r ~ : Q i o O N f v J T — ' c N C N ' ^ ' - " ' ^ — ^ C N — H C S C N ^ ^ C O C N C N ( N — • - ' ' - ' ' - " ( N — ' C N C N C N g o 11 =« ?5 -̂ 8 fe t23 I '>< S » c ai o u o S z z z OJ)
- 16. c£ •I I ,on on c/5 • 2 < ^ 1 1 1 - Family size, Family type and Student Achievement 7 Socioeconomic Background Socioeconomic background is a composite measure comprising parental occupational status and educational attainment. If data on one or other variable was missing, information on the other variables was used to construct the njeasure. Parental occupation was coded according to the International Standard Classification of Occupation 1988 (ISCO-88), as provided by the International Labour Office. ISCO-88 is a four-digit hierarchical coding schema compdsitig 390 different occupational categories. The parental occupation measures are based on the International Socioeconomic Index (ISEI) index, which ranges from zero to 100 based on ISCO-88 codes. Ganzeboom and Treiman (1996) provide details on its construction and list ISCO-88 occupational titles with their respective ISEI scores. Information on the educational attainment of each parent was collected by two questions. The first asked for the parent's level of school education completed. A follow-up question asked about whether the parent had completed a post-secondary qualification. The responses
- 17. to these questions were classified according to the International Standard Classification of Education (ISCED) schema (OECD, 1999). Parental education was coded as one of seven categories: No Schooling, Primary School, Middle Secondary School, Higher Secondary School (Non- Academic), Higher Secondary School (Academic), Tertiary Education (Non- Academic), and Tertiary Education (Academic). Continuous measures were constructed by optimal scaling, which changes the ordinal and cardinal properties of the measure to maximize the relationship of father's or mother's education with student achievement. Resources 'Material resources' is a summary measure based on the possessions and educational resources in the home. Possessions include the presence or absence at the student's home of a dishwasher, their own room and a link to the Internet; and the number of household mobile phones, televisions, computers, bathrooms and cars. Educational resources include possession of a dictionary, a quiet place to study, a desk for study and textbooks, and the number of calculators in the home. The logic of this measure is that in larger families students are less likely to have as many of these material resources. The measure 'Social Resources' was constructed from a question that asked how often do the parents discuss the student's progress at school, how often the family eats their main meal around a table, and how often the parents spend time just
- 18. talking to the student These social resources provide an index of parental time spent with students on their school work and more generally. The three items were isolated from principal component analysis. Social resources were not included in the analyses of family type, since there is no theoretical rationale for its inclusion. Academic Location Academic location is defined by the student's' school and the student's location within the school. Individual schools were identified from the data and multilevel modeling was used to control for between-school differences in achievement! Location within schools was 8 Journal of Comparative Family Studies ascertained by grade and school program. All students were asked their grade at school. The grade variable was scored relative to the modal grade ofthe country. If the students were in the modal grade they were given a score of zero for grade, a score of 1 if one grade above the modal grade, a score of -1 if one grade below the modal grade, and so on. Information on school program was elicited by a single question asking students what type of program they were in at school. The response categories were appropriate to the national context but also corresponded to the categories in the
- 19. OECD's 1999 International Standard Classification of Education (ISCED). This classification separates academic, vocational and work preparation programs at two levels: upper and middle secondary school. A variable 'school program' was constructed comprising the following categories: Academic Program (Lower Level), Non- Academic Program (Lower Level), Academic Program (Higher Level) and Non-Academic Program (Higher Level). In countries where there was no data on program differentiation within schools (Canada, Finland, Iceland and Norway), the measure of academic location was based only on grade. Analyses These analyses allow examination of the effects of family size and family type with and without controls for socioeconomic background, resources, and academic location. The extent that the effects for family size and family type decline when controlling for these factors indicates their importance. For example, if the effects for family type are reduced to statistical insignificance when controlling for socioeconomic background, then it can be concluded that socioeconomic background 'accounts' for the relationship. Similarly, the resource dilution hypothesis would be supported if the effects of family size were not statistically significant when controlling for material and social resources. The effects on family size and type are presented as regression coefficients that refiect the
- 20. (average) change in achievement score for a unit change or difference in the independent variable. For family size, the effect refiects the change in achievement score for one additional sibling. For family type, the effects for single-parent, reconstituted and 'other' family types are relative to students from intact families. The differences are exactly the same as obtained by comparing the mean achievement scores of students from each group. The standard errors associated with the regression coefficients have been adjusted to take into account the cluster design of the sample and sample stratification (if employed). Each regression coefficient and standard error was calculated by averaging the results obtained fi-om separate analyses ofthe five plausible values (obtained from IRT modeling). The statistical significance of the effects is indicated in the standard way. All analyses were weighted to refiect the population of 15-year-old students in each country. RESULTS Number of Siblings Table 2 presents the effects of number of siblings on reading achievement, with and without controls for socioeconomic background, resources and school factors. The first column Family size, Family type and Student Achievement 9
- 21. shows each country's unadjusted or total effects for one sibling. Column 2 shows the coefficients when socioeconomic background is taken into account. The coefficients in Column 3 are net of socioeconomic background and material resources. The coefficients in Column 4 were estimated after, the further addition of social resources. The final column shows the effects of one sibling on reading achievement net of socioeconomic background, material and social resources, and academic location. In all countries except Iceland, the effect of the number of siblings is negative and statistically significant. This means that each additional sibling is associated with lower reading scores. Its effect was particularly strong in Portugal, where one sibling was associated with an average reading score 21 points lower. By extension, 2 siblings reduces the score by 42 score points and 3 siblings 63 score points. The correlation between the number of siblings and reading achievement in Portugal was about 0.26 so its effect is not trivial. Relatively strong effects for the number of siblings were also found for Belgium, the Czech Republic and Italy (-18 score points) and Hungary, Germany, Greece, and New Zealand. Besides Iceland, the countries showing the weakest effects for number of siblings were Finland, Denmark, Canada and Korea. In most countries, the effect of the number of siblings on reading achievement declined after taking into account the student's socioeconomic background. Declines were found in almost
- 22. all countries, except those with relatively small initial effects. The effect of number of siblings was reduced by over 40 per cent in several countries: Austria, Brazil, the Czech Republic, France, Hungary, Korea, Mexico, Poland, Switzerland and the United Kingdom. In contrast,' socioeconomic background had little impact on the effect of the number of siblings in Italy,' Luxembourg and Russia. For the Netherlands, the effect of the number of siblings was not statistically significant when controlling for socioeconomic background. However, in most countries much of the impact of family size on reading achievement can be attributed to students' socioeconomic background. In only 6 of the 30 countries examined was the effect for the number of siblings on reading achievement, net of socioeconomic background, greater than 10 score points. Before controlling for socioeconomic background, its effect was above 10 score points in 17 of the 30 countries. The next step in the analyses was to test the resource dilution hypothesis by examining the impact of material and social resources on the effects of family size. Neither had much impact. In almost all countries the effect of the number of siblings on reading scores declined only marginally. After adding for material resources, the effects of the number of siblings declined by up to only 3 score points. The addition of social resources produced a further decline again of up to only 3 score points. In most countries the declines were much smaller. The exceptions were the Czech Republic where the effect declined from 11 to 5 score points. So in
- 23. most countries the effects of family size are not closely associated with material and social resources. Taking into account the distribution of students across schools and the academic location of students within schools produced more substantial declines. Declines were observed in most countries, especially in European countries with tracked school systems: for example, Austria, Belgium, the Czech Republic, Greece, Hungary, Italy and Portugal. Smaller declines' 10 Journal of Comparative Family Studies 1 p 1< 1/2 o *^ PQ O oibd CQ C T S
- 42. em bo u Eamily size. Family type and Student Achievement 11 :O R E S o s R E A D ] Z o 1 5 0̂ 1
- 56. te s c 12 Journal of Comparative Family Studies were found in countries with less differentiated school systems. Therefore, in many countries especially those with tracked school systems, students from larger families tend to be in the less academic locations in the school system. Table 3 presents the results for the same series of analyses, but for mathematics rather than reading. Generally, the pattern of results is similar. In most countries, the unadjusted effects of the number of siblings on mathematics achievement were very similar to that for reading achievement. Exceptions were Korea, where the effect ofthe number of siblings was much greater for mathematics than for reading, and Switzerland, where the effect of family size on mathematics achievement was not significant but the effect on reading was negative 10 score points. The extent that socioeconomic background accounted for the effects of family size on mathematics achievement was almost identical to that for reading. Material and social resources had little impact on the effect of the number of siblings (except in the Czech Republic and Portugal) and, when controlling for academic location, the net effects for
- 57. number of siblings were quite small. The impact of academic location on the effect of family size does not appear to be stronger for mathematics than for reading. Family Type Students from intact families (living with both parents) have higher scores than students from single-parent, reconstituted or other types of families. None ofthe 30 countries examined showed, for both reading and mathematics, a statistically significant effect indicating that students from intact families had lower average scores than students from the other family types (Table 4). For reading, students from single-parent families had significantly lower scores in 18 countries and students from reconstituted families had lower scores in 26 countries. For mathematics, students from single-parent families had significantly lower scores in 21 countries and students from reconstituted families had significantly lower scores in a slightly different group of 21 countries. The largest effects for a single-parent family were found for the United States where, on average, students from single-parent family had lower scores that students from intact families — 50 score points lower for reading, and 53 score points lower for mathematics. These are large effects, considering that 100 score points approximates one standard deviation. The United States, then, has both the largest proportion of 15-year- olds living in single-parent families and the strongest effects for single-parent families.
- 58. Other countries with large effects for a single-parent family were the Netherlands (34 score points in reading and 44 score points in mathematics) and the United Kingdom (34 score points in readitig and 31 in mathematics). Moderate to large differences were also found in Belgium, Finland, France, Ireland, New Zealand, Norway and Sweden. There were no significant differences between students from single-parent and intact families, for both reading and mathematics, in Austria, Brazil, the Czech Republic, Greece, Iceland, Russia and Switzerland. In Mexico, Poland and Portugal there were significant differences for mathematics but not for reading. In Latvia and Luxembourg, the effect for a single-parent family was significant for reading but not for mathematics. The largest differences in reading performance between students from reconstituted and Family size, Family type and Student Achievement 13 I o o I C/3 en
- 65. t * ** C an ad a 1 * * IC^l * * * i n * * * i n 0 0 * * * '
- 70. r - H * * * i n * * * OS 1 H un ga ry O S OS (—1 o 0 0 en Ic el
- 74. J , oo L at vi a 14 Journal of Comparative Family Studies 0 u c/3 J 1 Z o O 5 S IB L ] O o b.
- 78. * 00 1 A t , - ^ 1 - H 1 ux em bo ur g * * oo * * (Ts * * OO
- 79. " ^ * 0 0 « •»• 1 8 X * ^ m O t s OS et h er la n d s
- 81. * * (N * * 00 i n * i n •* * * O N or w ay Z cn * * * * oo 0 0
- 89. o C "53 W iJ . o Family size, Family type and Student Achievement 15 R O L S O uo 1̂̂ iz. o 6 1 1̂̂ 3Z 5 E
- 91. c Cl, Si ng he r O > c •= 2; •3* 0 0 •S *t s -2 L r- t s * so -7 1
- 92. * * *i n t scn 1 •if i n cn T - H S tr al ia 3 1 * * S O -2 4, f N Os 1
- 95. SO 1 O S t s 1 o -1 1. ON * * so O I * * * 0 0 -2 4, •if •if •if
- 96. 0 0 Os •if •if •if -4 5 •if * •if tN 0 0 ts 1 * * 4f S O 1 CO c G ai
- 97. * <N ^ H * •if -1 8. O S 1 -7 3. 0 0 l - H 1 ex I N U •if 0 0 . — 1 oo 1 •if
- 98. -1 5. •if •if •if t s t s t s •if -5 3, * * Os cn * *•if ON cs 1 4f 0 0 cn *
- 99. * * -2 3, * * * Os t s1 .4 * * * o o cs 1 •K- * S O i n t s1 la nd
- 100. F in 0 0 [— * * •if o -2 1, * **. - H i n cs 0 0 -1 5. * * •X- so f— * * *
- 101. S O CS t s1 ne e F ra (N Os -1 1 * * S O -2 5. * •if 4f .—1 Os 1 .7 * 00
- 104. * 0 0 ts 1 •if * f N cn cs 60 3 - t s •if * -1 9. f— o I - H m "̂ 1 la
- 105. nd Ic e - t s 0 0 1 o •if * 4f { ^ t s1 -3 2. fN •if * * t s S O CS ' an
- 106. d Ir el CO -2 0. •if •if i n ON •if >n so cn •if i n . _ H I It al • ^ o
- 108. o o cn cn * so -2 7. oo i n * so -3 1. cs i n cn • .2 "> L at
- 109. 16 Journal of Comparative Family Studies L S) O o' u (T E (N O o (J O S C E S IN F Z E Q
- 126. U ni te d S ta te s q i V 8 d QH V p d I I I o Family size, Family type and Student Achievement 17
- 127. intact families were found in the United States (46 score points), Belgium (34), Australia (33), New Zealand (30), Poland (29), Canada (28) and Norway (25). In four countries — Brazil, Greece, Latvia and Portugal — there was no significant difference in average reading scores between students from reconstituted and intact families. In many countries — Australia, Austria, Canada, Germany, Hungary, Iceland, Luxembourg, Mexico, Poland, Spain and Switzerland — the difference in average score for reading between students from reconstituted and intact families was substantially greater than differences between students from single- parent and intact families. In other countries the effects were comparable. In few countries — Denmark, the Netherlands and the United Kingdom — the effect of a reconstituted family was substantially less than that for a single-parent family. For mathematics, the findings were only a little different from those for reading. Countries showing the largest significant differences between students from reconstituted and intact families were the United States (43 score points), Belgium (37), New Zealand (34), Hungary (31), Switzerland (30), Norway (29) and Latvia (28). Compared to reading, a larger group of countries showed no significant differences in mathematics achievement between students from reconstituted and intact families: Brazil, Greece, Ireland, Italy, the Netherlands, Poland, Portugal, Russia and Spain. Table 4 shows that in almost all countries the small groups of
- 128. students from 'other' family types have substantially lower scores in both reading and mathematics than students from intact families. The effects for 'other' family type are often much larger than the effects for single-parent or reconstituted families. Again, the largest effects are for the United States, where this group is proportionally largest. Since there too few students living in 'other' family types for stable estimates, this group is not included in the subsequent analyses discussed below. Socioeconomic Background In most countries socioeconomic background reduced the effect of a single-parent family, but sizable effects remained (compare Table 5 to Table 4). Adding socioeconomic background to the analysis reduced the effect of living in a single-parent family on reading achievement by up to only 5 score points in 1.9 of the 30 countries. Larger declines were found in Belgium, Korea, Ireland, the Netherlands, and the United States. When controlling for socioeconomic background, the effects of a single-parent family on reading achievement became insignificant only in Australia and Hungary. For mathematics the findings were very similar. In most countries, socioeconomic background reduced the effects for a single-parent family but does not account for the relationship. In the 21 countries with significant effects for a single-parent family, controlling for socioeconomic background effect reduced the effect to statistical insignificance
- 129. only in Australia. In 18 of the 30 countries the decline was less than 4 score points. In most countries sizable effects for living in a single-parent family remained when controlling for socioeconomic background. Socioeconomic background has less impact on achievement differences between students from reconstituted and intact families. The only countries where the initial effect was at least moderate (over 20 score points) and the addition of socioeconomic background produced a 18 Journal of Comparative Family Studies Table 5 DIFFERENCES IN READING AND MATHEMATICS SCORES BY FAMILY TYPE (NET OF SOCIOECONOMIC BACKGROUND) Australia Austria Belgium Brazil Canada Czech Republic Denmark Finland France Germany Greece Hungary Iceland
- 130. Ireland Italy Korea Latvia Luxembourg Mexico Netherlands New Zealand Norway Poland Portugal Russian Federation Spain Sweden Switzerland United Kingdom United States Reading 1 Single-parent -6.3 -5.5 -19.8*** -8.6* -10.1*** -1.7 -14.7** -21.5** -20 7*** -9.4 -5.8 -5.4
- 131. -2.5 -18.7*** -10.8** -10.9* -8.5 -17.0** -2.1 -24.0** -23.4*** -20.0*** 4.4 -5.4 -0.1 -9.3** -18.2*** -7.2 -29 5*** -39.0*** Reconstituted -24.7*** -20.8*** 1 -20.2*** 1 -7.5 -22.1*** 4.3 -9.4* -18.5**
- 133. -14.2** -16.8 -10.1* 2.9 -21.1*** -15.7*** -16.0* -2.5 -11.7 -10.3* 1 -31.6** -23.4*** 1 .30.5*** 1 -21.9* 1 -14.5* 1 -7.6 1 -12.3* I -18.5*** 1 -13.0* 1 -27 9*** 1 -45.7*** Reconstituted -12.6 -224** -20.2** -15.8* -19 5*** -10.2 -11.9* -21.9***
- 134. -18.2** -22.8** -31.6 -26.4*** -13.5* -7.5 -17.8 -23.2** -27.7** -28.6** -20.2* -94 -25.5*** -24.0*** -18.7 -18.5 5.3 -13.9 -15.4** -33 1*** -13.1* -32.1*** Note: Comparison with Intact Families. *0.0t<P<0.05, **0.00t <P<0.01 ***P<O.OOt substantial decline in the effects of a reconstituted family type were Australia, Belgium, New Zealand, Norway and the United States. Only in Belgium, however, was the decline more than 40 per cent. Almost identical results were obtained for mathematics.
- 135. Material Resources More substantial declines for the effect of a single-parent family on reading achievement were found with the addition of material resources: in Belgium (from 20 to 10 score points), Canada (from 10 score points to statistical insignificance), Denmark (from 15 to statistical Family size. Family type and Student Achievement 19 insignificance), France (21 to 10), Korea (1 1 to statistical insignificance), Luxembourg (17 to statistical insignificance), the Netherlands (24 to 15), New Zealand (23 to 9), Norway (20 to 11) and the United States (39 to 27). In many countries, material resources also reduced the effects of a single-parent family on mathematics achievement (compare Table 6 to Table 5). This implies that the lower scores of students from single-parent families can be attributed more to differences in wealth and educational resources than to socioeconomic status. In contrast, adding material resources to the analysis did not produce as large a decline in the effect of a reconstituted family. For example, compare the declines in the effects of a single- parent and a reconstituted family on reading in Belgium, Canada, Denmark, Ireland, Korea, Luxembourg, New Zealand, Sweden, Switzerland and the United States. After controlling for socioeconomic background and material resources, the effects of a reconstituted family on
- 136. reading remained substantial in several countries: Italy (a 35 score point difference), Ireland (29), Luxembourg (27), the United States (26), Spain (24), Korea (24), Switzerland (24), Australia (21) and Germany (20). In contrast, only the United Kingdom and the United States show effects of a single-parent family greater than 20 score points with the same controls. So generally, material factors play a large role in the lower scores of students from single-parent than from reconstituted families. Academic Location After controlling for socioeconomic background and material resources, the effects of a single-parent family were already quite weak in most countries. Among countries with relatively substantial and significant effects controlling for academic location substantially reduced the effect for a single-parent family on reading achievement in the Netherlands, produced moderate declines in Finland, the United Kingdom and United States and had no impact in Sweden and Norway. Controlling for academic location substantially reduced the effect for a reconstituted family especially in countries with tracked school systems (compare Table 7 to Table 6). This was particularly evident in Austria, Belgium and Germany. In contrast, controlling for school factors had little impact on the remaining effects of family type in Norway and Sweden, and a small or moderate impact in Finland, New Zealand, the United Kingdom and the United
- 137. States. These countries primarily have comprehensive systems. So in countries with highly tracked educational systems, students from non-intact families are more likely to be found in the academically weaker locations in the tracked school system. DISCUSSION A substantial proportion ofthe effect of family size on reading and mathematics achievement can, in many countries, be attributed to socioeconomic background. In almost all countries, the effect of family size declined by between a quarter and a half when taking into account socioeconomic background. Therefore, miich of the association between family size and educational outcomes is simply due to the correspondence between larger families and lower socioeconomic status. In contrast, material resources and social resources made little additional impact on the effects of family size. These variables were included to test Blake's resource 20 Journal of Comparative Family Studies Table 6 DIFFERENCES IN READING AND MATHEMATICS SCORES BY FAMILY TYPE (NET OF SOCIOECONOMIC BACKGROUND AND MATERIAL RESOURCES) Australia Austria
- 138. Belgium Brazil Canada Czech Republic Denmark Finland France Germany Greece Hungary Iceland Ireland Italy Korea Latvia Luxembourg Mexico Netherlands New Zealand Norway Poland Portugal Russian Federation Spain Sweden Switzerland United Kingdom United States Reading Single-parent 5.6 0.7 -9.6*
- 143. -14.3 -14.6 6.0 -10.6 -10.1 -30.0*** -11.7 -23.0*** Note: Comparison with Intact Families. * 0.0t<P<0.05, ** O.OOt <P<O.Ot *** P<0.001 dilution hypothesis (1989), since, other things equal, larger families have less material resources and parents in larger families have less time to spend with each child. However, these analyses found that material and social resources did not help account for the relationship between family size and achievement so the resource dilution hypothesis was not supported. In many countries the effects of a single-parent family were substantially reduced or insignificant when controlling for socioeconomic background and material resources. Often, material resources had a larger impact, suggesting that part of reason for the lower achievements of students from single-parent families is the lower levels of wealth and educational resources. Family size. Family type and Student Achievement 21 Table 7
- 144. DIFFERENCES IN READING AND MATHEMATICS SCORES BY FAMILY TYPE (NET OF SOCIOECONOMIC BACKGROUIVD, MATERIAL RESOURCES AND ACADEMIC LOCATION) Australia Austria Belgitim Brazil Canada Czech Republic Denmark Finland France Germany Greece Hungary Iceland Ireland Italy Korea Latvia Luxembourg Mexico Netherlands New Zealand Norway Poland Portugal Russian Federation Spain Sweden Switzerland United Kingdom
- 147. -14.3** -9.1 -9.3 5.6 -1.6 -5.8 -13.0** -7.8* .12.4*** -23.0*** I Mathematics Single-parent 1.7 1 4.9 1 2.4 4.8 -9.9*** -6.3 -9.8* -6.8 -0.6 4.1 -7.9 4.4 2.2 -9.8 -7.3*
- 149. -14.8** -13.5* -2.2 -6.0 -13.3 -16.4* -8.8 -8.3 5.4 -18.6** -15.7** -0.3 2.8 5.7 3.8 -9.5 -18.4** -10.3* -18.6*** Note: Comparison with Intact Families. * 0.01<P<0.05, ** 0.001 <P<0.01 *** P<0.001 In contrast, sizable negative effects of a reconstituted family remained after controlling for both soeioeconomic background and material resources indicating that economic factors play a smaller role in the weaker performance of students from reconstituted families. One possibility is that their weaker performance is due to the often problematic relationships between stepchildren and stepparents.
- 150. Countries that show stronger (or weaker) effects for family type are not the same countries that show stronger (or weaker) effects for family size. For example, Finland, Norway and 22 Journal of Comparative Family Studies Sweden show stronger effects of family type but relatively weak effects for family size. The countries that show weak effects for family type — Brazil, the Czech Republic, Greece, Poland, Portugal and Russia — are different from the countries that show weak effects for family size, namely Canada, Denmark, Finland, Iceland, Japan and Korea. The effect of family size was strongest in Portugal and fairly strong in Brazil and Mexico. So it is not the case that the detrimental effects of larger families are stronger in more- economically developed countries. The more-economically developed countries tend to show weaker effects for family size, although there are notable exceptions such as Belgium, Italy and the United States. More economically developed countries tend to show stronger effects for family type supporting Schiller et al.'s (2002) argument that the benefits of living in an intact family tend to be stronger in more-economically developed economies. These analyses do mot support the contention that effects of family type are weakest in countries with larger welfare sectors: Belgium, Finland, Norway and Sweden show relatively strong effects of family type.
- 151. REFERENCES Amato, P. R. 2000 "The Consequences of Divorce for Adults and Chitdren." Joumat of Marriage and the Famity 62(November): 1269-1287. Biblarz, T. J. and Raferty, A. 1999 "Famity Structure, Educationat Attainment and Socioeconomic Success: Rethinking the "Pathology of Matriarchy"." American Joumat of Sociology 105(2): 321-365. Btake,J. 1989 Famity Size and Achievement Califomia: University of Califomia Press. Comber, L. C. and Keeves, J. P. 1973 Science Education in Nineteen Countries: Intemational Studies in Evatuation I.: Intemationat Association for the Evatuation of Educationat Achievement. Downey, D. B. 1995a "Understanding Academic Achievement among Children in Stephousehotds: The Role of Parental Resources, Sex of Stepparent, and Sex of Chitd." Sociat Forces 73(3): 875-894. 1995b "When bigger is not better: Family size, parental resources, and children's, educational performance." American Sociotogicat Review 60: 747-761.
- 152. 2001 "Number of Siblings and Intettectuat Development: The Resource Dilution Explanation." American Psychologist 56(6-7): 497-504. Finn, J. D. and Owings, M. F. 1994 "Famity Structure and School Performance in Eighth Grade." Joumat of Research and Devetopment in Education 27(3): 176-187. Ganzeboom, H. B. and Treiman, D. J. 1996 "Internationally Comparable Measures of Occupationat Status for the 1988 Intemationat Standard Classifications of Occupations." Sociat Science Research 25:201-239. Jeynes, W. 2002 Divorce, Famity Structure, and the Academic Success of Children New York: the Haworth Press: The Haworth Press. Jeynes, W.H. 1999 "Effects of remarriage fottowing divorce on the academic achievement of chitdren." Joumat of Youth &Adotescence 28(3): 385-393. Family size. Family type and Student Achievement 23 Le, A. T. and Mitler, R 2001 'Educational Attainment In Australia: A Cohort Analysis.'
- 153. Longitudinal Surveys of Australian Youth Research Reports no. 25, Melbourne: Austratian Council for Educationat Research Mare, R. D. and Chen, M. D. 1986 "Further Evidence on Sibstiip Size and Educational Stratification." American Sociological Review 51(3): 403-412. OECD 1999 Classifying Educational Programmes. Manual for ISCED- 97 Implementation in OECD Countries. Paris: Organisation for Economic Co-operation and Development. 2001 Knowledge and Skills for Life. First Results from the OECD Programme for Intemational Student Assessment. Paris: Organisation for Economic Co- operation and Development. 2002a PISA 2000 Technical Report. Paris: Organisation for Economic Co-operation and Development. 2002b Reading for Change. Performance and Engagement across Countries. Results from PISA 2000 Paris: Organisation for Economic Co-operation and Development. Pong, S.-L. 1997 "Family Structure, Schoot Context, and Eight Grade Math and Reading Achievement."
- 154. Journal of Marriage and the Family 59(3): 734-746. Pong, S.-l. 1998 "The school compositional effect of single-parenthood on tOth-grade achievement." Sociotogy of Education 71 (Jan): 23-42. Pong, S.-L., Dronkers, J. and Hampden-Thompson, G. 2003 "Famity Policies and Children's School Achievement in Single- versus Two-Parent Families." Journal of Marriage and Family 65(3): 681 -699. Post, D. and Pong, S.-l. 1998 "The Waning Effect of Sibship Composition on Schoot Attainment in Hong Kong." Comparative Education Review 42(2): 99-117. Powell, M. A. and Parcel, T. L. 1999 Parental Work, Family Size and Social Capital Effects on Earty Adolescent Educational Outcomes: The United States and Britain Compared. Pp. 1-30 in T. L. Parcel (ed) Research in the Sociology of Work, Vol. 7. Riala, K., Isohanni, I., Jokelainen, J., Jones, P B. and Isohanni, M. 2003 "The relationship between childhood famity background and educational performance, with special reference to singte-parent families: A longitudinal study." Sociat Psychology of Education 6(4): 349-365.
- 155. Schilter, K., Khmelkov, V. T. and Wang, X.-Q. 2002 "Economic Development and Effects of Family Characteristics on Mathematics Achievement." Journal of Marriage and the Family 64(August): 730-742. Shavit, Y. and Pierce, J. L. 1991 "Sibship Size and Educational Attainment in Nuclear and Extended Families: Arabs and Jews in Israel." American Sociological Review 56(June): 321- 330. Thomson, E,, Hanson, T. L. and McLanahan, S. S. 1994 "Family Structure and Child Weil-Being: Economic Resources vs. Parent Socialization " Sociat Forces 73(1): 221-242. 24 Journal of Comparative Family Studies Thomdike, R. L. • o j i/ i m 1973 Reading Comprehension Education in Fifteen Countries. An Empmcat Study. Vol. Ill New York: John Witey & Sons.
- 156. HUDE 200 Fall 2015 Introduction to Research Guidelines for Article Analysis Assignment Directions: Read and write an analysis of an empirical article on your research topic. This article should be as close as possible to your research topic of interest. The article analysis should be NO MORE than 3 pages in length, typed double-spaced, 12-point font, with 1-inch margins. The purpose of the article analysis is to summarize the main points of the article and evaluate the quality of the report. Be sure to utilize a scientific research article – an article in a journal that reports the results of an original study, and has introduction, method, results and discussion sections. Consider the questions below in your analysis of each section of the article. The assignment is DUE: 10/2/15, 11:59PM, and should be submitted to Blackboard only, do not turn in a hard copy. Below are key points to address in your analysis of each section of the research article, but also include additional points of analysis that you deem appropriate. Reference Provide the complete citation for the article, in proper APA format. Introduction 1. Does the introduction provide a strong rationale for why the study is needed? 2. Are the research questions and hypotheses clearly articulated? What is the research question(s)? 3. Is the review of the literature clear, comprehensive,
- 157. organized, and relevant to the research questions and purpose of study? Method 1. Is the method described in enough detail that replication is possible without further information? 2. Subjects/Participants a.) Are subject/participant recruitment and selection methods described? b.) What sampling technique was used and is it appropriate in terms of the population to which the researcher wished to generalize? c.) Are characteristics of the sample described adequately? 3. Design a.) What type of research design was utilized in the study? (e.g., survey, quasi-experimental) b.) If appropriate, was a control group used? c.) If an experimental study, were subjects randomly assigned to groups? 4. Variables and Measures a.) What variables were measured in the study? b.) Do the measures match the research questions being addressed? Results 1. Does the results section contain a clear and logical summary of the findings (could you understand it?)? 2. Does the results section include the results of all (statistical) analyses? 3. Were tests of significance used and reported appropriately? 4. Do the authors report means and standard deviations (if
- 158. relevant) so that the reader can examine whether statistical significant differences are large enough to be meaningful? 5. For a qualitative study, is enough evidence provided? Do the authors present themes from the data? 6. Is the researcher sufficiently objective in reporting the results? Discussion 1. Does the discussion section offer interpretations for all of the important results? 2. Do the authors consider alternative explanations for the findings? 3. Do the authors discuss which hypotheses were supported? 4. Do the authors make appropriate generalizations about the findings? Do the authors include limitations of the study? Adapted from Cone & Foster (1993) Dissertations and theses from start to finish