Downloaded 108 times


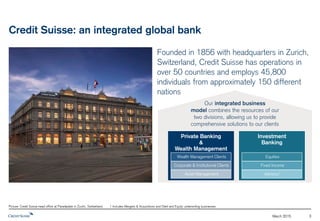

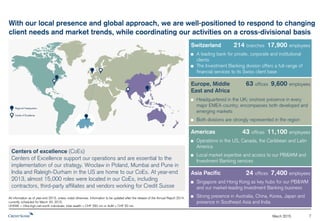


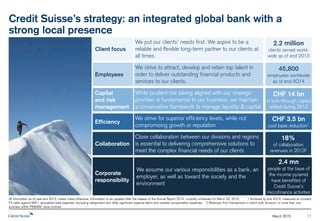


Credit Suisse is a global bank headquartered in Zurich, Switzerland that was founded in 1856. It has operations in over 50 countries and employs over 46,000 people. Credit Suisse combines the resources of its two divisions, Private Banking & Wealth Management and Investment Banking, to provide comprehensive financial solutions to its private, corporate, and institutional clients.


