Download to read offline
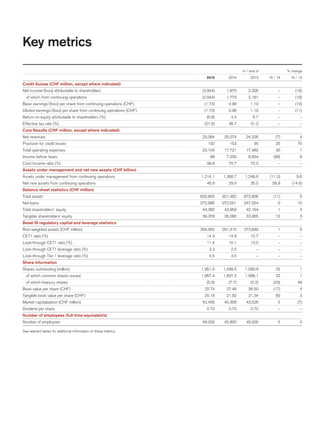

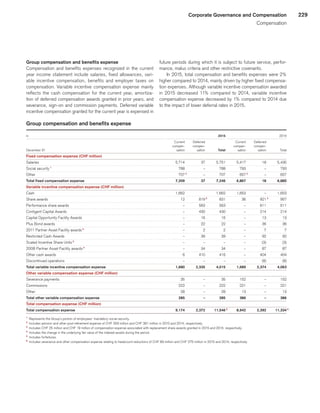
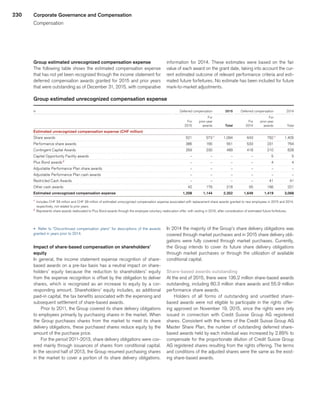
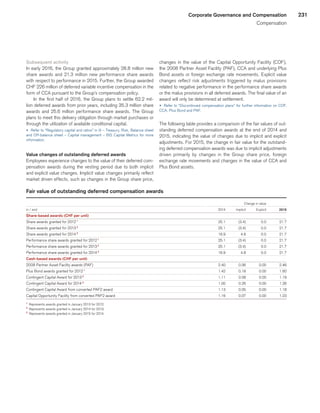
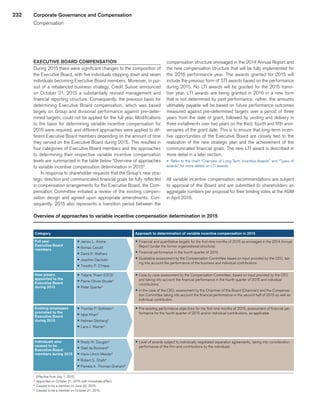
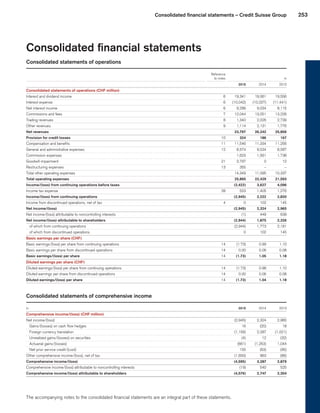


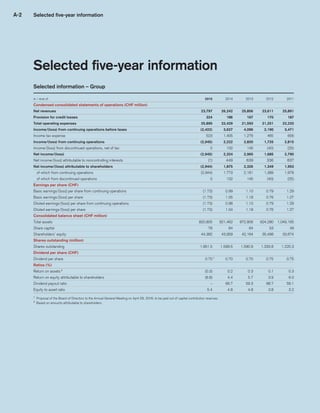


The 2015 annual report for Credit Suisse Group AG highlights a significant net loss of CHF 2.944 billion attributable to shareholders, with a notable decline in net revenues and a high cost-to-income ratio of 98.8%. The report outlines the company's strategic focus on improving its capital position, with an aim for a CET1 capital ratio between 11-12% by 2016 and further growth and restructuring efforts in wealth management and investment banking. Additionally, it emphasizes the bank's commitment to innovation, compliance, and risk management as part of its long-term strategy to deliver profitable growth.


