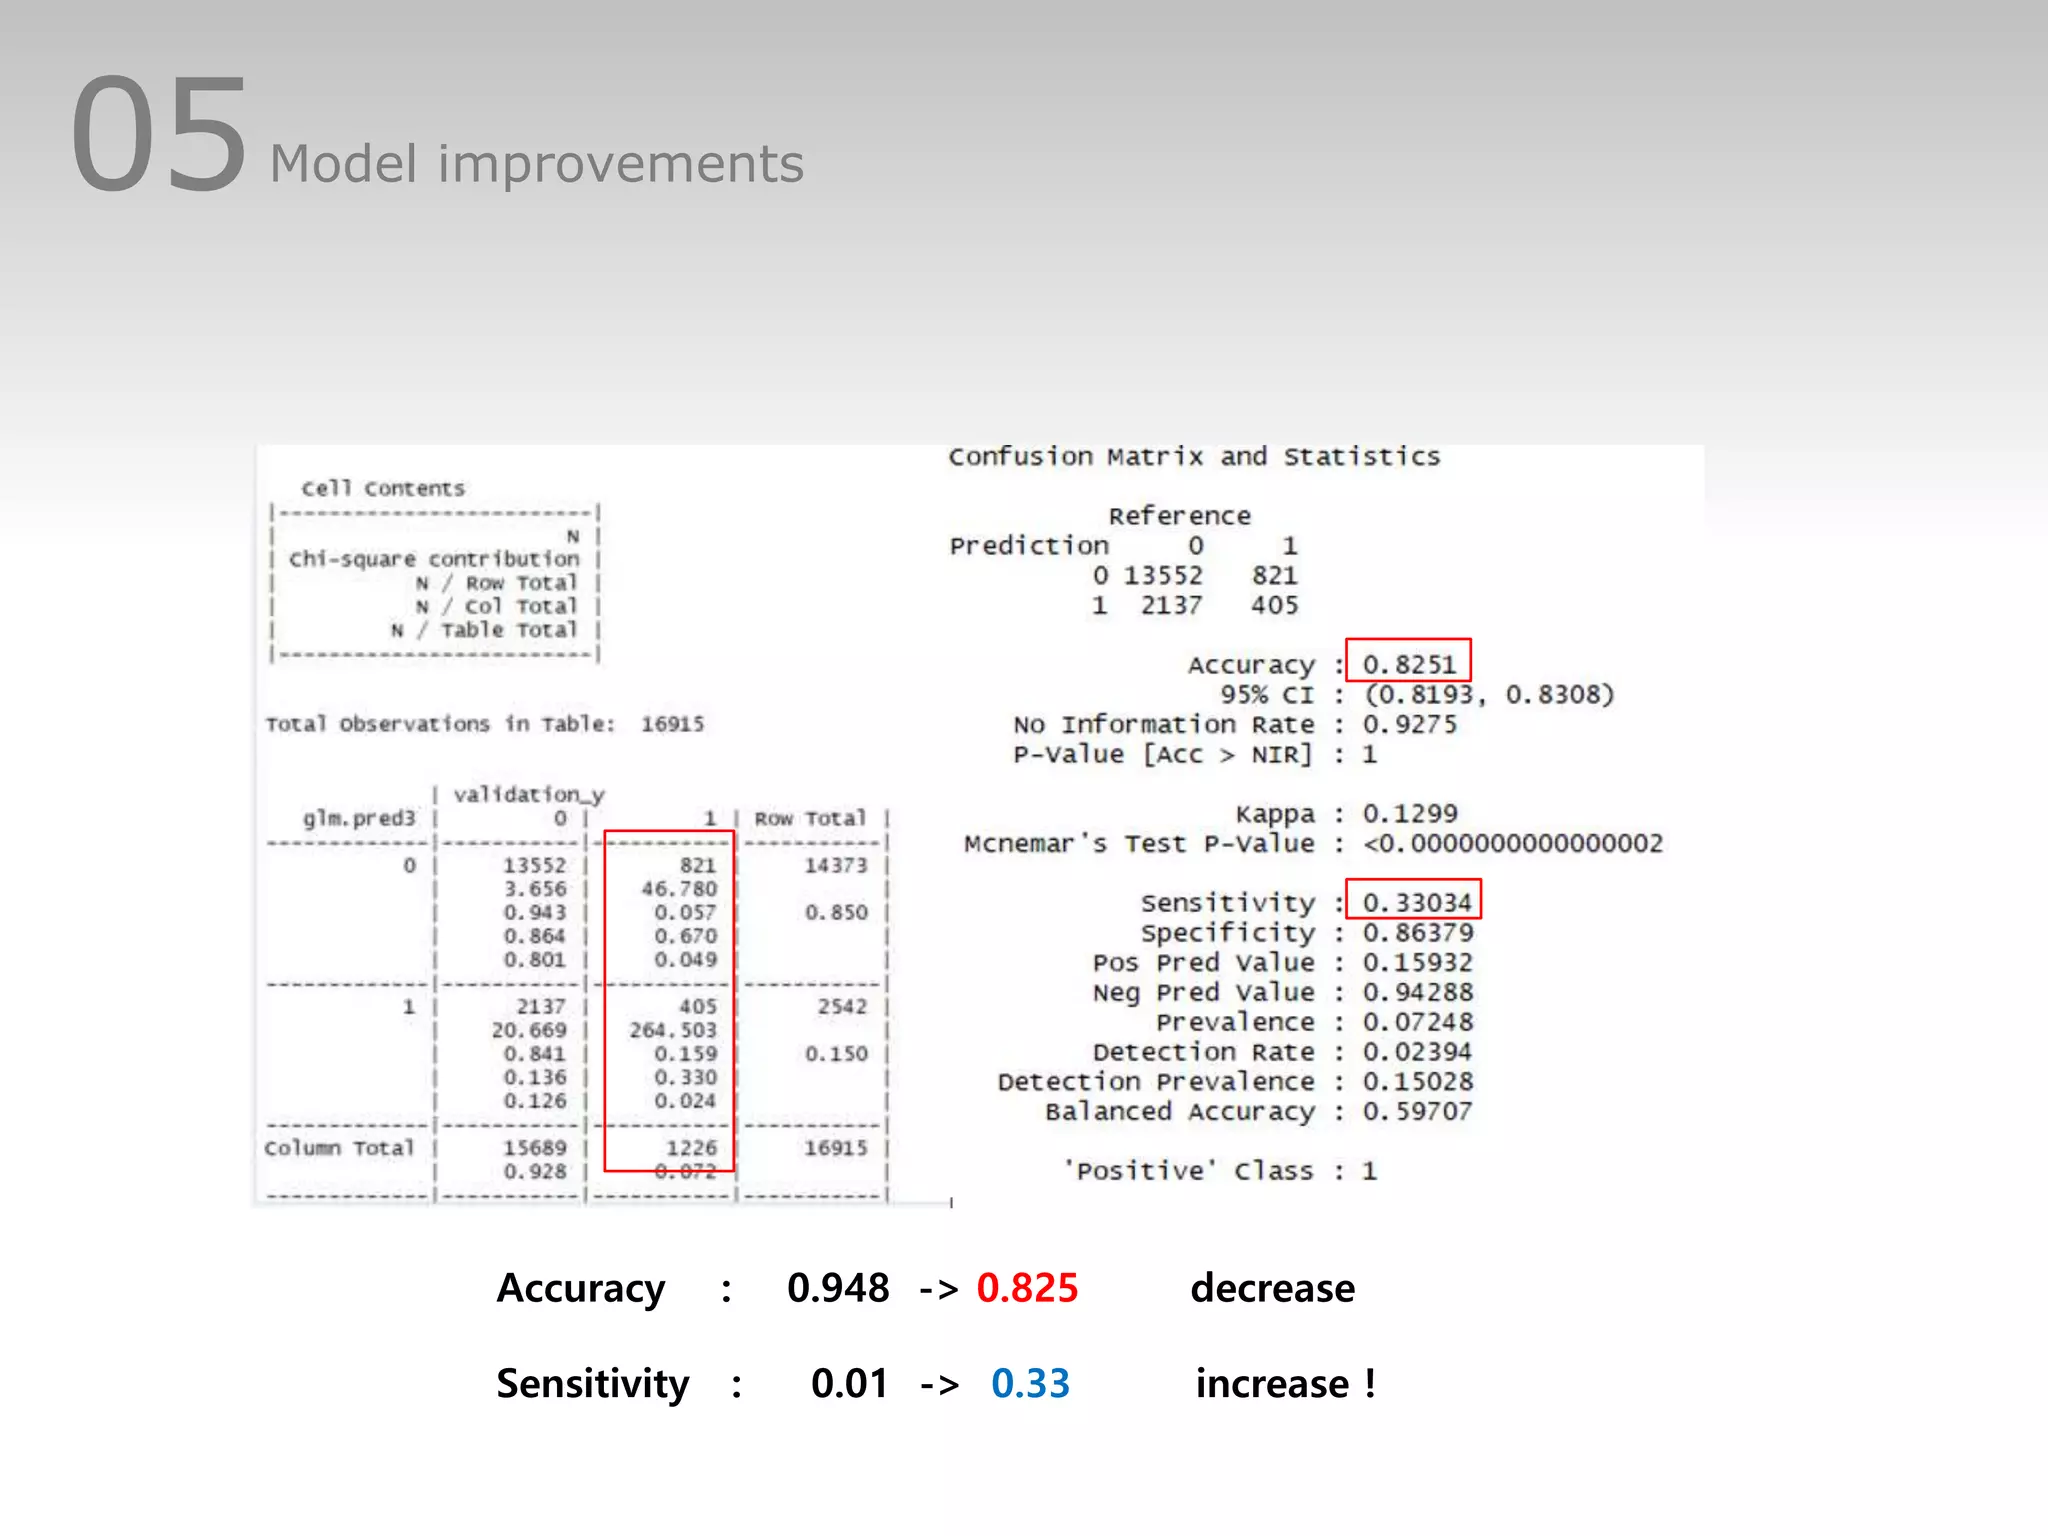
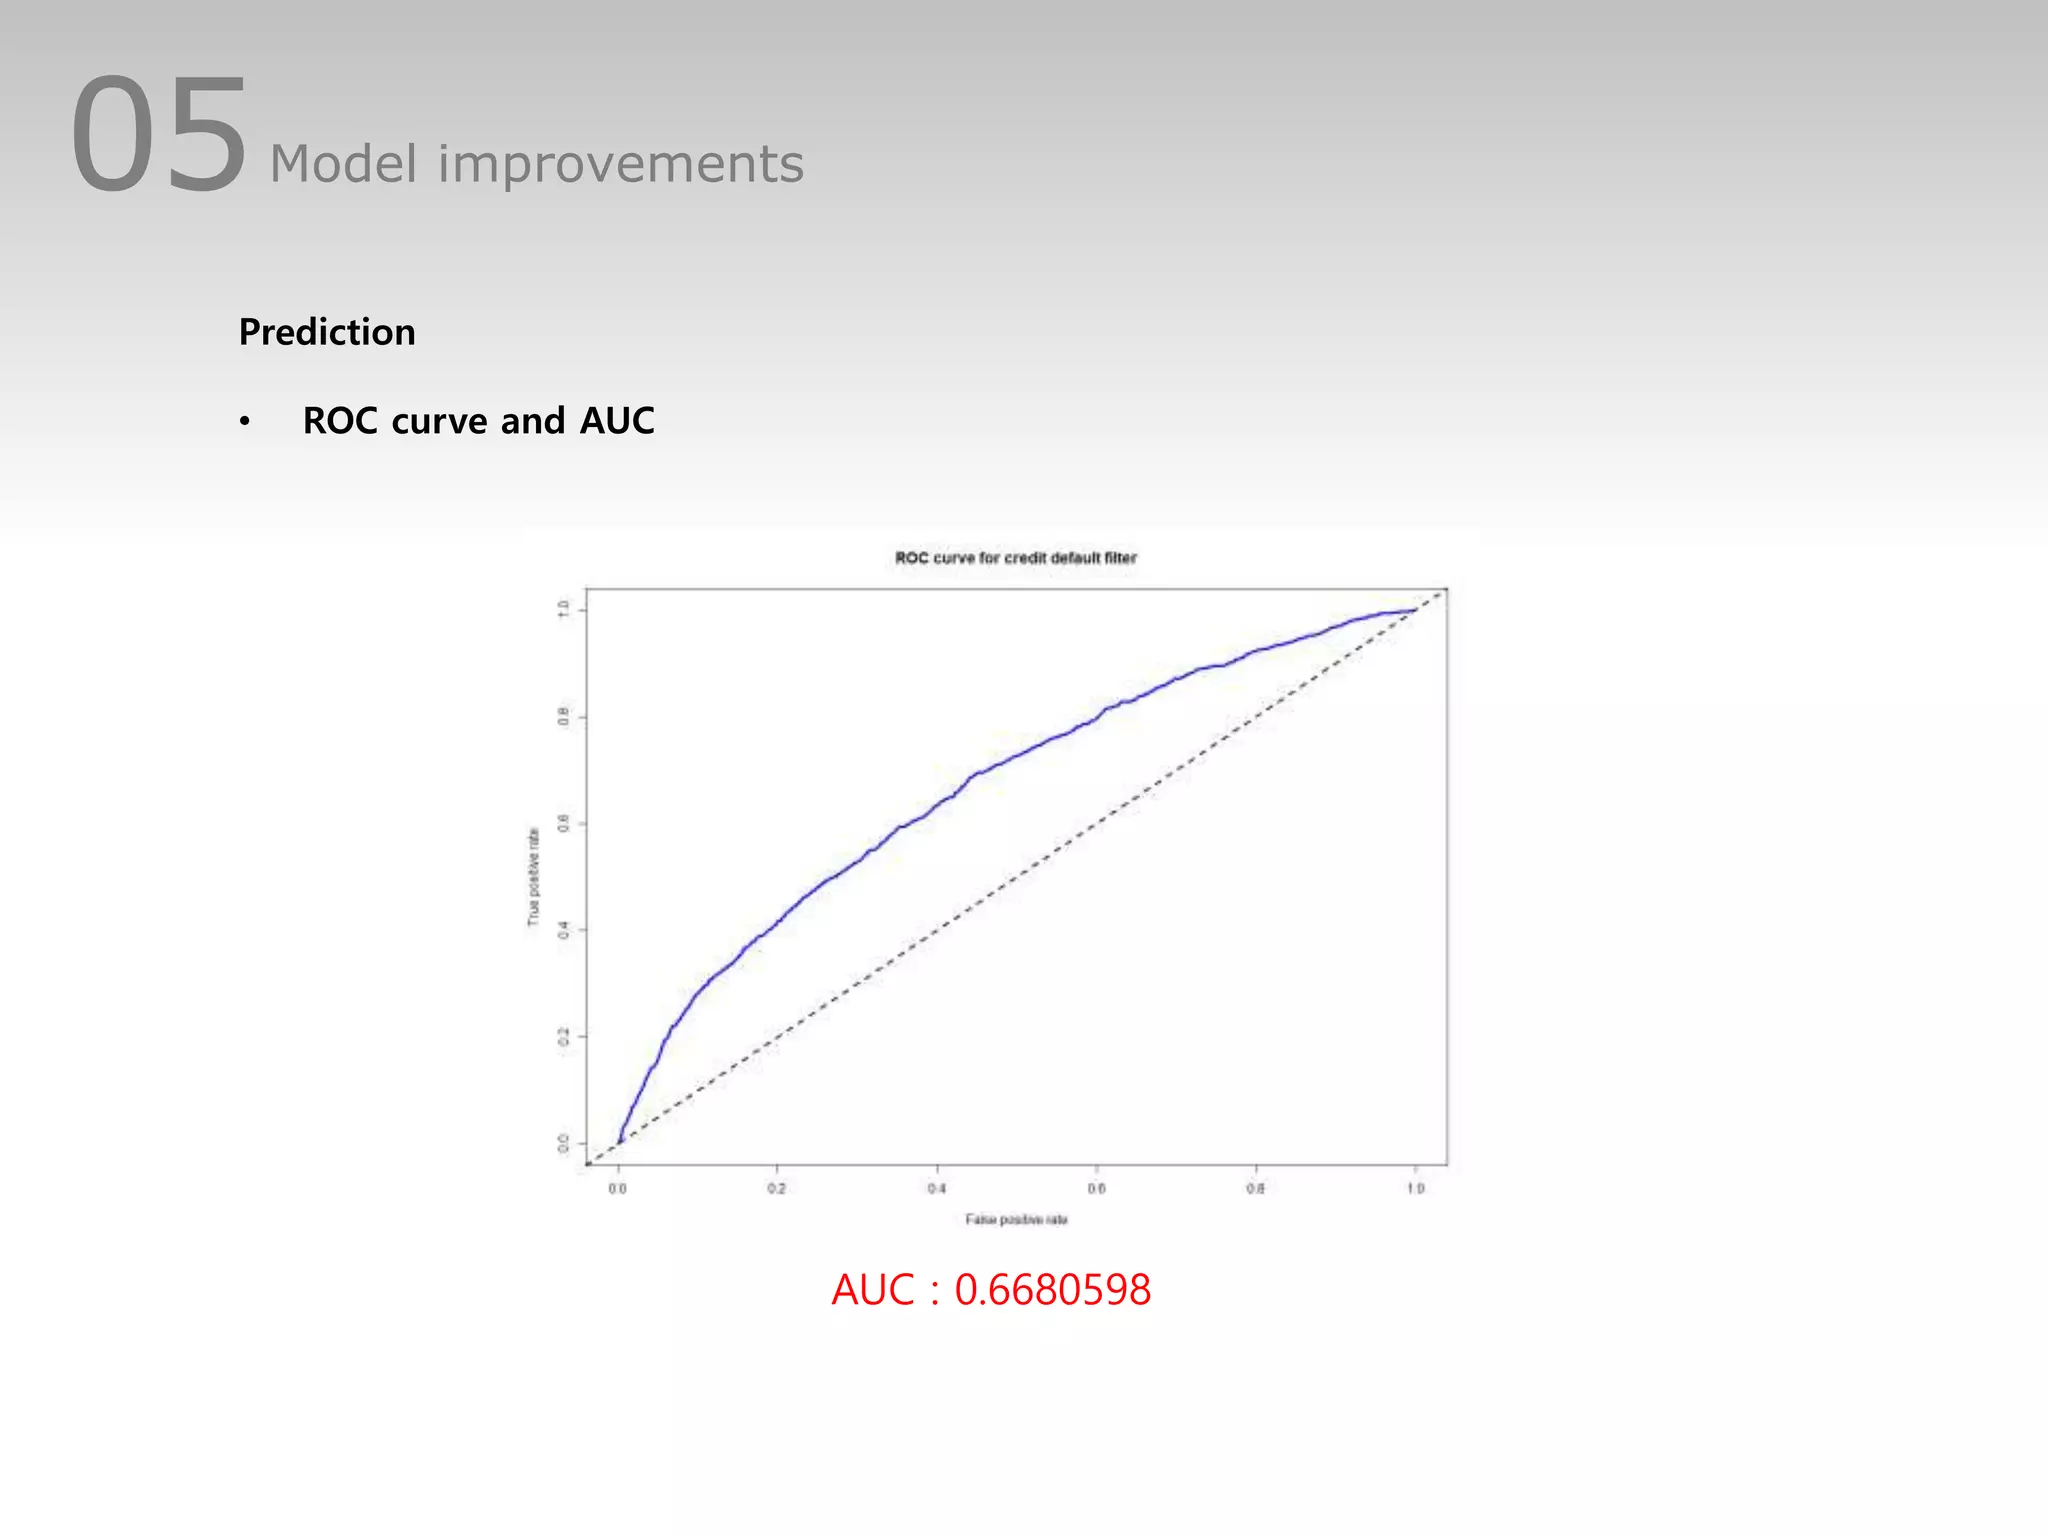
Home Credit Default Risk
Can you predict how capable
each applicant is of repaying
a loan?
Cha ho seong
CONTENTS
01 About Home Credit
02 Data
03 Data analysis
04 model evaluation
05 model improvements
06 conclusion
About Home Credit
01
01About Home Credit
Founded in 1997,
Home Credit Group is an international consumer finance provider with operations in 11 countries.
They focus on responsible lending primarily to people with little or no credit history.
Their services are simple, easy and fast.
Data
02
02 Dataset
• There are both categorical data, numeric data, and character data.
• There are many variables.
checklist
02 Label Data
Imbalanced class problem exist!
checklist
02 EDA - integer type
There are many columns with extreme value.
02 EDA - integer type
• HOUR_APPR_PROCESS_START and TARGET
• CNT_CHILDREN and TARGET
Not repaid rate at which Loans are
processed in the morning hours seems
to be high.
As CNT_CHILDREN increases, not repaid ratio tends to increase
02 EDA – character type
• FLAG_OWN_CAR and TARGET • FLAG_OWN_REALTY and TARGET
Ownership of a car seems to have more impact on the repayment rate than property ownership.
• NAME_INCOME_TYPE and TARGET
- maternity leave
- Unemployed
• Economic variables
02
• CODE_GENDER and TARGET
• Demographic Variables
• NAME_FAMILY_STATUS and TARGET
• NAME_TYPE_SUITE and TARGET
EDA – character type
02 ED
• EMERGENCYSTATE_MODE and TARGET
EDA – character type
• Social status variable
• etc
• NAME_EDUCATION_TYPE and TARGET
• NAME_CONTRACT_TYPE and TARGET
On Cash loans , repaid rate is much higher
• OCCUPATION_TYPE and TARGET
02 EDEDA – numeric type
• Correlation between variables
Some variables have high correlation
02NULL Values
> mean(is.na(application)) [1] 0.2454355
Columns with null values greater than 50%
Too many null values
we assume that variables with
Large number of null values are
hard to present data
Decided to exclude those variables
Data analysis
03
03 Data analysis
Logistic binary regression
Which model would be appropriate for credit default prediction ?
03 Data analysis
Why Logistic binary regression ?
• few constraints on explanatory variables
• Classification problem
03Data analysis
1. Split data into Train, validation, test
(60%) (20%) (20%)
2. Model selection
Model 1. all variables used
03Data analysis
Multiple collinearity is suspected
Model evaluation
04
03 Data analysis
Prediction
• Confusion matrix
Accuracy : 0.9248
High-accuracy estimated!
But,
Since there is a class imbalance problem,
it is necessary to confirm measurement criteria
other than accuracy.
03 Data analysis
Prediction
• Confusion matrix
sensitivity : 0.0101801
“Sensitivity” measures positive sample rate
accurately classified
True Positive
Positive
13
1277
=
03 Data analysis
AUC : 0.6956109
Prediction
• ROC curve and AUC
Model
improvements
05
05Model improvements
Task1. imbalanced class problem
Task2. Multiple collinearity
Model 2
05Model improvements
Task1. Imbalanced class problem
Try “SMOTE” Which is another sampling method .
It considers sample’s k nearest neighbors (in feature
space) and create a synthetic data point
> table(train$TARGET)
0 1
12521 950
 new_train <- SMOTE(TARGET ~ ., train, perc.over = 600, perc.under = 140)
> table(new_train$TARGET)
0 1
7979 6650
05Model improvements
Task2. Multiple collinearity
AMT_GOODS_PRICE , AMT_CREDIT : 0.9868
AMT_ANNUITY , AMT_GOODS_PRICE :0.7643
YEARS_BEGINEXPLUATATION_AVG, YEARS_BEGINEXPLUATATION_MODE : 0.9482
YEARS_BEGINEXPLUATATION_AVG,, YEARS_BEGINEXPLUATATION_MEDI : 0.9844
FLOORSMAX_MODE, FLOORSMAX_AVG : 0.9858
FLOORSMAX_MEDI, FLOORSMAX_AVG : 0.9971
YEARS_BEGINEXPLUATATION_MEDI, YEARS_BEGINEXPLUATATION_MODE : 0.9242
FLOORSMAX_MODE, FLOORSMAX_MEDI : 0.9883
FLOORSMAX_MODE, TOTALAREA_MODE : 0.6232
OBS_60_CNT_SOCIAL_CIRCLE, OBS_30_CNT_SOCIAL_CIRCLE : 0.9987
DEF_60_CNT_SOCIAL_CIRCLE , DEF_30_CNT_SOCIAL_CIRCLE : 0.8658
Excluding highly correlated independent variables
05Model improvements
binary logistic regression seeks directly to minimize the sum of squared deviance residuals.
It is the deviance residuals which are implied in the ML algorithm of the regression.
As you will see from the back, that fact is a factor of lowering accuracy.
05Model improvements
Accuracy : 0.948 -> 0.825 decrease
Sensitivity : 0.01 -> 0.33 increase !
05Model improvements
AUC : 0.6680598
Prediction
• ROC curve and AUC
Conclusion
06
06Conclusion
Task1. imbalanced class problem
-> SMOTE
Task2. Multiple collinearity
-> Exclude variables with high Correlation
Accuracy decreased
Sensitivity increased
AUC decreased
That's why sensitivity matters.
Despite the decrease in other criteria
Clearly there is no absolute criterion.
Especially , sensitivity is often used when the cost of prediction is high.
06Conclusion
Further study…
- In order to improve accuracy,
applying Other prediction model ( Decision tree, ANN , SVM)
- handling NA values without excluding
Thank you

Credit default risk

  • 1.
    Home Credit DefaultRisk Can you predict how capable each applicant is of repaying a loan? Cha ho seong
  • 2.
    CONTENTS 01 About HomeCredit 02 Data 03 Data analysis 04 model evaluation 05 model improvements 06 conclusion
  • 3.
  • 4.
    01About Home Credit Foundedin 1997, Home Credit Group is an international consumer finance provider with operations in 11 countries. They focus on responsible lending primarily to people with little or no credit history. Their services are simple, easy and fast.
  • 5.
  • 6.
    02 Dataset • Thereare both categorical data, numeric data, and character data. • There are many variables. checklist
  • 7.
    02 Label Data Imbalancedclass problem exist! checklist
  • 8.
    02 EDA -integer type There are many columns with extreme value.
  • 9.
    02 EDA -integer type • HOUR_APPR_PROCESS_START and TARGET • CNT_CHILDREN and TARGET Not repaid rate at which Loans are processed in the morning hours seems to be high. As CNT_CHILDREN increases, not repaid ratio tends to increase
  • 10.
    02 EDA –character type • FLAG_OWN_CAR and TARGET • FLAG_OWN_REALTY and TARGET Ownership of a car seems to have more impact on the repayment rate than property ownership. • NAME_INCOME_TYPE and TARGET - maternity leave - Unemployed • Economic variables
  • 11.
    02 • CODE_GENDER andTARGET • Demographic Variables • NAME_FAMILY_STATUS and TARGET • NAME_TYPE_SUITE and TARGET EDA – character type
  • 12.
    02 ED • EMERGENCYSTATE_MODEand TARGET EDA – character type • Social status variable • etc • NAME_EDUCATION_TYPE and TARGET • NAME_CONTRACT_TYPE and TARGET On Cash loans , repaid rate is much higher • OCCUPATION_TYPE and TARGET
  • 13.
    02 EDEDA –numeric type • Correlation between variables Some variables have high correlation
  • 14.
    02NULL Values > mean(is.na(application))[1] 0.2454355 Columns with null values greater than 50% Too many null values we assume that variables with Large number of null values are hard to present data Decided to exclude those variables
  • 15.
  • 16.
    03 Data analysis Logisticbinary regression Which model would be appropriate for credit default prediction ?
  • 17.
    03 Data analysis WhyLogistic binary regression ? • few constraints on explanatory variables • Classification problem
  • 18.
    03Data analysis 1. Splitdata into Train, validation, test (60%) (20%) (20%) 2. Model selection Model 1. all variables used
  • 19.
  • 20.
  • 21.
    03 Data analysis Prediction •Confusion matrix Accuracy : 0.9248 High-accuracy estimated! But, Since there is a class imbalance problem, it is necessary to confirm measurement criteria other than accuracy.
  • 22.
    03 Data analysis Prediction •Confusion matrix sensitivity : 0.0101801 “Sensitivity” measures positive sample rate accurately classified True Positive Positive 13 1277 =
  • 23.
    03 Data analysis AUC: 0.6956109 Prediction • ROC curve and AUC
  • 24.
  • 25.
    05Model improvements Task1. imbalancedclass problem Task2. Multiple collinearity Model 2
  • 26.
    05Model improvements Task1. Imbalancedclass problem Try “SMOTE” Which is another sampling method . It considers sample’s k nearest neighbors (in feature space) and create a synthetic data point > table(train$TARGET) 0 1 12521 950  new_train <- SMOTE(TARGET ~ ., train, perc.over = 600, perc.under = 140) > table(new_train$TARGET) 0 1 7979 6650
  • 27.
    05Model improvements Task2. Multiplecollinearity AMT_GOODS_PRICE , AMT_CREDIT : 0.9868 AMT_ANNUITY , AMT_GOODS_PRICE :0.7643 YEARS_BEGINEXPLUATATION_AVG, YEARS_BEGINEXPLUATATION_MODE : 0.9482 YEARS_BEGINEXPLUATATION_AVG,, YEARS_BEGINEXPLUATATION_MEDI : 0.9844 FLOORSMAX_MODE, FLOORSMAX_AVG : 0.9858 FLOORSMAX_MEDI, FLOORSMAX_AVG : 0.9971 YEARS_BEGINEXPLUATATION_MEDI, YEARS_BEGINEXPLUATATION_MODE : 0.9242 FLOORSMAX_MODE, FLOORSMAX_MEDI : 0.9883 FLOORSMAX_MODE, TOTALAREA_MODE : 0.6232 OBS_60_CNT_SOCIAL_CIRCLE, OBS_30_CNT_SOCIAL_CIRCLE : 0.9987 DEF_60_CNT_SOCIAL_CIRCLE , DEF_30_CNT_SOCIAL_CIRCLE : 0.8658 Excluding highly correlated independent variables
  • 28.
    05Model improvements binary logisticregression seeks directly to minimize the sum of squared deviance residuals. It is the deviance residuals which are implied in the ML algorithm of the regression. As you will see from the back, that fact is a factor of lowering accuracy.
  • 29.
    05Model improvements Accuracy :0.948 -> 0.825 decrease Sensitivity : 0.01 -> 0.33 increase !
  • 30.
    05Model improvements AUC :0.6680598 Prediction • ROC curve and AUC
  • 31.
  • 32.
    06Conclusion Task1. imbalanced classproblem -> SMOTE Task2. Multiple collinearity -> Exclude variables with high Correlation Accuracy decreased Sensitivity increased AUC decreased That's why sensitivity matters. Despite the decrease in other criteria Clearly there is no absolute criterion. Especially , sensitivity is often used when the cost of prediction is high.
  • 33.
    06Conclusion Further study… - Inorder to improve accuracy, applying Other prediction model ( Decision tree, ANN , SVM) - handling NA values without excluding
  • 34.