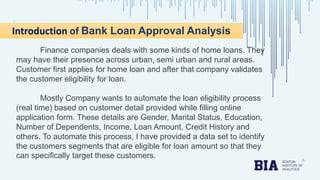
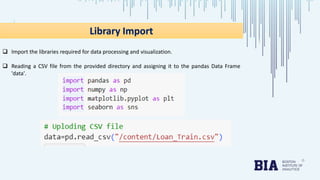
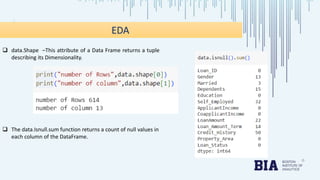
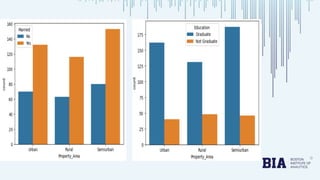
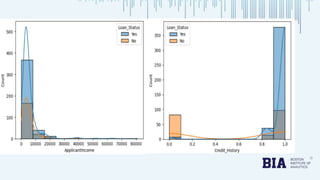
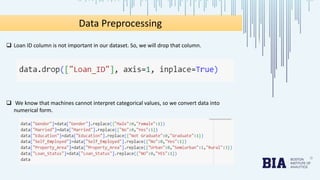
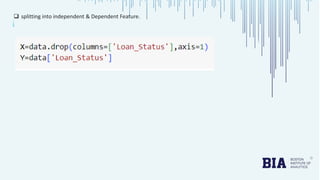
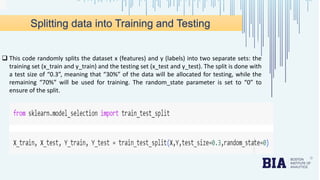
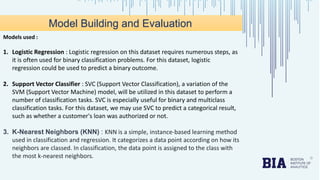
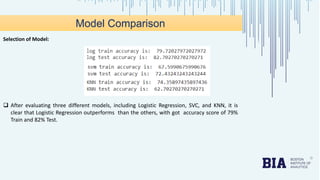
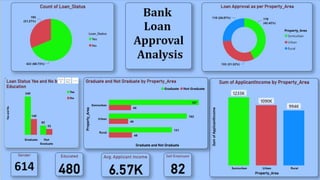
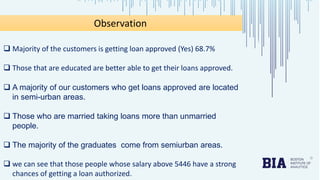
Project Title :- Bank Loan Approval Analysis
Present by :- Shiva G Waghe
Project Contents
1. Introduction
2. Library Import
3. Loading Data
4. Data Exploration (EDA)
5. Data Cleaning
6. Data Visualization
7. Data Preprocessing
8. Train and Test Split
9. Model Building and Evaluation
10.Model Comparison
11.Power BI Dashboard
12.Observation
Introduction of Bank Loan Approval Analysis
Finance companies deals with some kinds of home loans. They
may have their presence across urban, semi urban and rural areas.
Customer first applies for home loan and after that company validates
the customer eligibility for loan.
Mostly Company wants to automate the loan eligibility process
(real time) based on customer detail provided while filling online
application form. These details are Gender, Marital Status, Education,
Number of Dependents, Income, Loan Amount, Credit History and
others. To automate this process, I have provided a data set to identify
the customers segments that are eligible for loan amount so that they
can specifically target these customers.
Library Import
 Import the libraries required for data processing and visualization.
 Reading a CSV file from the provided directory and assigning it to the pandas Data Frame
'data'.
 data.Shape –This attribute of a Data Frame returns a tuple
describing its Dimensionality.
 The data.Isnull.sum function returns a count of null values in
each column of the DataFrame.
EDA
 Head Function displays the first five rows of a Data Frame, providing a quick overview of its
structure and content.
 Tail function shows the last few rows of a Data Frame.
 The data.duplicate.sum method displays the total of duplicate values in the data set. There
are no duplicate values in this dataset..
 The unique() function returns a Series object that shows the unique values for each
column
Data Cleaning
 For better understanding, we convert Y=Yes and N=No in the
Loan Status Column using Replace function.
Filling Null value using fillna function.
Data Visualization
Data Preprocessing
 Loan ID column is not important in our dataset. So, we will drop that column.
 We know that machines cannot interpret categorical values, so we convert data into
numerical form.
 splitting into independent & Dependent Feature.
 This code randomly splits the dataset x (features) and y (labels) into two separate sets: the
training set (x_train and y_train) and the testing set (x_test and y_test). The split is done with
a test size of “0.3”, meaning that “30%” of the data will be allocated for testing, while the
remaining “70%” will be used for training. The random_state parameter is set to “0” to
ensure of the split.
Splitting data into Training and Testing
Models used :
1. Logistic Regression : Logistic regression on this dataset requires numerous steps, as
it is often used for binary classification problems. For this dataset, logistic
regression could be used to predict a binary outcome.
2. Support Vector Classifier : SVC (Support Vector Classification), a variation of the
SVM (Support Vector Machine) model, will be utilized in this dataset to perform a
number of classification tasks. SVC is especially useful for binary and multiclass
classification tasks. For this dataset, we may use SVC to predict a categorical result,
such as whether a customer's loan was authorized or not.
3. K-Nearest Neighbors (KNN) : KNN is a simple, instance-based learning method
used in classification and regression. It categorizes a data point according on how its
neighbors are classed. In classification, the data point is assigned to the class with
the most k-nearest neighbors.
Model Building and Evaluation
Model Comparison
Selection of Model:
 After evaluating three different models, including Logistic Regression, SVC, and KNN, it is
clear that Logistic Regression outperforms than the others, with got accuracy score of 79%
Train and 82% Test.
Observation
 Majority of the customers is getting loan approved (Yes) 68.7%
 Those that are educated are better able to get their loans approved.
 A majority of our customers who get loans approved are located
in semi-urban areas.
 Those who are married taking loans more than unmarried
people.
 The majority of the graduates come from semiurban areas.
 we can see that those people whose salary above 5446 have a strong
chances of getting a loan authorized.
THANK YOU !

Bank Loan Approval Analysis: A Comprehensive Data Analysis Project

  • 2.
    Project Title :-Bank Loan Approval Analysis Present by :- Shiva G Waghe
  • 3.
    Project Contents 1. Introduction 2.Library Import 3. Loading Data 4. Data Exploration (EDA) 5. Data Cleaning 6. Data Visualization 7. Data Preprocessing 8. Train and Test Split 9. Model Building and Evaluation 10.Model Comparison 11.Power BI Dashboard 12.Observation
  • 4.
    Introduction of BankLoan Approval Analysis Finance companies deals with some kinds of home loans. They may have their presence across urban, semi urban and rural areas. Customer first applies for home loan and after that company validates the customer eligibility for loan. Mostly Company wants to automate the loan eligibility process (real time) based on customer detail provided while filling online application form. These details are Gender, Marital Status, Education, Number of Dependents, Income, Loan Amount, Credit History and others. To automate this process, I have provided a data set to identify the customers segments that are eligible for loan amount so that they can specifically target these customers.
  • 5.
    Library Import  Importthe libraries required for data processing and visualization.  Reading a CSV file from the provided directory and assigning it to the pandas Data Frame 'data'.
  • 6.
     data.Shape –Thisattribute of a Data Frame returns a tuple describing its Dimensionality.  The data.Isnull.sum function returns a count of null values in each column of the DataFrame. EDA
  • 7.
     Head Functiondisplays the first five rows of a Data Frame, providing a quick overview of its structure and content.  Tail function shows the last few rows of a Data Frame.
  • 8.
     The data.duplicate.summethod displays the total of duplicate values in the data set. There are no duplicate values in this dataset..  The unique() function returns a Series object that shows the unique values for each column
  • 9.
    Data Cleaning  Forbetter understanding, we convert Y=Yes and N=No in the Loan Status Column using Replace function. Filling Null value using fillna function.
  • 10.
  • 14.
    Data Preprocessing  LoanID column is not important in our dataset. So, we will drop that column.  We know that machines cannot interpret categorical values, so we convert data into numerical form.
  • 15.
     splitting intoindependent & Dependent Feature.
  • 16.
     This coderandomly splits the dataset x (features) and y (labels) into two separate sets: the training set (x_train and y_train) and the testing set (x_test and y_test). The split is done with a test size of “0.3”, meaning that “30%” of the data will be allocated for testing, while the remaining “70%” will be used for training. The random_state parameter is set to “0” to ensure of the split. Splitting data into Training and Testing
  • 17.
    Models used : 1.Logistic Regression : Logistic regression on this dataset requires numerous steps, as it is often used for binary classification problems. For this dataset, logistic regression could be used to predict a binary outcome. 2. Support Vector Classifier : SVC (Support Vector Classification), a variation of the SVM (Support Vector Machine) model, will be utilized in this dataset to perform a number of classification tasks. SVC is especially useful for binary and multiclass classification tasks. For this dataset, we may use SVC to predict a categorical result, such as whether a customer's loan was authorized or not. 3. K-Nearest Neighbors (KNN) : KNN is a simple, instance-based learning method used in classification and regression. It categorizes a data point according on how its neighbors are classed. In classification, the data point is assigned to the class with the most k-nearest neighbors. Model Building and Evaluation
  • 18.
    Model Comparison Selection ofModel:  After evaluating three different models, including Logistic Regression, SVC, and KNN, it is clear that Logistic Regression outperforms than the others, with got accuracy score of 79% Train and 82% Test.
  • 20.
    Observation  Majority ofthe customers is getting loan approved (Yes) 68.7%  Those that are educated are better able to get their loans approved.  A majority of our customers who get loans approved are located in semi-urban areas.  Those who are married taking loans more than unmarried people.  The majority of the graduates come from semiurban areas.  we can see that those people whose salary above 5446 have a strong chances of getting a loan authorized.
  • 21.