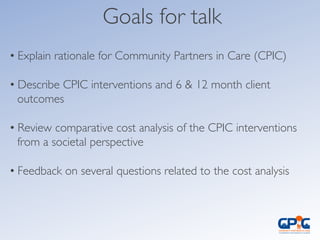
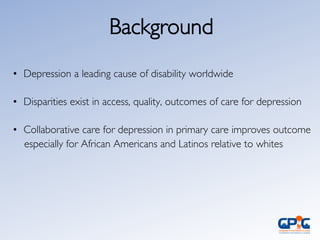
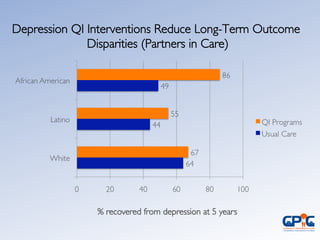
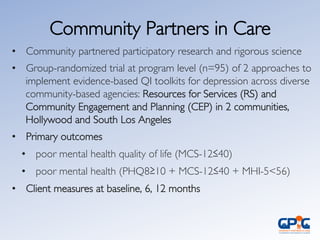
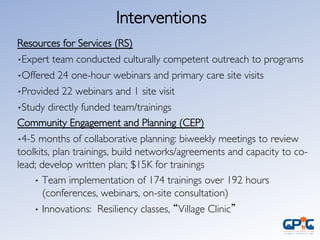
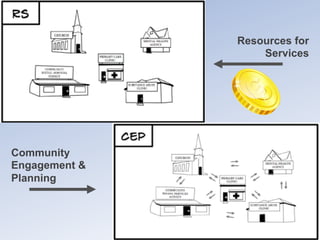
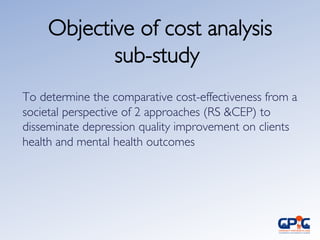
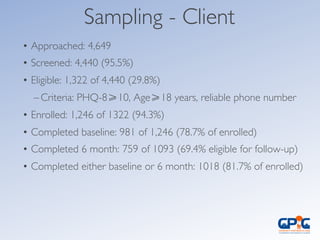
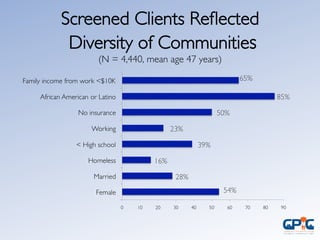
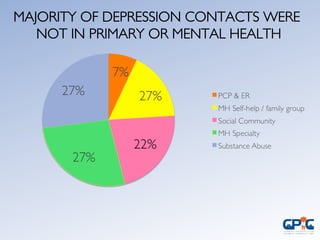
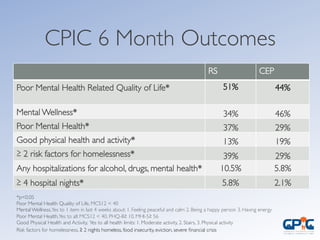
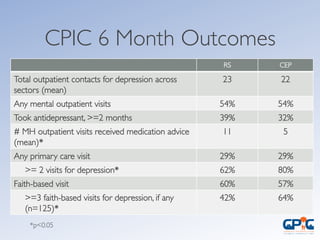
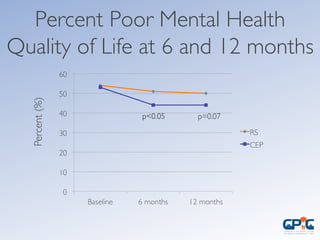
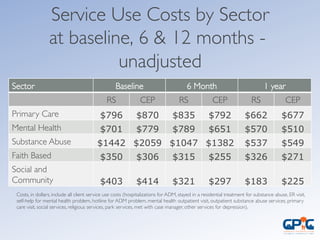
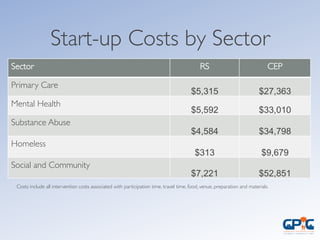
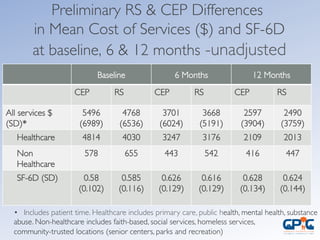
Bowen Chung MD, Adjunct Staff, RAND, 	

Assistant Professor, Geffen School of Medicine, UCLA	


Michael Ong, MD, PhD 	

Associate Professor, Geffen School of Medicine, UCLA	


Kenneth Wells, MD, MPH	

Senior Scientist, RAND	

Weill Professor of Psychiatry, David Geffen School of Medicine at UCLA	


January 23, 2013	


Comparative Cost Analysis of
Depression Care Interventions in
Community Partners in Care
Presenter Disclosures	

No financial conflicts of interest to report
Acknowledgements	

• RAND: Paul Koegel, Cathy Sherbourne	

• UCLA: Michael McCreary, Esmeralda Pulido, Lingqi Tang, Lily Zhang,
Susan Ettner	

• Healthy African American Families: Loretta Jones, Felica Jones	

• QueensCare Health and Faith Partnership: Elizabeth Dixon	

• Behavioral Health Services: James Gilmore	

• Funders: National Institute of Mental Health, California Community
Foundation, Robert Wood Johnson Foundation, UCLA Clinical and
Translational Science Institute
Goals for talk	


• Explain rationale for Community Partners in Care (CPIC)	


• Describe CPIC interventions and 6 & 12 month client
outcomes	

• Review comparative cost analysis of the CPIC interventions
from a societal perspective	

• Feedback on several questions related to the cost analysis
Background	

•  Depression a leading cause of disability worldwide	


•  Disparities exist in access, quality, outcomes of care for depression	


•  Collaborative care for depression in primary care improves outcome 	

especially for African Americans and Latinos relative to whites
% recovered from depression at 5 years	

Depression QI Interventions Reduce Long-Term Outcome
Disparities (Partners in Care)
Community Context	

•  Under-resourced communities have limited provider availability
and limited implementation of Quality Improvement (QI)
programs for depression.	

•  Multiple services sectors support safety-net populations, but have
little or no formal role in depression care or QI.	

•  Healthcare reform prioritizes medical homes, accountable care
organizations and patient-centered care but the role of
community agencies as partners is unclear.
Community Partners in Care 	

•  Community partnered participatory research and rigorous science	

•  Group-randomized trial at program level (n=95) of 2 approaches to
implement evidence-based QI toolkits for depression across diverse
community-based agencies: Resources for Services (RS) and
Community Engagement and Planning (CEP) in 2 communities,
Hollywood and South Los Angeles	

•  Primary outcomes	

•  poor mental health quality of life (MCS-12≤40)	

•  poor mental health (PHQ8≥10 + MCS-12≤40 + MHI-556)	

•  Client measures at baseline, 6, 12 months
Interventions	


Resources for Services (RS)	

• Expert team conducted culturally competent outreach to programs	

• Offered 24 one-hour webinars and primary care site visits	

• Provided 22 webinars and 1 site visit	

• Study directly funded team/trainings	

Community Engagement and Planning (CEP)	

• 4-5 months of collaborative planning: biweekly meetings to review
toolkits, plan trainings, build networks/agreements and capacity to co-
lead; develop written plan; $15K for trainings	

•  Team implementation of 174 trainings over 192 hours
(conferences, webinars, on-site consultation)	

•  Innovations: Resiliency classes, “Village Clinic”
Resources for
Services
Community
Engagement 
Planning
Objective of cost analysis
sub-study	

To determine the comparative cost-effectiveness from a
societal perspective of 2 approaches (RS CEP) to
disseminate depression quality improvement on clients
health and mental health outcomes
Sampling - Client	

• Approached: 4,649 	

• Screened: 4,440 (95.5%) 	

• Eligible: 1,322 of 4,440 (29.8%) 	

– Criteria: PHQ-8≥10, Age≥18 years, reliable phone number	

• Enrolled: 1,246 of 1322 (94.3%)	

• Completed baseline: 981 of 1,246 (78.7% of enrolled) 	

• Completed 6 month: 759 of 1093 (69.4% eligible for follow-up)	

• Completed either baseline or 6 month: 1018 (81.7% of enrolled)
Screened Clients Reflected
Diversity of Communities
(N = 4,440, mean age 47 years)	

65%	

85%	

16%	

50%	

23%	

39%	

28%	

54%
MAJORITY OF DEPRESSION CONTACTS WERE
NOT IN PRIMARY OR MENTAL HEALTH
7%	

27%	

27%	

27%
Other data sources	

•  Provider and administrator survey data – baseline, 6, and 12 month	


•  Provider and administrator training data – baseline, 6, and 12 month	


•  Costs estimated from	

•  CMS: DRG codes and payments for inpatient stays	

•  Food,Venue, Materials, CEUs – project invoices	

•  Medications: WHO DDD Index, Micromedex, Redbook 	

•  AMA: CPT codes and payments for medical and mental health	

procedures	

•  National Bureau of Labor Statistics: wages for non-healthcare	

sector providers – participant time, travel time, preparation time	

•  Costs adjusted to 2010 using consumer price index
Key Assumptions	

•  BLS Wage classifications were an accurate reflection of the job title	

•  Minimum wage is a reasonable dollar amount to value client
opportunity costs	

•  Although we had individual at baseline, we didn’t 6 and 12 months, so
– we just used baseline – but 70 % unemployment – up 40% +
unemployements in south LA – we didn’t think this was a bad
assumption.	

•  Client, provider, administrator travel time: 1 hour roundtrip
Key Assumptions	

•  Cost estimates of venue for similar interventions based on per
person costs of similar events	

•  Intervention staff – 15 or 30 minute prep time for meetings	

•  Services use estimate	

•  Healthcare – output – moderate to severe complexity	

•  Mental Health – 30 min for a med visit, 45-50 minutes for
therapy, case management 45 minutes	

•  Social Services – case management 45 minutes	

•  Parks and recreation –Total annual budget / annual visitors	

•  Churches – 1 hour for a pastoral counseling visit	

•  Substance use – 45 -50 minutes for counseling
Analysis	

•  6 and 12 month outcomes	

•  Intent to treat, comparative effectiveness study	

•  Independent variable: intervention status	

•  Adjusted for baseline status of dependent variable and co-variates	

•  Weighted to eligible sample	

•  Imputation for missing data	

•  Adjustment for clustering of clients within programs for client data	

•  2-sided test with p.05 for statistical significance	

•  Costs – analytic samples participating at baseline, 6, and 12 months	

•  Not currently weighted for sampling or adjusted for clustering
RS	

 CEP	

Poor Mental Health Related Quality of Life*	

 51%	


44%	


Mental Wellness*	

 34%	

 46%	

Poor Mental Health*	

 37%	

 29%	

Good physical health and activity*	

 13%	

 19%	

≥ 2 risk factors for homelessness*	

 39%	

 29%	

Any hospitalizations for alcohol, drugs, mental health*	

 10.5%	

 5.8%	

≥ 4 hospital nights*	

 5.8%	

 2.1%	

*p0.05	

Poor Mental Health Quality of Life, MCS12  40	

Mental Wellness,Yes to 1 item in last 4 weeks about: 1. Feeling peaceful and calm 2. Being a happy person 3. Having energy	

Poor Mental Health,Yes to all: MCS12  40, PHQ-8≥ 10, MHI-5≥ 56	

Good Physical Health and Activity, Yes to all health limits: 1. Moderate activity, 2. Stairs, 3. Physical activity	

Risk factors for homelessness, ≥ 2 nights homeless, food insecurity, eviction, severe financial crisis	


CPIC 6 Month Outcomes
CPIC 6 Month Outcomes	

RS	

 CEP	

Total outpatient contacts for depression across
sectors (mean)	

23	

 22	

Any mental outpatient visits	

 54%	

 54%	

Took antidepressant, =2 months	

 39%	

 32%	

# MH outpatient visits received medication advice
(mean)*	

11	

 5	

Any primary care visit	

 29%	

 29%	

= 2 visits for depression*	

 62%	

 80%	

Faith-based visit	

 60%	

 57%	

=3 faith-based visits for depression, if any
(n=125)*	

42%	

 64%	

*p0.05
Percent Poor Mental Health
Quality of Life at 6 and 12 months	

Percent(%)	

p=0.07
Service Use Costs by Sector
at baseline, 6  12 months -
unadjusted	

Sector	

 Baseline	

 6 Month	

 1 year	

RS	

 CEP	

 RS	

 CEP	

 RS	

 CEP	

Primary Care	

 $796 $870 $835 $792 $662 $677
Mental Health	

 $701 $779 $789 $651 $570 $510
Substance Abuse	

 $1442 $2059 $1047 $1382 $537 $549
Faith Based	

 $350 $306 $315 $255 $326 $271
Social and
Community	

 $403 $414 $321 $297 $183 $225
Costs, in dollars, include all client service use costs (hospitalizations for ADM, stayed in a residential treatment for substance abuse, ER visit,
self-help for mental health problem, hotline for ADM problem, mental health outpatient visit, outpatient substance abuse services, primary
care visit, social services, religious services, park services, met with case manager, other services for depression).
Start-up Costs by Sector	

Sector	

 RS	

 CEP	

Primary Care	

$5,315 $27,363
Mental Health	

$5,592 $33,010
Substance Abuse	

$4,584 $34,798
Homeless	

$313 $9,679
Social and Community	

$7,221 $52,851
Costs include all intervention costs associated with participation time, travel time, food, venue, preparation and materials.
Preliminary RS  CEP Differences 
in Mean Cost of Services ($) and SF-6D
at baseline, 6  12 months -unadjusted	

Baseline	

 6 Months	

 12 Months	

CEP	

 RS	

 CEP	

 RS	

 CEP	

 RS	

All services $	

(SD)*	

5496
(6989)	

4768
(6536)	

3701
(6024)	

3668
(5191)	

2597
(3904)	

2490
(3759)	

Healthcare	

 4814	

 4030	

 3247	

 3176	

 2109	

 2013	

Non
Healthcare	

578	

 655	

 443	

 542	

 416	

 447	

SF-6D (SD)	

 0.58
(0.102)	

0.585
(0.116)	

0.626
(0.129)	

0.616
(0.129)	

0.628
(0.134)	

0.624
(0.144)	


•  Includes patient time. Healthcare includes primary care, public health, mental health, substance 	

abuse. Non-healthcare includes faith-based, social services, homeless services, 	

community-trusted locations (senior centers, parks and recreation)
Next Steps	

•  Completing 12 month outcomes analysis	

•  Sensitivity analyses of different approaches to costing client time,
adjusting for outliers in services utilization	

•  Estimating individual, client hourly wages by examining baseline
client reports of hours worked in last months, last estimated work
date, and individual income from non-governmental sources	

•  Link services use data from self-reported client data to specific
agencies to get more accurate service use costs.
Implications	

•  Community engagement around evidence-based practices
may address multiple disparities by linking healthcare and
community partners into networks that support evidence-
based goals	


•  May meet “Triple Aims”	

•  Improved individual experience of care	

•  Improved health of populations	

•  Reduced or equal cost ???
Questions	

• How do we capture the differences in the benefits captured
by the MCS-12, but not overall SF-12 in the QALY’s?	

• How do we or should we capture the benefits of
improvements in outcomes outside of health like reduced risk
factors for homelessness?	

• How do we capture the costs of client time (travel, visits,
waiting time) in sectors outside of healthcare (e.g. faith-based,
social services, senior centers)?
• How do we magnify the effects over the population of
people who may have received some sort of treatment from
these agencies?	

• Since there is no usual care, is it reasonable to compare
intervention cost and benefits at 6 and 12 months to
baseline?	

• Since the SD are greater than the means, our estimates are
not precise.	

Questions
ThankYou to Our Funders!
Presenters and Contact Information	

Bowen Chung, MD	

Adjunct Scientist, RAND Corporation	

Assistant Professor, Department of Psychiatry	

Harbor-UCLA Medical Center	

1000 West Carson Street, Box 498	

Torrance, CA 90509	

V 310-222-1801	

E-mail: bchung@mednet.ucla.edu 	

Kenneth B.Wells, MD, MPH	

Senior Scientist, RAND Corporation	

Well Endowed Professor, Department of Psychiatry	

Geffen School of Medicine at UCLA	

Center for Health Services  Society	

10920 Wilshire Blvd, Suite 300	

Los Angeles, CA 90024	

V: 310-794-3728	

E-mail: kwells@mednet.ucla.edu 	

Michael Ong, MD, PhD	

Associate Professor, Department of Internal Medicine	

David Geffen School of Medicine at UCLA	

10940 Wilshire Blvd, Suite 700	

Los Angeles, CA 90024	

V 310-794-0154	

E-mail: mong@mednet.ucla.edu	

35

Comparative Cost Analysis of Depression Care Interventions in Community Partners in Care

  • 1.
    Bowen Chung MD,Adjunct Staff, RAND, Assistant Professor, Geffen School of Medicine, UCLA Michael Ong, MD, PhD Associate Professor, Geffen School of Medicine, UCLA Kenneth Wells, MD, MPH Senior Scientist, RAND Weill Professor of Psychiatry, David Geffen School of Medicine at UCLA January 23, 2013 Comparative Cost Analysis of Depression Care Interventions in Community Partners in Care
  • 2.
    Presenter Disclosures No financialconflicts of interest to report
  • 3.
    Acknowledgements • RAND: Paul Koegel,Cathy Sherbourne • UCLA: Michael McCreary, Esmeralda Pulido, Lingqi Tang, Lily Zhang, Susan Ettner • Healthy African American Families: Loretta Jones, Felica Jones • QueensCare Health and Faith Partnership: Elizabeth Dixon • Behavioral Health Services: James Gilmore • Funders: National Institute of Mental Health, California Community Foundation, Robert Wood Johnson Foundation, UCLA Clinical and Translational Science Institute
  • 4.
    Goals for talk • Explainrationale for Community Partners in Care (CPIC) • Describe CPIC interventions and 6 & 12 month client outcomes • Review comparative cost analysis of the CPIC interventions from a societal perspective • Feedback on several questions related to the cost analysis
  • 5.
    Background •  Depression aleading cause of disability worldwide •  Disparities exist in access, quality, outcomes of care for depression •  Collaborative care for depression in primary care improves outcome especially for African Americans and Latinos relative to whites
  • 6.
    % recovered fromdepression at 5 years Depression QI Interventions Reduce Long-Term Outcome Disparities (Partners in Care)
  • 7.
    Community Context •  Under-resourcedcommunities have limited provider availability and limited implementation of Quality Improvement (QI) programs for depression. •  Multiple services sectors support safety-net populations, but have little or no formal role in depression care or QI. •  Healthcare reform prioritizes medical homes, accountable care organizations and patient-centered care but the role of community agencies as partners is unclear.
  • 8.
    Community Partners inCare •  Community partnered participatory research and rigorous science •  Group-randomized trial at program level (n=95) of 2 approaches to implement evidence-based QI toolkits for depression across diverse community-based agencies: Resources for Services (RS) and Community Engagement and Planning (CEP) in 2 communities, Hollywood and South Los Angeles •  Primary outcomes •  poor mental health quality of life (MCS-12≤40) •  poor mental health (PHQ8≥10 + MCS-12≤40 + MHI-556) •  Client measures at baseline, 6, 12 months
  • 9.
    Interventions Resources for Services(RS) • Expert team conducted culturally competent outreach to programs • Offered 24 one-hour webinars and primary care site visits • Provided 22 webinars and 1 site visit • Study directly funded team/trainings Community Engagement and Planning (CEP) • 4-5 months of collaborative planning: biweekly meetings to review toolkits, plan trainings, build networks/agreements and capacity to co- lead; develop written plan; $15K for trainings •  Team implementation of 174 trainings over 192 hours (conferences, webinars, on-site consultation) •  Innovations: Resiliency classes, “Village Clinic”
  • 10.
  • 11.
    Objective of costanalysis sub-study To determine the comparative cost-effectiveness from a societal perspective of 2 approaches (RS CEP) to disseminate depression quality improvement on clients health and mental health outcomes
  • 12.
    Sampling - Client • Approached:4,649 • Screened: 4,440 (95.5%) • Eligible: 1,322 of 4,440 (29.8%) – Criteria: PHQ-8≥10, Age≥18 years, reliable phone number • Enrolled: 1,246 of 1322 (94.3%) • Completed baseline: 981 of 1,246 (78.7% of enrolled) • Completed 6 month: 759 of 1093 (69.4% eligible for follow-up) • Completed either baseline or 6 month: 1018 (81.7% of enrolled)
  • 13.
    Screened Clients Reflected Diversityof Communities (N = 4,440, mean age 47 years) 65% 85% 16% 50% 23% 39% 28% 54%
  • 14.
    MAJORITY OF DEPRESSIONCONTACTS WERE NOT IN PRIMARY OR MENTAL HEALTH 7% 27% 27% 27%
  • 15.
    Other data sources • Provider and administrator survey data – baseline, 6, and 12 month •  Provider and administrator training data – baseline, 6, and 12 month •  Costs estimated from •  CMS: DRG codes and payments for inpatient stays •  Food,Venue, Materials, CEUs – project invoices •  Medications: WHO DDD Index, Micromedex, Redbook •  AMA: CPT codes and payments for medical and mental health procedures •  National Bureau of Labor Statistics: wages for non-healthcare sector providers – participant time, travel time, preparation time •  Costs adjusted to 2010 using consumer price index
  • 16.
    Key Assumptions •  BLSWage classifications were an accurate reflection of the job title •  Minimum wage is a reasonable dollar amount to value client opportunity costs •  Although we had individual at baseline, we didn’t 6 and 12 months, so – we just used baseline – but 70 % unemployment – up 40% + unemployements in south LA – we didn’t think this was a bad assumption. •  Client, provider, administrator travel time: 1 hour roundtrip
  • 17.
    Key Assumptions •  Costestimates of venue for similar interventions based on per person costs of similar events •  Intervention staff – 15 or 30 minute prep time for meetings •  Services use estimate •  Healthcare – output – moderate to severe complexity •  Mental Health – 30 min for a med visit, 45-50 minutes for therapy, case management 45 minutes •  Social Services – case management 45 minutes •  Parks and recreation –Total annual budget / annual visitors •  Churches – 1 hour for a pastoral counseling visit •  Substance use – 45 -50 minutes for counseling
  • 18.
    Analysis •  6 and12 month outcomes •  Intent to treat, comparative effectiveness study •  Independent variable: intervention status •  Adjusted for baseline status of dependent variable and co-variates •  Weighted to eligible sample •  Imputation for missing data •  Adjustment for clustering of clients within programs for client data •  2-sided test with p.05 for statistical significance •  Costs – analytic samples participating at baseline, 6, and 12 months •  Not currently weighted for sampling or adjusted for clustering
  • 19.
    RS CEP Poor MentalHealth Related Quality of Life* 51% 44% Mental Wellness* 34% 46% Poor Mental Health* 37% 29% Good physical health and activity* 13% 19% ≥ 2 risk factors for homelessness* 39% 29% Any hospitalizations for alcohol, drugs, mental health* 10.5% 5.8% ≥ 4 hospital nights* 5.8% 2.1% *p0.05 Poor Mental Health Quality of Life, MCS12 40 Mental Wellness,Yes to 1 item in last 4 weeks about: 1. Feeling peaceful and calm 2. Being a happy person 3. Having energy Poor Mental Health,Yes to all: MCS12 40, PHQ-8≥ 10, MHI-5≥ 56 Good Physical Health and Activity, Yes to all health limits: 1. Moderate activity, 2. Stairs, 3. Physical activity Risk factors for homelessness, ≥ 2 nights homeless, food insecurity, eviction, severe financial crisis CPIC 6 Month Outcomes
  • 20.
    CPIC 6 MonthOutcomes RS CEP Total outpatient contacts for depression across sectors (mean) 23 22 Any mental outpatient visits 54% 54% Took antidepressant, =2 months 39% 32% # MH outpatient visits received medication advice (mean)* 11 5 Any primary care visit 29% 29% = 2 visits for depression* 62% 80% Faith-based visit 60% 57% =3 faith-based visits for depression, if any (n=125)* 42% 64% *p0.05
  • 21.
    Percent Poor MentalHealth Quality of Life at 6 and 12 months Percent(%) p=0.07
  • 22.
    Service Use Costsby Sector at baseline, 6 12 months - unadjusted Sector Baseline 6 Month 1 year RS CEP RS CEP RS CEP Primary Care $796 $870 $835 $792 $662 $677 Mental Health $701 $779 $789 $651 $570 $510 Substance Abuse $1442 $2059 $1047 $1382 $537 $549 Faith Based $350 $306 $315 $255 $326 $271 Social and Community $403 $414 $321 $297 $183 $225 Costs, in dollars, include all client service use costs (hospitalizations for ADM, stayed in a residential treatment for substance abuse, ER visit, self-help for mental health problem, hotline for ADM problem, mental health outpatient visit, outpatient substance abuse services, primary care visit, social services, religious services, park services, met with case manager, other services for depression).
  • 23.
    Start-up Costs bySector Sector RS CEP Primary Care $5,315 $27,363 Mental Health $5,592 $33,010 Substance Abuse $4,584 $34,798 Homeless $313 $9,679 Social and Community $7,221 $52,851 Costs include all intervention costs associated with participation time, travel time, food, venue, preparation and materials.
  • 24.
    Preliminary RS CEP Differences in Mean Cost of Services ($) and SF-6D at baseline, 6 12 months -unadjusted Baseline 6 Months 12 Months CEP RS CEP RS CEP RS All services $ (SD)* 5496 (6989) 4768 (6536) 3701 (6024) 3668 (5191) 2597 (3904) 2490 (3759) Healthcare 4814 4030 3247 3176 2109 2013 Non Healthcare 578 655 443 542 416 447 SF-6D (SD) 0.58 (0.102) 0.585 (0.116) 0.626 (0.129) 0.616 (0.129) 0.628 (0.134) 0.624 (0.144) •  Includes patient time. Healthcare includes primary care, public health, mental health, substance abuse. Non-healthcare includes faith-based, social services, homeless services, community-trusted locations (senior centers, parks and recreation)
  • 25.
    Next Steps •  Completing12 month outcomes analysis •  Sensitivity analyses of different approaches to costing client time, adjusting for outliers in services utilization •  Estimating individual, client hourly wages by examining baseline client reports of hours worked in last months, last estimated work date, and individual income from non-governmental sources •  Link services use data from self-reported client data to specific agencies to get more accurate service use costs.
  • 26.
    Implications •  Community engagementaround evidence-based practices may address multiple disparities by linking healthcare and community partners into networks that support evidence- based goals •  May meet “Triple Aims” •  Improved individual experience of care •  Improved health of populations •  Reduced or equal cost ???
  • 27.
    Questions • How do wecapture the differences in the benefits captured by the MCS-12, but not overall SF-12 in the QALY’s? • How do we or should we capture the benefits of improvements in outcomes outside of health like reduced risk factors for homelessness? • How do we capture the costs of client time (travel, visits, waiting time) in sectors outside of healthcare (e.g. faith-based, social services, senior centers)?
  • 28.
    • How do wemagnify the effects over the population of people who may have received some sort of treatment from these agencies? • Since there is no usual care, is it reasonable to compare intervention cost and benefits at 6 and 12 months to baseline? • Since the SD are greater than the means, our estimates are not precise. Questions
  • 29.
  • 30.
    Presenters and ContactInformation Bowen Chung, MD Adjunct Scientist, RAND Corporation Assistant Professor, Department of Psychiatry Harbor-UCLA Medical Center 1000 West Carson Street, Box 498 Torrance, CA 90509 V 310-222-1801 E-mail: bchung@mednet.ucla.edu Kenneth B.Wells, MD, MPH Senior Scientist, RAND Corporation Well Endowed Professor, Department of Psychiatry Geffen School of Medicine at UCLA Center for Health Services Society 10920 Wilshire Blvd, Suite 300 Los Angeles, CA 90024 V: 310-794-3728 E-mail: kwells@mednet.ucla.edu Michael Ong, MD, PhD Associate Professor, Department of Internal Medicine David Geffen School of Medicine at UCLA 10940 Wilshire Blvd, Suite 700 Los Angeles, CA 90024 V 310-794-0154 E-mail: mong@mednet.ucla.edu 35