Download as PDF, PPTX


![“
Often, an important decision requires
better knowledge of the alleged intangible,
but when a [person] believes something to
be immeasurable, attempts to measure it
will not even be considered.](https://image.slidesharecdn.com/costofdelay-170427202456/85/Cost-of-Delay-measurements-and-parallel-vs-sequential-project-processing-35-320.jpg)


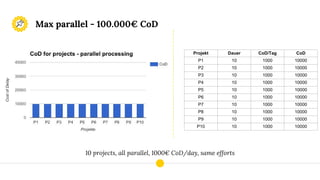
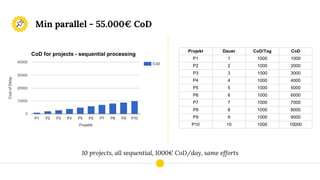
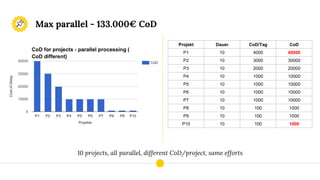
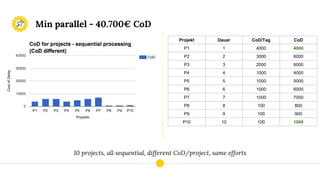
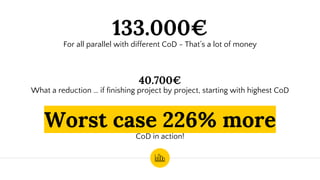
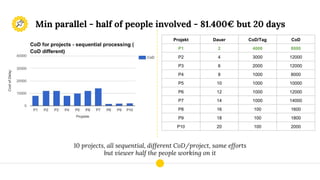


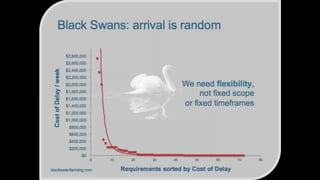
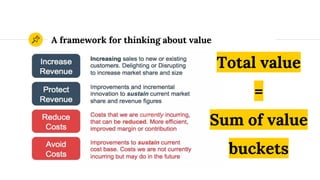
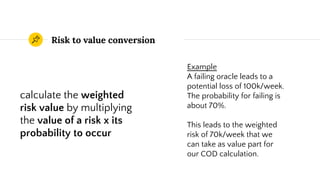
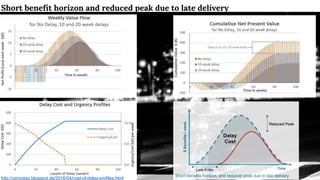
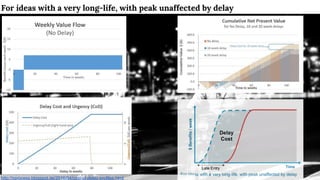
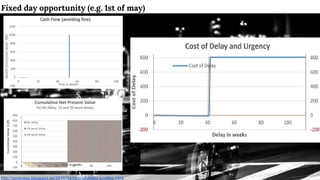
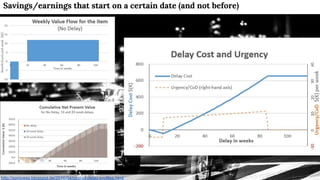
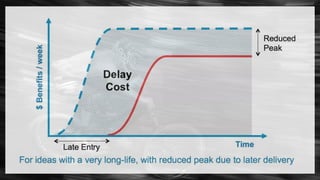
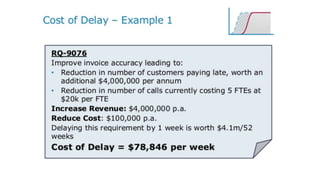
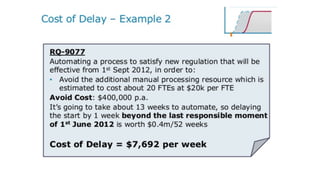
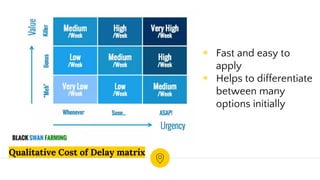
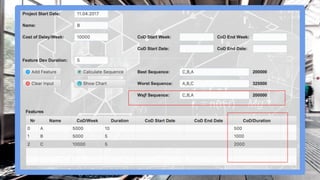
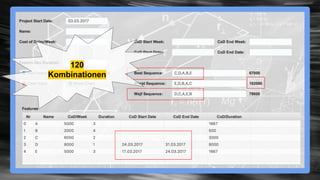
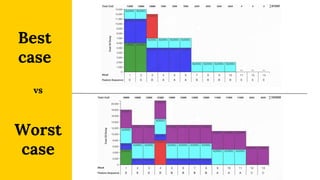
The document discusses the concept of cost of delay (COD) and provides examples and frameworks for calculating and prioritizing projects based on their individual COD. It defines COD as the value of a project multiplied by its urgency, and discusses how to assess value and urgency for different types of projects. Examples are provided to demonstrate how assessing COD can inform decisions about project sequencing and resource allocation to minimize overall COD.