Download to read offline
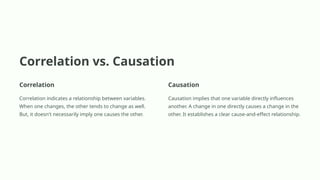


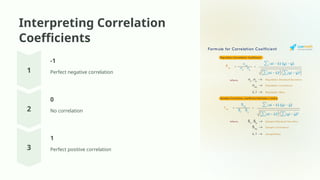


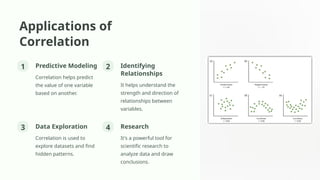

The document explains the concept of correlation, distinguishing it from causation and outlining its types, such as positive, negative, and no correlation. It details how correlation is measured using coefficients, the assumptions and limitations of correlation analysis, and its applications in predictive modeling, relationship identification, data exploration, and research. The document emphasizes that while correlation shows relationships between variables, it does not imply one causes the other.