Us coronavirus data as of may 1, 2020 just dataJames Orr
170 pages this week, but just data on Coronavirus cases in US by state.
Includes the best measure found so far -- Average weekly new cases per day per 100,000 population
Page 4 – 8 are alphabetical by state total cases, max cases per day, 4-24 to 5/1 average cases per day, plus normalized by 100,000 population. Has which 3 charts numbers for detail data per state
Pages 9 – 13 are from state with the highest cases per 100,000 population (New York) to least (Montana). Also shows average new cases per day per 100,000 population in descending order.
Page 14 has distributions of cases/100,000 and new cases per day per 100,000. Also shows the ration of weekly new cases 4/24 to 5/1 divided maximum weekly new case.
Note that for 21 states (and Total US, and District of Columba) had the maximum weekly new cases during 4/24 to 5/1
The Correlation between HPV Vaccination Rate and Income InequalityIJCNCJournal
According to the 2018 National Immunization Survey - Teen (NIS-Teen), the human papillomavirus (HPV) vaccination coverage in the U.S. increased from 48.6% to 51.1%.[1] Certain factors contribute to disparity between teenagers receiving HPV vaccination.[1]The factors are geography, race, gender, education level, household income, and etc. Within these factors, household income and income inequality were chosen to be the focus of this study. The relationship between HPV vaccination coverage in the U.S., the household income of interviewed individuals, and the Gini index in the U.S. have been studied in RStudio [2]. By merging the NIS-Teen data of vaccination rate and Gini index data in RStudio, charts and graphs are formed to illustrate the relationship between HPV vaccination rate and income inequality. There seem to be limited correlations between vaccination rate and Gini index, but unexpected connections between vaccination rate and household income have been found.
The Correlation between HPV Vaccination Rate and Income Inequalityhiij
According to the 2018 National Immunization Survey - Teen (NIS-Teen), the human papillomavirus (HPV) vaccination coverage in the U.S. increased from 48.6% to 51.1%.[1] Certain factors contribute to disparity between teenagers receiving HPV vaccination.[1]The factors are geography, race, gender, education level, household income, and etc. Within these factors, household income and income inequality were chosen to be the focus of this study. The relationship between HPV vaccination coverage in the U.S., the household income of interviewed individuals, and the Gini index in the U.S. have been studied in RStudio [2]. By merging the NIS-Teen data of vaccination rate and Gini index data in RStudio, charts and graphs are formed to illustrate the relationship between HPV vaccination rate and income inequality. There seem to be limited correlations between vaccination rate and Gini index, but unexpected connections between vaccination rate and household income have been found.
The October 2013 release of findings from The University of Texas at Austin Energy Poll, conducted by McCombs School of Business. "American Perspectives on Energy," assembled by Sheril Kirshenbaum, poll director. General topics include consumer attitudes and perceptions on energy prices and availability, energy concerns, satisfaction, and consumer behaviors and voting preferences. Contains new questions on water usage and conservation.
- A survey of 3,200 registered voters was conducted in 8 Western states regarding priorities for public lands and environmental policies.
- Voters strongly prefer that Congress emphasize conservation over energy production on public lands by a margin of over 2 to 1. Majorities in each state hold this view.
- Recent rollbacks of environmental laws protecting land, water, and wildlife are viewed as serious problems by over 75% of Westerners, up from the prior year. Specific policy changes removing protections for national monuments and smaller waterways are seen as "bad changes" by majorities in each state.
- When considering a new Secretary of the Interior, Western voters prioritize basing decisions in science and emphasizing conservation, rather
This document from Connecticut Voices for Children provides an overview of income, demographics, targeted investments, and policy recommendations for Northwest Connecticut. It summarizes data on topics like median income, poverty, education, healthcare access, and more for 20 towns in the region. The organization advocates for strategic investments in programs like the Earned Income Tax Credit and early childhood education to reduce child poverty. It recommends policies like restoring the state EITC and expanding access to preschool.
Impact of increased district-level insecticide-treated net (ITN) distribution...MEASURE Evaluation
This study examined the impact of increased insecticide-treated mosquito net (ITN) distribution on child mortality in Malawi between 2004-2010. Using national survey and ITN distribution data at the district level, the researchers conducted a statistical analysis controlling for socioeconomic factors. They found that higher levels of ITN distribution were significantly associated with lower under-five mortality. Specifically, districts with over 0.25 ITNs per person experienced an 11% reduction in child deaths compared to districts with lower ITN levels. This suggests increased ITN coverage contributed meaningfully to the overall decline in under-five mortality in Malawi during this period.
This document presents an analysis of the relationship between juvenile crime rates, high school graduation rates, and levels of law enforcement employment across US states. Tables of data from 2012 show rates of juvenile crimes, numbers of law enforcement employees, high school graduation percentages, and total high school graduates for each of the 50 states. The author calculates averages and medians for the data and intends to use chi-square tests to determine if relationships exist between the variables of total juvenile crimes, total law enforcement employed, and total high school graduates for each state.
Alcohol and Regional Drug Trends in Region 8, information about the demographics, statistics from the 2014 Texas School Survey and signs and symptoms of substance abuse
Carteret School board presentation sept. 24 final (1)EducationNC
The document provides a COVID-19 update for Carteret County. It summarizes trends in the county's percent positive testing rate over the past month. It also shows the age breakdown of confirmed cases, with most being ages 25-49. Hospitalization data indicates 4.7% of confirmed cases have been hospitalized. Death rates in the county and state are estimated at 0.3-0.9% based on adjusted case counts. The CDC stance on schools is that they can operate safely with preventive measures and virtual options for high-risk students. Moving to Plan A for K-5 would require maintaining safety protocols and flexibility given evolving science.
Core practices that are moving from a pilot state to implementation at scale: Many of the
barriers facing HIV programs are common across countries. PEPFAR’s ECTs (described below in
Sections 2.3.2 and 2.3.3) identified common issues affecting countries at various levels of
epidemic control and then developed a compendium of evidence-based solutions, approaches
and case-studies that highlight successful means of addressing common barriers. Additional
evidence-based approaches and case-studies will be incorporated into this living compendium
over time. As highlighted in this PEPFAR Solutions Platform, these practices can be rapidly
adapted and scaled to move countries forward.
Key considerations for all PEPFAR programs include:
• Bringing Interventions to Scale with Fidelity: Getting to HIV epidemic control is dependent on
several factors; not the least of which is the ability to rapidly scale successful interventions with
fidelity and demonstrated impact. However, the logistics of cost- effective programmatic scale
have proven challenging, with several implementation barriers. Implementation science
defines scalability as the capacity to expand or extend an intervention to account for a growth
factor that aims to fill a gap or address unmet need in a defined population group/geographic
area.
• Data and Information Technology: The enabling environment for data and information
technology is rapidly maturing across countries, creating space, opportunity, and needed
political will to harness the Data Revolution for epidemic control. OUs should consider
innovative ways to use data and information technology to improve efficiency and
sustainability in achieving epidemic control, beyond immediate PEPFAR indicator data
collection needs. As highlighted in the Data Revolution Innovation Toolkit, available on the
PEPFAR SharePoint, OUs are encouraged to explore, adapt, and scale these and other data
driven approaches to move country epidemic control forward.
This document provides youth population and characteristic data for counties in the Pee Dee region of South Carolina:
- There were over 344,000 youth aged 15-24 in 2014, with 6.7% aged 20-24. Educational attainment rates showed 42.5% had some college and 30.7% a high school diploma.
- In 2014, over 83,000 people in the region lived below the poverty level, including 12.6% of those aged 18-24. The region had a graduation rate of 83.4% and over 300 dropouts.
- In 2015, 261 youths were detained and 874 individuals of any age were released from correctional facilities in the region.
Trends in Opioid Misuse & Implications for Child Welfare inMatthew Lowe
The purpose of this research brief is to examine whether and how these national trends have affected New York families and children. We provide an overview of county-level trends in opioid misuse and child welfare caseloads and examine the relationship between the two. We identify counties that are particularly vulnerable and may benefit from additional resources to mitigate the impact of the opioid epidemic on families and children.
The Kenyan Economy: Perceptions and Realities Ipsos
In this release, we present several findings related to the economy.
Underpinning the specific findings is the general reality that three-quarters of all Kenyan households (75%) report a total family income of Shs. 25,000 or less, with more than half of these households (44%) earning between nothing and only Shs. 10,000 (a figure which increases to 46% if those who declined/were unable to answer this question are excluded). In addition, as is seen in several of the specific findings show below, such extensive poverty takes a clear regional dimension. For example, the proportion of those in the Shs. 10,000 and below category is 56% at the Coast compared to 56% in Nairobi, more than twice.
At the same time, these income-group findings over all three Ipsos surveys since May, 2014 show no statistical change, reflecting both the static nature of income-distribution in Kenya, and the reliability of Ipsos’ survey methodology.
This research brief examines trends in opioid misuse and child welfare outcomes in New York State between 2006 and 2016. It finds that increases in opioid misuse and rates of child maltreatment were geographically concentrated, with many counties in Central NY and the Southern Tier experiencing high increases in both measures. Specifically, 17 counties saw above-median increases in both opioid emergency department admissions and reported child maltreatment rates, indicating particular vulnerability in these regions. In contrast, most counties downstate like in the Hudson Valley saw below-median increases in both measures.
2012 - 2013 International Youth Exchange StatisticsNina Olivetti
Report featuring original statistical research on international education at the high school level, related to F-1 and J-1 Visas by country of origin and US hosting state. The report provides international youth exchange statistics from the 2012-2013 academic cycle.
Washington County, WI is experiencing changes in demographics and community needs according to a recent report. The county grew 16% between 2000-2020 according to Census data, with some municipalities growing over 50%. The population is becoming more diverse - in 2010, 94.3% identified as white alone, non-Hispanic but schools now have growing Hispanic, Black, and Asian populations. Poverty levels affect over 5% of residents. Nearly half of workers commute outside the county for jobs. The report provides an overview of Census and ACS data on population changes, poverty, education levels, and commuting patterns to help local leaders understand emerging trends and plan accordingly.
1) The document summarizes a study that evaluated non-clinical HIV/AIDS activities in Lagos State, Nigeria through surveys of secondary school and university students.
2) The study found gaps in HIV/AIDS awareness related to behavioral challenges, understanding of sexually transmitted infections, lack of transmission awareness, condom use, and fear of HIV/AIDS stigma.
3) To address these gaps, the study proposed a validated knowledge management framework to enhance HIV/AIDS information sharing and awareness of transmission and prevention factors in Lagos State.
Time for a Reality Check on Health InsuranceCedric Dark
Presentation by Elena Marks, JD, MPH for the Third Annual Policy Prescriptions® Symposium
Elena M. Marks is the president and chief executive officer of the Episcopal Health Foundation and a nonresident fellow in Health Policy at Rice University’s Baker Institute for Public Policy.
Marks previously served as the director of Health and Environmental Policy for the City of Houston. Prior to joining the mayor’s staff, Marks practiced trial and appellate law with major law firms, started and directed a successful legal placement firm, and developed strategic, long-range, and operating plans for service lines and system centers at a major health system.
The symposium is designed for clinicians, healthcare workers, and healthcare executives interested in exploring the major themes that will emerge in health policy throughout the year. This year, the symposium will emphasize value in healthcare, health information technology, gun violence, insurance choices, the Affordable Care Act, and the viewpoints of the Presidential candidates on health care.
This document is a bill proposed by the University Park Undergraduate Association (UPUA) to fund Red Zone Action Week from September 20-25, 2021. The Red Zone refers to the first few months of the fall semester when sexual assault rates are highest, especially for underclassmen. Recent data shows a high number of sexual assaults and timely warnings at Penn State. The proposed expenditures of $201.98 would fund printed flyers and a poster board to raise awareness of this issue and the It's On Us campaign during Red Zone Action Week, concluding with airing a related video at a football game. The UPUA committee and assembly unanimously approved the bill.
This regional needs assessment summarizes data on substance use and related factors for Region 8 in Texas. Key findings include that over one-third of the population speaks a language other than English at home, poverty and unemployment rates are higher than national averages in many counties, and high school dropout rates exceed state rates in nearly a third of the region. Substance use of alcohol, tobacco, marijuana and prescription drugs is analyzed alongside consequences like crimes, family violence, and child abuse rates which in many cases exceed state levels. Gaps in services, data and partnerships to address substance misuse in the region are also discussed.
The document provides key findings from Vietnam's 2014 Multiple Indicator Cluster Survey (MICS). It includes summaries of 10 topics: child mortality, nutrition, child health, water and sanitation, reproductive health, child development, literacy and education, child protection, HIV/AIDS, and access to media/ICT. For each topic, it highlights 2-6 relevant indicators and provides data on national averages as well as breakdowns by region, wealth, and ethnicity. The objective is to disseminate timely findings on Millennium Development Goal and MICS indicators to evaluate Vietnam's progress.
Report: Marcellus Shale Gas Development and Impacts on Pennsylvania Schools a...Marcellus Drilling News
The Center for Rural Pennsylvania, a bipartisan, bicameral legislative agency that serves as a resource for rural policy within the Pennsylvania General Assembly, has just published the third report in a series of studies commissioned on the Marcellus Shale and its impact on the state. Titled "Marcellus Shale Gas Development and Impacts on Pennsylvania Schools and Education", the report looks at whether or not the rapid development of shale drilling in the state has stressed local schools in areas with the most Marcellus Shale drilling. It was feared that with an influx of workers, and potentially families, local schools would see a spike in enrollment. The report says that hasn't happened. There was also a concern about dropout rates--perhaps kids leaving school early to work in the gas fields. That hasn't happened either. In fact, if anything, the Marcellus has contributed more money to the coffers of local schools. No negative impacts, lots of positive impacts from northeast shale drilling.
The U.S. Nursing Workforce Trends in Supply and Education 3 .docxchristalgrieg
The document analyzes trends in the United States nursing workforce using data from the American Community Survey and Census 2000. It finds that in 2008-2010 there were approximately 2.8 million registered nurses and 690,000 licensed practical nurses in the US workforce. The number of nurses varies significantly between states, with some Western and Southern states tending to have fewer nurses per capita compared to Midwestern and Northeastern states. Educational attainment, demographic composition, work settings, and hours of nurses are also changing over time.
This document discusses how healthcare organizations can use new media technologies to improve adolescent health. It defines new media technologies as internet, websites, multimedia, video games and more. It describes how teens are increasingly using these technologies, especially mobile devices. Over 75% of teens have cell phones, and social media use is very common. The document then reviews how these technologies can be used to improve outcomes like immunization rates among youth, and encourages considering how to incorporate new media into healthcare work with adolescents.
This document provides a summary of data from the 100 Metros dashboard about the Atlanta metro area and how it compares to other large metro areas in the US. The data is organized into categories including demographics, housing, education/technology, health, employment, economic development, and commuting. Some key findings are that Atlanta's population ranks 8th largest nationally and grew faster than most other large metros from 2021-2022. The metro area also ranks high for housing permits, job growth, and median home sale price increases but lower for median income and average hourly wages.
Advocating for Inclusive Education: Latine Parents Navigating the Special Edu...Molly Osborne
The Padres Investigadores program was tasked with the mission to understand the experience of Latine families in NC when seeking access to equitable special education for diverse learners.
The NASSP Principal Recovery Network Guide to RecoveryMolly Osborne
The document provides guidance from school principals on reopening a school after a shooting or other violent incident. It recommends:
1) Allowing adequate time for physical repairs and mental/emotional healing before reopening. This may include delaying reopening until funerals are completed.
2) Meeting with staff alone before students return to help staff feel comfortable and prepared.
3) Slowly ramping up activities over limited hours upon initial student return to allow for adjustment rather than immediate resumption of full academic routines.
4) Ensuring counseling support is available and staff are trained on addressing the incident sensitively with students. The principal's visibility and vulnerability are important for supporting the school community.
The document discusses school shootings and provides guidance on threat assessment. It notes that there is no single profile of a school shooter, that attacks are often planned in advance, and that others typically knew the attacker was considering violence. Common motives include revenge, desire for control, and seeking notoriety. While behavior cannot predict violence with certainty, effective threat assessment can help prevent some attacks. The document provides 11 key questions for threat assessment and lists concerning behaviors that may indicate risk of targeted violence.
North Carolina State Action Plan for School SafetyMolly Osborne
The document is North Carolina's 5-year State Action Plan for School Safety from 2021-2026. It was endorsed by the North Carolina Task Force for Safer Schools in June 2021. The plan aims to coordinate school safety efforts across the state to make them more efficient and effective. It establishes a vision, goals, objectives, and initiatives related to promoting positive learning environments, preventing incidents of school violence, and protecting students, teachers, and staff. The plan will evolve over the 5 years as circumstances change.
The document provides an overview of threat assessment for schools. It discusses the importance of threat assessment and the legislative mandate for schools to establish threat assessment teams. It outlines the three parts of threat assessment as appraise, assess, address. It defines different types of threats and categories of threats. It also discusses concerning behaviors that require different levels of response, from immediate intervention to warning signs requiring counseling or other support services. The goal is for schools to properly evaluate threats in order to determine the appropriate response and ensure student and staff safety.
North Carolina Community College System 2022 Performance ReportMolly Osborne
The State Board of Community Colleges unanimously approved the 2022 performance measures for student success. Those measures act as an annual accountability report for the system.
ApprenticeshipNC served 15,657 North Carolinians during fiscal year 2019-2020, the most in the past 10 years. The number is 37% higher than last year’s total.
Allocation for Governor's Emergency Education Relief (GEER) FundMolly Osborne
The State Board of Community Colleges is asked to approve the allocation of $15 million from the Governor's Emergency Education Relief Fund. $14.5 million would provide scholarships for community college students pursuing training in high-demand fields, and $450,000 would support communication about the program. Scholarships would support tuition, fees, books and other costs for programs in fields like healthcare, manufacturing, and IT between August 2020 and September 2022. The funds would be distributed to colleges based on student enrollment and local workforce needs.
Vance-Granville Community College CARES Act GuidelinesMolly Osborne
This document outlines guidelines for distributing funds from the Higher Education Emergency Relief Fund (HEERF) at Vance-Granville Community College. To be eligible, curriculum students must have been enrolled in at least one course with a seated component as of March 9, 2020. Students must also complete the FAFSA and be deemed Title IV eligible. Funding amounts will vary based on a student's estimated family contribution (EFC) and enrollment status, with students showing the greatest financial need receiving the most. The college will be required to report to the Department of Education on how the funds were distributed.
CARES Act funding letter for higher education institutional costsMolly Osborne
Letter sent to college and university presidents by Secretary of Education Betsy DeVos announcing the release of additional $6.2 billion in funding for institutions.
Bridge 2019: A gathering for North Carolina's futureMolly Osborne
From April 28-30, 2019, philanthropists, educators, policymakers, and community leaders gathered in Greensboro to understand the work to be done and the work being done to orient all of our students, educators, and leaders towards readiness and attainment. This program outlines the agenda for Bridge.
1. The teacher designed a peer pressure activity where students are paired up and rotate through stations, taking turns trying to convince each other to do drugs or resist doing drugs.
2. At each station, they learn about a different drug and have 2 minutes to role play being pressurers or resisters.
3. After completing the activity, the class discusses how difficult it was to resist peer pressure and ways to avoid it, as well as why teens try drugs despite the dangers.
NCCCS Data Inquiry Presentation to State Board of Community CollegesMolly Osborne
This document provides a summary of data analysis conducted for the NC Association of Community College Presidents on residency determinations. It finds that the most common points where students stop completing the online residency interview without finishing are questions about dependency status. It also analyzes demographics of non-completers and common data points for students receiving resident and non-resident classifications. The analysis will be used to identify ways to simplify questions and reduce non-completion rates.
Wake Technical Community College plans to train 450 people for information technology (IT) jobs in healthcare, cybersecurity, manufacturing, and financial services through Project SECURE — Supporting and Enhancing Cybersecurity through Upwardly Mobile Retraining and Education.
The Strategic Twin Counties Education Partnership — STEP for short — is a unique initiative between several stakeholder groups in Edgecombe and Nash counties.
Exploiting Artificial Intelligence for Empowering Researchers and Faculty, In...Dr. Vinod Kumar Kanvaria
Exploiting Artificial Intelligence for Empowering Researchers and Faculty,
International FDP on Fundamentals of Research in Social Sciences
at Integral University, Lucknow, 06.06.2024
By Dr. Vinod Kumar Kanvaria
This presentation includes basic of PCOS their pathology and treatment and also Ayurveda correlation of PCOS and Ayurvedic line of treatment mentioned in classics.
A workshop hosted by the South African Journal of Science aimed at postgraduate students and early career researchers with little or no experience in writing and publishing journal articles.
How to Add Chatter in the odoo 17 ERP ModuleCeline George
In Odoo, the chatter is like a chat tool that helps you work together on records. You can leave notes and track things, making it easier to talk with your team and partners. Inside chatter, all communication history, activity, and changes will be displayed.
How to Fix the Import Error in the Odoo 17Celine George
An import error occurs when a program fails to import a module or library, disrupting its execution. In languages like Python, this issue arises when the specified module cannot be found or accessed, hindering the program's functionality. Resolving import errors is crucial for maintaining smooth software operation and uninterrupted development processes.
How to Build a Module in Odoo 17 Using the Scaffold MethodCeline George
Odoo provides an option for creating a module by using a single line command. By using this command the user can make a whole structure of a module. It is very easy for a beginner to make a module. There is no need to make each file manually. This slide will show how to create a module using the scaffold method.
हिंदी वर्णमाला पीपीटी, hindi alphabet PPT presentation, hindi varnamala PPT, Hindi Varnamala pdf, हिंदी स्वर, हिंदी व्यंजन, sikhiye hindi varnmala, dr. mulla adam ali, hindi language and literature, hindi alphabet with drawing, hindi alphabet pdf, hindi varnamala for childrens, hindi language, hindi varnamala practice for kids, https://www.drmullaadamali.com
Executive Directors Chat Leveraging AI for Diversity, Equity, and InclusionTechSoup
Let’s explore the intersection of technology and equity in the final session of our DEI series. Discover how AI tools, like ChatGPT, can be used to support and enhance your nonprofit's DEI initiatives. Participants will gain insights into practical AI applications and get tips for leveraging technology to advance their DEI goals.
Walmart Business+ and Spark Good for Nonprofits.pdfTechSoup
"Learn about all the ways Walmart supports nonprofit organizations.
You will hear from Liz Willett, the Head of Nonprofits, and hear about what Walmart is doing to help nonprofits, including Walmart Business and Spark Good. Walmart Business+ is a new offer for nonprofits that offers discounts and also streamlines nonprofits order and expense tracking, saving time and money.
The webinar may also give some examples on how nonprofits can best leverage Walmart Business+.
The event will cover the following::
Walmart Business + (https://business.walmart.com/plus) is a new shopping experience for nonprofits, schools, and local business customers that connects an exclusive online shopping experience to stores. Benefits include free delivery and shipping, a 'Spend Analytics” feature, special discounts, deals and tax-exempt shopping.
Special TechSoup offer for a free 180 days membership, and up to $150 in discounts on eligible orders.
Spark Good (walmart.com/sparkgood) is a charitable platform that enables nonprofits to receive donations directly from customers and associates.
Answers about how you can do more with Walmart!"
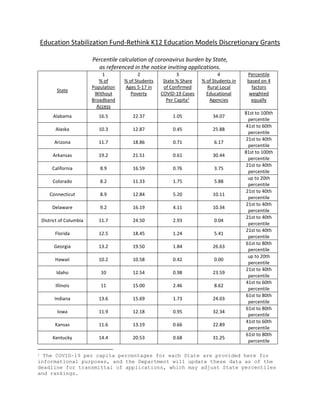
1. Education Stabilization Fund-Rethink K12 Education Models Discretionary Grants
Percentile calculation of coronavirus burden by State,
as referenced in the notice inviting applications.
State
1
% of
Population
Without
Broadband
Access
2
% of Students
Ages 5-17 in
Poverty
3
State % Share
of Confirmed
COVID-19 Cases
Per Capita1
4
% of Students in
Rural Local
Educational
Agencies
Percentile
based on 4
factors
weighted
equally
Alabama 16.5 22.37 1.05 34.07
81st to 100th
percentile
Alaska 10.3 12.87 0.45 25.88
41st to 60th
percentile
Arizona 11.7 18.86 0.71 6.17
21st to 40th
percentile
Arkansas 19.2 21.51 0.61 30.44
81st to 100th
percentile
California 8.9 16.59 0.76 3.75
21st to 40th
percentile
Colorado 8.2 11.33 1.75 5.88
up to 20th
percentile
Connecticut 8.9 12.84 5.20 10.11
21st to 40th
percentile
Delaware 9.2 16.19 4.11 10.34
21st to 40th
percentile
District of Columbia 11.7 24.50 2.93 0.04
21st to 40th
percentile
Florida 12.5 18.45 1.24 5.41
21st to 40th
percentile
Georgia 13.2 19.50 1.84 26.63
61st to 80th
percentile
Hawaii 10.2 10.58 0.42 0.00
up to 20th
percentile
Idaho 10 12.54 0.98 23.59
21st to 40th
percentile
Illinois 11 15.00 2.46 8.62
41st to 60th
percentile
Indiana 13.6 15.69 1.73 24.03
61st to 80th
percentile
Iowa 11.9 12.18 0.95 32.34
61st to 80th
percentile
Kansas 11.6 13.19 0.66 22.89
41st to 60th
percentile
Kentucky 14.4 20.53 0.68 31.25
61st to 80th
percentile
1 The COVID-19 per capita percentages for each State are provided here for
informational purposes, and the Department will update these data as of the
deadline for transmittal of applications, which may adjust State percentiles
and rankings.
2. State
1
% of
Population
Without
Broadband
Access
2
% of Students
Ages 5-17 in
Poverty
3
State % Share
of Confirmed
COVID-19 Cases
Per Capita1
4
% of Students in
Rural Local
Educational
Agencies
Percentile
based on 4
factors
weighted
equally
Louisiana 17.6 24.89 5.31 13.46
61st to 80th
percentile
Maine 11.7 13.04 0.67 50.58
81st to 100th
percentile
Maryland 9.0 11.38 2.34 6.89
up to 20th
percentile
Massachusetts 8.7 11.40 5.70 8.01
21st to 40th
percentile
Michigan 12.1 17.48 4.70 17.89
41st to 60th
percentile
Minnesota 9.3 10.57 0.45 17.54
up to 20th
percentile
Mississippi 19.4 26.63 1.56 48.72
81st to 100th
percentile
Missouri 13.1 16.60 0.96 20.05
41st to 60th
percentile
Montana 12.2 14.34 0.42 32.22
61st to 80th
percentile
Nebraska 9.9 11.19 0.79 23.28
21st to 40th
percentile
Nevada 11.3 16.73 1.27 1.62
up to 20th
percentile
New Hampshire 7.6 8.76 1.06 31.41
21st to 40th
percentile
New Jersey 9.1 12.53 9.89 6.04
41st to 60th
percentile
New Mexico 20.6 23.31 0.91 18.58
61st to 80th
percentile
New York 11.7 17.46 12.59 10.83
81st to 100th
percentile
North Carolina 13.2 18.59 0.65 35.34
81st to 100th
percentile
North Dakota 15.1 9.53 0.80 35.40
61st to 80th
percentile
Ohio 11.8 17.37 1.03 21.10
41st to 60th
percentile
Oklahoma 14.4 19.41 0.68 28.40
61st to 80th
percentile
Oregon 8.9 13.89 0.47 9.10
up to 20th
percentile
Pennsylvania 11.9 15.53 2.60 15.58
41st to 60th
percentile
Puerto Rico 33.6 54.18 0.39 0.00
81st to 100th
percentile
Rhode Island 10.3 16.24 4.60 8.02
Up to 20th
percentile
3. State
1
% of
Population
Without
Broadband
Access
2
% of Students
Ages 5-17 in
Poverty
3
State % Share
of Confirmed
COVID-19 Cases
Per Capita1
4
% of Students in
Rural Local
Educational
Agencies
Percentile
based on 4
factors
weighted
equally
South Carolina 15.1 20.96 0.89 18.62
61st to 80th
percentile
South Dakota 14.6 14.31 1.91 40.25
81st to 100th
percentile
Tennessee 14.3 19.64 1.04 29.75
61st to 80th
percentile
Texas 13.3 19.93 0.68 13.24
41st to 60th
percentile
Utah 7.1 8.82 1.03 5.42
up to 20th
percentile
Vermont 13.9 10.85 1.34 54.20
81st to 100th
percentile
Virginia 11.0 12.51 1.09 19.89
41st to 60th
percentile
Washington 7.4 11.49 1.62 7.58
up to 20th
percentile
West Virginia 16.4 21.09 0.49 36.44
81st to 100th
percentile
Wisconsin 11.4 12.59 0.77 18.81
21st to 40th
percentile
Wyoming 11.0 11.36 0.76 25.75
21st to 40th
percentile
Data Sources and Methodology:
Available Broadband Access
The number in column 1 is the percent of the population in each State without broadband
access of any kind in 2018, as determined by 100 minus the percent of households with
broadband access in 2018. The source for the percent of households with broadband access of
any kind is the U.S. Census Bureau American Community Survey in 2018. This data may be
retrieved through the customization of this table:
https://data.census.gov/cedsci/table?q=S2802&tid=ACSST1Y2018.S2802.
Students in Poverty
The number in column 2 is the percentage of students ages 5-17 in each State living in poverty
in 2018, as determined by the number of students in poverty divided by the total number of
students ages 5-17 in the State. The source for the percentage of students living in poverty is
the U.S. Census Bureau Small Area Income and Poverty Assessments Program estimates for
2018. This data is provided to the Department and informs some Title I calculations. Portions
of these data may be retrieved from the Census website:
https://www.census.gov/data/datasets/2018/demo/saipe/2018-state-and-county.html.
4. COVID-19 Cases Per Capita
The number in column 3 is the percent share of total COVID-19 cases per capita for each State.
This number is derived by taking the total number of COVID-19 cases per capita reported to the
Centers for Disease Control, by State, as of 5:51pm on April 25, 2020 and dividing that by the
total number of cases per capita in the U.S. The per capita data and the sum of all cases per
capita may be retrieved from the Centers for Disease Control at https://www.cdc.gov/covid-
data-tracker/index.html by downloading the Excel document that accompanies the visual
displays. It is important to note that the Department will update the number in column 3 as of
the deadline for transmittal of applications, which may adjust State percentiles and rankings.
Rural Local Educational Agencies (LEAs)
The number in column 4 is the percentage of students in LEAs in each State that are rural, as
determined by the number of students in rural LEAs in the State divided by the total number of
students in the State. The source for the percentage of students in rural LEAs in the State is the
Common Core of Data from the Nation Center for Education Statistics. Portions of these data
may be retrieved from the Common Core of Data Files: https://nces.ed.gov/ccd/ccddata.asp.
Ranking Methodology
To determine ranking, States were assigned total burden scores based on sum of the values of
the indicators relative to one another.2 All three indicators were weighted equally in calculating
burden scores. Higher values on the indicators shows higher need for the State (e.g., higher
share of COVID-19 cases, higher percentage of households without broadband access, etc.). The
States were then ranked based on their total burden scores. Points were then awarded by the
percentile of their rank as indicated below.
Percentile Number of Points Awarded State Ranks3
81st to 100th percentile 20 43 through 52
61st to 80th percentile 16 32 through 42
41st to 60th percentile 12 22 through 31
21st to 40th percentile 8 11 through 21
20th percentile and below 4 1 through 10
2 Each indicator is worth 25 points out of 100 possible total burden points.
The State with the highest burden for an indicator is awarded 25 points and
all other States are assigned points based on the percentage of their burden
relative to the state with the highest burden for that indicator. Total
burden is the sum of all the points for each indicator.
3 Higher scores indicate higher burden.