Copenhagen business school drives sustainability at roskilde festival using cloud data analytics
•
2 likes•889 views

A nonprofit humanitarian organization in Denmark gains faster insights into crowd movements and sales data, supporting sustainability, achieves smart optimization of safety, catering, energy, water and waste management and increases scalability with cloud- based analytics and a cloud- based Big Data lab on IBM Bluemix, IBM SPSS and IBM Watson Analytics technologies, running on a SoftLayer infrastructure, to seamlessly correlate data from multiple sources.

Recommended
Recommended
More Related Content
Similar to Copenhagen business school drives sustainability at roskilde festival using cloud data analytics
Similar to Copenhagen business school drives sustainability at roskilde festival using cloud data analytics (20)
More from Carlos Tomas
More from Carlos Tomas (8)
Recently uploaded
Recently uploaded (20)
Copenhagen business school drives sustainability at roskilde festival using cloud data analytics
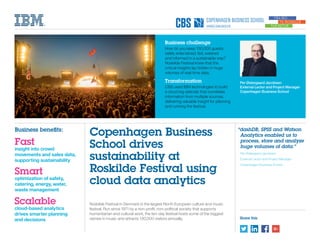
- 1. Share this Per Østergaard Jacobsen External Lector and Project Manager Copenhagen Business School Roskilde Festival in Denmark is the largest North European culture and music festival. Run since 1971 by a non-profit, non-political society that supports humanitarian and cultural work, the ten-day festival hosts some of the biggest names in music and attracts 130,000 visitors annually. Business challenge How do you keep 130,000 guests safely entertained, fed, watered and informed in a sustainable way? Roskilde Festival knew that the critical insights lay hidden in huge volumes of real-time data. Transformation CBS used IBM technologies to build a cloud big data lab that correlates information from multiple sources, delivering valuable insight for planning and running the festival. Copenhagen Business School drives sustainability at Roskilde Festival using cloud data analytics “dashDB, SPSS and Watson Analytics enabled us to process, store and analyze huge volumes of data.” Per Østergaard Jacobsen External Lector and Project Manager Copenhagen Business School Business benefits: Fast insight into crowd movements and sales data, supporting sustainability Smart optimization of safety, catering, energy, water, waste management Scalable cloud-based analytics drives smarter planning and decisions
- 2. 2 The urban laboratory For one week each year, a small town called Roskilde on the outskirts of Copenhagen temporarily becomes Denmark’s fourth largest city. The renowned Roskilde Festival attracts 130,000 visitors annually, who camp out and attend more than 170 live music and cultural performances. During the ten-day festival, the crowds buy and consume approximately 200 tons of food and generate 300 tons of waste. There is growing international recognition that mankind needs to make drastic changes to meet the challenges we face around climate change, a point underscored at the 2012 “Rio+20” United Nations conference on sustainable development. Inspired by this conference, researchers at the Copenhagen Business School (CBS) wanted to do more than just talk about sustainability. Recognizing that the local Roskilde Festival could act as a controlled environment for research into major issues affecting urban populations – such as public safety, food supply, energy, water and waste management – CBS sought a technology partner to help it design and run a major research project. With reference to the original Rio+20 conference, CBS called its project “Rio to Roskilde”. The project was initiated by Professor Esben Rahbek Gjerdrum Pedersen, Centre for Corporate Social Responsibility, CBS and Per Østergaard Jacobsen in 2013. Key participants and stakeholders include: Ravi Vatrapu, Professor, Department of IT Management; Anker Brink Lund, Professor, Department of Business and Politics; Torsten Ringberg, Professor, Department of Marketing; and Mette Morsing, Professor, Centre for Corporate Social Responsibility. Mette Morsing comments: “We see the festival as a microcosm of the complex modern city, and therefore as a potential real-world laboratory with the purpose of improving sustainability issues. Within the context of topics such as resource utilization in food production and consumption, and encouraging voluntary action in reducing waste and energy usage, we wanted to devise and test initiatives to improve sustainability.” Torsten Ringberg adds: “We didn’t know at the outset exactly what we wanted to measure, but we knew that we would be gathering vast quantities of both structured and unstructured data from a variety of sources. We needed a strategic technology partner to help us determine the best way to aggregate, store and analyze the data. The simple goal at the heart of the project was to turn mountains of unstructured, raw data into valuable insights.” Preparing for unknowable challenges Based on IBM’s experience with urban sustainability projects all around the world, and its portfolio of data management and analytics applications, CBS asked IBM to partner together on the Rio to Roskilde project. Jointly, CBS and IBM set out to create a big data laboratory capable of capturing and processing vast amounts of data for open-ended analysis. “We wanted a partner with a deep understanding of the issues around sustainability in the urban context,” says Per Østergaard Jacobsen, External Lector and Project Manager for the Rio to Roskilde project at CBS. “The IBM Smarter Cities consulting practice clearly had the right background, and we also had first-hand experience at CBS of using IBM’s world-class portfolio in data mining and analytics software.” Although the Roskilde Festival takes place only once a year, the planning and preparation for each new event runs throughout the previous year. Likewise, the Rio to Roskilde project was set up as an ongoing, multi-year investigation designed to absorb new sets of data from each year’s festival. Each new festival from 2016 onwards will augment and enrich the existing data, and act as a test bed for refining the existing predictive algorithms. At the outset of the Rio to Roskilde project, the team did not want to set in stone the kinds of analysis that it would be doing on data gathered from sources such as ticket sales, social media feeds, vendor sales and a location-aware mobile app. Rather, it intended to use the initial set of data from the 2015 festival to explore all of the possibilities and determine the most promising avenues of inquiry. At the top level, the project intended to look at topics such as: the movement of crowds throughout the event; the sales of food and beverages over time; and the popularity of different musical events. Within these, the team expected to look at interesting correlations in order to answer questions such as, ‘If person X is interested in musician A, how likely is it that they will also be interested in musician B?’ – where the answer could have implications for planning future events and understanding the likely movement of crowds during the festival. This relatively freeform approach called for a highly flexible solution, which IBM provided in the form of a cloud-based analytics environment running on IBM Bluemix® on SoftLayer®.
- 3. 3 “The advantage of gathering and analyzing data in the cloud was the speed and agility it gave us at the start of the project,” explains Per Jacobsen. “One day, we just had a room containing a table and some chairs. The next day, we had a fully functional big data laboratory!” The IBM solution was designed to process, store and analyze huge volumes of data, including unstructured data from 12,000 interviews with concertgoers. Data is stored in IBM dashDB™, a fully managed cloud data warehouse service offering extremely fast response times and direct connectivity to the chosen analytics tools: IBM Watson™ Analytics and IBM SPSS® Modeler. IBM Watson Analytics provides guided, natural-language-driven, highly visual analysis of correlations between data, while IBM SPSS supports deep analysis by data scientists. The CBS team also uses SPSS for cleaning and merging incoming data and performing association analysis. The IBM solutions all run on SoftLayer, an IBM cloud platform that provides a scalable, secure, high-performance platform for cloud services. Clustered across the SoftLayer data centers in Amsterdam and London, the cloud platform offers geo-redundant high availability and keeps data legally within the EU to ensure compliance with privacy regulations. “We needed to gather, process, store and analyze a huge volume of both structured and unstructured data, and to understand what would be the most valuable lines of inquiry within our datasets,” says Ravi Vatrapu. “The IBM Analytics solution gave us an intuitive way to tackle our big data challenge and to start generating extremely interesting and valuable insights that will help improve the sustainability of the Roskilde Festival.” Seeing patterns in the noise A major area of interest for the Rio to Roskilde project is to understand the movement of people around the festival site and to see how it correlates with particular events and with the ambient temperature. For the 2015 festival, this was accomplished by polling the location of opted-in smartphones every two minutes, then plotting these locations on a map. The team drew polygons on the map to mark the boundaries of the various stages, camping areas, food courts, shower blocks and so on, and then created a time-lapse animation showing the movement of people over the course of the festival. A color-coding system showed hot spots, which were naturally seen to correlate most strongly with the time and location of major events such as concerts by headline music acts. “Correlating the position of festival guests with the timing of various performances enables us to look at all kinds of interesting questions,” comments Torsten Ringberg. “With the IBM Analytics solution, users can ask a question in natural language, such as ‘what is the relationship between unique users and total minutes watched of event X’, and the solution will then flag up the most relevant pre-built queries for rapid visualization of the answer. “Using this approach, we are able to answer questions including: how many people visited each concert, how long they stayed, and which different concerts were watched by the same people. We can also understand where different people camped, which food courts and bars were the most popular, and how many people shopped outside of the site during the festival.”
- 4. 4 During the 2015 festival itself, the team was largely focused on gathering the huge volumes of data generated – data that will continue to reveal fresh insights months or even years after the event (in particular, when it is combined and contrasted with data gathered in future festivals). For example, the CBS team is currently working with the IBM Smarter Cities Lab in Dublin to create a more detailed model of the flow of concertgoers over time, which will help the festival organizers enhance planning and build a safer and better experience for guests. “Our insight into who watches which events feeds into safety planning, because you need to make sure that the likely movement of people around the festival site will be manageable,” comments Per Jacobsen. “It’s about the smart use of the available resources to provide the best possible service to people in the places they want to be. The insight from our analysis is helping us to build predictive models that we will test and refine in the 2016 festival and beyond.” Turning to sustainability, another important area of investigation for the Rio to Roskilde project is food sales and wastage. In 2015, the CBS team gathered sales data from the largest food outlet in the festival, looked at trends and volumes over time, and correlated these with the ambient temperature. “As you might well expect, we see that water rises in relative popularity against sodas and beer as the temperature increases. Equally, we see strong correlations between time of day and food items,” says Torsten Ringberg. “For example, there is a morning peak in the sale of strawberry smoothies – presumably as a ‘recovery drink’ – while sales of the roasted pork sandwich peak strongly at 6:00 PM. Insight into sales will help food vendors plan how they stock and prepare food in future events, making an important contribution to both profitability and sustainability.” Professor Esben Rahbek Gjerdrum Pedersen from the Centre for Corporate Social Responsibility at CBS, adds, “Hygiene and safety issues mean that unsold food must be thrown away after it reaches a certain stage in the chain of preparation. By understanding when and where they are likely to sell particular items, food companies can move just the right type and amount of food from the fridge or freezer based on the time of day, the temperature, and perhaps even the type of performance happening nearest to each food outlet. In this way, they can ensure fast customer service and minimize costly wastage. “Naturally, the insights we can gain from this kind of analysis would also be applicable to other contexts and industries, for example airports and shopping malls. All of this contributes to our collective understanding of the earth-to-mouth value chain for food, an important element in increasing sustainability.” New directions in research Beyond the direct sustainability objectives of the Rio to Roskilde project, researchers at CBS are using the rich store of data from the 2015 festival to pursue their own projects – including ten masters’ theses. For example, one study fed lyrics from the top 20 Spotify artists into IBM Watson Personality Insight—available within IBM Bluemix—to determine likely personality traits for fans of these artists. These personality types were then matched to festival-goers who watched different concerts. The ongoing goal here is to reveal interesting insights into the likely behavior of people who watch certain combinations of artists. For example, a person deemed to have an adventurous personality is statistically more likely to try different food items and less likely to be tied to a particular brand.
- 5. By building and testing behavioral models using the rich data from the 2015 festival, researchers can potentially contribute to a wider understanding of factors that drive customers to churn – which would be of huge value to consumer companies, especially for those where churn is a key metric, such as mobile network operators. A better understanding of personality-driven purchasing behavior would also help retail companies tailor offers and target differently worded promotions to different groups of customers, potentially driving up conversion rates. Ravi Vatrapu comments: “One great thing about the IBM Analytics solution is how quickly students from a business background were able to grasp the technology. In particular, we were up and running with Watson Analytics within a very short time frame, and students needed just a couple of hours of training to be able to start getting genuine insight from the data.” On the technical side, a key challenge for the Rio to Roskilde project was the fact that the data types and data volumes were essentially unknown at the outset. “In addition to the historical data, we knew that our new mobile app would be gathering huge volumes of geolocation data – as it turned out, we collected 91 million tracking points during the 2015 festival – so it was vital to deploy a highly scalable solution,” recalls Ravi Vatrapu. “Running on the SoftLayer cloud infrastructure effectively gives us limitless scalability, with the ability to start small and grow as much as we need. We simply couldn’t have accomplished the project without this scalable cloud solution.” Supporting this mobile topic, the Rio to Roskilde project team received assistance and data from a research team at Munich University. Building on fresh insights Using its cloud-based solution to analyze data from the 2015 Roskilde Festival, the CBS team has already revealed fascinating insights into what people watched and consumed, where they went and where they slept, and how the temperature and time of day affected their purchasing behavior. Examining all the correlations and cross-correlations between the vast stores of data is an ongoing task, and the real value will come when the team can overlay 2016 data and start to benchmark initiatives to improve sustainability, safety and convenience. Per Jacobsen explains: “We often use the analogy of setting up a restaurant when we talk about the Rio to Roskilde project. So far, we have devised the menu and worked out how to combine the ingredients, and we now look forward to opening up to diners at the 2016 festival. The 2015 data has given us a baseline and enabled us to understand the kinds of questions we can answer.” For 2016, CBS plans to get closer to real-time analytics so that it can help the festival organizers to identify queues and emerging congestion in the flow of people around the site. An opt-in mobile app will provide live alerts and recommendations to festival-goers, helping reduce the risk of accidents. Festival organizers will potentially display information on where the shortest queues are in order to optimize access to food outlets and toilets, and the food-outlet operations will be able to use predictive algorithms to determine the best mix of foods and beverages to prepare based on the time of day, the upcoming events and the weather conditions. This in turn will help to optimize food delivery and recycling schedules, reduce energy usage and cut food waste.
- 6. Please Recycle Solution components • IBM® Bluemix® • IBM dashDB™ • SoftLayer® • IBM SPSS® Modeler • IBM Watson™ Analytics Take the next step IBM Cloud Data Services offers a complete portfolio of data and analytics services providing unique and seamless product integrations to build apps faster and gain new insights easier with flexible deployment and pricing options. For more information about how IBM Cloud Data Services can help businesses solve tough big data problems rapidly and cost-effectively, please visit ibm.biz/clouddataservices. IBM Analytics offers one of the world’s deepest and broadest analytics platform, domain and industry solutions that deliver new value to businesses, governments and individuals. For more information about how IBM Analytics helps to transform industries and professions with data, visit ibm.com/analytics. Follow us on Twitter at @IBMAnalytics, on our blog at ibmbigdatahub.com and join the conversation #IBMAnalytics. Connect with us © Copyright IBM Corporation 2016, IBM Corporation, 1 New Orchard Road, Armonk, NY 10504 U.S.A. Produced in the United States of America, February 2016. IBM, the IBM logo, ibm.com, Bluemix, dashDB, IBM Watson, and SPSS are trademarks of International Business Machines Corp., registered in many jurisdictions worldwide. Other product and service names might be trademarks of IBM or other companies. A current list of IBM trademarks is available on the Web at “Copyright and trademark information” at ibm.com/legal/us/en/copytrade.shtml. SoftLayer® is a registered trademark of SoftLayer, Inc., an IBM Company. This document is current as of the initial date of publication and may be changed by IBM at any time. Not all offerings are available in every country in which IBM operates. The performance data and client examples cited are presented for illustrative purposes only. Actual performance results may vary depending on specific configurations and operating conditions. THE INFORMATION IN THIS DOCUMENT IS PROVIDED “AS IS” WITHOUT ANY WARRANTY, EXPRESS OR IMPLIED, INCLUDING WITHOUT ANY WARRANTIES OF MERCHANTABILITY, FITNESS FOR A PARTICULAR PURPOSE AND ANY WARRANTY OR CONDITION OF NON-INFRINGEMENT. IBM products are warranted according to the terms and conditions of the agreements under which they are provided. “In 2015, we gathered just a small proportion of the available sales data; in 2016, we will have almost all of it,” says Ravi Vatrapu. “Social media data is always growing fast, and so we will be doing more in that space. We will also expand the mobile geospatial data set, adding more sources, and poll smartphone locations every minute rather than every two minutes. In some zones, we may also use Wi-Fi triangulation to get a really precise fix on location.” A smarter and more sustainable future For 2016, the CBS team is aiming to help the festival get smarter in six key areas: ticket sales, food and merchandise sales, cloud services, communications, resource utilization and event marketing. This will depend on gathering and correlating more data, and testing the predictive algorithms created after the 2015 event. “We are building towards the ability to ‘nudge’ people and influence their behavior,” comments Mette Morsing. “Sustainability cannot only be imposed from the top down – everybody in society needs to contribute by adapting their behavior, and the first step is to understand the consequences of your actions.” Anker Brink Lund comments: “We want to help concertgoers see their environmental impact in terms of energy usage and waste, and encourage them to take part in experiments to reduce the environmental footprint of the festival. By making them aware of the challenges and the possible solutions in the context of the festival, we hope that we can also get them to take positive action during the rest of the year.” Backed by a fully managed set of data management and analytics tools running in the cloud, CBS is free to focus on performing analysis and gaining new insights. The IBM solution provides constant availability and high performance, with the ability to scale up rapidly and non-disruptively to the challenges of tackling vastly bigger datasets. “For CBS, the overarching goal of the project is to use big data to create a more sustainable future for all through working smarter,” concludes Per Jacobsen. “And for us, working smarter means partnering with IBM.” CDC12349-USEN-01