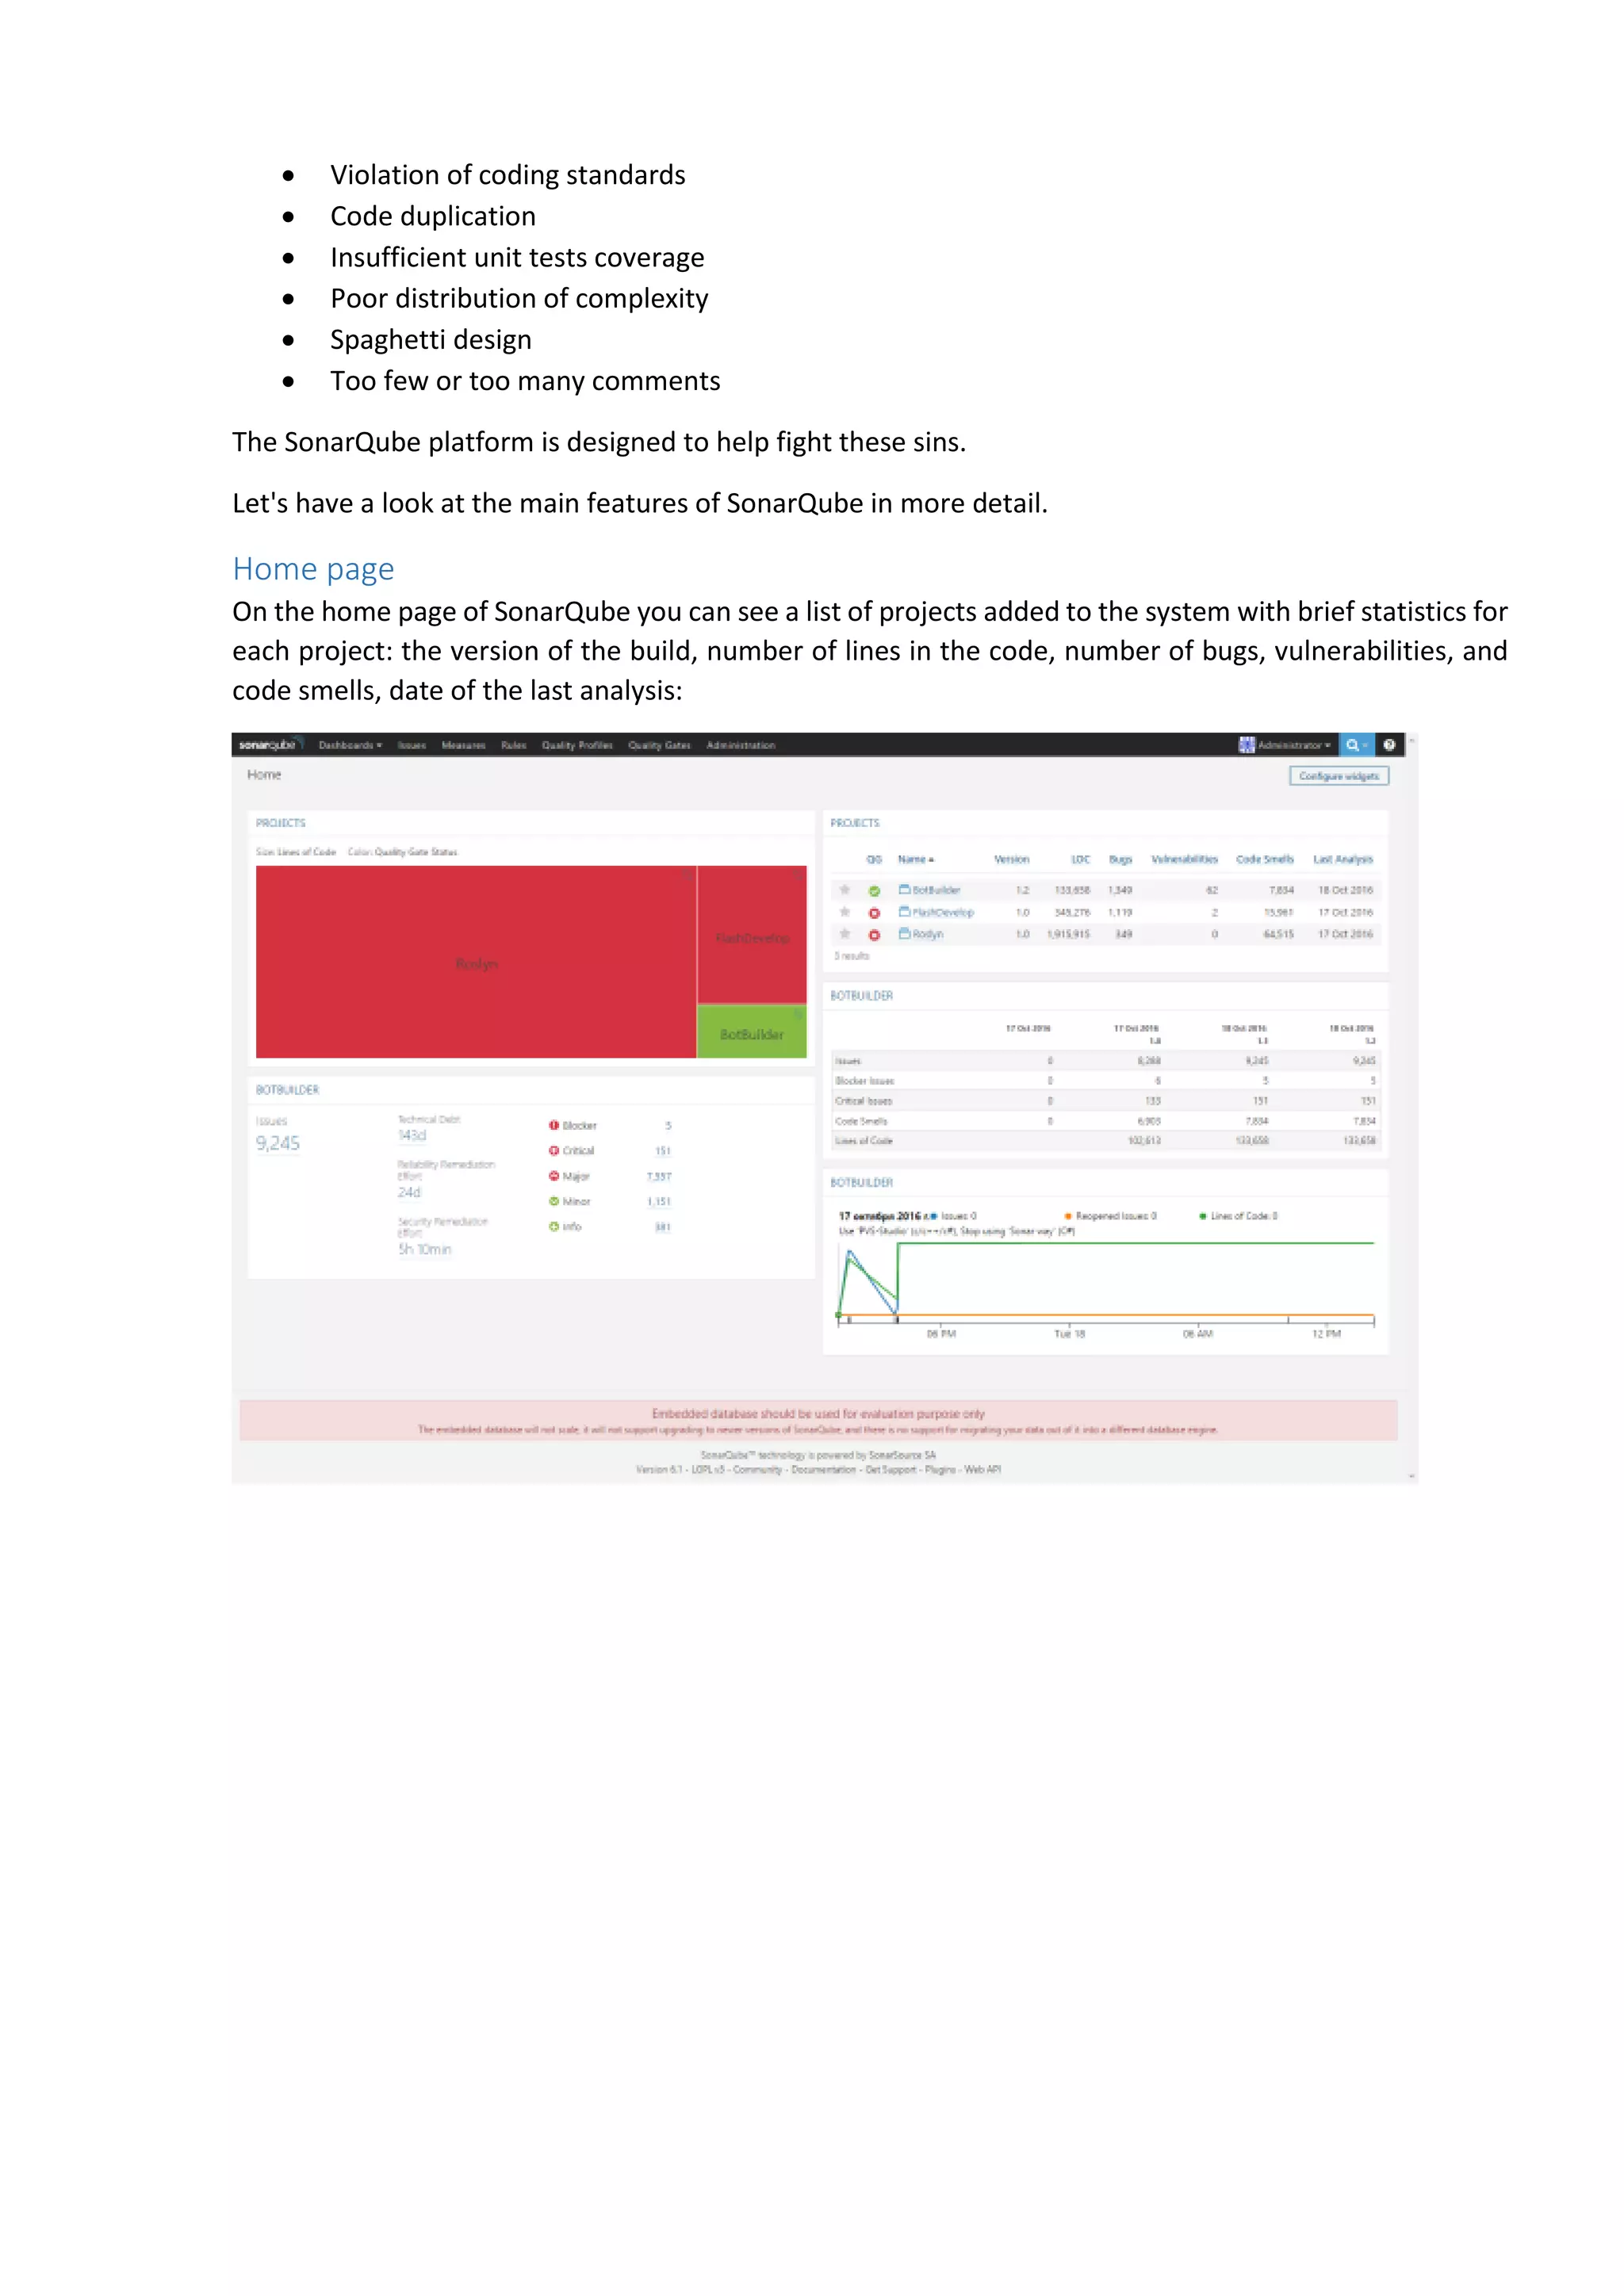
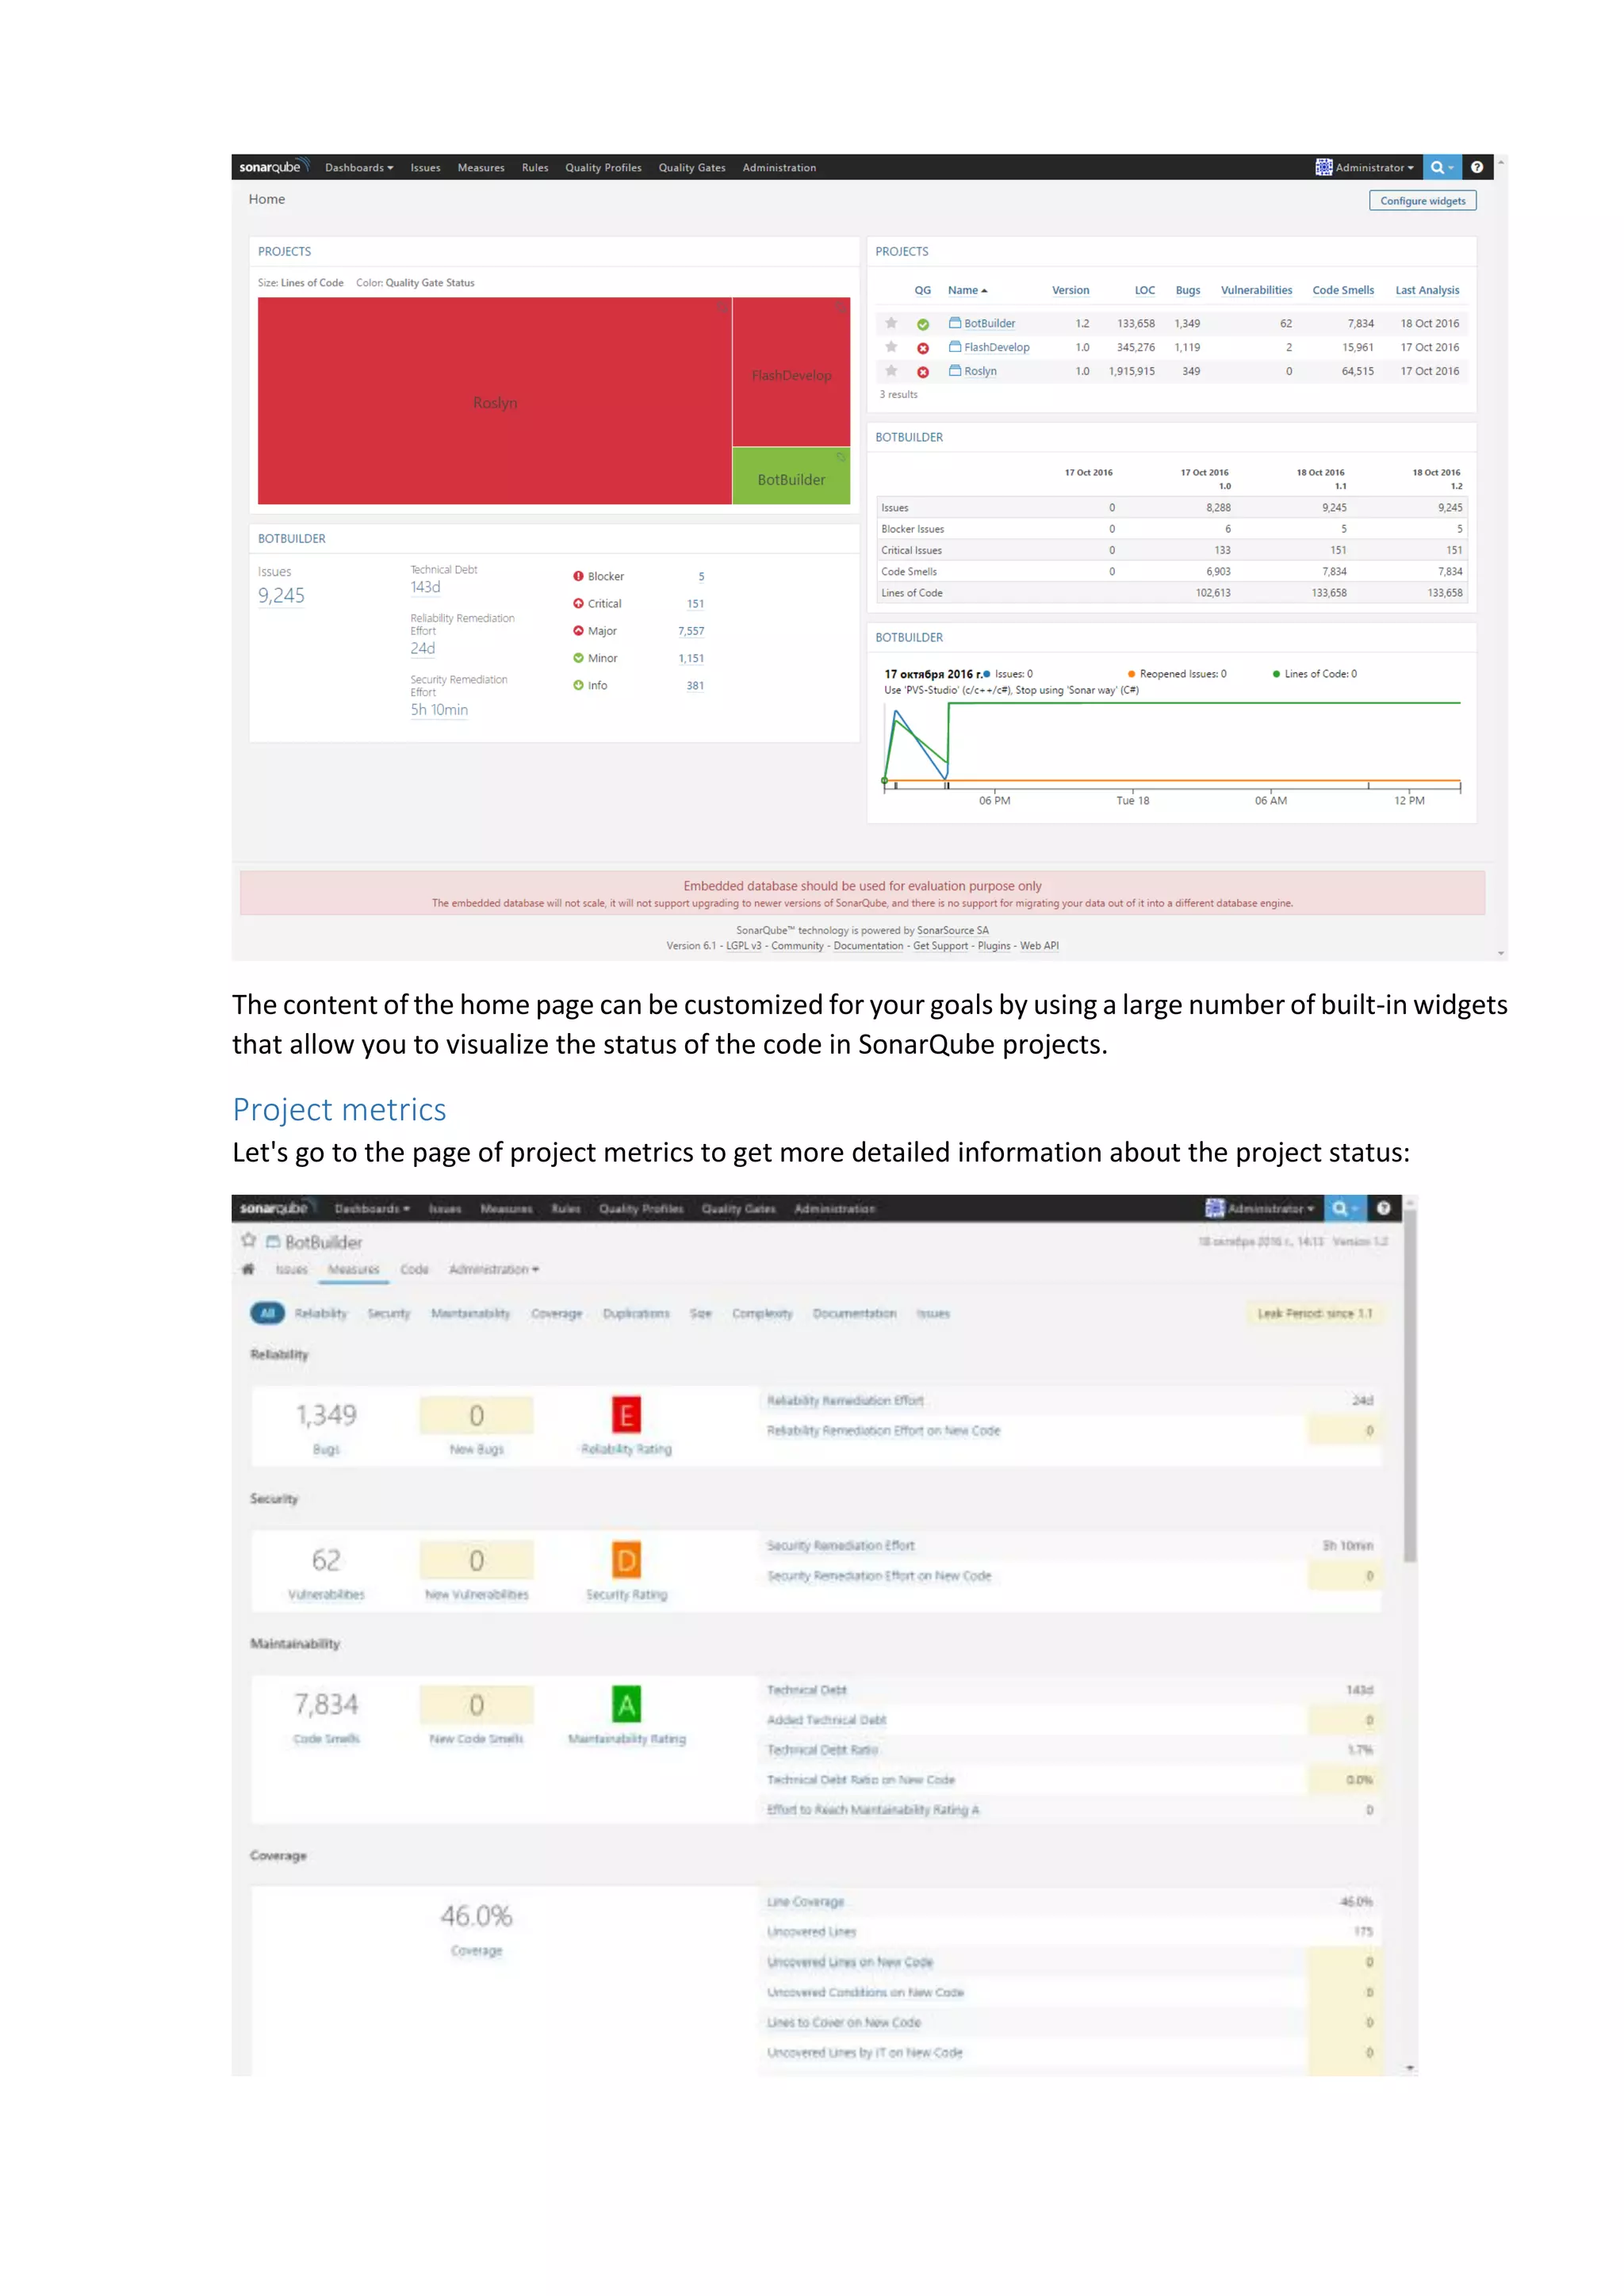
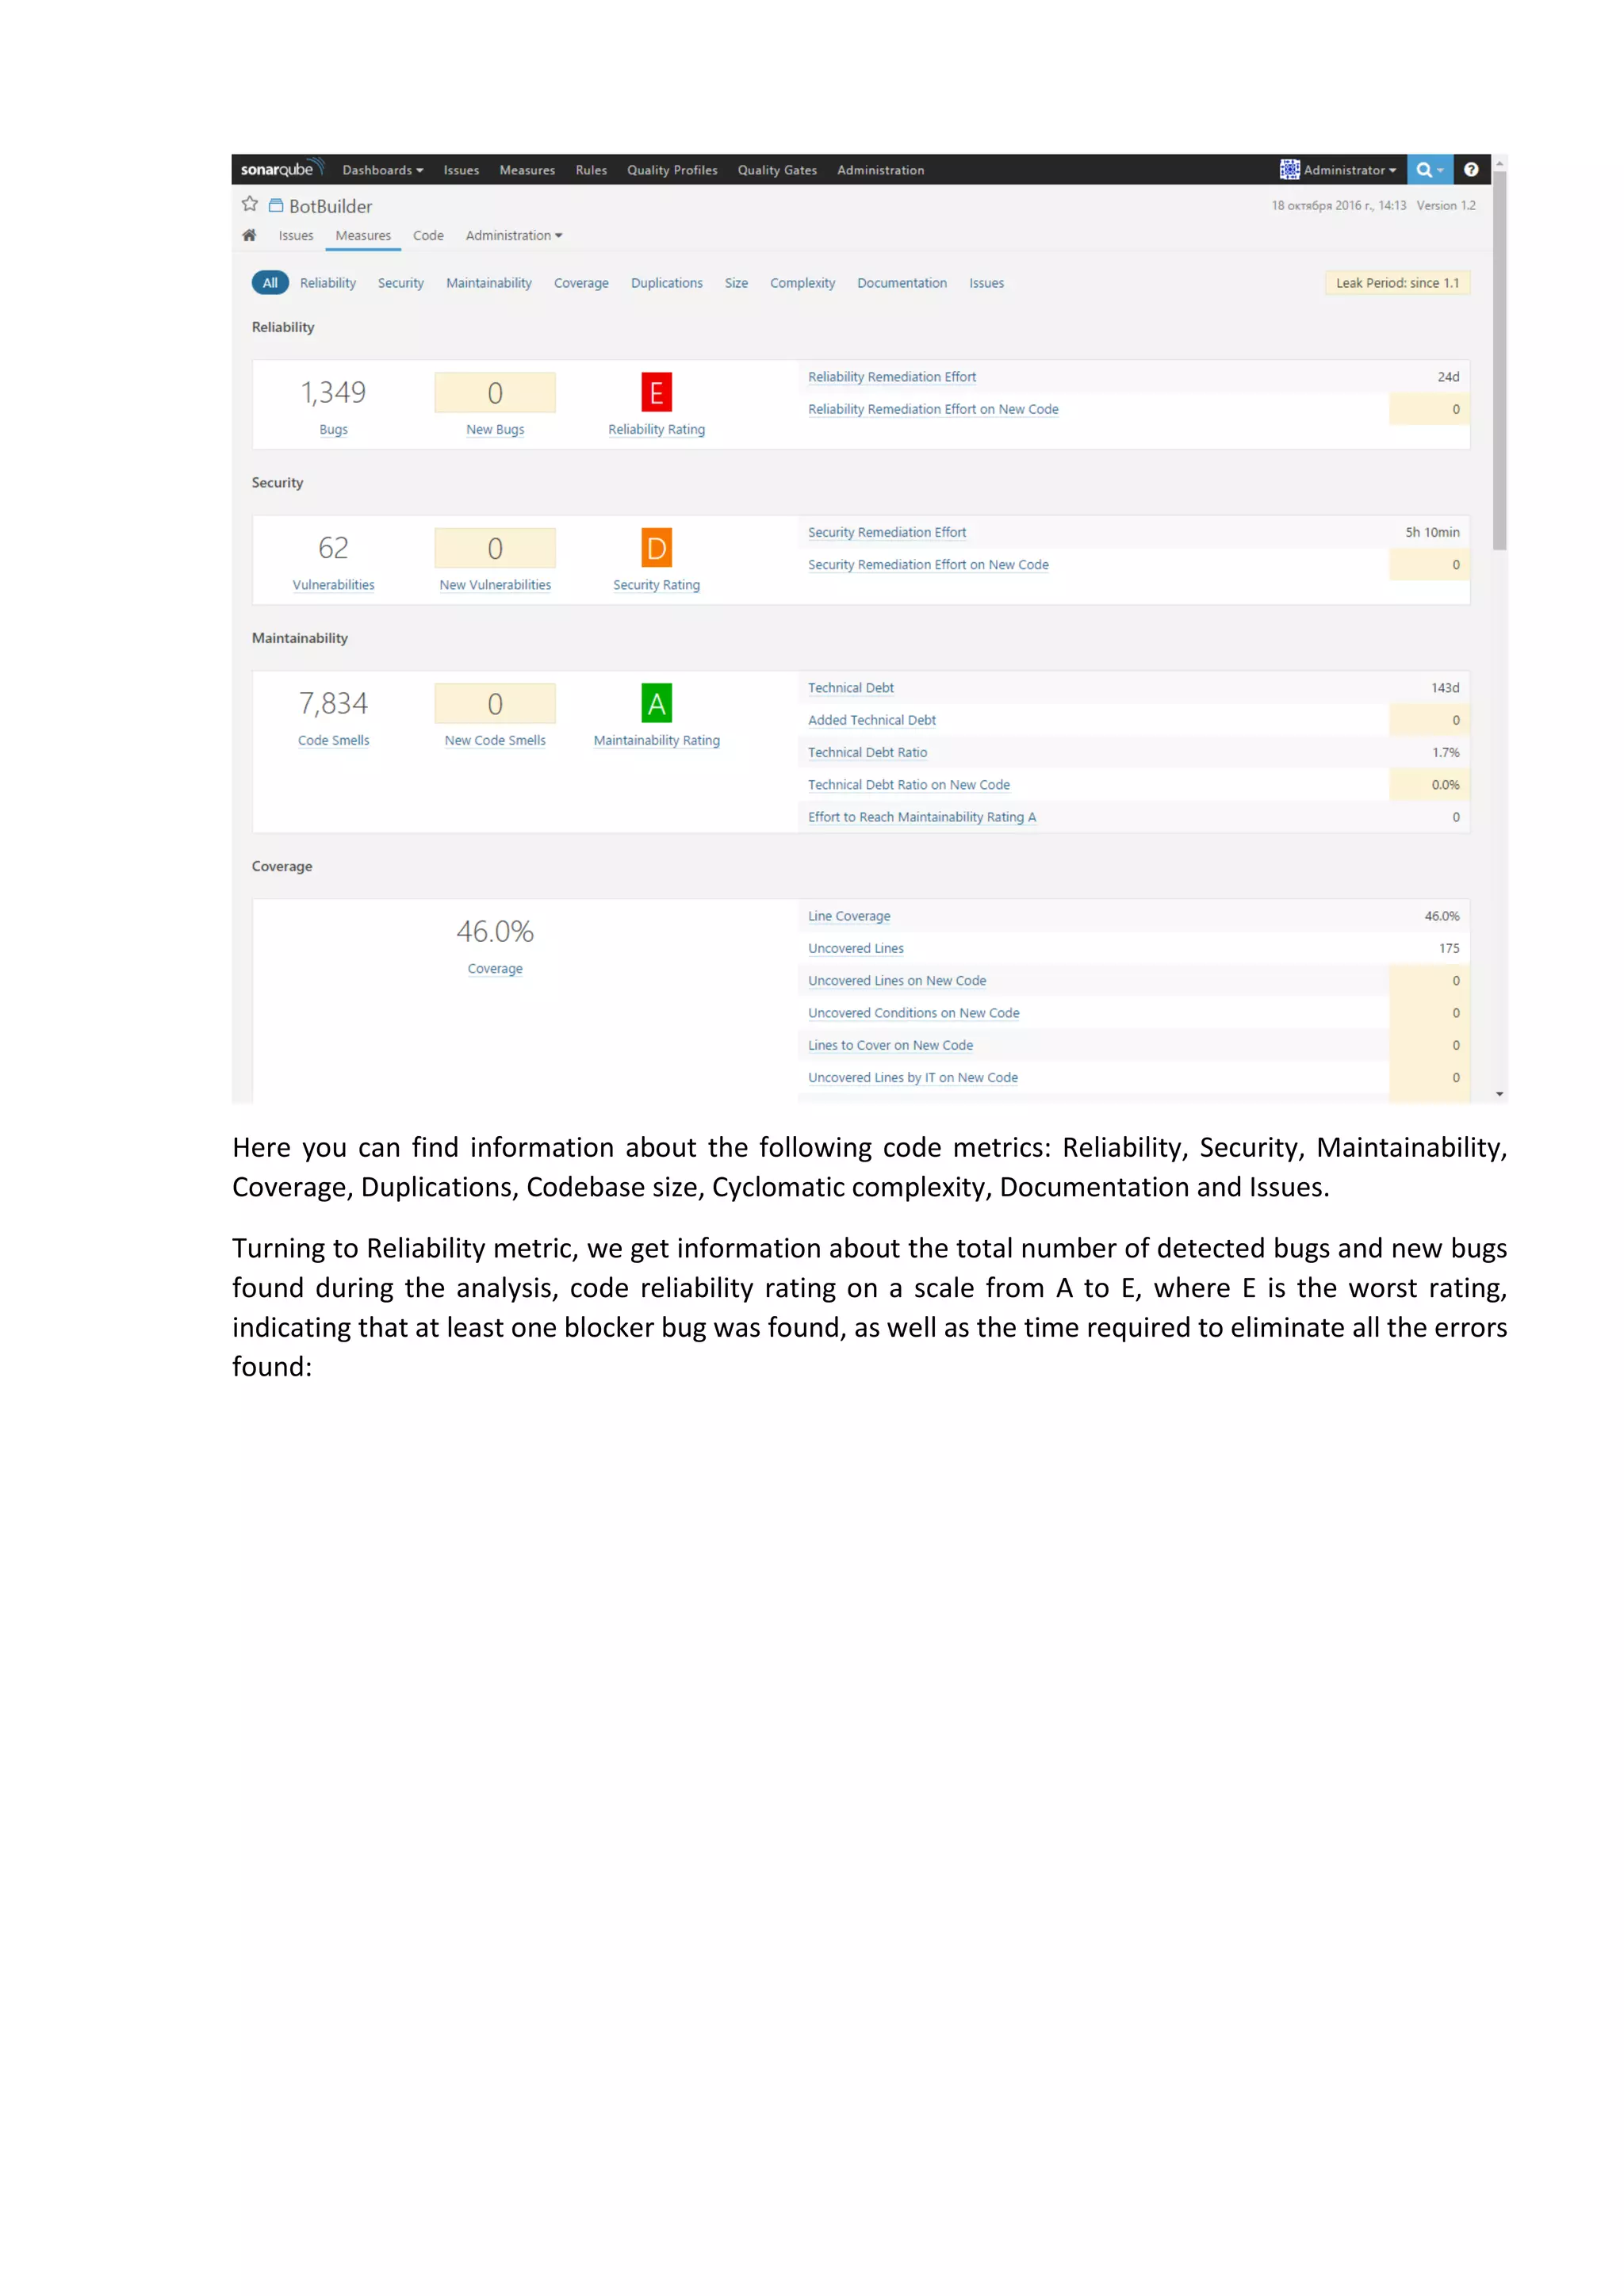
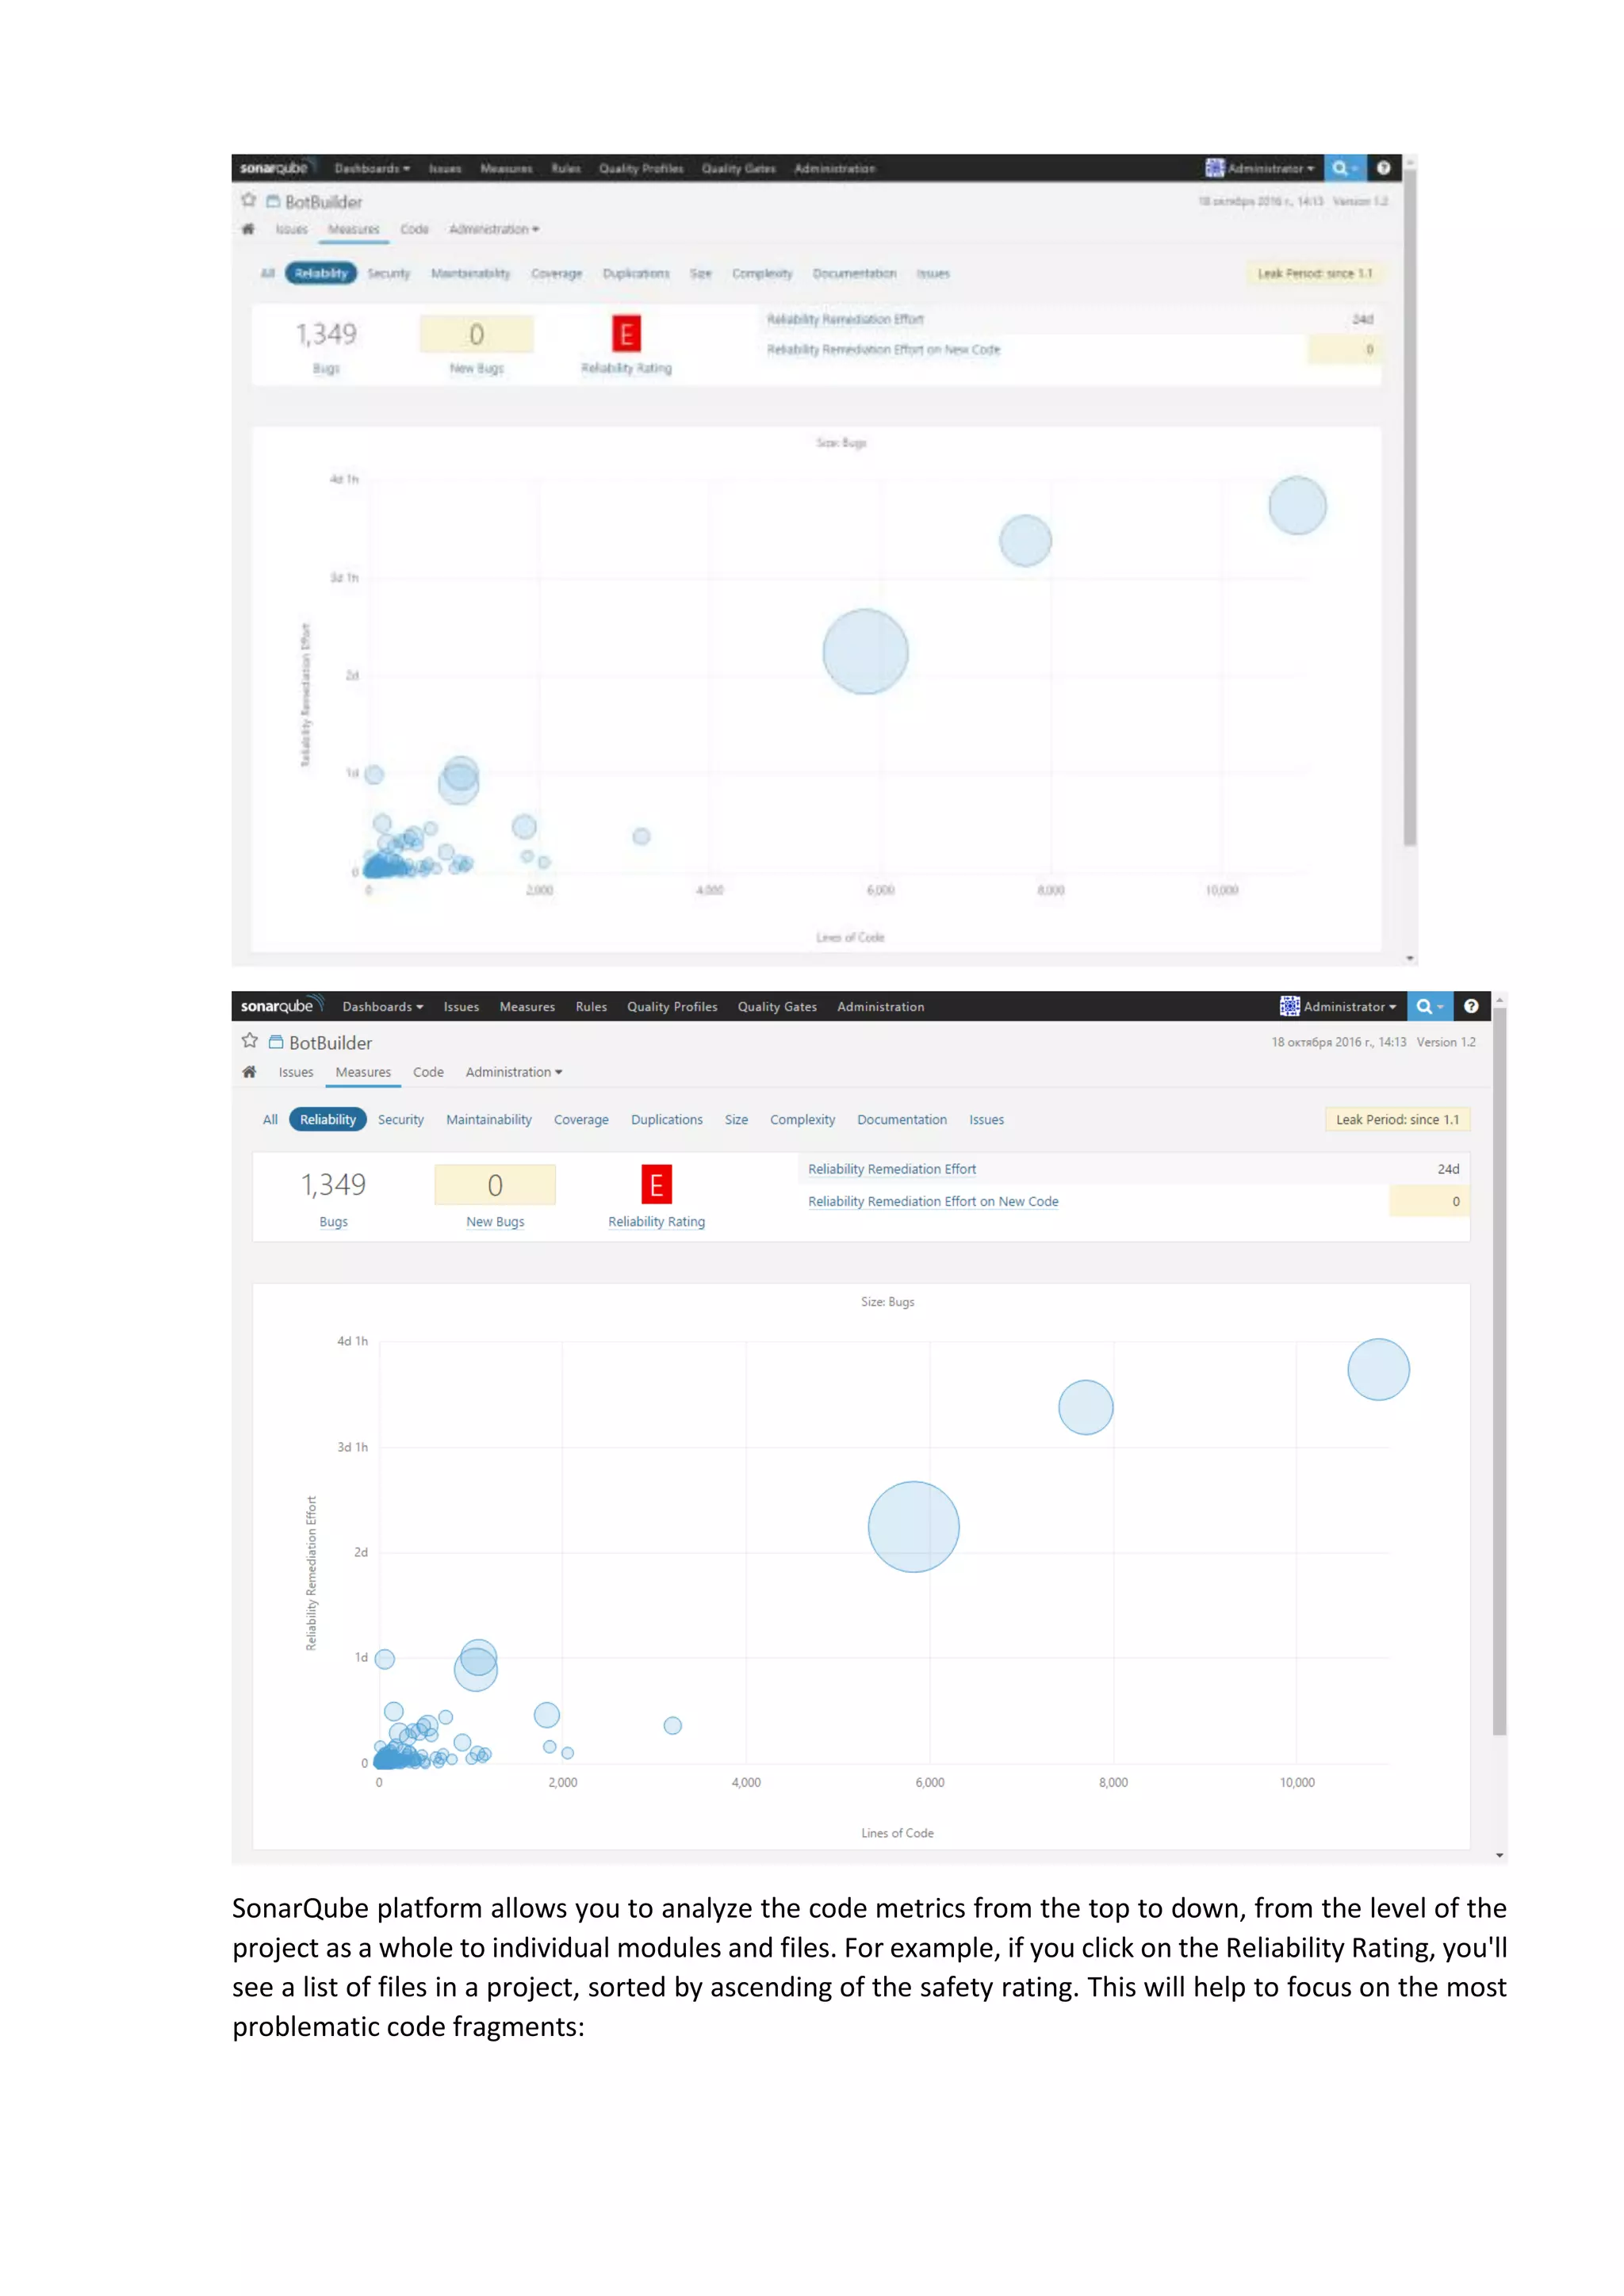
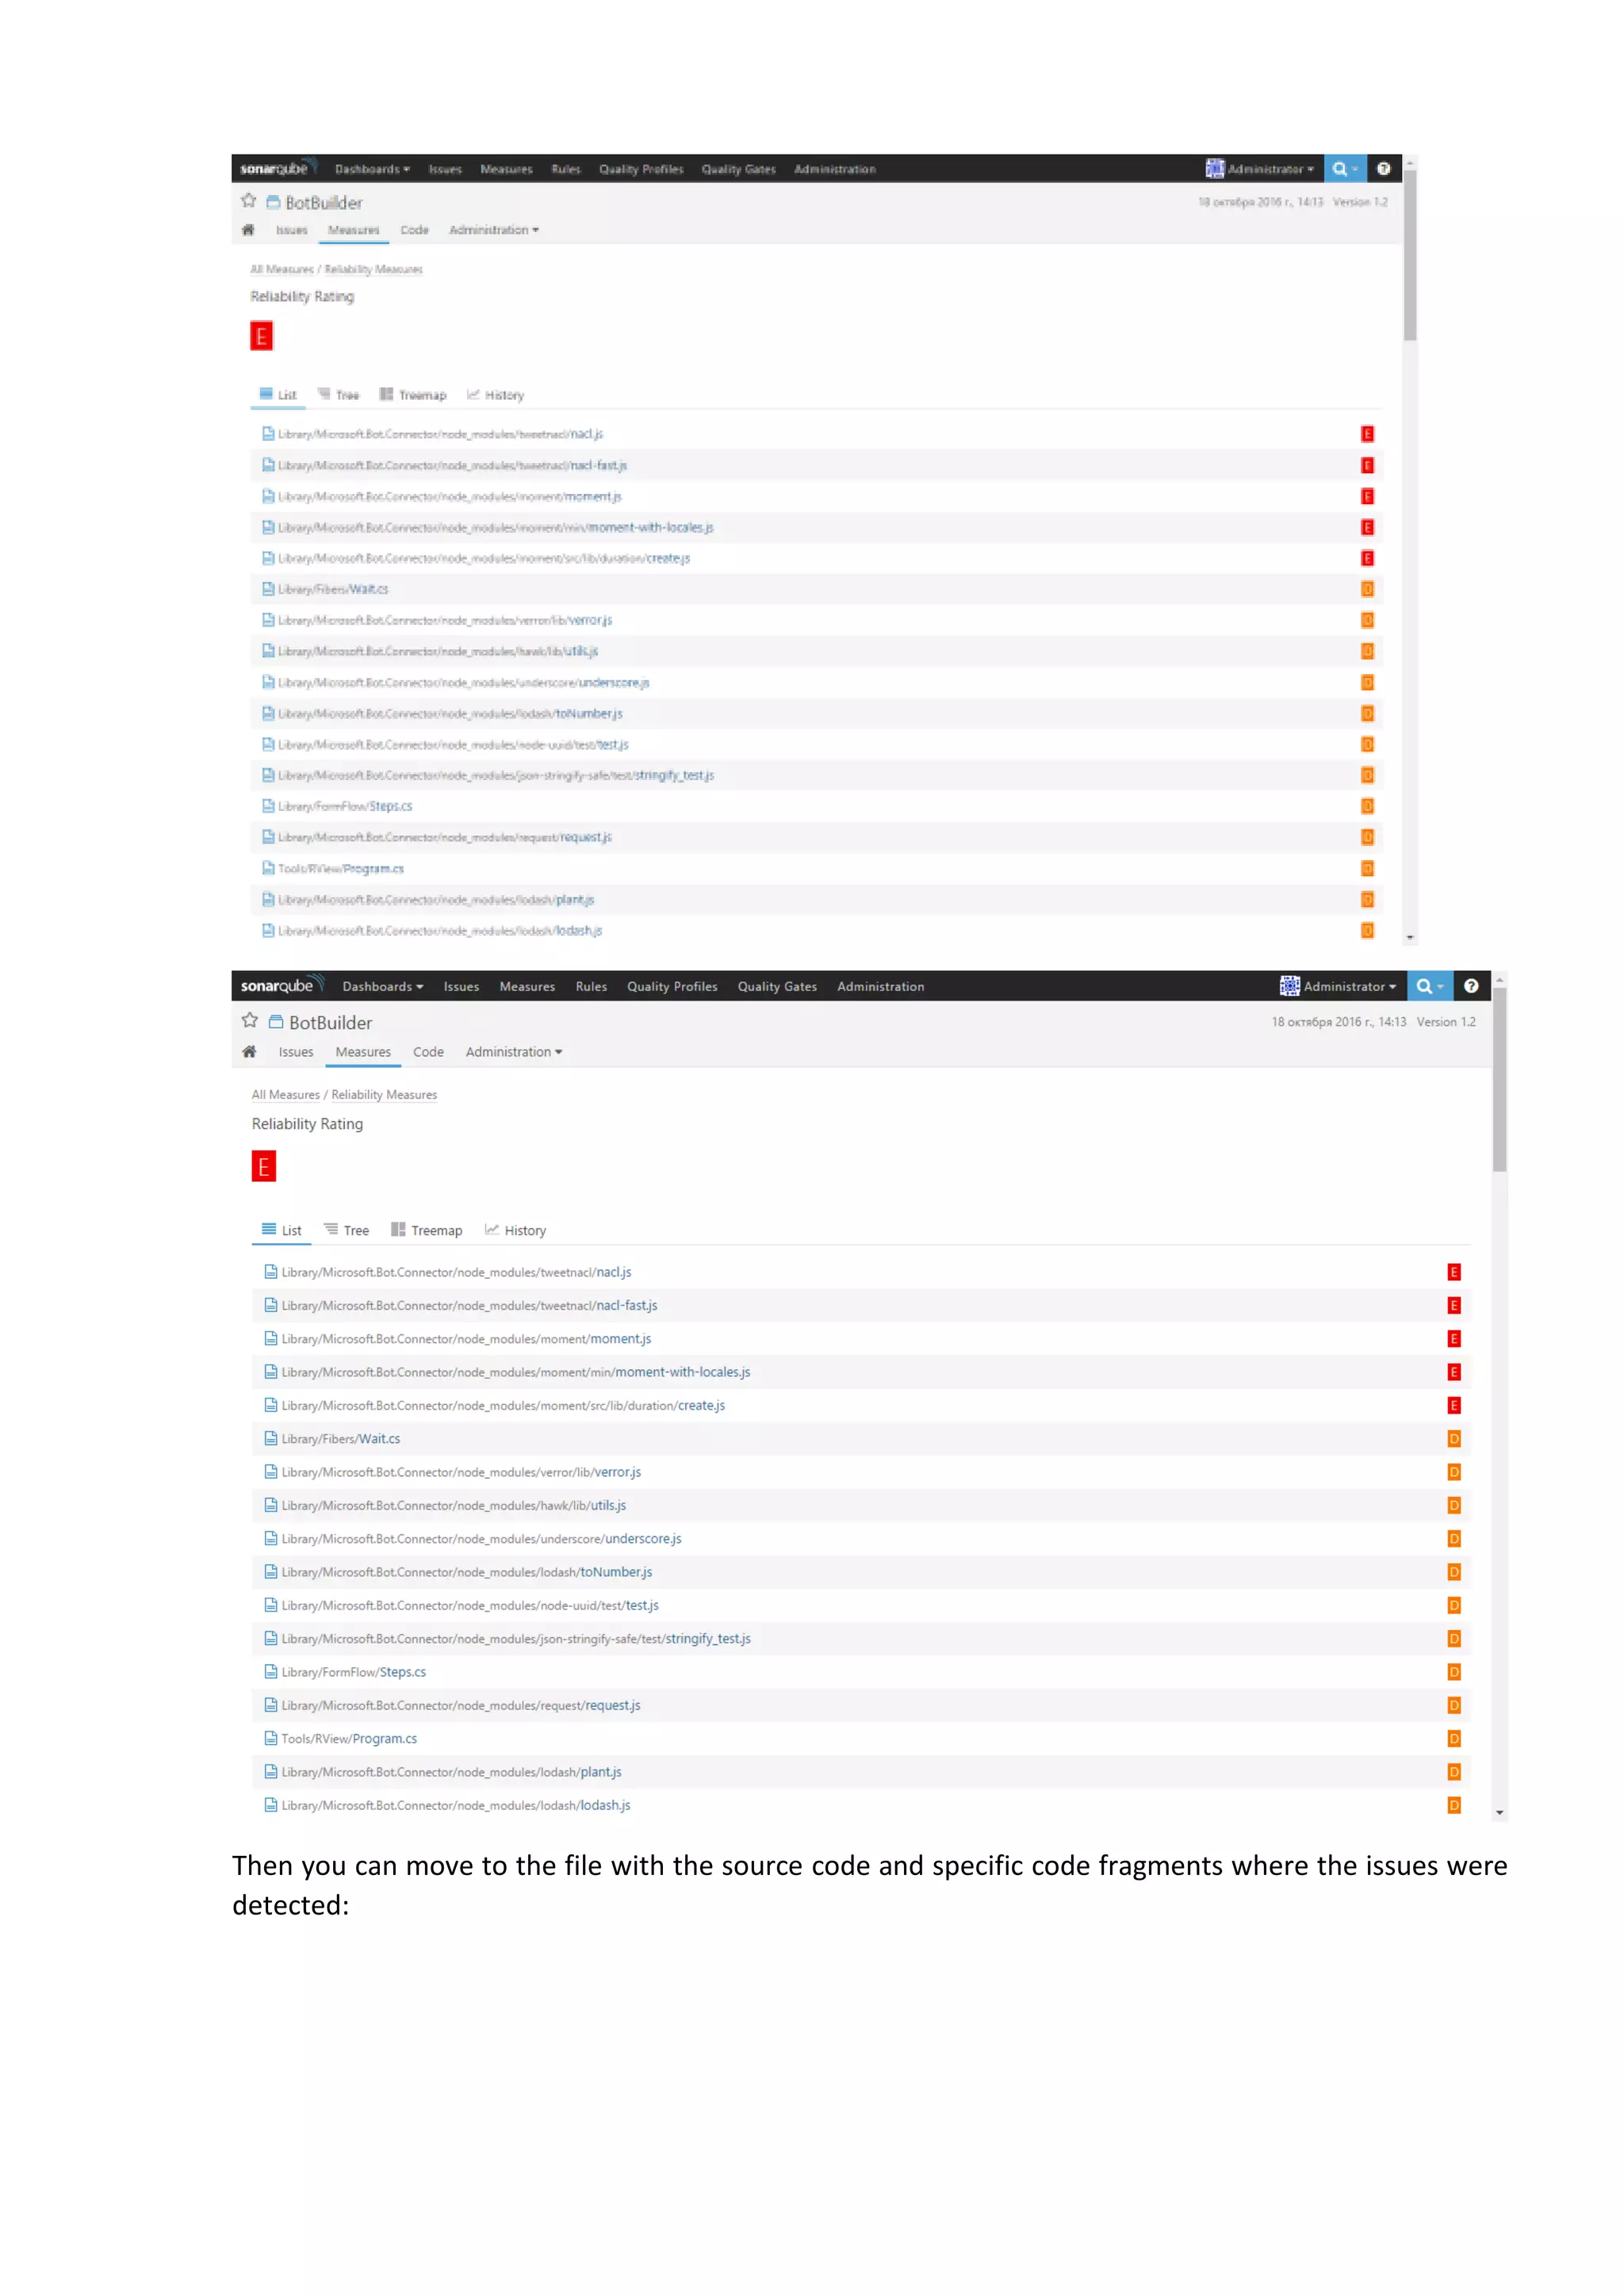
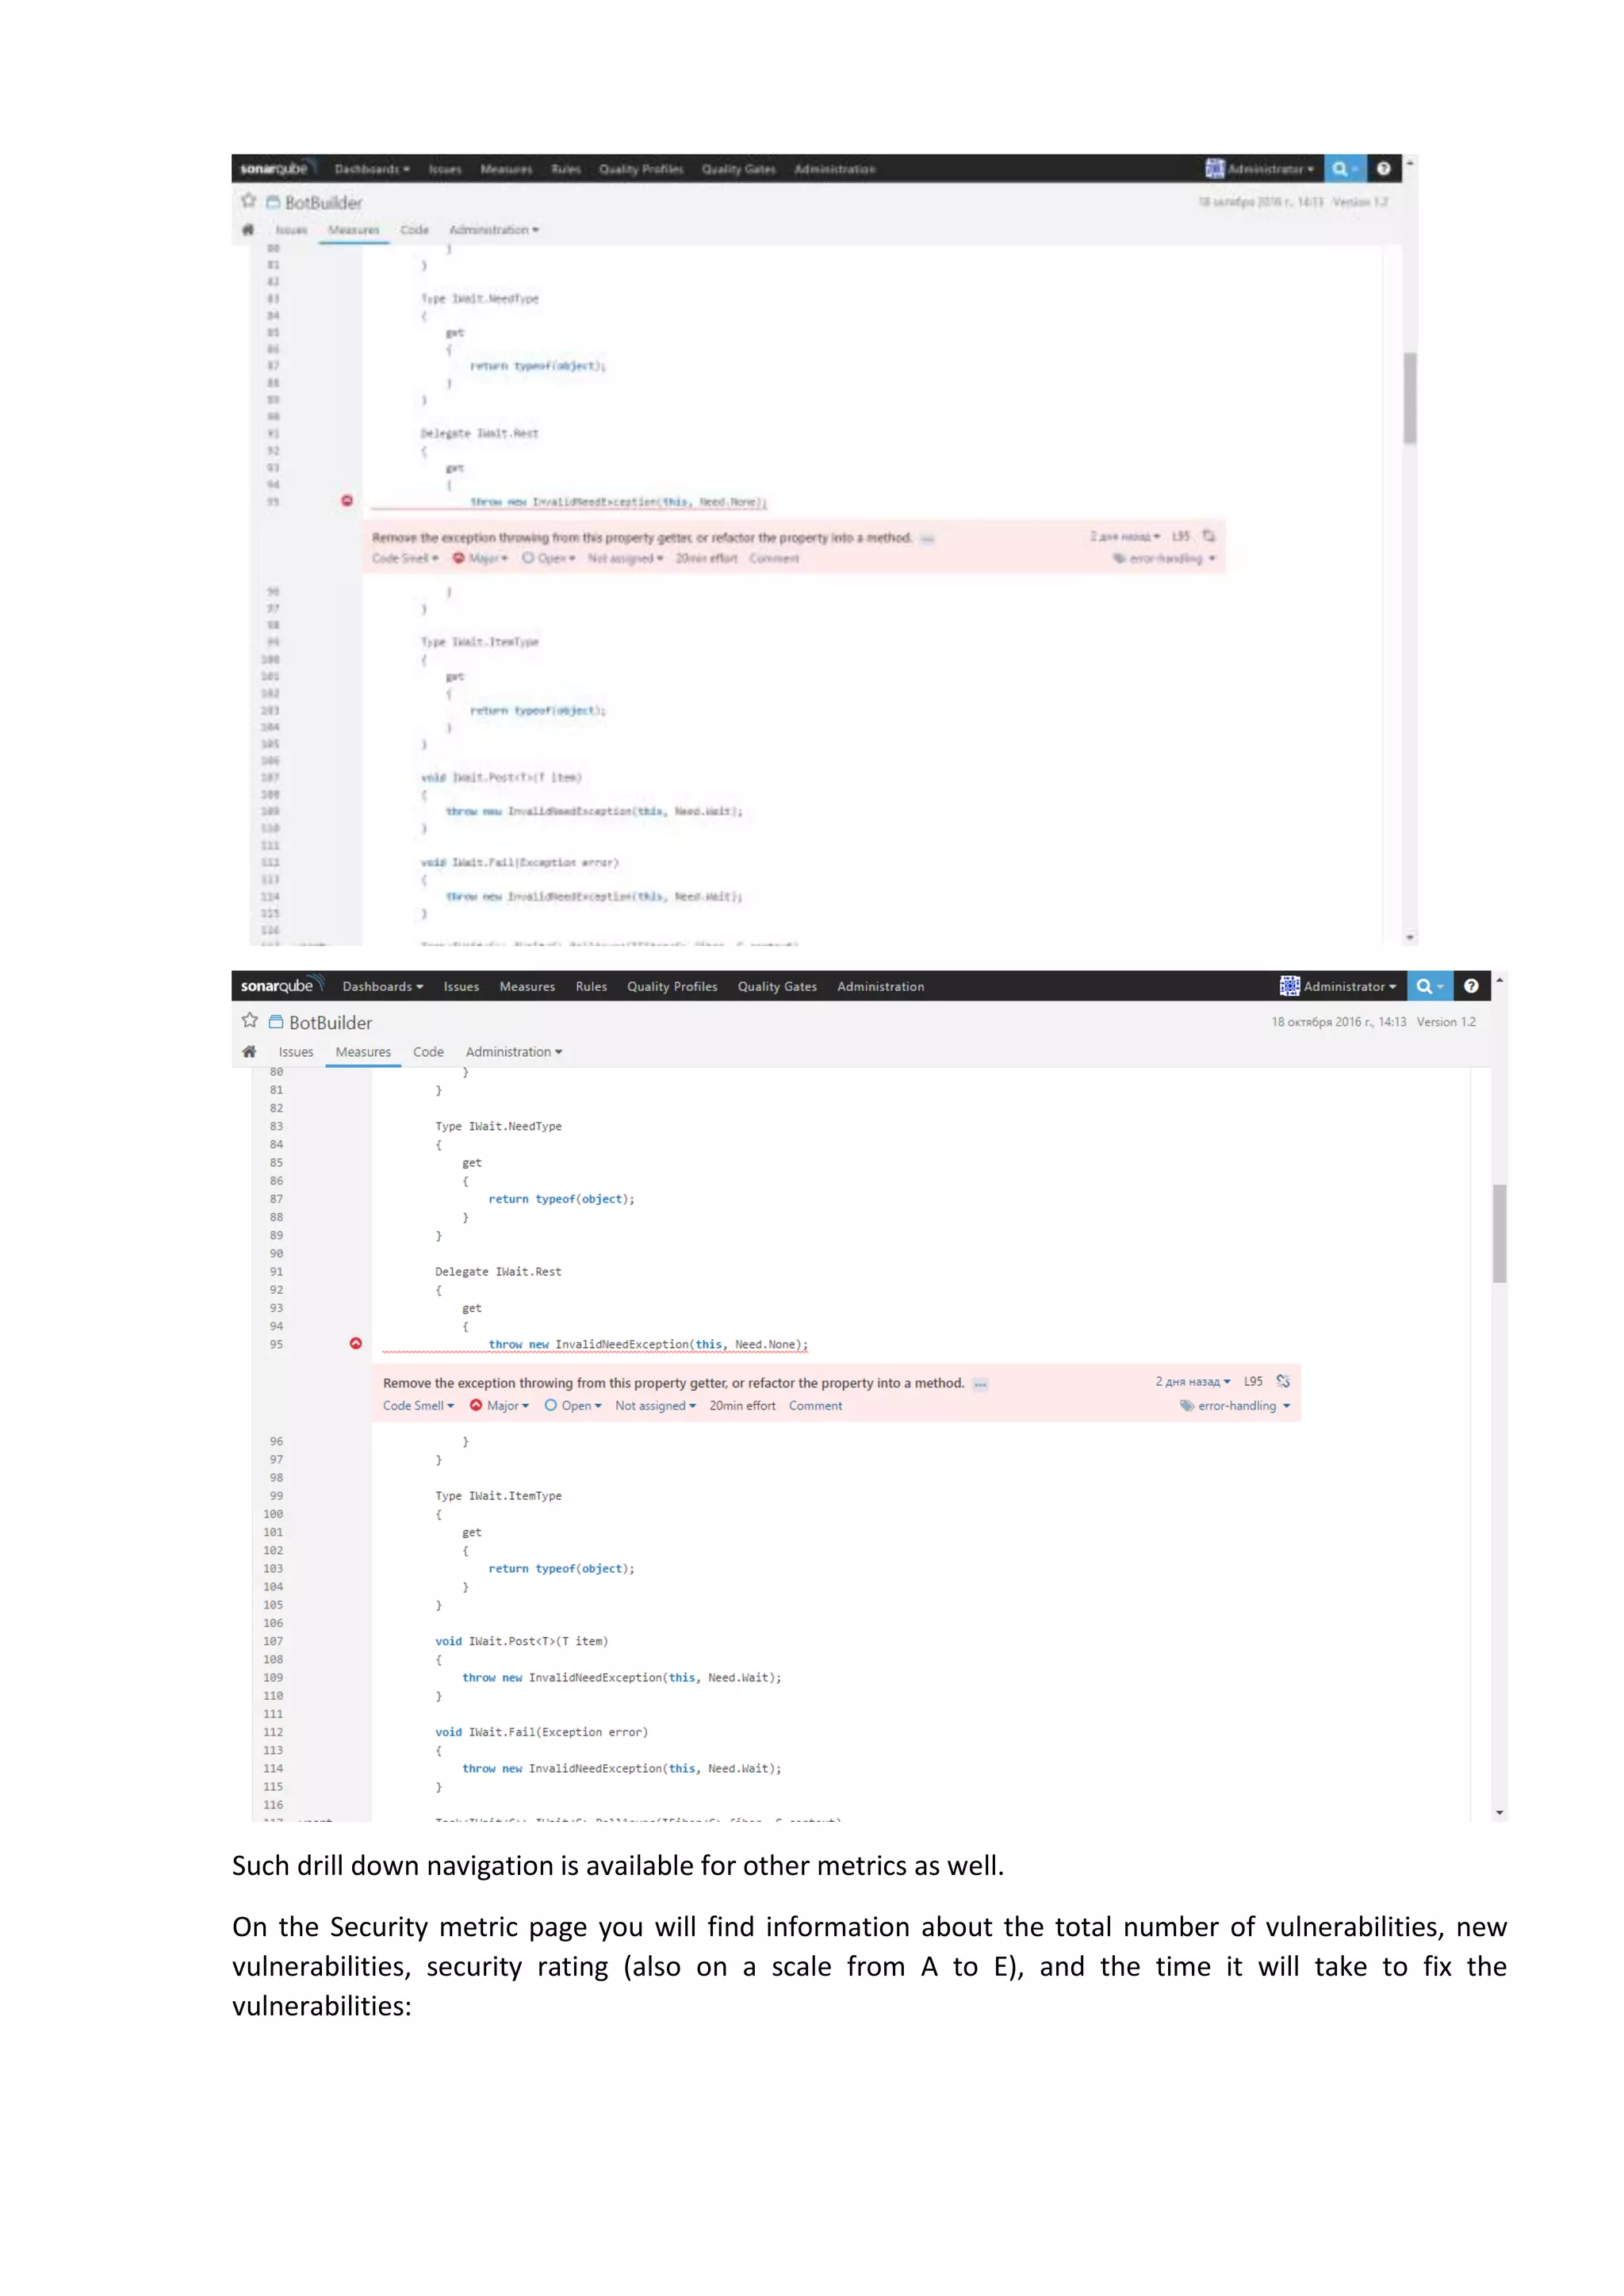
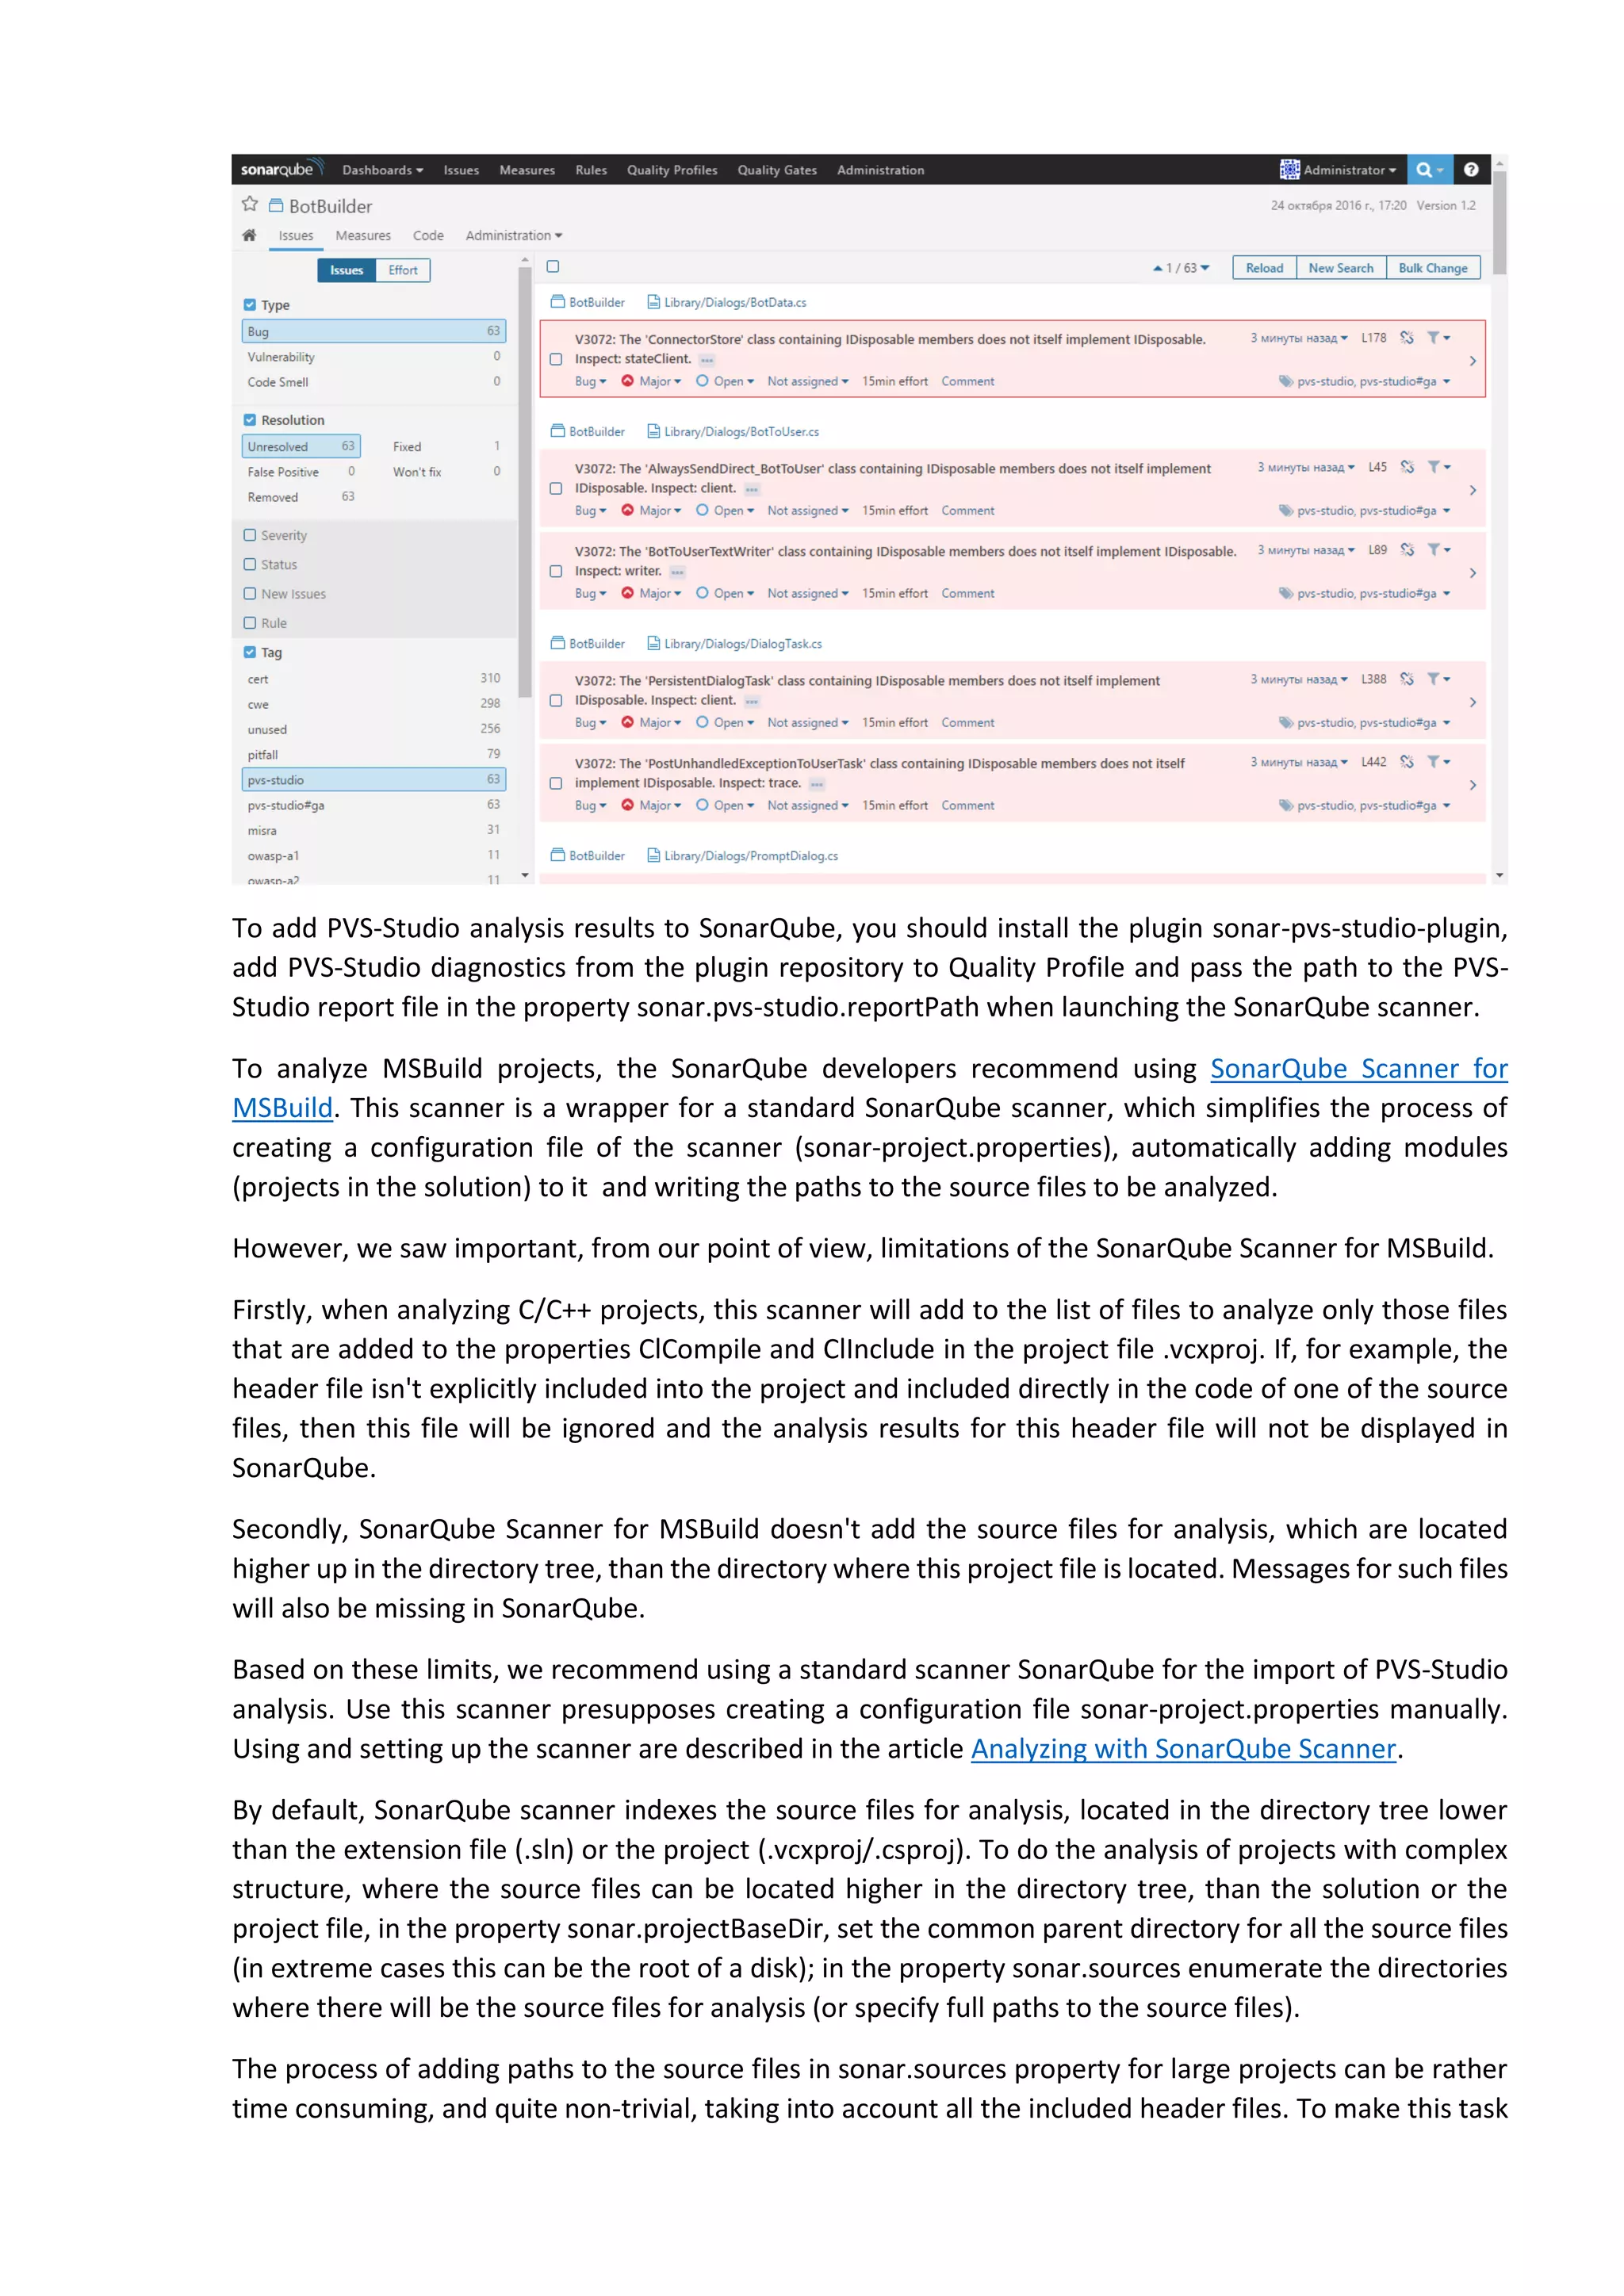
The document discusses the SonarQube platform for continuous analysis and measurement of code quality. Some key features of SonarQube include supporting multiple programming languages, providing metrics on code quality issues like bugs, duplications, test coverage, and technical debt. It integrates with build systems and IDEs and allows customizing dashboards and quality profiles. The author implemented SonarQube for a customer to provide centralized monitoring of metrics for a large, long-term project.
WSO2Con2024 - WSO2's IAM Vision: Identity-Led Digital Transformation
Control source code quality using the SonarQube platform
1. Control source code quality using the
SonarQube platform
Author: Pavel Kuznetsov
Date: 16.11.2016
In this article we'll look at the main features of SonarQube - a platform for continuous analysis and
measurement of code quality, and we'll also discuss advantages of the methods for code quality
evaluation based on the SonarQube metrics.
Introduction
Our company develops a static code analyzer PVS-Studio. We are convinced that the choice of a suitable
methodology for development, following it, and also use of the proven methods and tools significantly
increases the chance that the code will be written correctly and the final product will meet the required
quality standards. One such methodologies is to use static analysis of the source code. Static analysis,
used together with other code metrics, allows assessing the current state of the codebase, dynamics of
this state and potential risks during the project implementation.
To begin with, I'll briefly describe the way the PVS-Studio analysis results are represented. The results of
our static code analyzer PVS-Studio is saved in the xml format. The list of messages with the detected bugs
can be viewed directly in the Microsoft Visual Studio window or a separate Standalone utility. You can
work with these errors, using the navigation along the code, sorting, filtering, suppression of false
positives and so on.
2. The list of the bugs found in the xml format can also be converted into any format, that is most convenient
for reading, for example, html. Such reports with the results of the analysis can be sent by mail to all
project members, who are be interested in that. Another way to inform the project members about the
errors - to send the error lists to those developers who made them. There are special utilities, included
into the PVS-Studio distribution kit to do that.
Speaking about the abilities of PVS-Studio, we should also mention the functionality for mass suppression
of analyzer messages. If static analysis was introduced on the later stages of the application life cycle,
when volume of the code base reached a large size, the code inspection can lead to the detection of a
large number of errors. Perhaps, at this point the team lacks the necessary resources to fix all the bugs.
In this case, developers can hide all the messages issued for the current code revision, and concentrate
on the errors that were found in the newly written or modified code.
3. You can get the dynamics of the errors, found by PVS-Studio using the Analysis Statistics functionality of
the PVS-Studio plugin for Microsoft Visual Studio or the Standalone utility:
The enumerated ways of presenting the work results of our analyzer are in no way connected with other
code metrics, such as the number of code lines, cyclomatic complexity, a number of bugs per 1000 code
lines, the level of coverage by unit tests, duplicating and so on. The report of the found bugs after the
analysis and the amount of these errors doesn't give answers to the questions: do we have a lot of bugs
or not? How is dynamics of the error number is connected with the growth of the codebase? Is the code
quality getting better or worse? And, probably, the most important question from managers: when will it
4. all start working? (how long will it take to fix the errors)? These questions made us think of how to make
the reports of PVS-Studio more valuable and informative.
Why is it useful to collect and control the code metrics? It's impossible to improve something that you
don't measure. Let's suppose that some team does not collect code metrics. With the development of the
project, the code base may become worse and worse, and no one will even notice until the amount of
technical debt reaches such a size at some point, that the support and adding new functionality will cost
more and more. If the team monitored the code metrics constantly, it would track the dynamics of the
code state and would raise the alarm in case a certain threshold was reached.
Further on, let's suppose that the team realized how big their problem is and persuaded their managers
to spend some resources on the improvement of the code quality. The manager will ask several simple,
but reasonable questions: how much time will the team need? What parts of the project need to be
improved? How many bugs are you going to fix? Which criteria will you use to state that the code quality
has reached a required level and you can go back to the development of new functionality? Usage of
metrics will answer all of these questions. If the team registers the current state of the code of each
product component and will determine thresholds for each metric before making the improvements in
the code, then the achievement of these goals will allow stating with some degree of certainty that the
code of the product became more qualitative. There is also a possibility to predict the date when the work
will be finished and to stop when these thresholds are reached. For example, the team will be able to
show the manager that after improvements made in the code, the level of unit tests coverage reached
90%, the compliance with the coding standards of the company in now 95% and the duplication of the
code decreased by 5%.
Why SonarQube?
SonarQube is an open source platform, designed for continuous analysis and measurement of code
quality. SonarQube provides the following capabilities:
The support of Java, C, C++, C#, Objective-C, Swift, PHP, JavaScript, Python and other languages.
It provides reports of code duplication, compliance with the coding standards, unit tests
coverage, possible errors in the code, density of comments in the code, technical debt and much
more.
It saves the history of metrics and builds charts of the changes in the metrics over the time.
It provides a fully automated analysis: integrates with Maven, Ant, Gradle and common
continuous integration systems.
Allows integration with such IDEs as Visual Studio, IntelliJ IDEA and Eclipse using the SonarLint
plugin.
It provides integration with external tool: JIRA, Mantis, LDAP, Fortify and so on.
You can extend the existing functionality using third-party plugins.
It implements the SQALE methodology to evaluate the technical debt.
Quite an impressive list, isn't it? You can get acquainted with the possibilities of SonarQube and try it in
action by clicking on the link https://sonarqube.com/. SonarSource company provides this service for the
analysis of open source projects, and if you have an open project on GitHub, you can upload it into the
service https://sonarqube.com/ and use SonarQube reports to control the code quality of your project.
We have done a thorough research of the SonarQube platform abilities and decided that they could be of
interest to our clients. Therefore, we decided to develop a plug-in to import the results of PVS-Studio
analysis.
Around the same time, one of our customers showed the interest in the introduction of a centralized
repository for various code metrics. The customer develops a very large (over 10 million lines of code) and
5. a long-term (more than 15 years of active development) project. Naturally, in such a project there is a lot
of inherited code and consequently, a lot of skeletons in the wardrobe and in this case to my mind it's
absolutely necessary to develop and implement a set of metrics, allowing to assess the state of the code
and dynamics of the changes of this state over the time. Of course, our client made a decision to start
collecting and analyzing code metrics, implemented various utilities for monitoring of the indicators of
code quality like: unit tests coverage, results of the test runs, duplication of code blocks, compliance with
the coding standards, density of comments in the code and so on. Together with the collection of these
metrics, static analysis was run daily. The use of a large number of utilities led to the complication of the
configuration of the continuous integration server, writing additional scripts for converting the results of
the work of every utility into a convenient format for representation and unifying all indicators to one
report. Such an approach required considerable resources to create and support this reporting system.
Based upon the needs of our customer and our investigation of the SonarQube abilities, we offered to
implement this platform. Which was successfully done. Within the implementation task we also created
a plugin for SonarQube, allowing to import to SonarQube the results of PVS-Studio analysis. The
deployment process of SonarQube and its integration with the existing environment (the build system,
continuous integration server, version control system) didn't cause any difficulties because of easy-to-
understand settings mechanisms and a large amount of detailed documentation. We have set up widgets,
allowing to assess the state of the project portfolio in general, as well as the state of each project
individually, configured Quality Profiles and Quality Gates (I will tell about these mechanisms later)
according to the client's requests, automatic task assignment, e-mail notification of those who may be
interested.
As a result of SonarQube implementation, our client got a centralized system of storing and displaying the
code metrics, allowing to estimate and predict risks of the project. The transition from separate tools to
a centralized system of code control doesn't only simplify the deployment and support of this system, but
also allows making a qualitative step forward in the sphere of project management, providing
stakeholders with the means to monitor the project status and make weighted decisions. After doing test
exploitation, the client made a decision to include SonarQube to his ALM framework (Application Lifecycle
Management).
We should note that SonarQube can easily become an integral part of the ALM framework due to its vast
possibilities of integration with other tools. With the help of SonarQube you can add the support of Git,
SVN, Mercurial, Team Foundation Version Control, ClearCase, set the authorization through LDAP, GitHub,
Bitbucket, Azure Active Directory, import the results of the third-party analyzers. SonarLint plugins for
IntelliJ IDEA, Eclipse and Visual Studio allow analyzing the code in real time in your favorite IDE, using
rules, configured in the SonarQube profile. Also, the integration with Team Foundation Server and Visual
Studio Team Services is available. You can run the code analysis and import the data in SonarQube right
from the build process in these systems or, for example, control the build states in Team Foundation
Server and Visual Studio Team Services with the help of Quality Gates (indicators of build quality), set in
SonarQube: if the code doesn't meet the Quality Gate requirements, the build will be considered as a
failed. Thus, the SonarQube developers strive to make the product as open as possible and allow the
teams to integrate SonarQube into their environment.
For which teams and projects is it reasonable to implement SonarQube? I believe that for relatively short-
term projects (no more than 2-3 months), which are maintained by small teams (no more than 5 people),
the investment in the implementation of SonarQube into the process of development can be not justified.
Usually, such projects do not require large expenses for the product support. I would recommend using
separate tools to control the state of the project code: static analyzer, control over unit test coverage,
compliance with the standards and so on that the team is used to.
6. The implementation of SonarQube is quite sensible for large projects, requiring considerable resources
with a long life cycle. Moreover, SonarQube implementation can be useful and beneficial at any stage of
the project development. The optimal strategy, in my opinion - implementation of SonarQube on the early
stages of the development cycle, which will allow the team to analyze the reports of the code quality right
from the beginning and be sure that the specified code standards are kept. The implementation of
SonarQube on later development stages can potentially require more expenses for the code
improvement. For example, it can turn out that the static analysis detected a large number of potential
bugs, or that there is a large amount of technical debt, the code isn't covered by unit tests, public API
aren't documented and so on. However, the identification of risks of the product at any stage in the life
cycle allows you to properly respond to those risks and plan actions to minimize them.
For example, the team might agree that when a piece of code in the development of new functionality is
changed, the whole technical debt in this code will be eliminated. The investment in fixing the flaws that
were found will allow reducing the cost of the product support and the development of new functionality.
Also, you can postpone this investment if the product has been on the market for quite a long time, and
in spite of the fact that code quality inspection identified a lot of problems, the behavior in production
environment is fairly stable and currently there are no sufficient resources to improve the quality of the
code base. SonarQube provides an opportunity to focus on the problems that have appeared in the new
code. This feature is similar to the mass warning suppression in PVS-Studio.
How SonarQube helps to assess the quality of the code
A SonarQube quality model implements the SQALE methodology (Software Quality Assessment based on
Lifecycle Expectations) with certain improvements. As it is well known, the SQALE methodology focuses
mainly on the complexity of the code maintainability and does not take the project risks into account.
For example, if there is a critical security problem detected in a project, the strict following SQALE
methodology requires you to address all the existing reliability issues, changeability, testability and so on
and only then go back to the new critical problem. In fact, it's much more important to focus on fixing
new bugs, if potential problems have been living in the code for quite a long time and there were no user
bug reports.
Taking that into account, SonarQube developers have modified the quality model, based on SQALE to
focus on the following important points:
The quality model should be as simple as possible
Bugs and vulnerabilities should not get lost among the maintainability issues
Serious bugs and security vulnerabilities in the project should lead to the fact that the Quality
Gate requirements aren't met
Maintainability issues of the code are important too and cannot be ignored
The estimation of the remediation cost (using the SQALE analysis model) is important and
should be carried out
The standard SonarQube Quality Gate uses the following metric values to assess if the code has passed
the checks successfully:
0 new bugs
0 new vulnerabilities
technical debt ratio on the new code <= 5%
the new code coverage is not less than 80%
Sonar team has defined 7 deadly sins of developers that increase the technical debt:
Bugs and potential bugs
7. Violation of coding standards
Code duplication
Insufficient unit tests coverage
Poor distribution of complexity
Spaghetti design
Too few or too many comments
The SonarQube platform is designed to help fight these sins.
Let's have a look at the main features of SonarQube in more detail.
Home page
On the home page of SonarQube you can see a list of projects added to the system with brief statistics for
each project: the version of the build, number of lines in the code, number of bugs, vulnerabilities, and
code smells, date of the last analysis:
8. The content of the home page can be customized for your goals by using a large number of built-in widgets
that allow you to visualize the status of the code in SonarQube projects.
Project metrics
Let's go to the page of project metrics to get more detailed information about the project status:
9. Here you can find information about the following code metrics: Reliability, Security, Maintainability,
Coverage, Duplications, Codebase size, Cyclomatic complexity, Documentation and Issues.
Turning to Reliability metric, we get information about the total number of detected bugs and new bugs
found during the analysis, code reliability rating on a scale from A to E, where E is the worst rating,
indicating that at least one blocker bug was found, as well as the time required to eliminate all the errors
found:
10. SonarQube platform allows you to analyze the code metrics from the top to down, from the level of the
project as a whole to individual modules and files. For example, if you click on the Reliability Rating, you'll
see a list of files in a project, sorted by ascending of the safety rating. This will help to focus on the most
problematic code fragments:
11. Then you can move to the file with the source code and specific code fragments where the issues were
detected:
12. Such drill down navigation is available for other metrics as well.
On the Security metric page you will find information about the total number of vulnerabilities, new
vulnerabilities, security rating (also on a scale from A to E), and the time it will take to fix the
vulnerabilities:
18. Using this metric you can easily find duplicated lines, blocks of code, and even entire files:
19. The Size page contains information about the size of the project: the number of lines in the code,
statements, functions, classes, files and directories:
20. The Complexity page provides information about the total cyclomatic complexity of the project, as well
as the average complexity per functions and files:
21. The Documentation page provides information about comments in code: the percentage of lines with
comments from the total number of lines in the project, the number of lines with comments, the number
of public APIs and the level of coverage of public API:
The last tab in the section of the code metrics - Issues - contains the total number of problems found in
the code (the total sum of the number of bugs, vulnerabilities and code smells), as well as distribution of
problems by their state: open issues, reopened issues, confirmed issues, false positive issues and won't
fix issues:
22. Navigating the code and the bugs
After analyzing the code metrics, let's see how SonarQube allows you to work with the problems found in
the code. To do this, let's move on to the Issues section:
23. Here we see all the problems found in the code with vast filtering options, which allows focusing on the
most important issues. It should be noted that SonarQube allows you to save filter settings to use them
later again.
24. By double clicking on the error message, you can go to the code, in which the problem was found. Besides
that you can find a detailed description of an error and recommendations of how it can be fixed:
Also note that, thanks to the integration with version control systems, you can see, when and who made
changes to the code that caused the analyzer warning to appear:
25. Integration with version control systems also allows you to automatically assign errors in SonarQube to
those developers who made them. You can also manually assign bugs to the developers; change their type
(bug, vulnerability, or code smell), severity, tags, add comments. There is a feature of bulk changing of
bugs:
Rules, Quality Profiles and Quality Gates
Rules, Quality Profiles and Quality Gates - key notions of SonarQube platform. Each plugin for SonarQube
that performs static code analysis, contains a repository with the description of diagnostic rules that this
plugin performs. Violations of these rules are used to determine the technical debt in your code and
26. evaluate the time to fix these issues. For ease-of-use the rules are grouped as Quality Profiles. By default,
SonarQube creates a default quality profile for each supported language, but you can create your own
quality profiles containing those diagnostic rules, that would be useful for you. For example, for the
analysis of critically important projects, which have the highest quality requirements, you can define a
quality profile that will contain all the available diagnostics; for less critical projects you can define a less
critical quality profile, that will contain only serious bugs, so that you don't get distracted by minor code
smells.
Quality Gate - is an indicator of compliance (or inconsistency) of the project to the specified threshold
code metrics. By default, all projects added to SonarQube, use a standard quality gate, with the following
metrics and their threshold values:
New bugs = 0
New vulnerabilities = 0
Technical debt ratio on new code <= 5%
Coverage of new code >= 80%
Based on your own requirements for the quality of the source code, you can change the default quality
gate or create a new one by adding or removing those metrics and their threshold values that are of
interest to you.
PVS-Studio and SonarQube
PVS-Studio provides a plugin sonar-pvs-studio-plugin to import the analysis results. Using the plugin
allows you to add messages found by PVS-Studio Analyzer to the database of SonarQube server. The
plugin contains a repository describing diagnostics, which our static analyzer executes. Once you add our
plugin in SonarQube, you'll see a repository called PVS-Studio analyzer for C, C++ and C# languages:
27. PVS-Studio diagnostic messages in the plugin repository have detailed descriptions of errors with code
examples and recommendations of fixing the problem:
28. After the analysis of the project code and import results into SonarQube, by using filters, you can select
all unresolved issues found by PVS-Studio:
29. To add PVS-Studio analysis results to SonarQube, you should install the plugin sonar-pvs-studio-plugin,
add PVS-Studio diagnostics from the plugin repository to Quality Profile and pass the path to the PVS-
Studio report file in the property sonar.pvs-studio.reportPath when launching the SonarQube scanner.
To analyze MSBuild projects, the SonarQube developers recommend using SonarQube Scanner for
MSBuild. This scanner is a wrapper for a standard SonarQube scanner, which simplifies the process of
creating a configuration file of the scanner (sonar-project.properties), automatically adding modules
(projects in the solution) to it and writing the paths to the source files to be analyzed.
However, we saw important, from our point of view, limitations of the SonarQube Scanner for MSBuild.
Firstly, when analyzing C/C++ projects, this scanner will add to the list of files to analyze only those files
that are added to the properties ClCompile and ClInclude in the project file .vcxproj. If, for example, the
header file isn't explicitly included into the project and included directly in the code of one of the source
files, then this file will be ignored and the analysis results for this header file will not be displayed in
SonarQube.
Secondly, SonarQube Scanner for MSBuild doesn't add the source files for analysis, which are located
higher up in the directory tree, than the directory where this project file is located. Messages for such files
will also be missing in SonarQube.
Based on these limits, we recommend using a standard scanner SonarQube for the import of PVS-Studio
analysis. Use this scanner presupposes creating a configuration file sonar-project.properties manually.
Using and setting up the scanner are described in the article Analyzing with SonarQube Scanner.
By default, SonarQube scanner indexes the source files for analysis, located in the directory tree lower
than the extension file (.sln) or the project (.vcxproj/.csproj). To do the analysis of projects with complex
structure, where the source files can be located higher in the directory tree, than the solution or the
project file, in the property sonar.projectBaseDir, set the common parent directory for all the source files
(in extreme cases this can be the root of a disk); in the property sonar.sources enumerate the directories
where there will be the source files for analysis (or specify full paths to the source files).
The process of adding paths to the source files in sonar.sources property for large projects can be rather
time consuming, and quite non-trivial, taking into account all the included header files. To make this task
30. simpler, we implemented a special mode of our analyzer, allowing to automatically create configuration
files for the SonarQube scanner.
When developing our static analyzer, we focus on finding errors in the code, and do not support the search
of potential vulnerabilities and code smells, so the Security and Maintainability metrics won't be filled.
We should also note that in the current version of the analyzer the evaluation of Duplications, Complexity
and Documentation is not implemented yet.
Conclusion
In this review, I tried to show how SonarQube allows you to embed and use quality control practices based
on metrics. As Peter Drucker once said (or perhaps it was William Deming): if you can't measure it, you
can't improve it. Regular collection of code metrics, analysis of their changes over time helps to detect
that the technical debt is still growing, the maintainability of the code decreases which results in the cost
growth of the new features and increased risks related to the delivery of new versions of the product. I'll
cite a quote "The Pragmatic Programmer: From Journeyman to Master" written by Andrew Hunt, Dave
Thomas:
Don't leave "broken windows" (bad designs, wrong decisions, or poor code) unrepaired. Fix each one as
soon as it is discovered. If there is insufficient time to fix it properly, then board it up. Perhaps you can
comment out the offending code, or display a "Not Implemented" message, or substitute dummy data
instead. Take some action to prevent further damage and to show that you're on top of the situation.
We've seen clean, functional systems deteriorate pretty quickly once windows start breaking. There are
other factors that can contribute to software rot, and we'll touch on some of them elsewhere, but neglect
accelerates the rot faster than any other factor.
You may be thinking that no one has the time to go around cleaning up all the broken glass of a project. If
you continue to think like that, then you'd better plan on getting a dumpster, or moving to another
neighborhood. Don't let entropy win.
SonarQube platform allows detecting such "broken windows". Using SonarQube, you will get access to
consolidated reports on the status of the source code, watch as conditions change over time, will be able
to explore these issues by using the drill down analysis, from the particular metric value you are interested
in for the entire project to a particular piece of code directly in your browser window. SonarQube also
provides the estimation of the time required to address problems in the code. Thus, if your project has
obtained a large amount of technical debt, you can always tell how much time you need time to deal with
it.
Among interesting and useful features of SonarQube I would also note its abilities for integration with
other tools, which makes it a part of your ALM framework; and the expanding of existing functionality
thanks to third-party plugins. What's more is that all these powerful and convenient features are available
under a free license. If you use PVS-Studio static code analyzer, our plugin will help to import the analysis
results to SonarQube to explore quality issues of your code.
You can try SonarQube in your environment if the abilities of SonarQube sound interesting to you.
SonarQube installation is very easy - you should just extract the distribution files from the archive and run
the executable file for your operating system.
You can also check your projects written in C/C++ or C# with the help of PVS-Studio static analyzer.
Useful links
SonarQube website