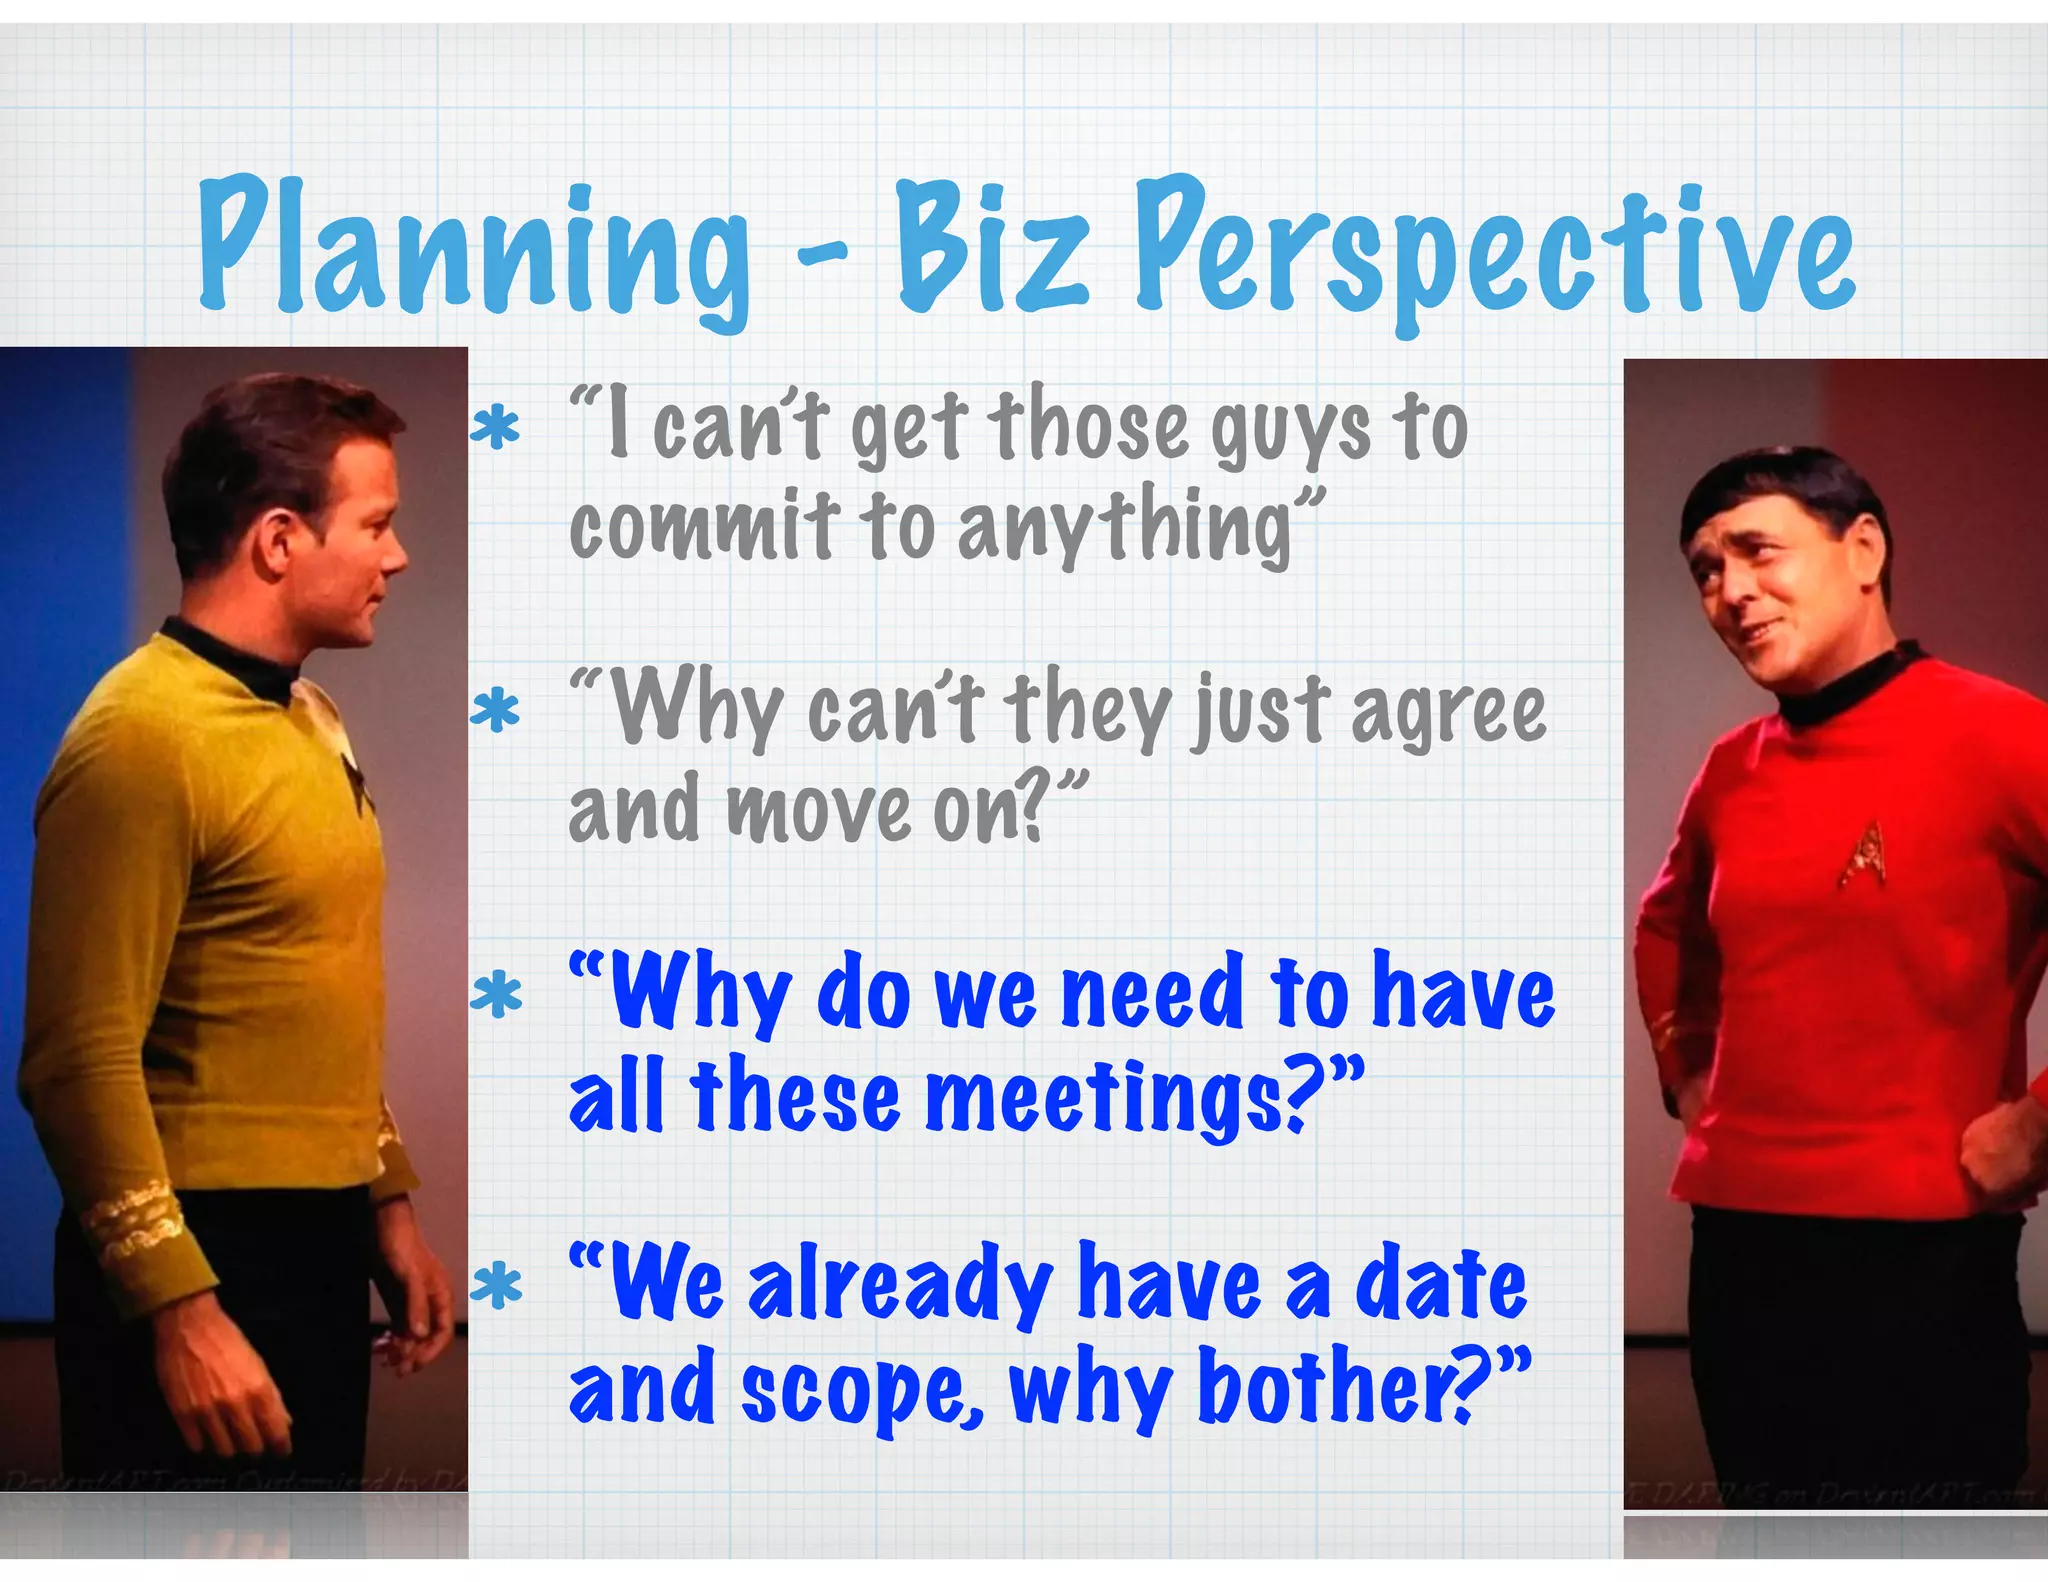
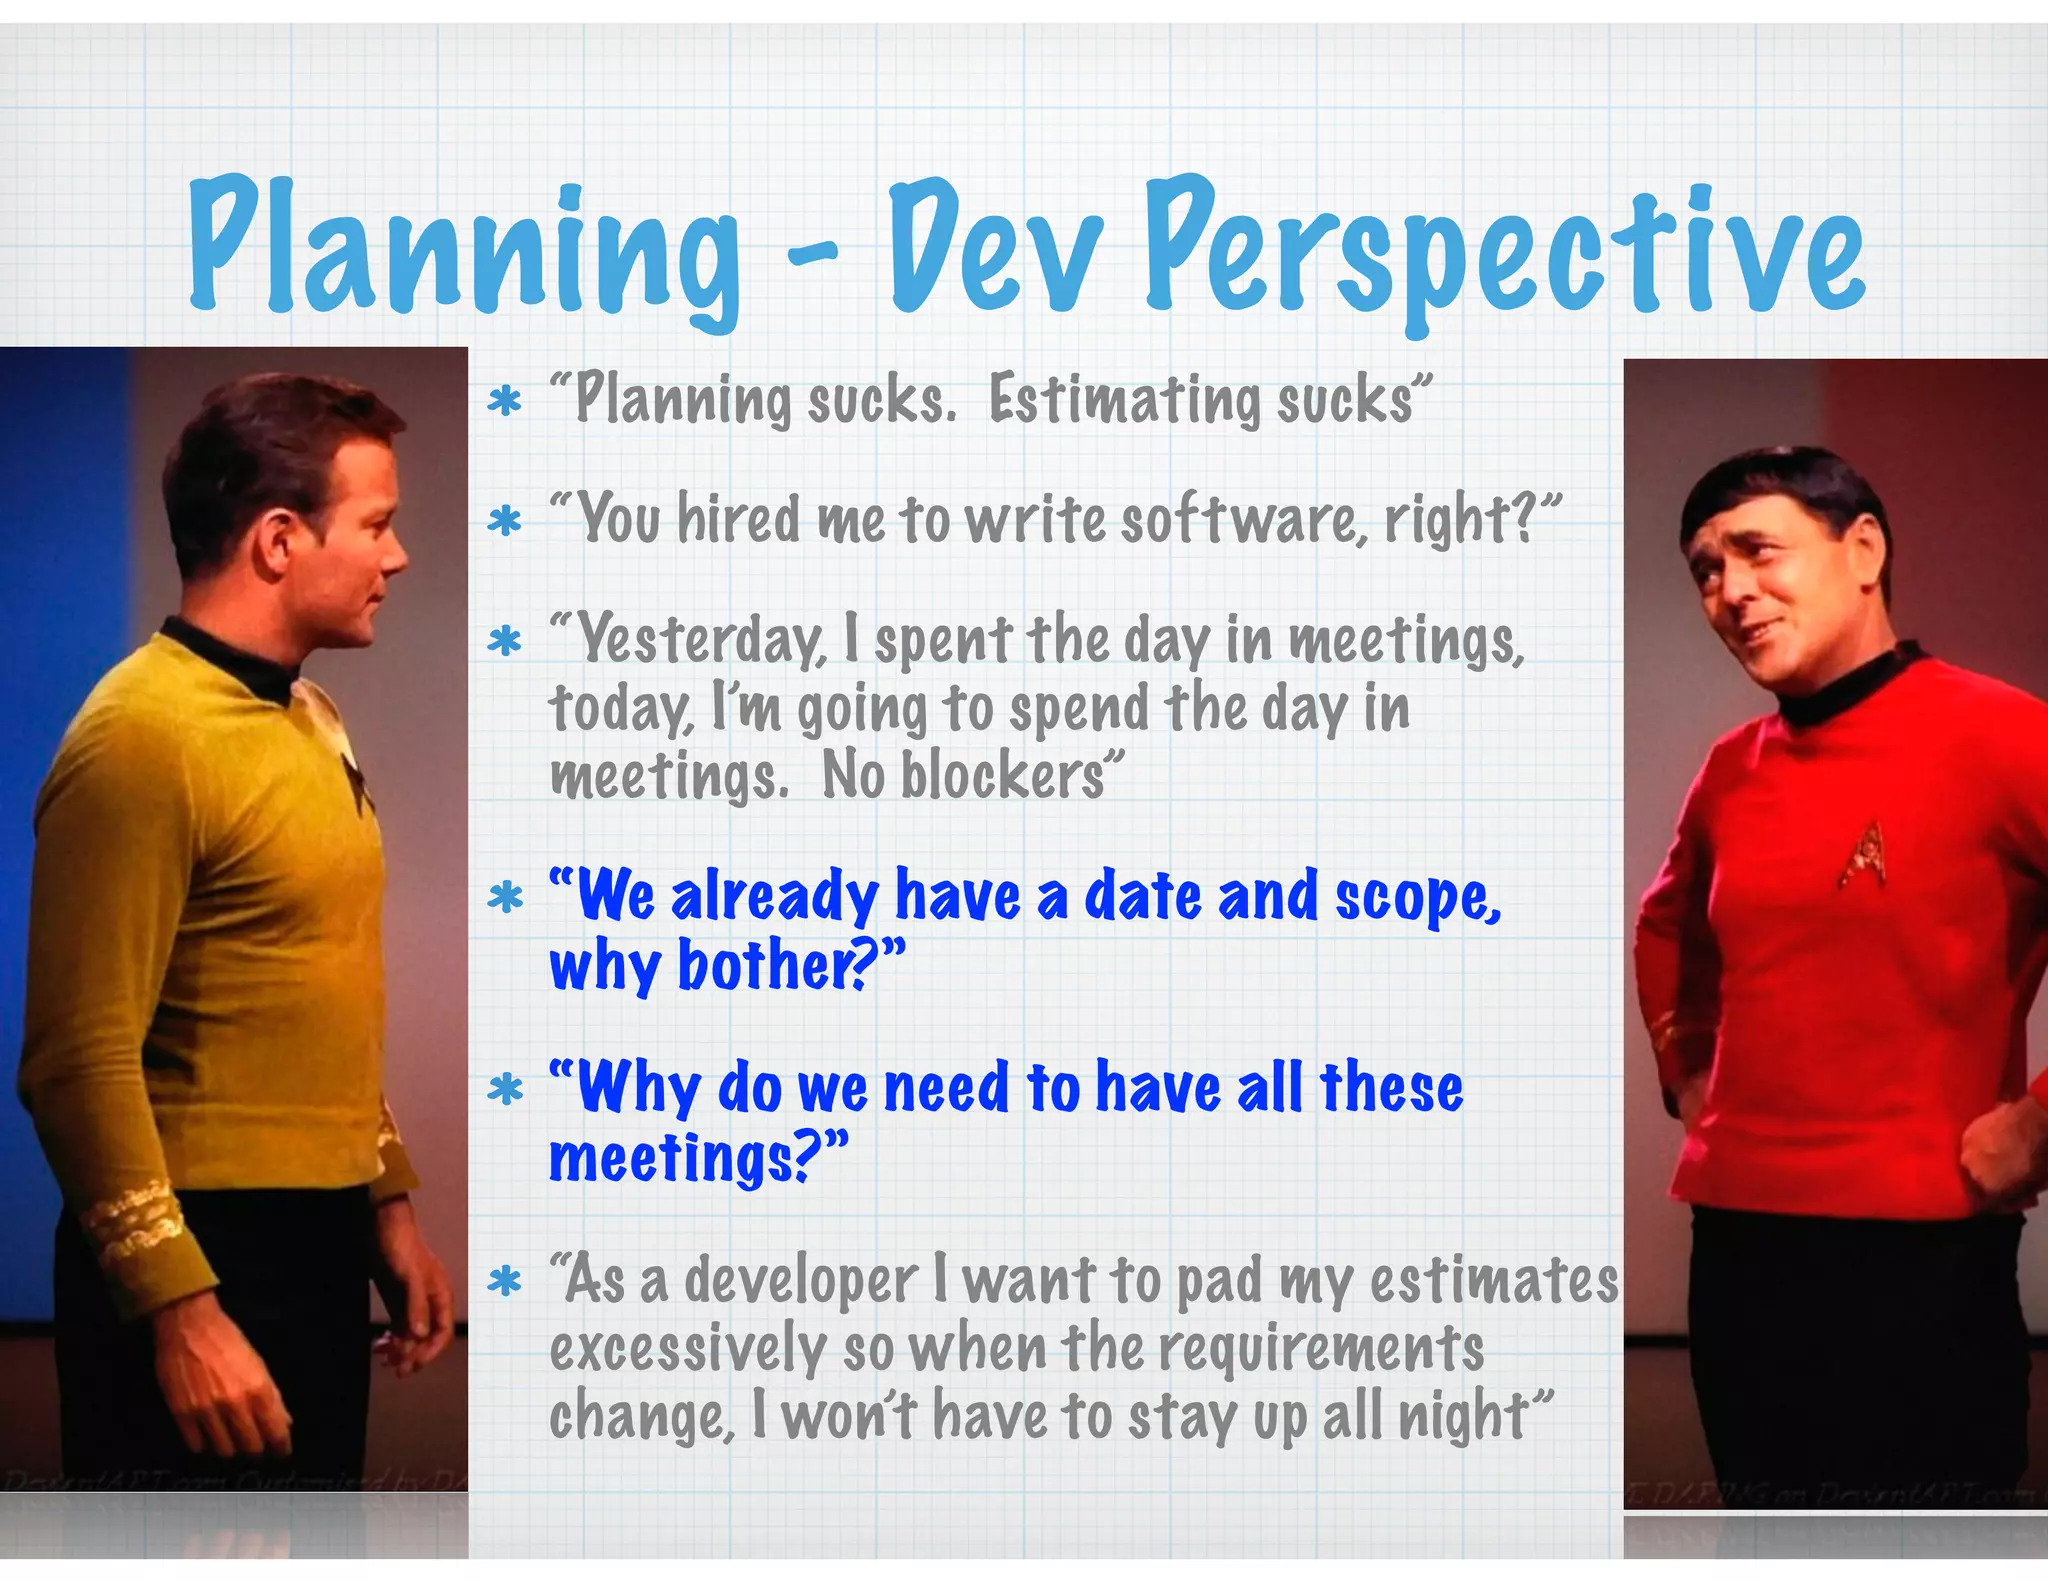
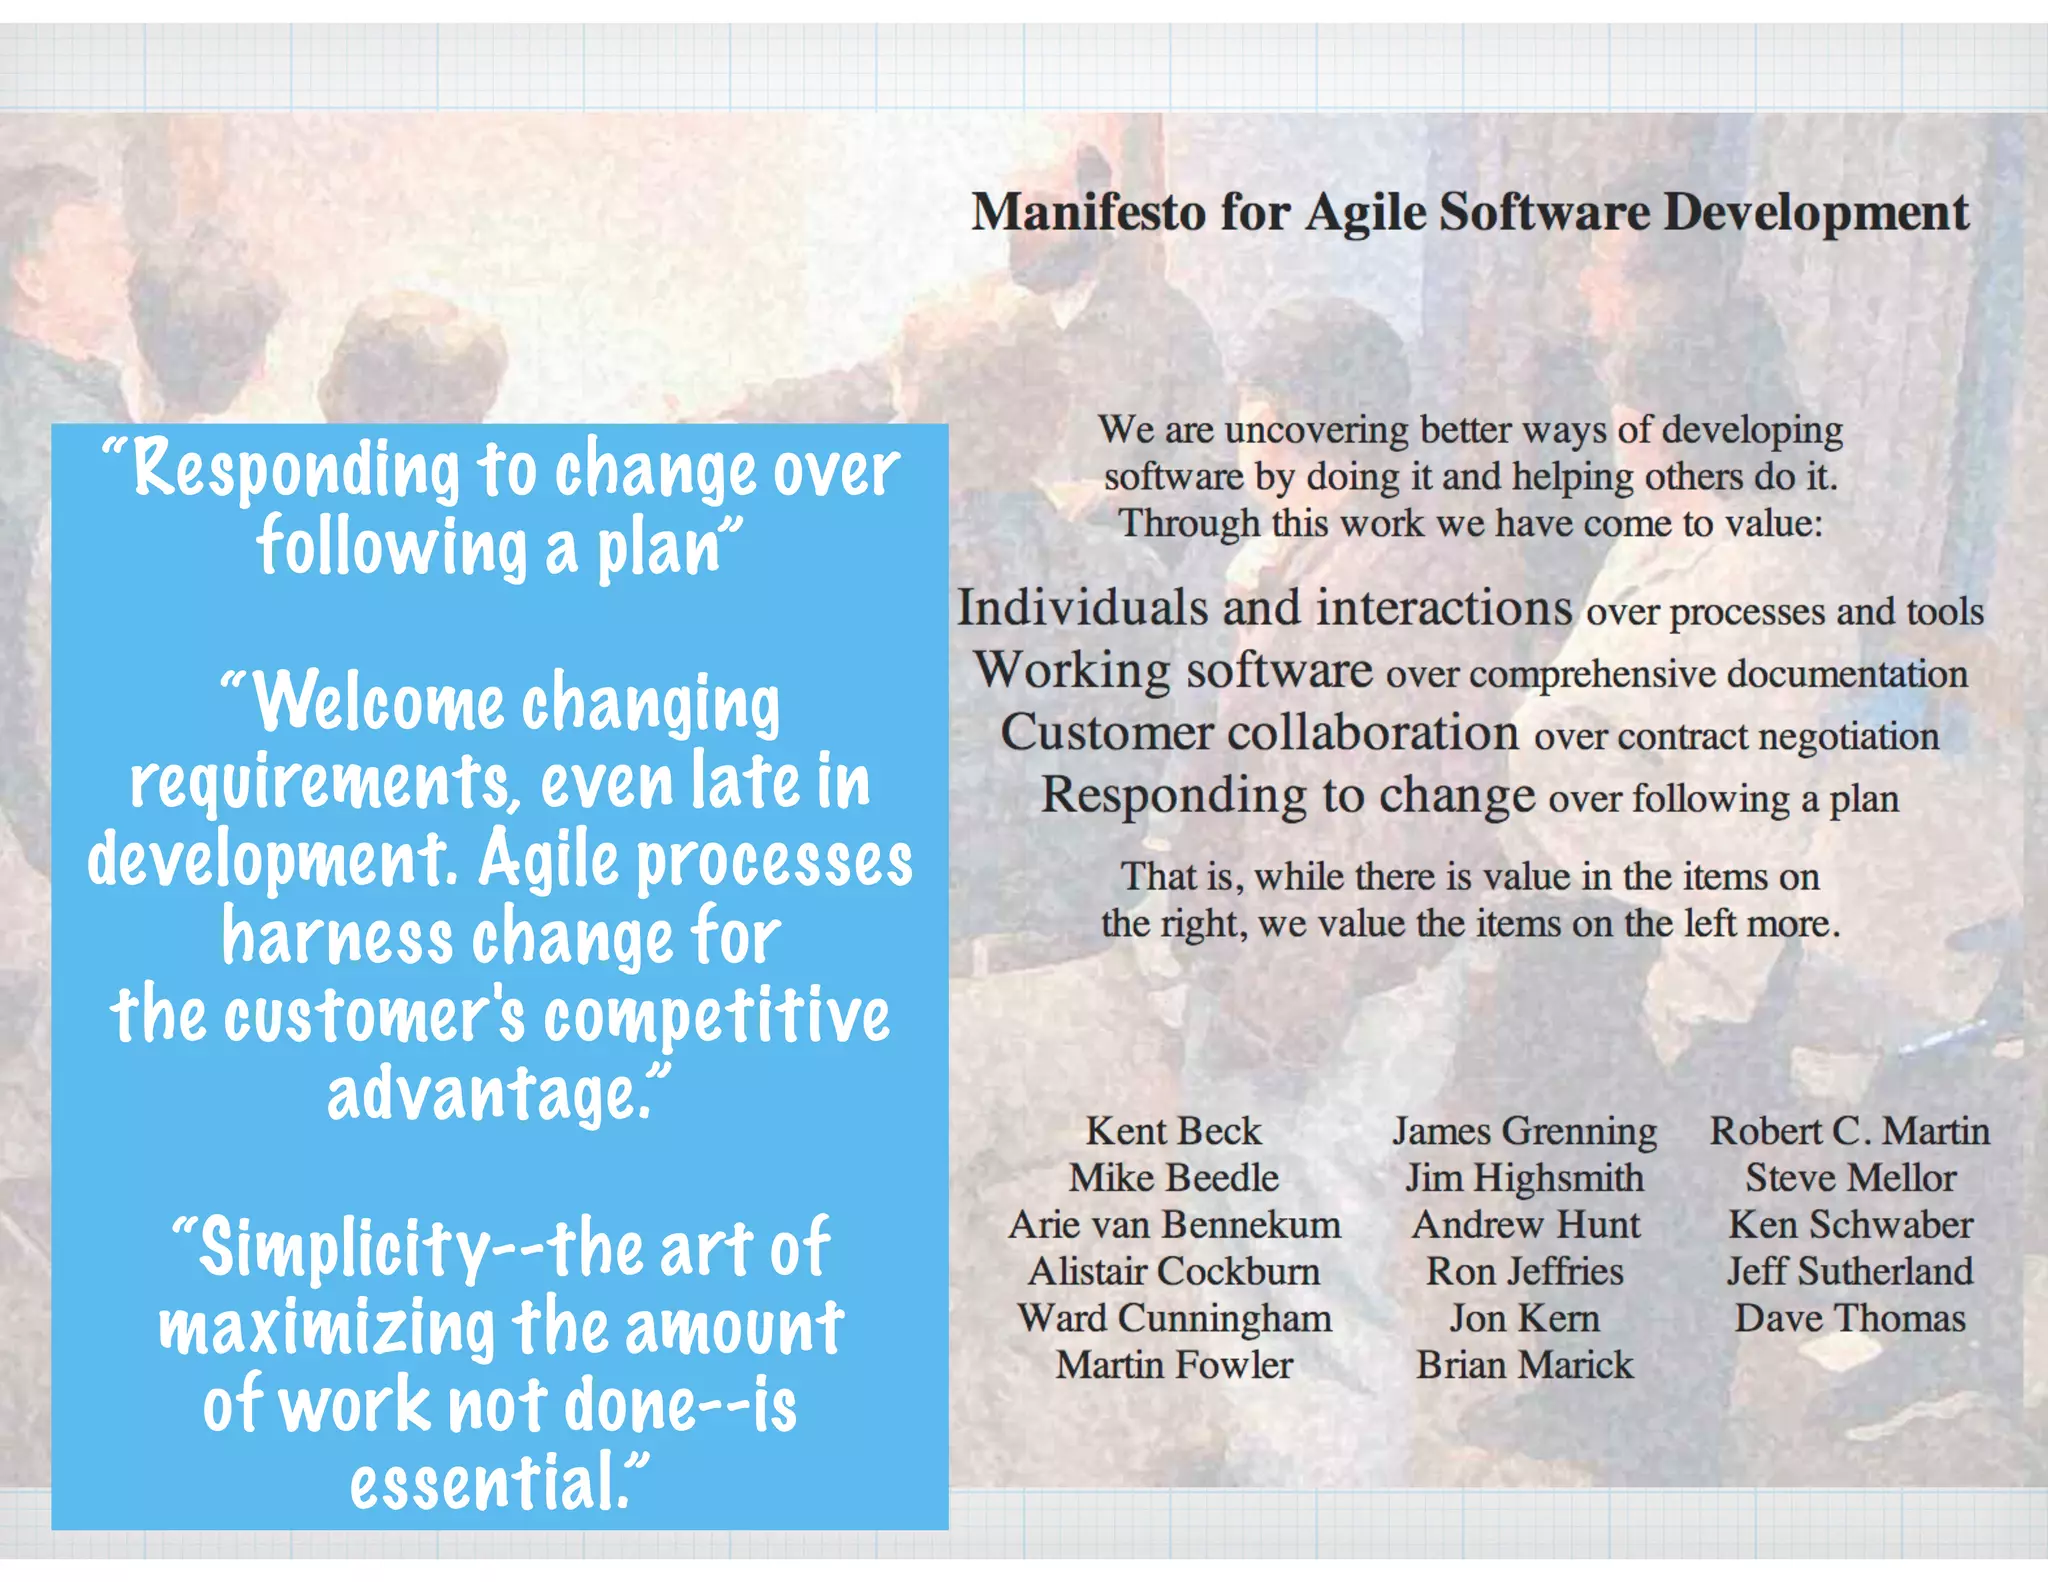
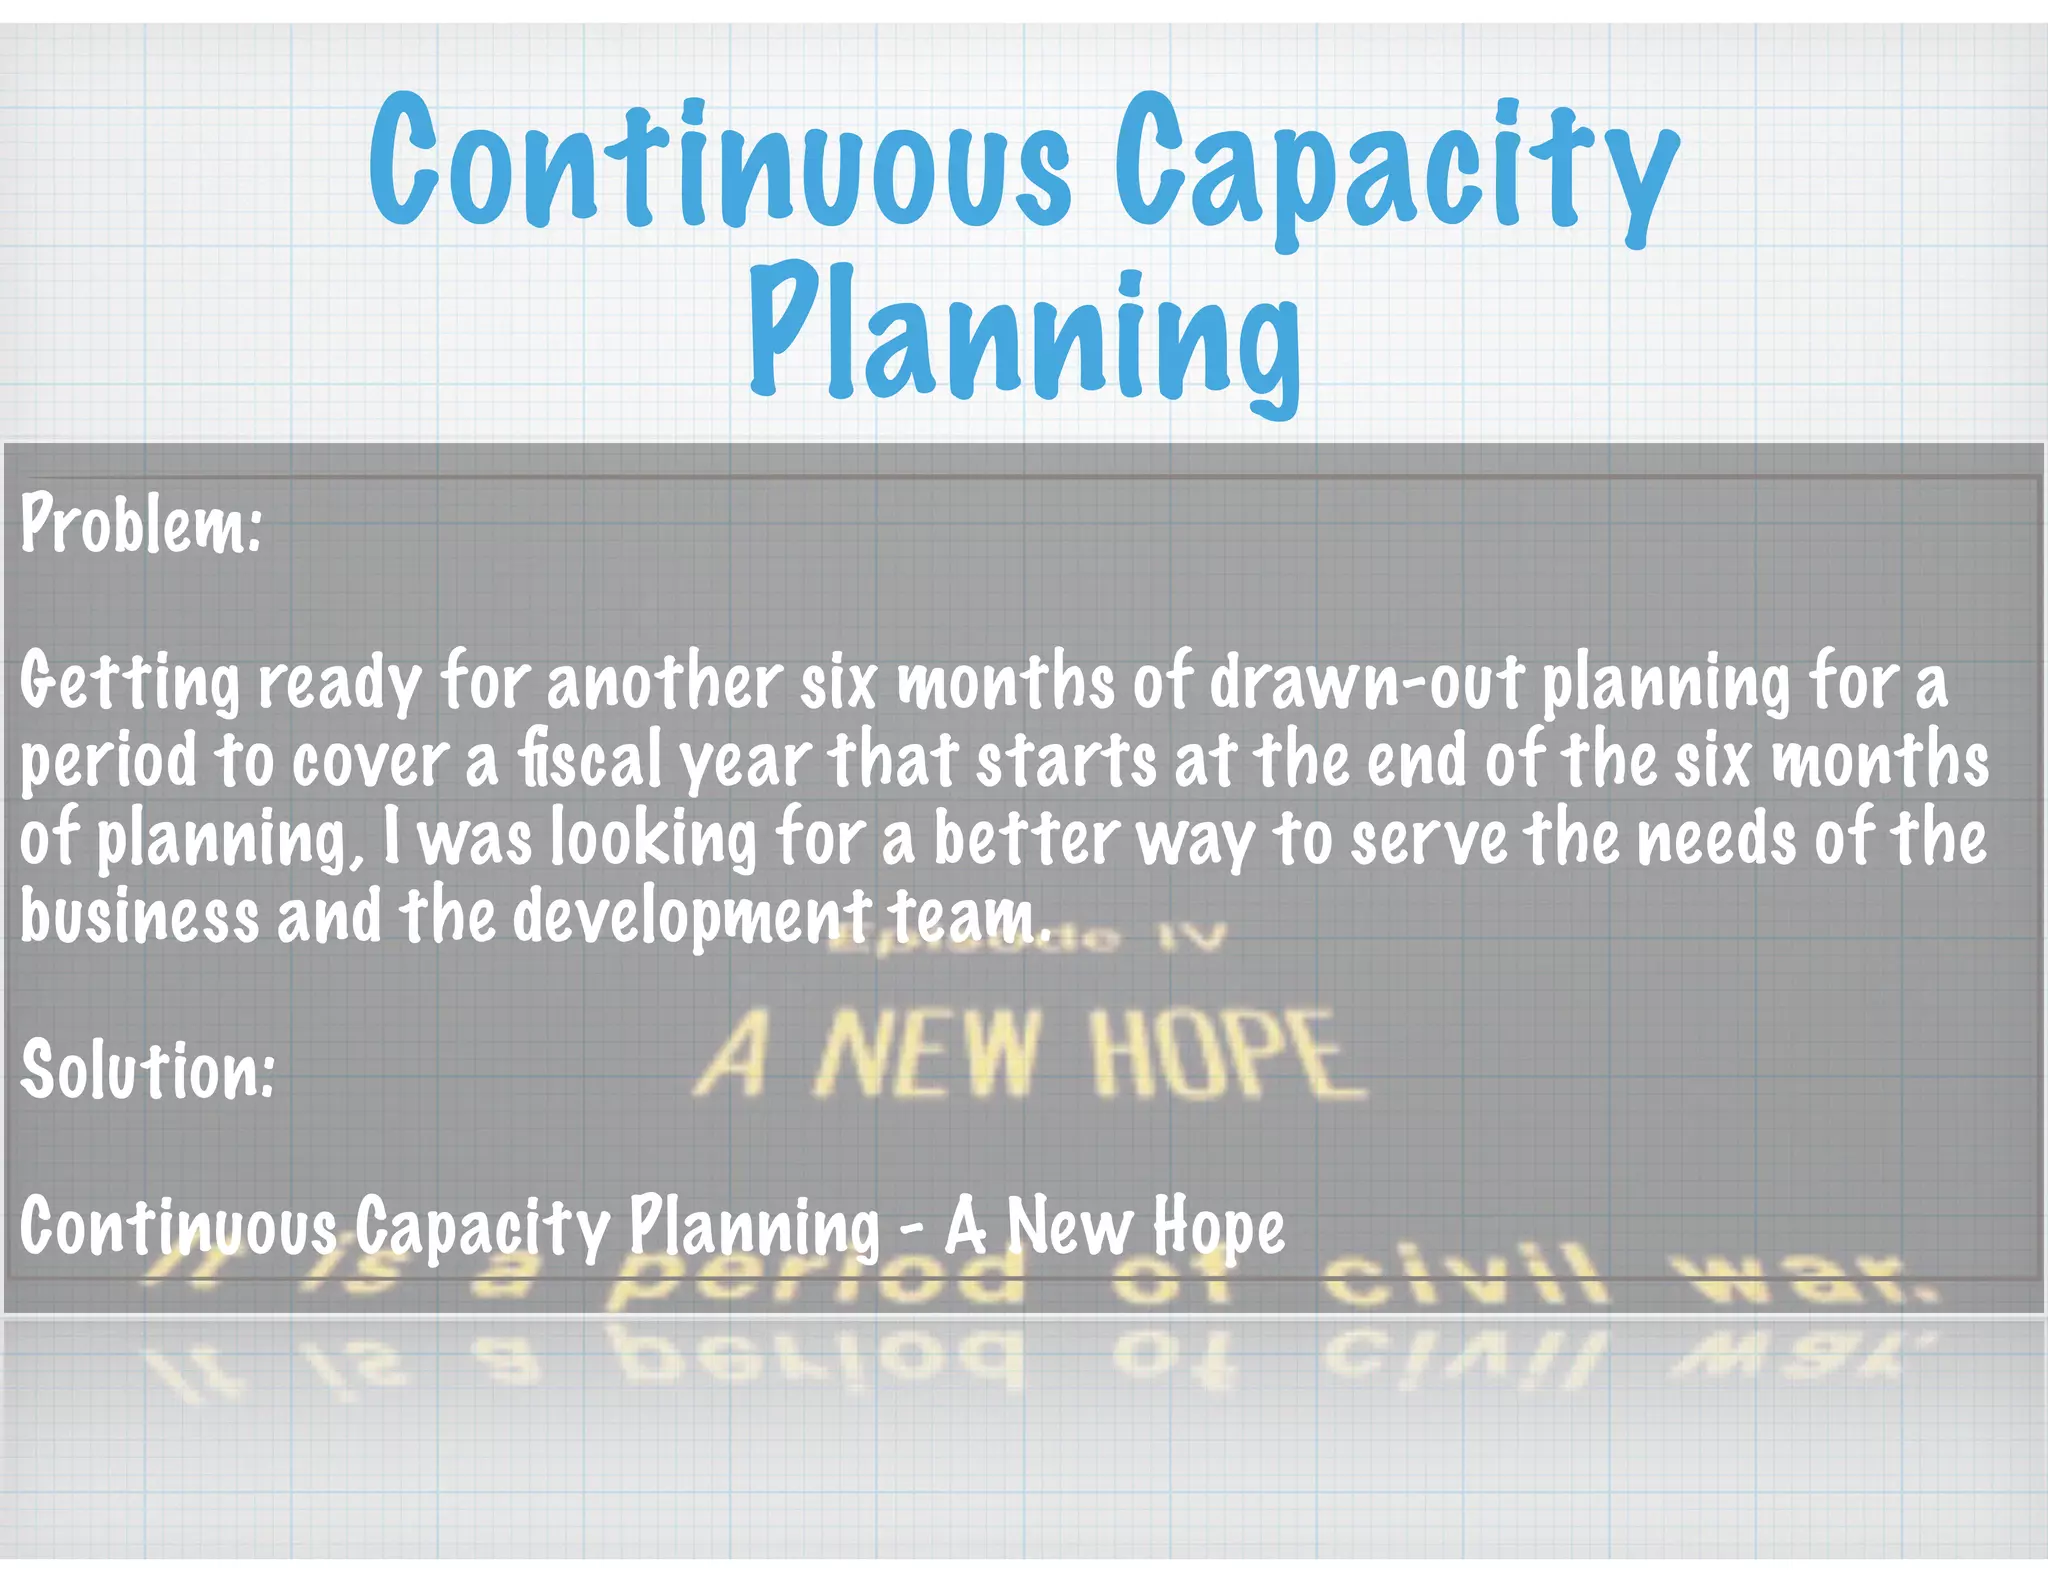
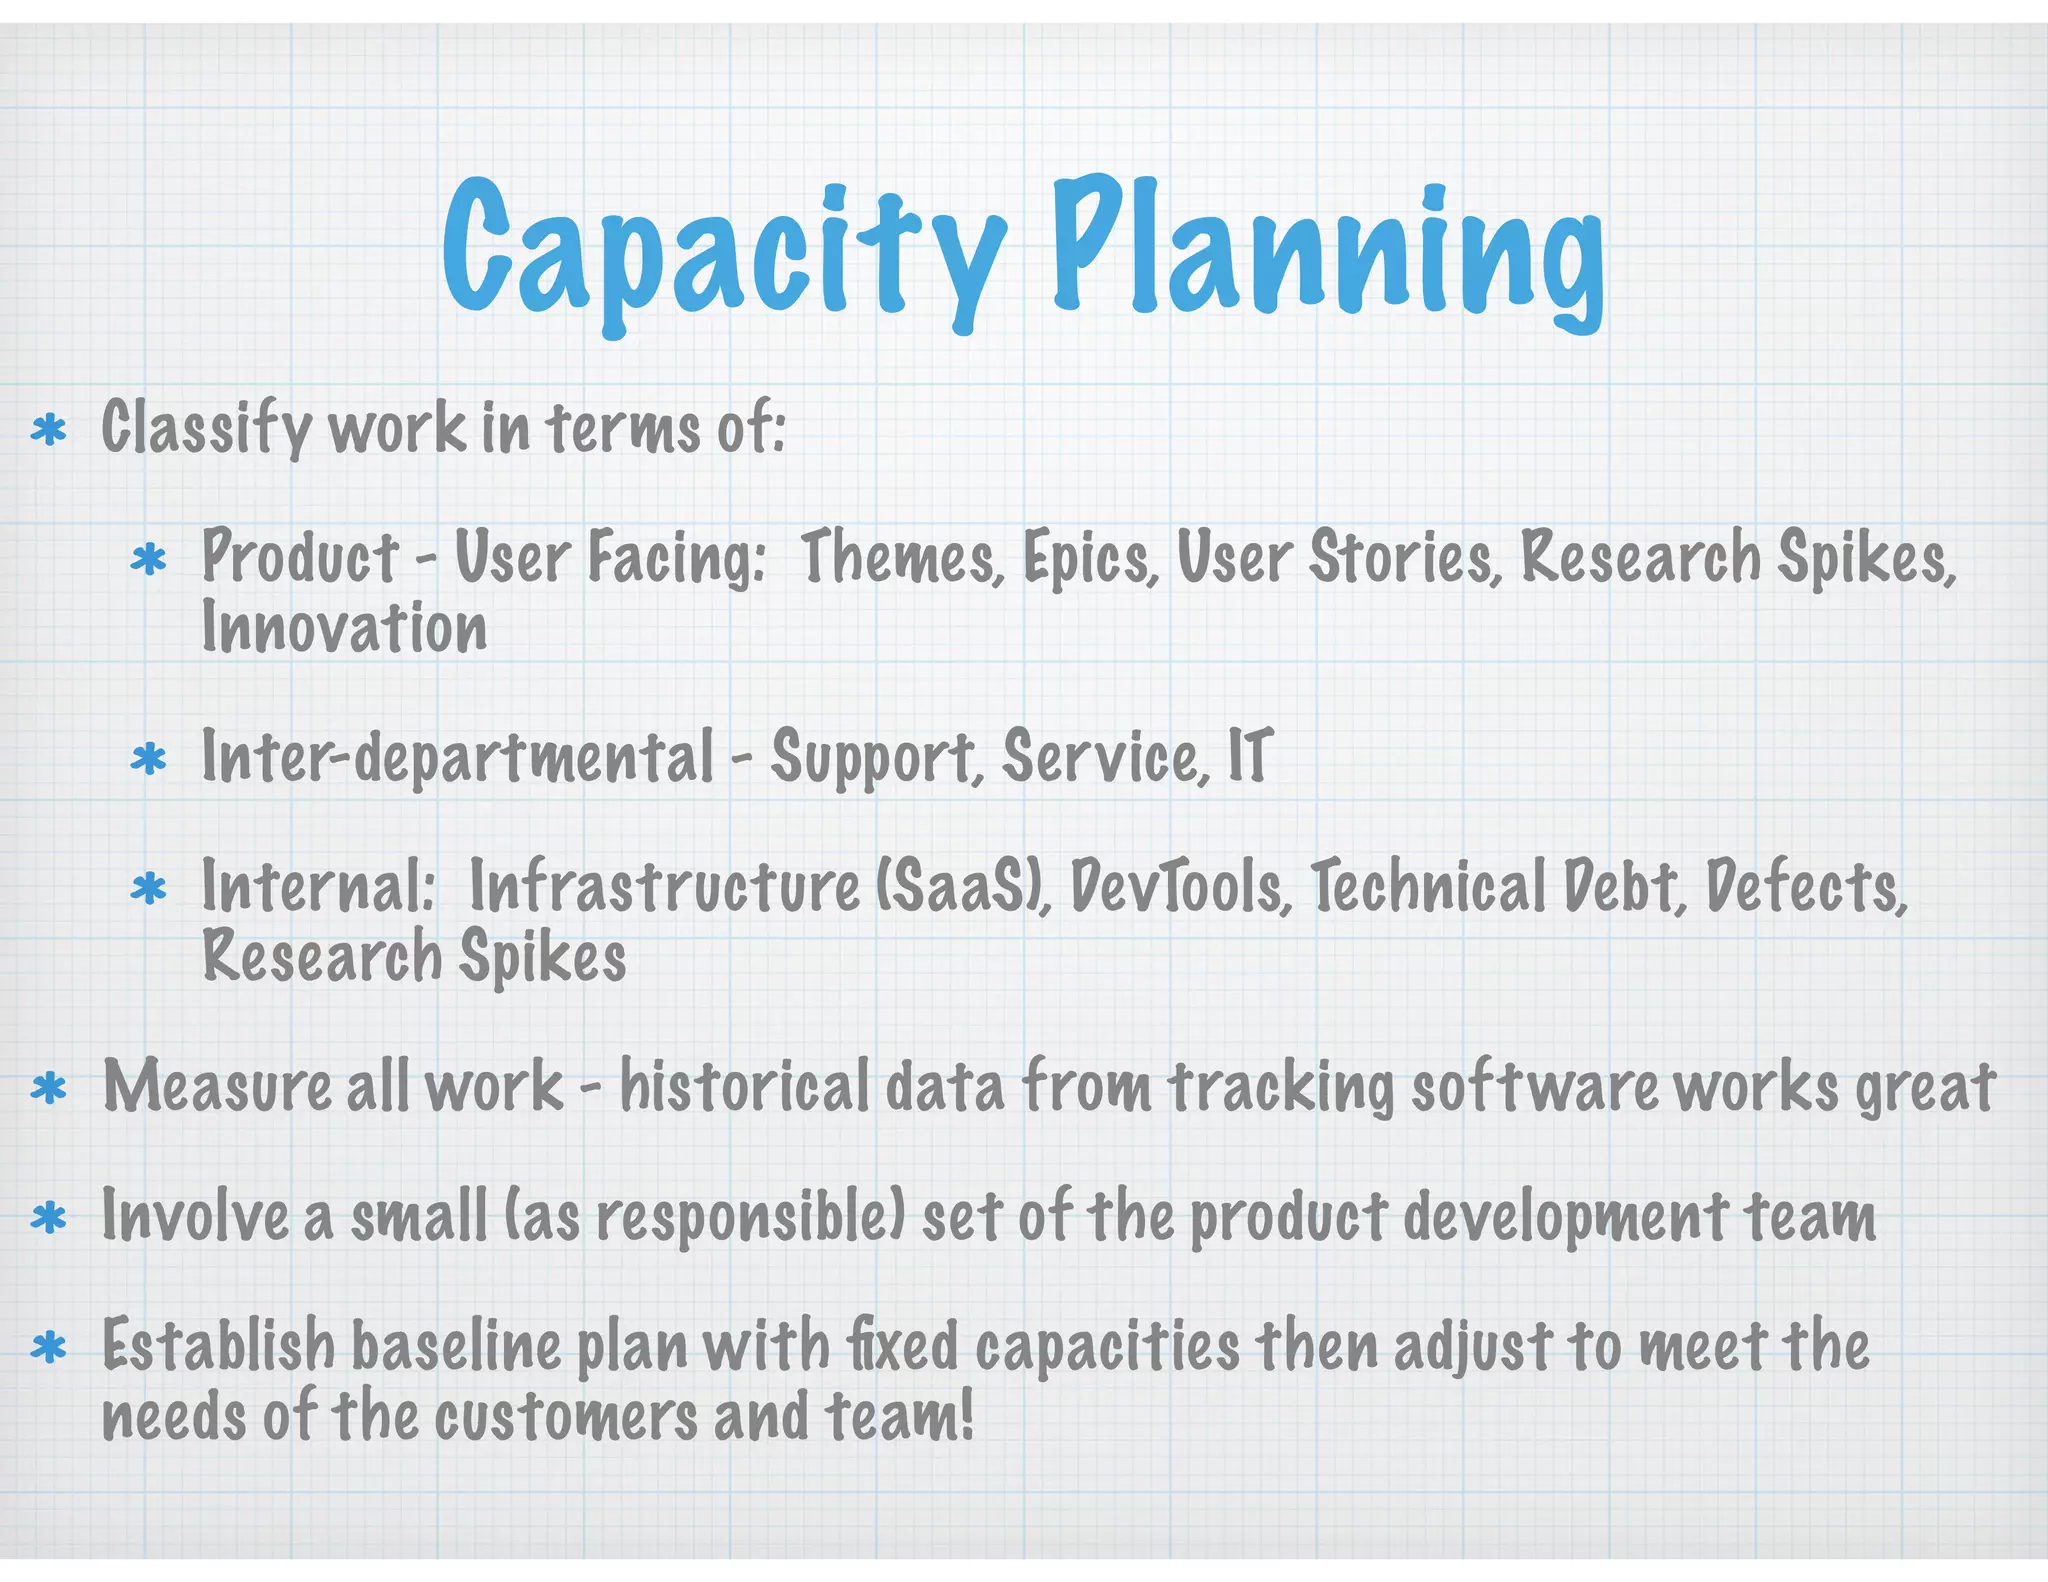
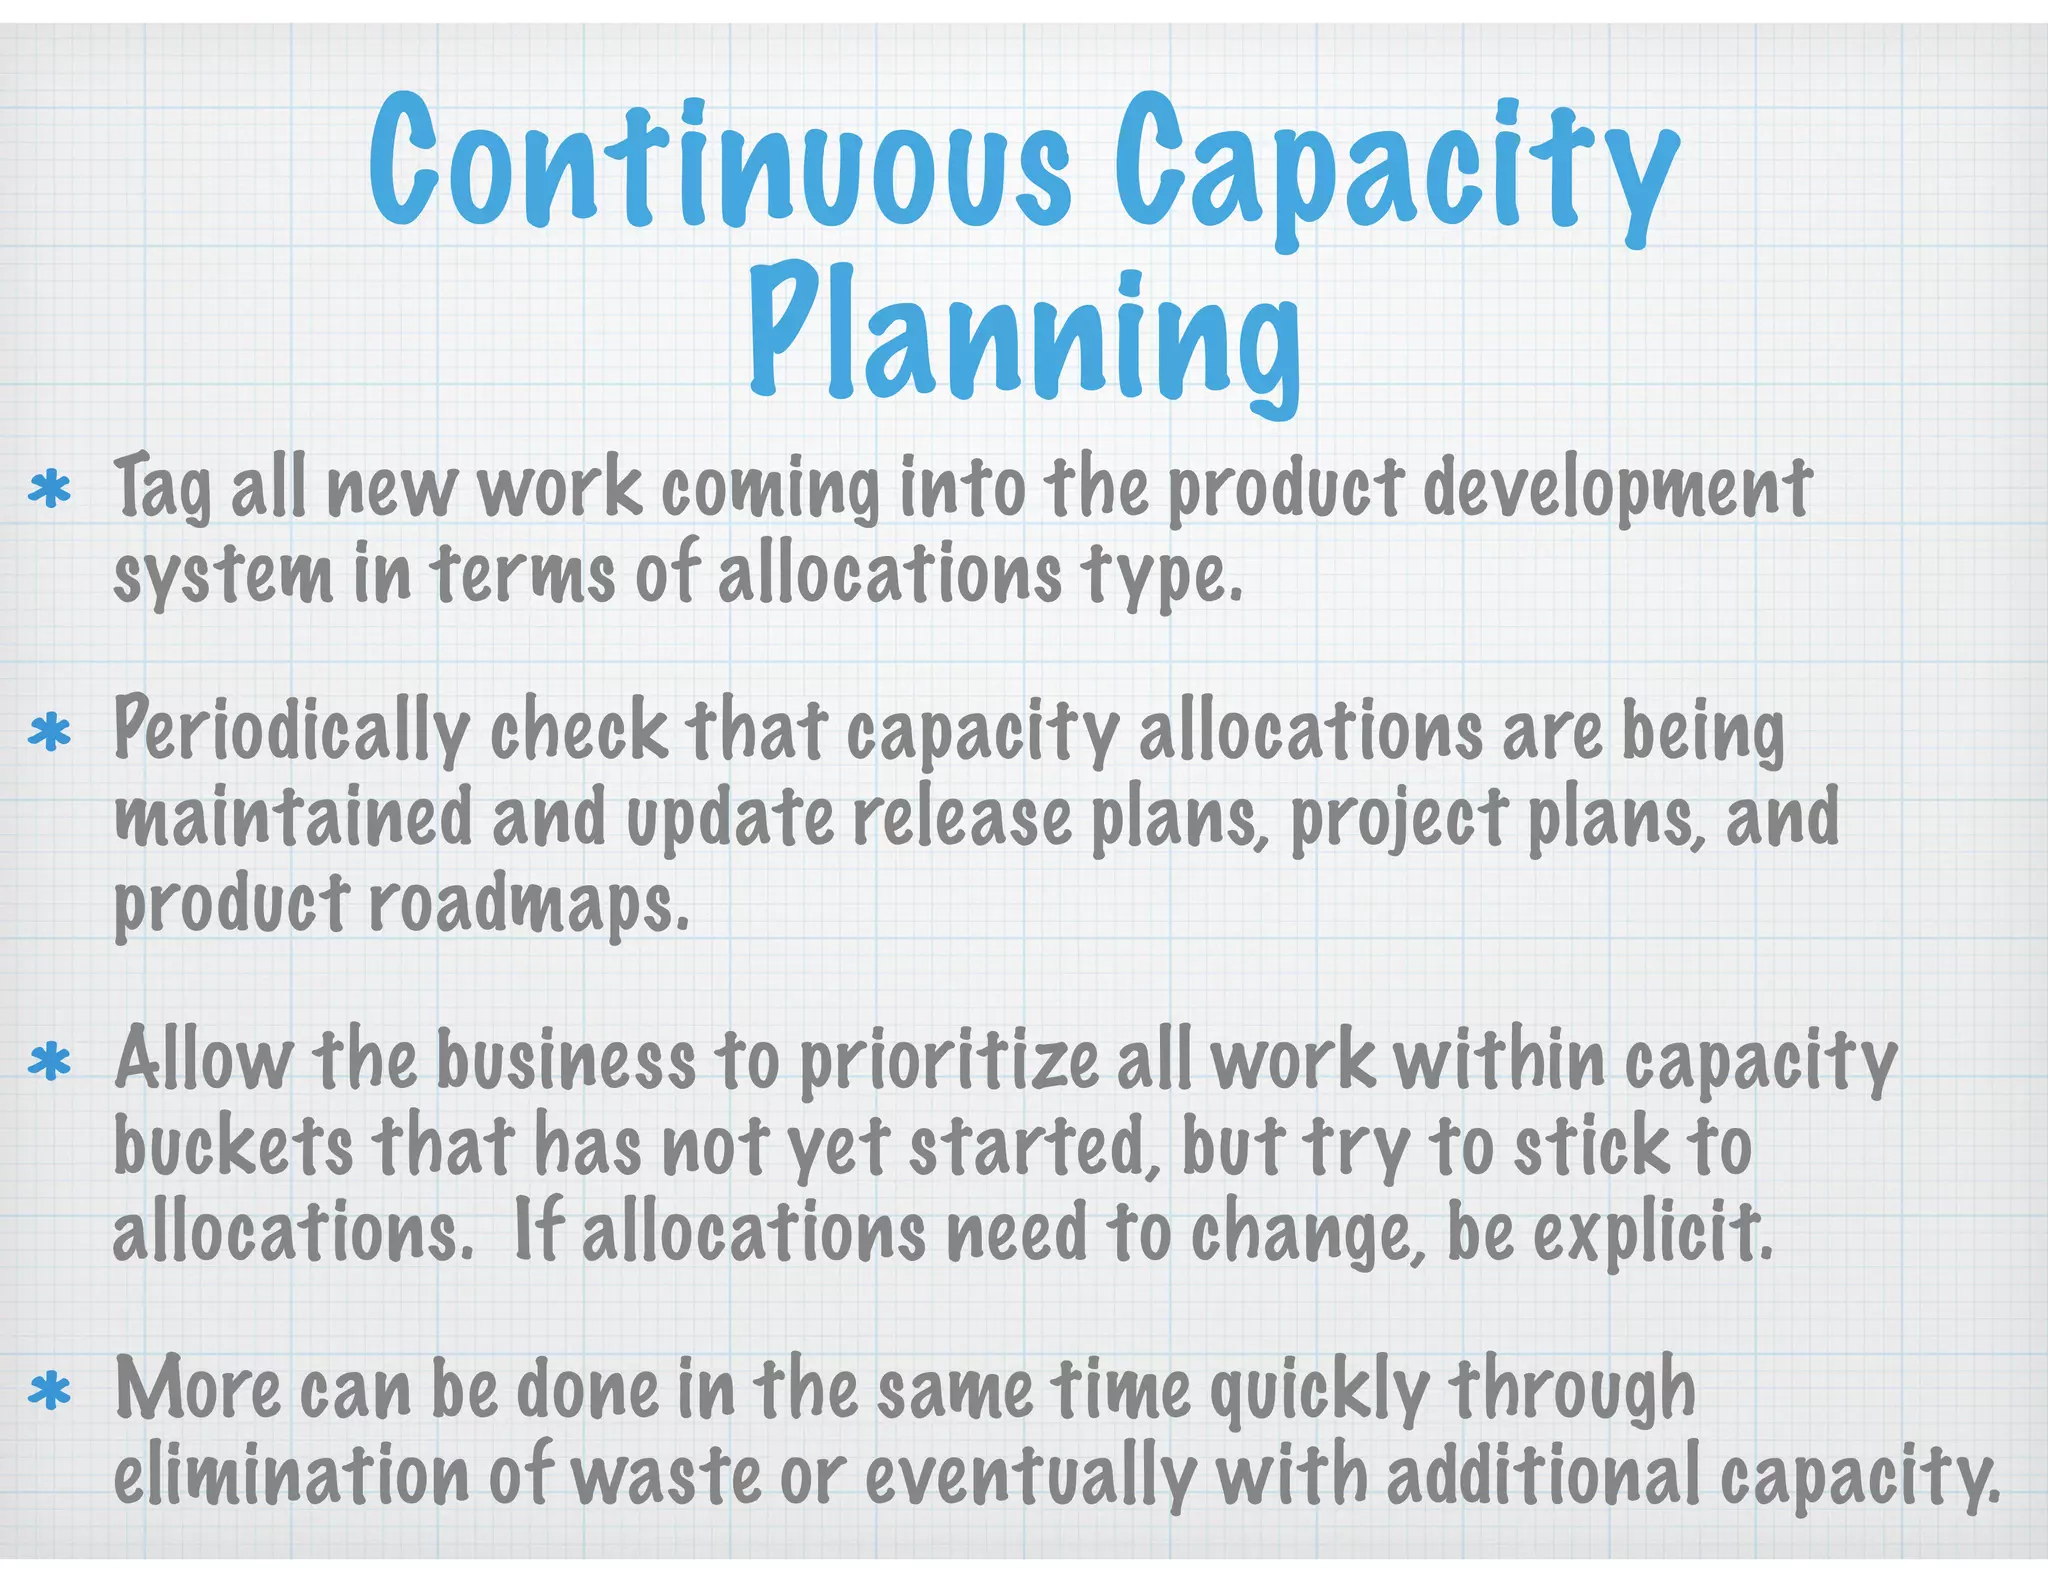
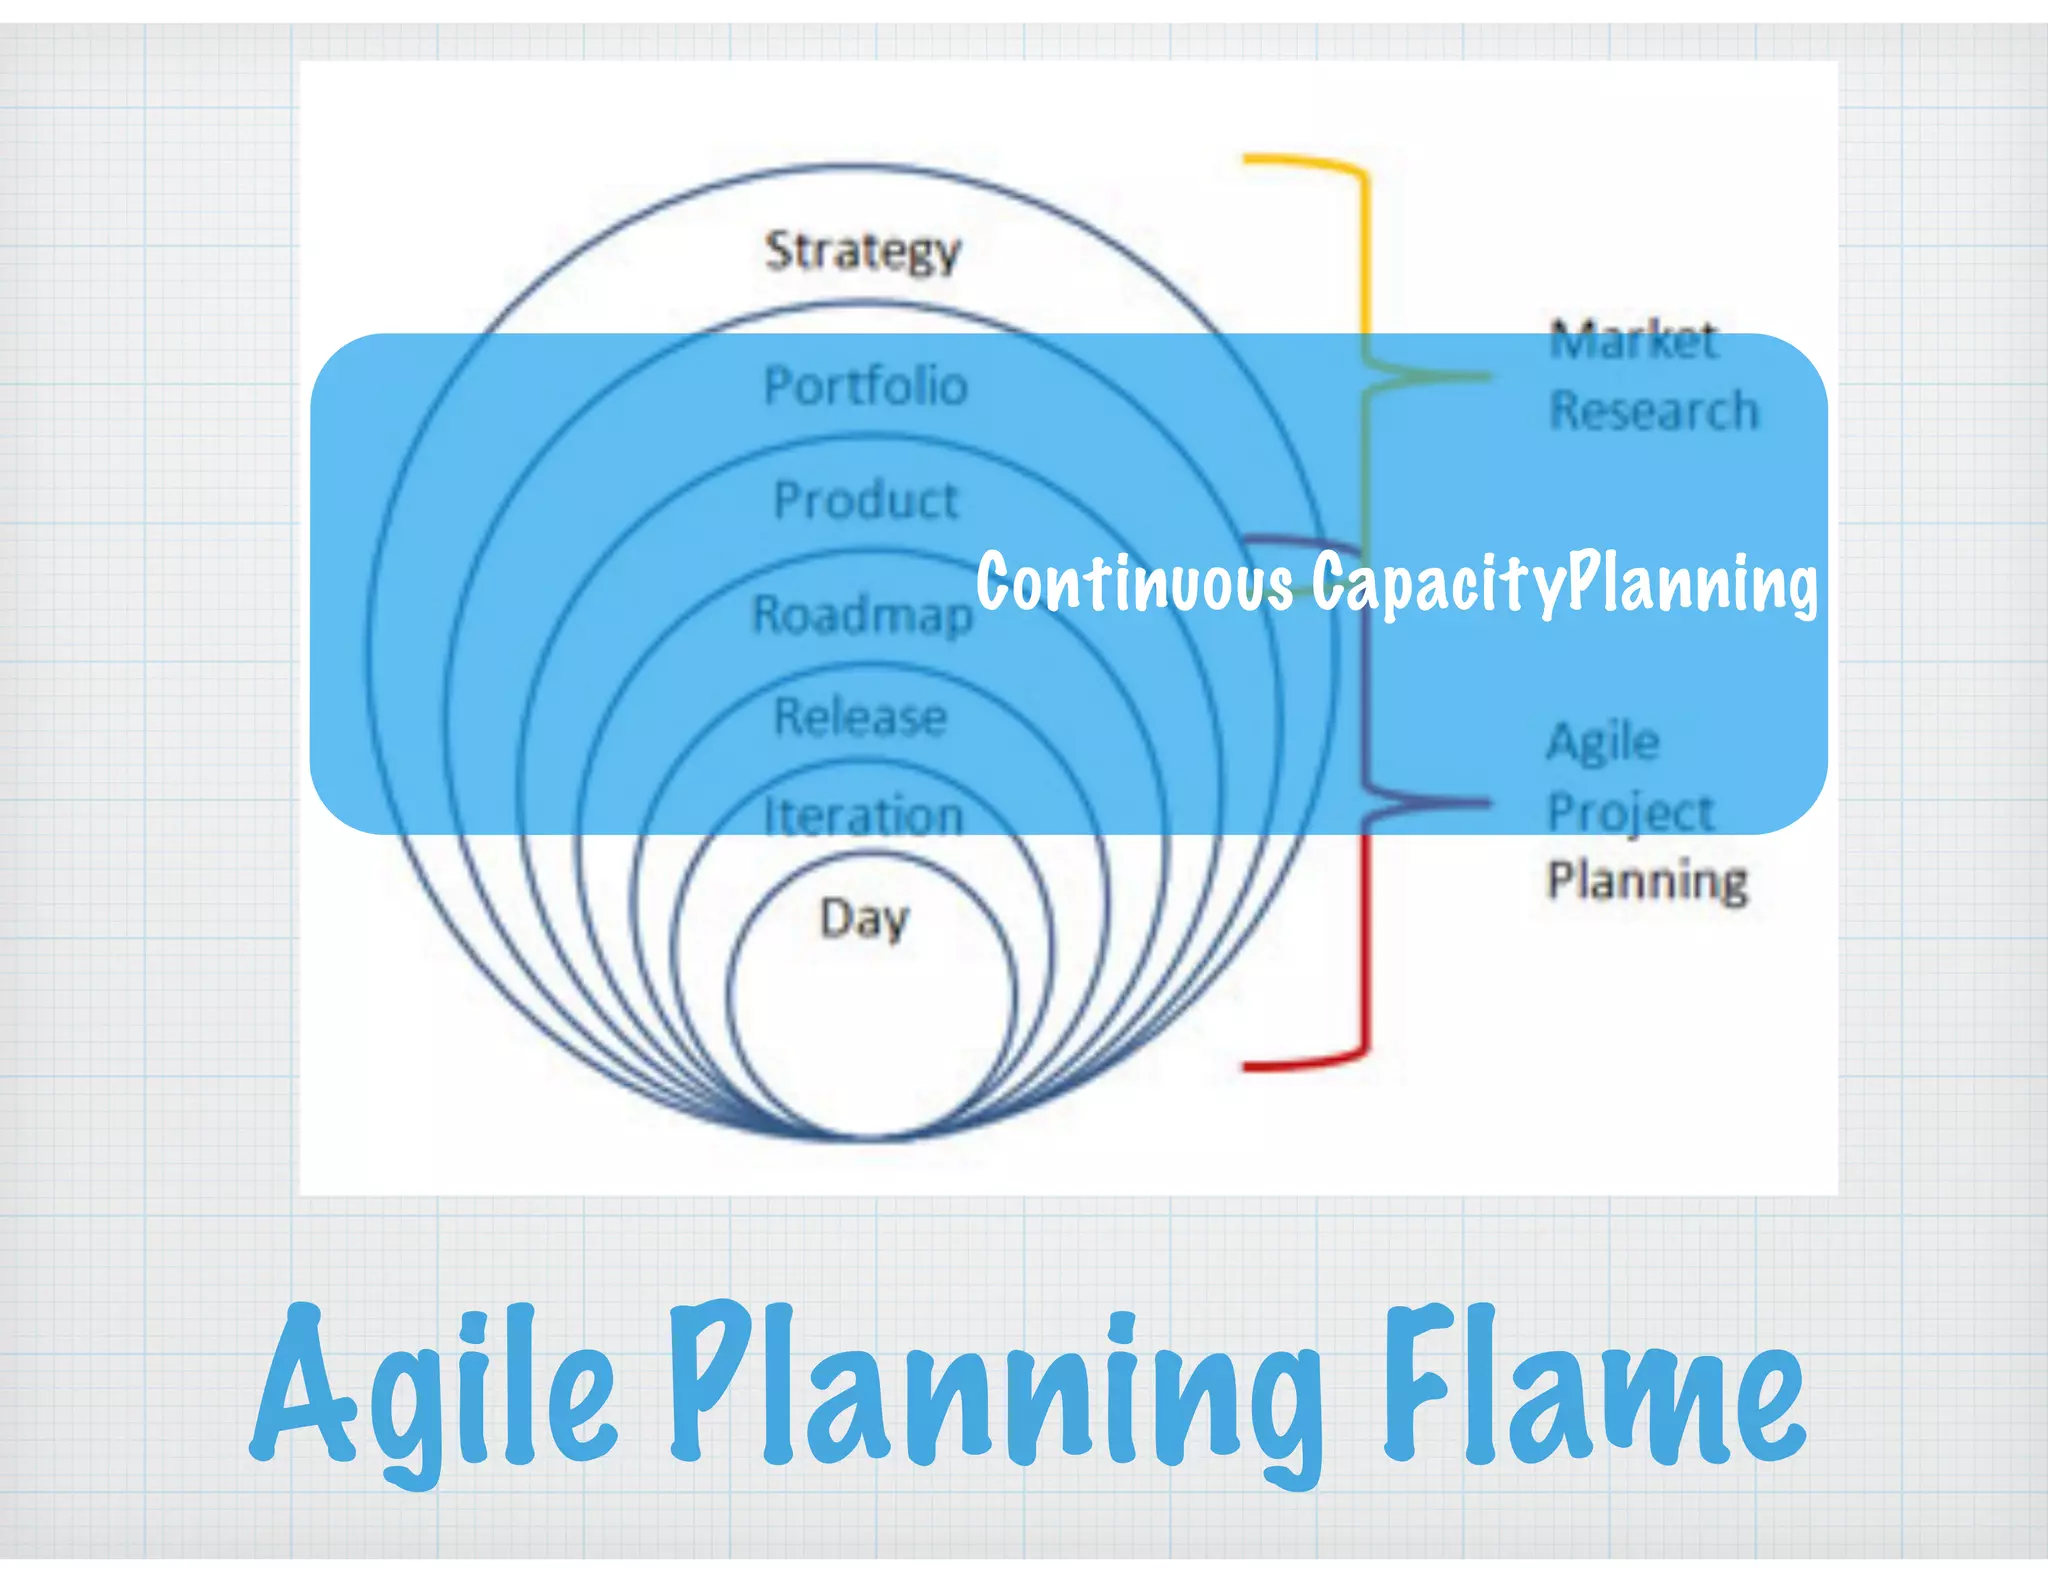
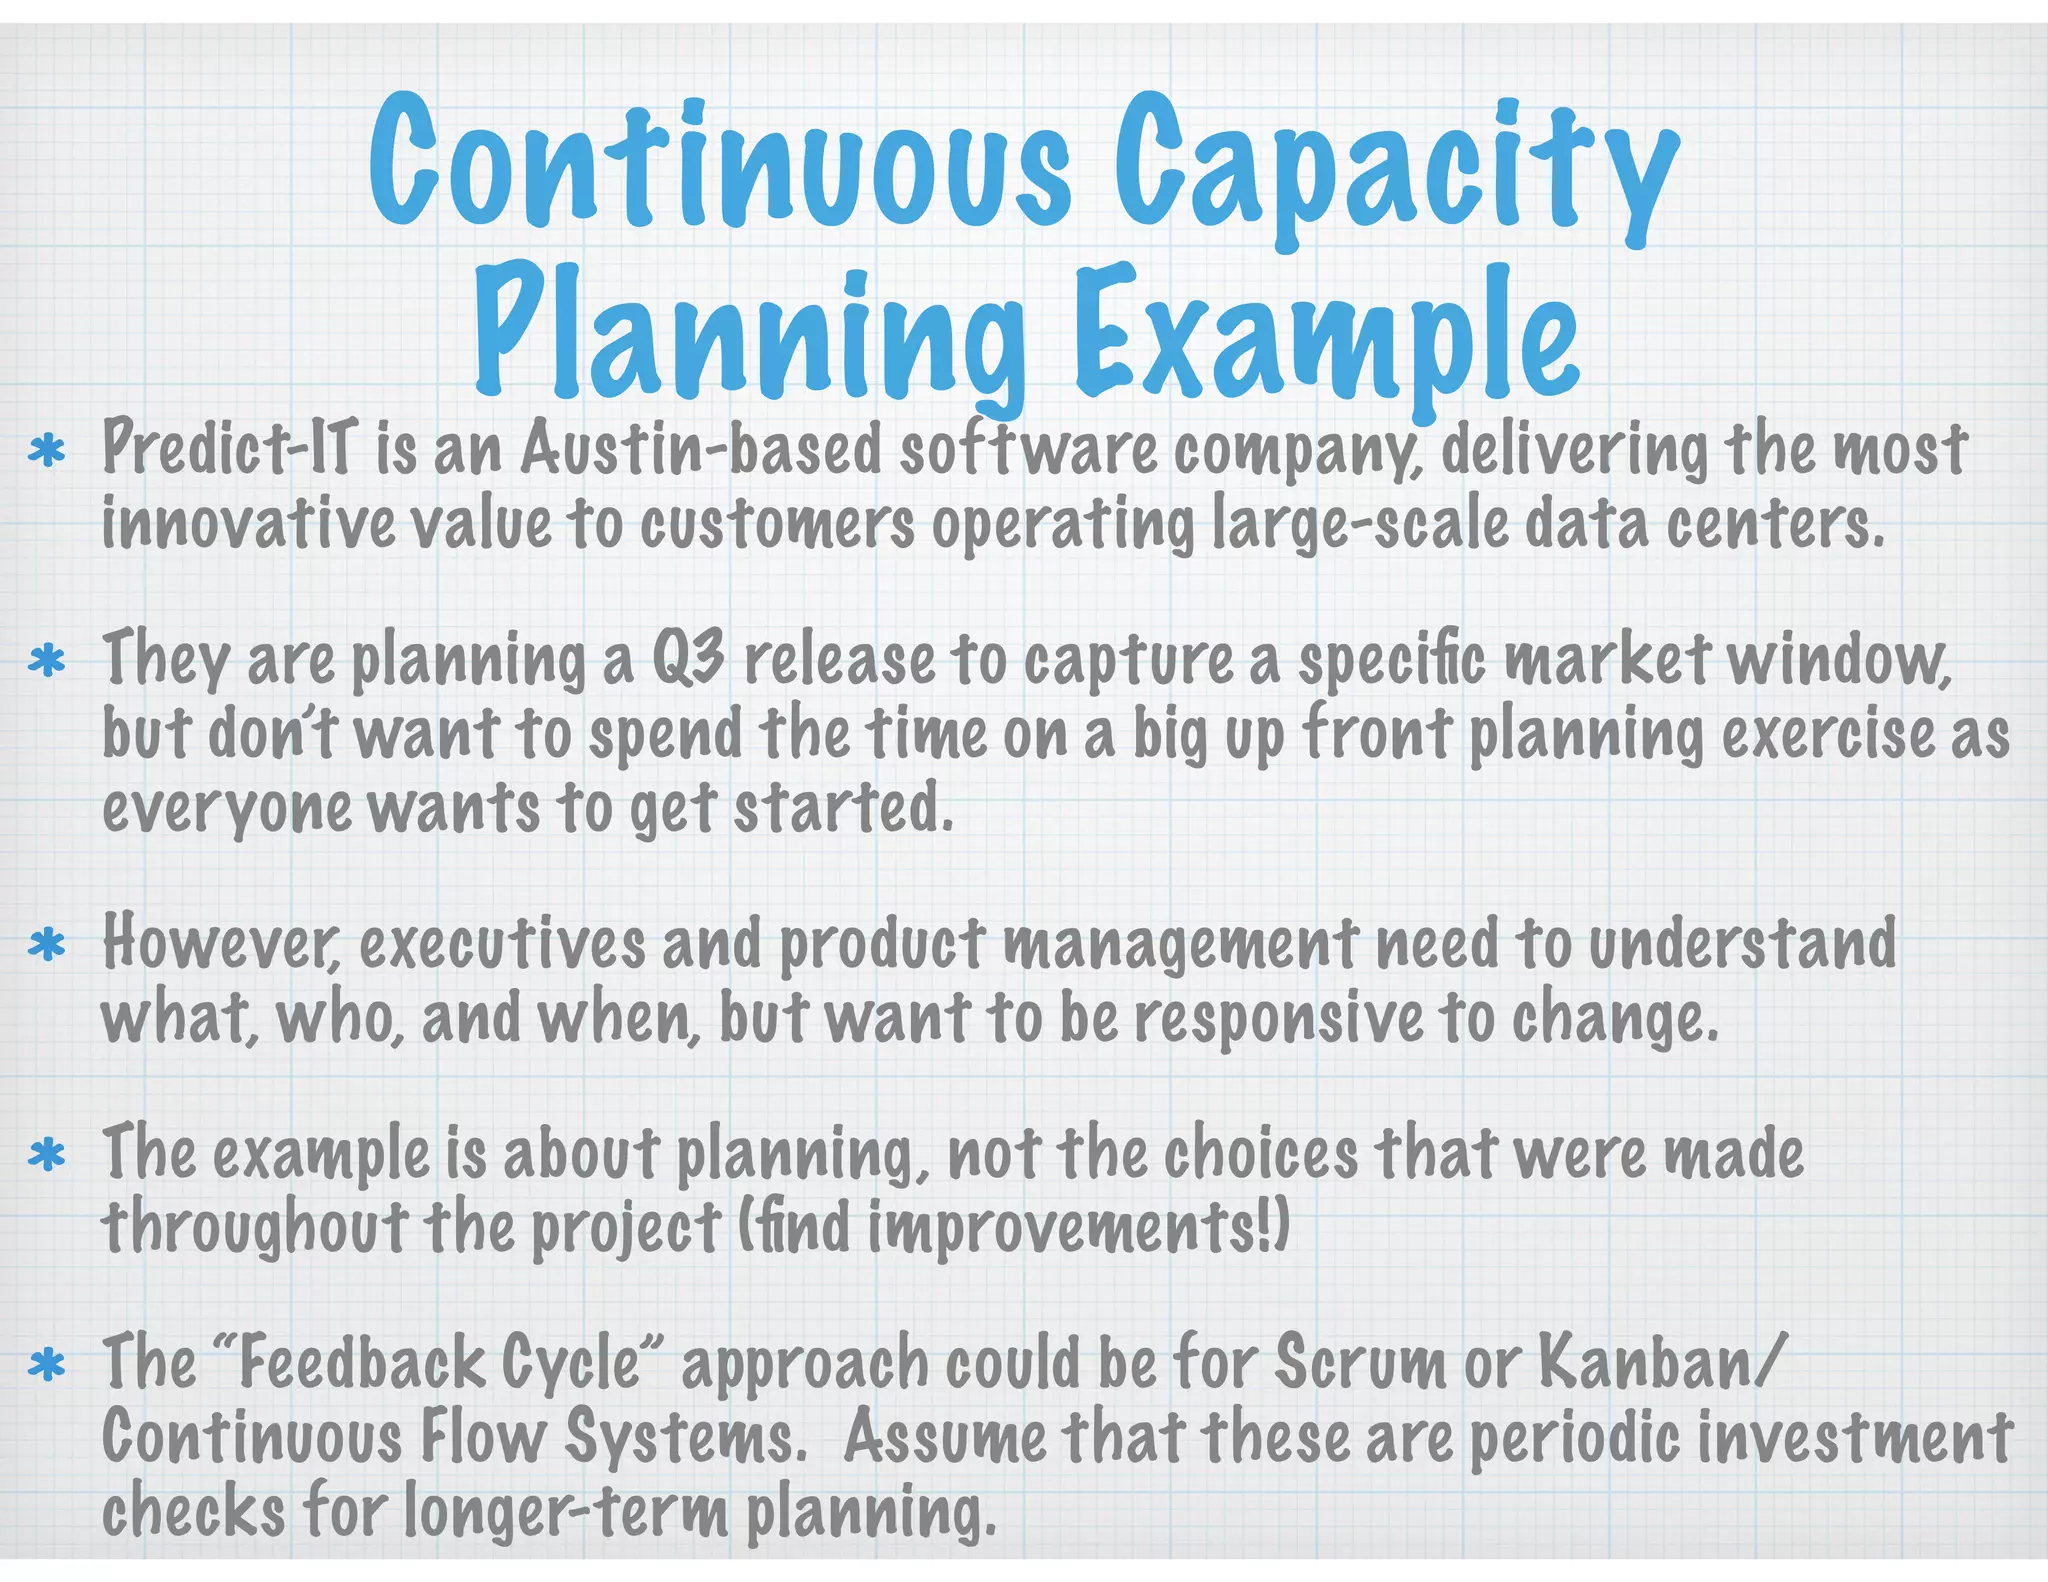
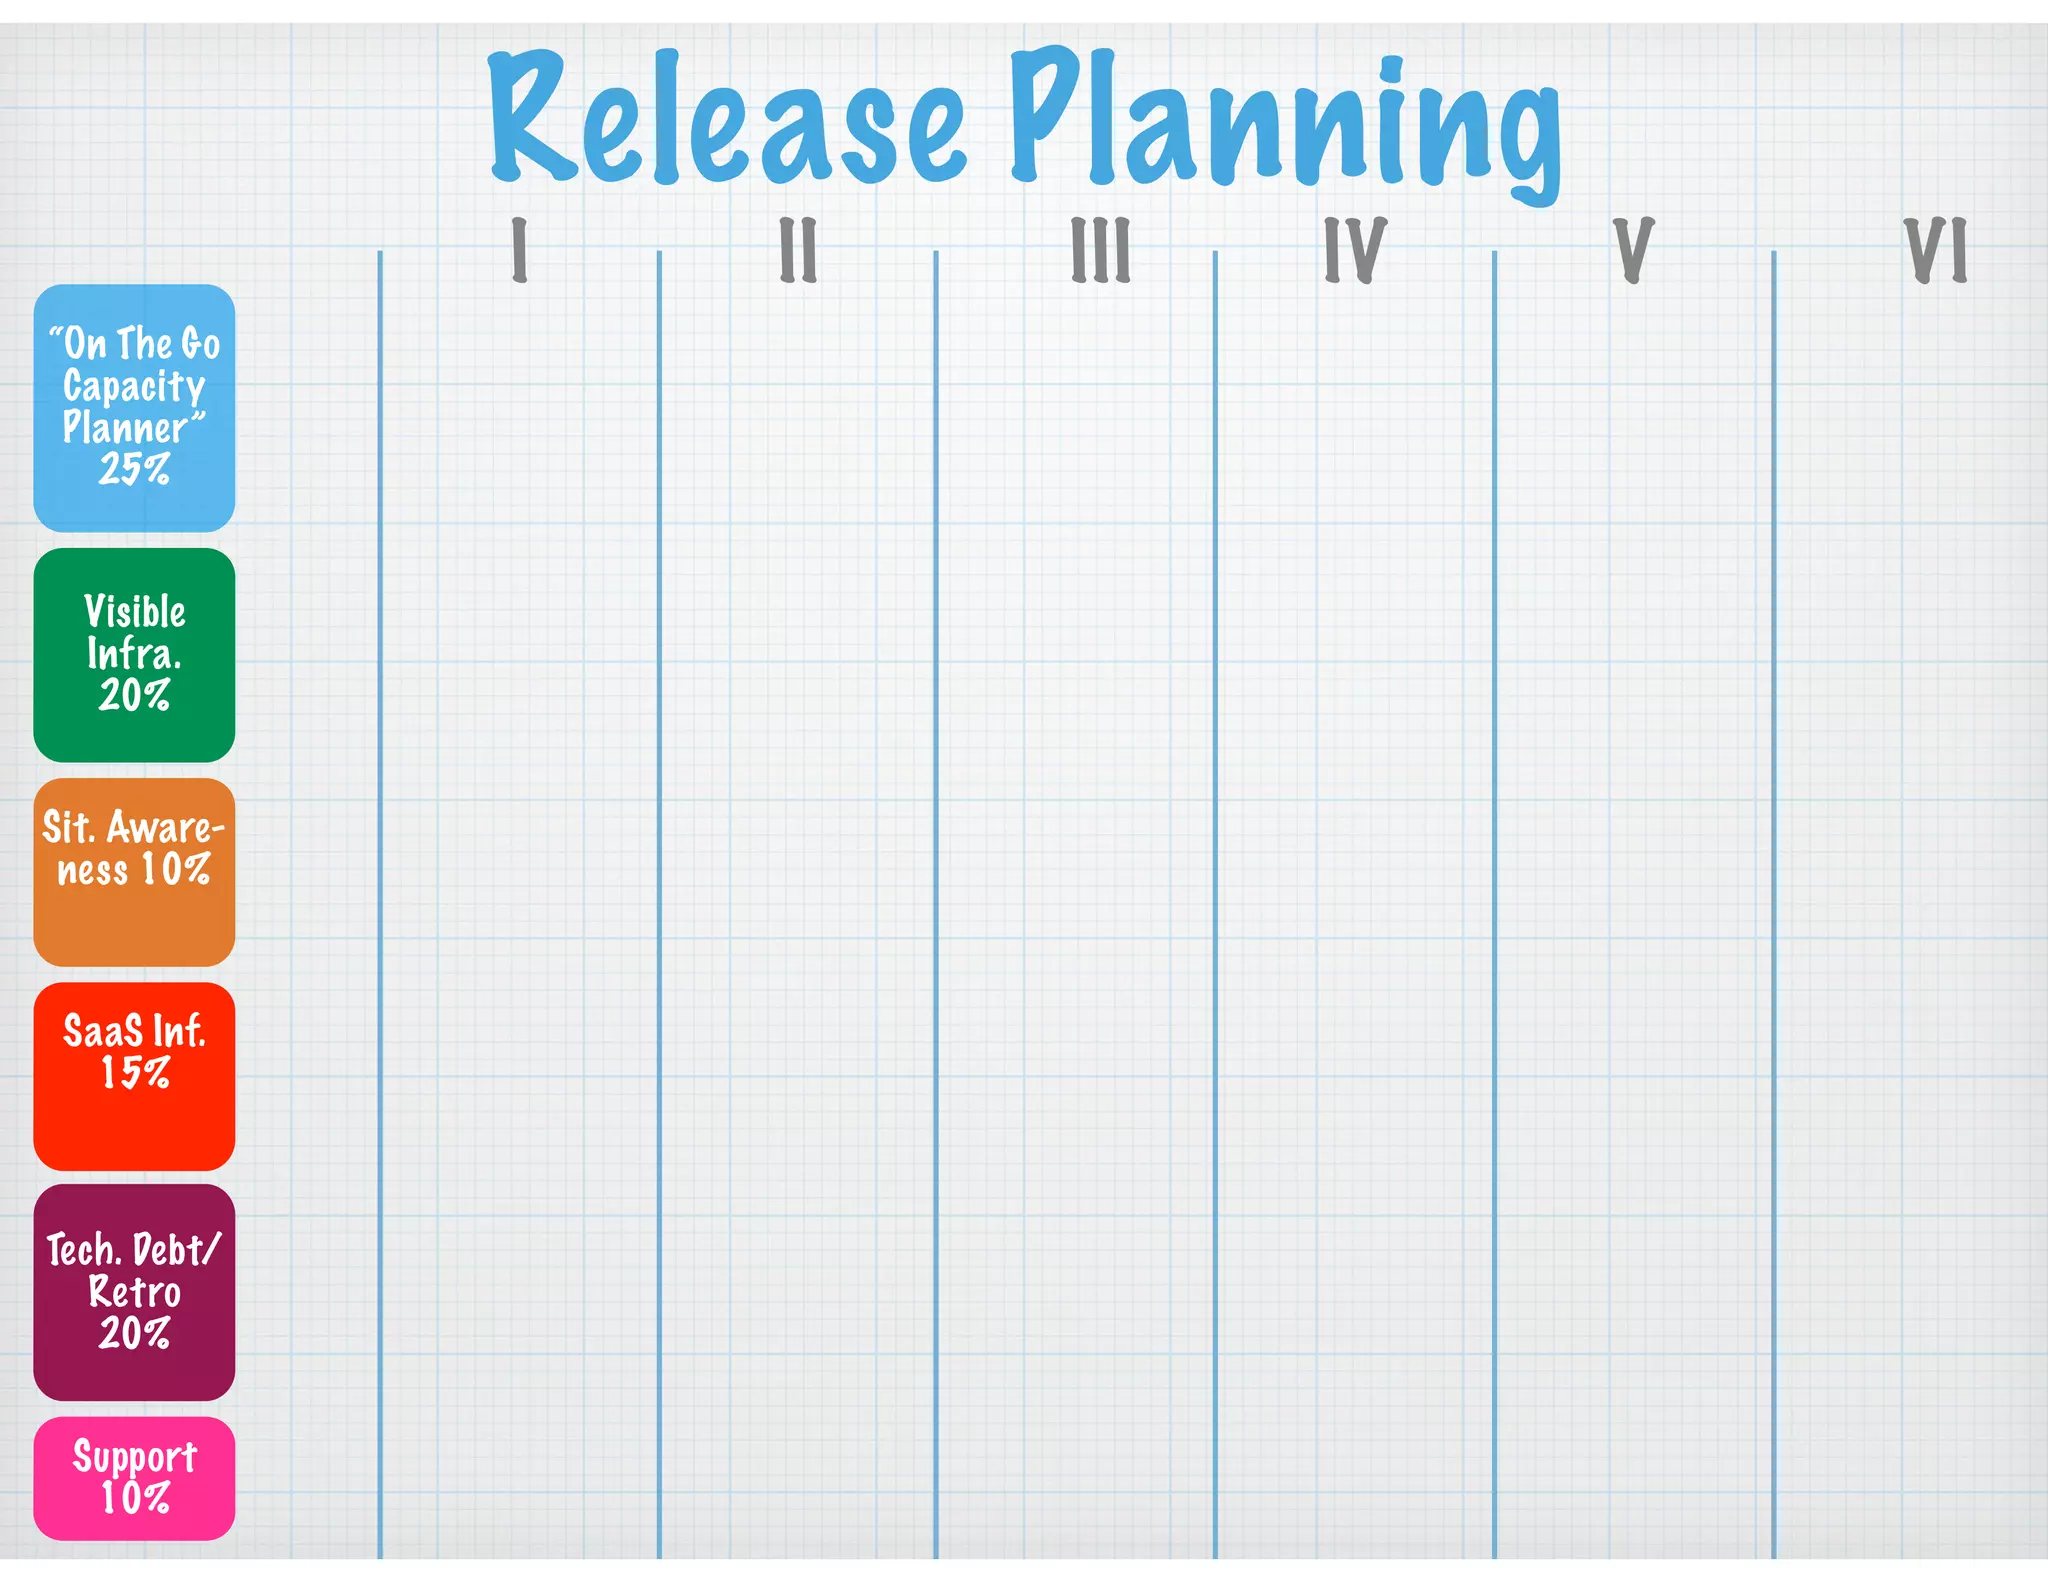
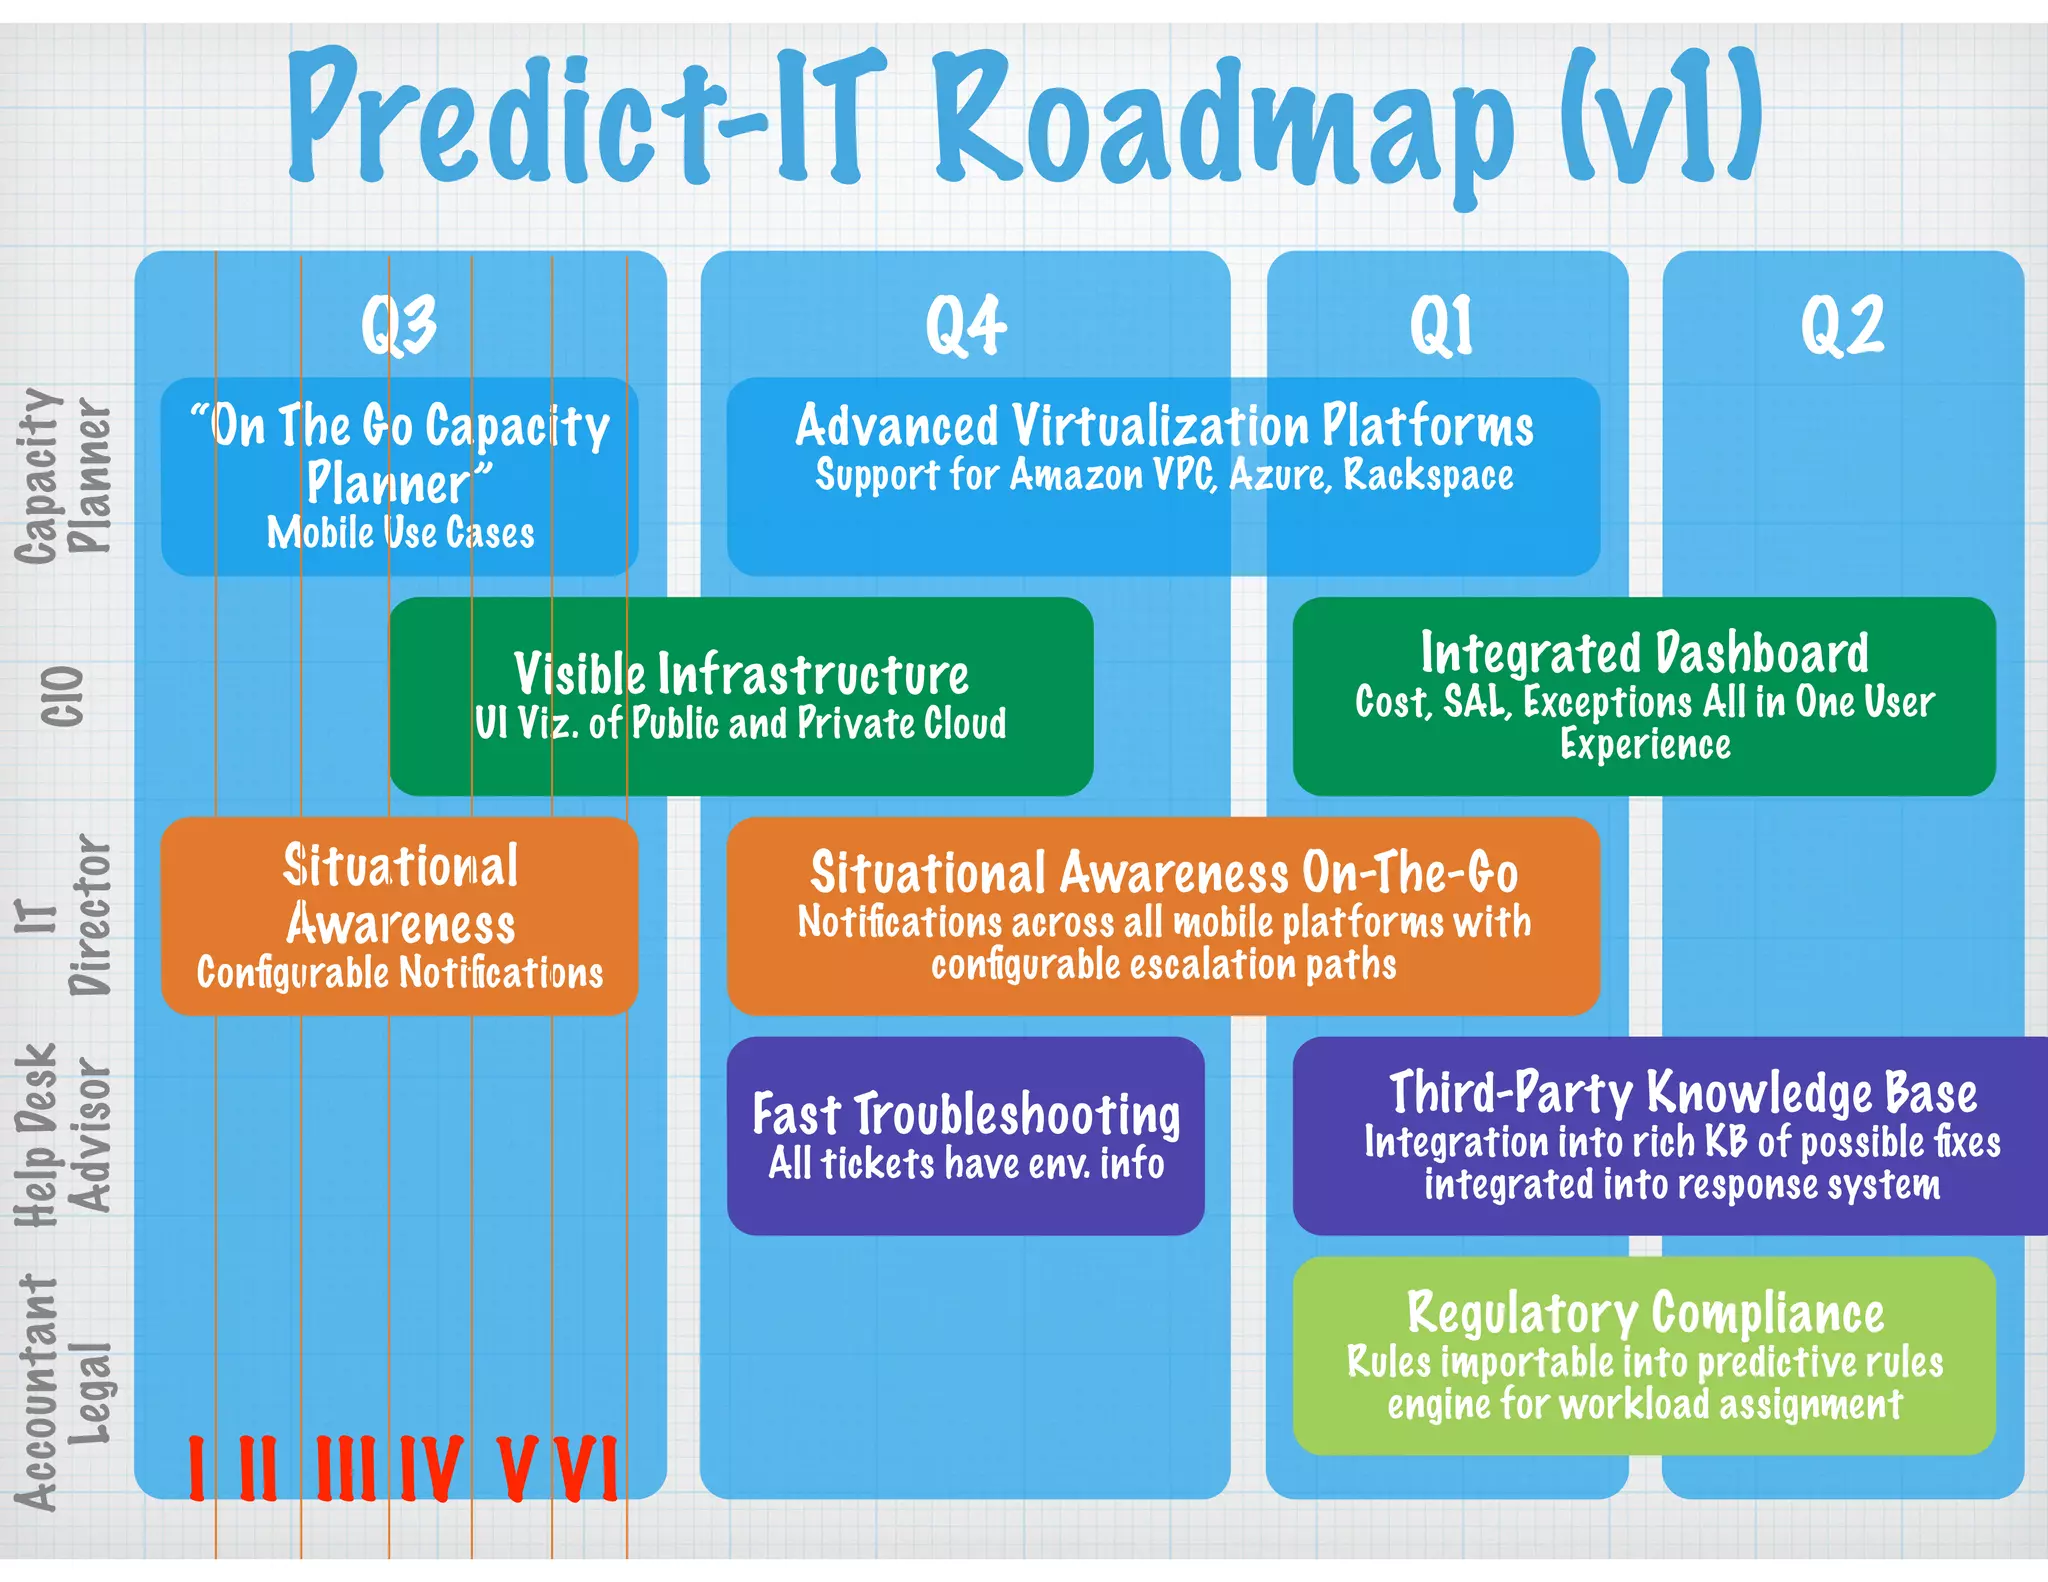
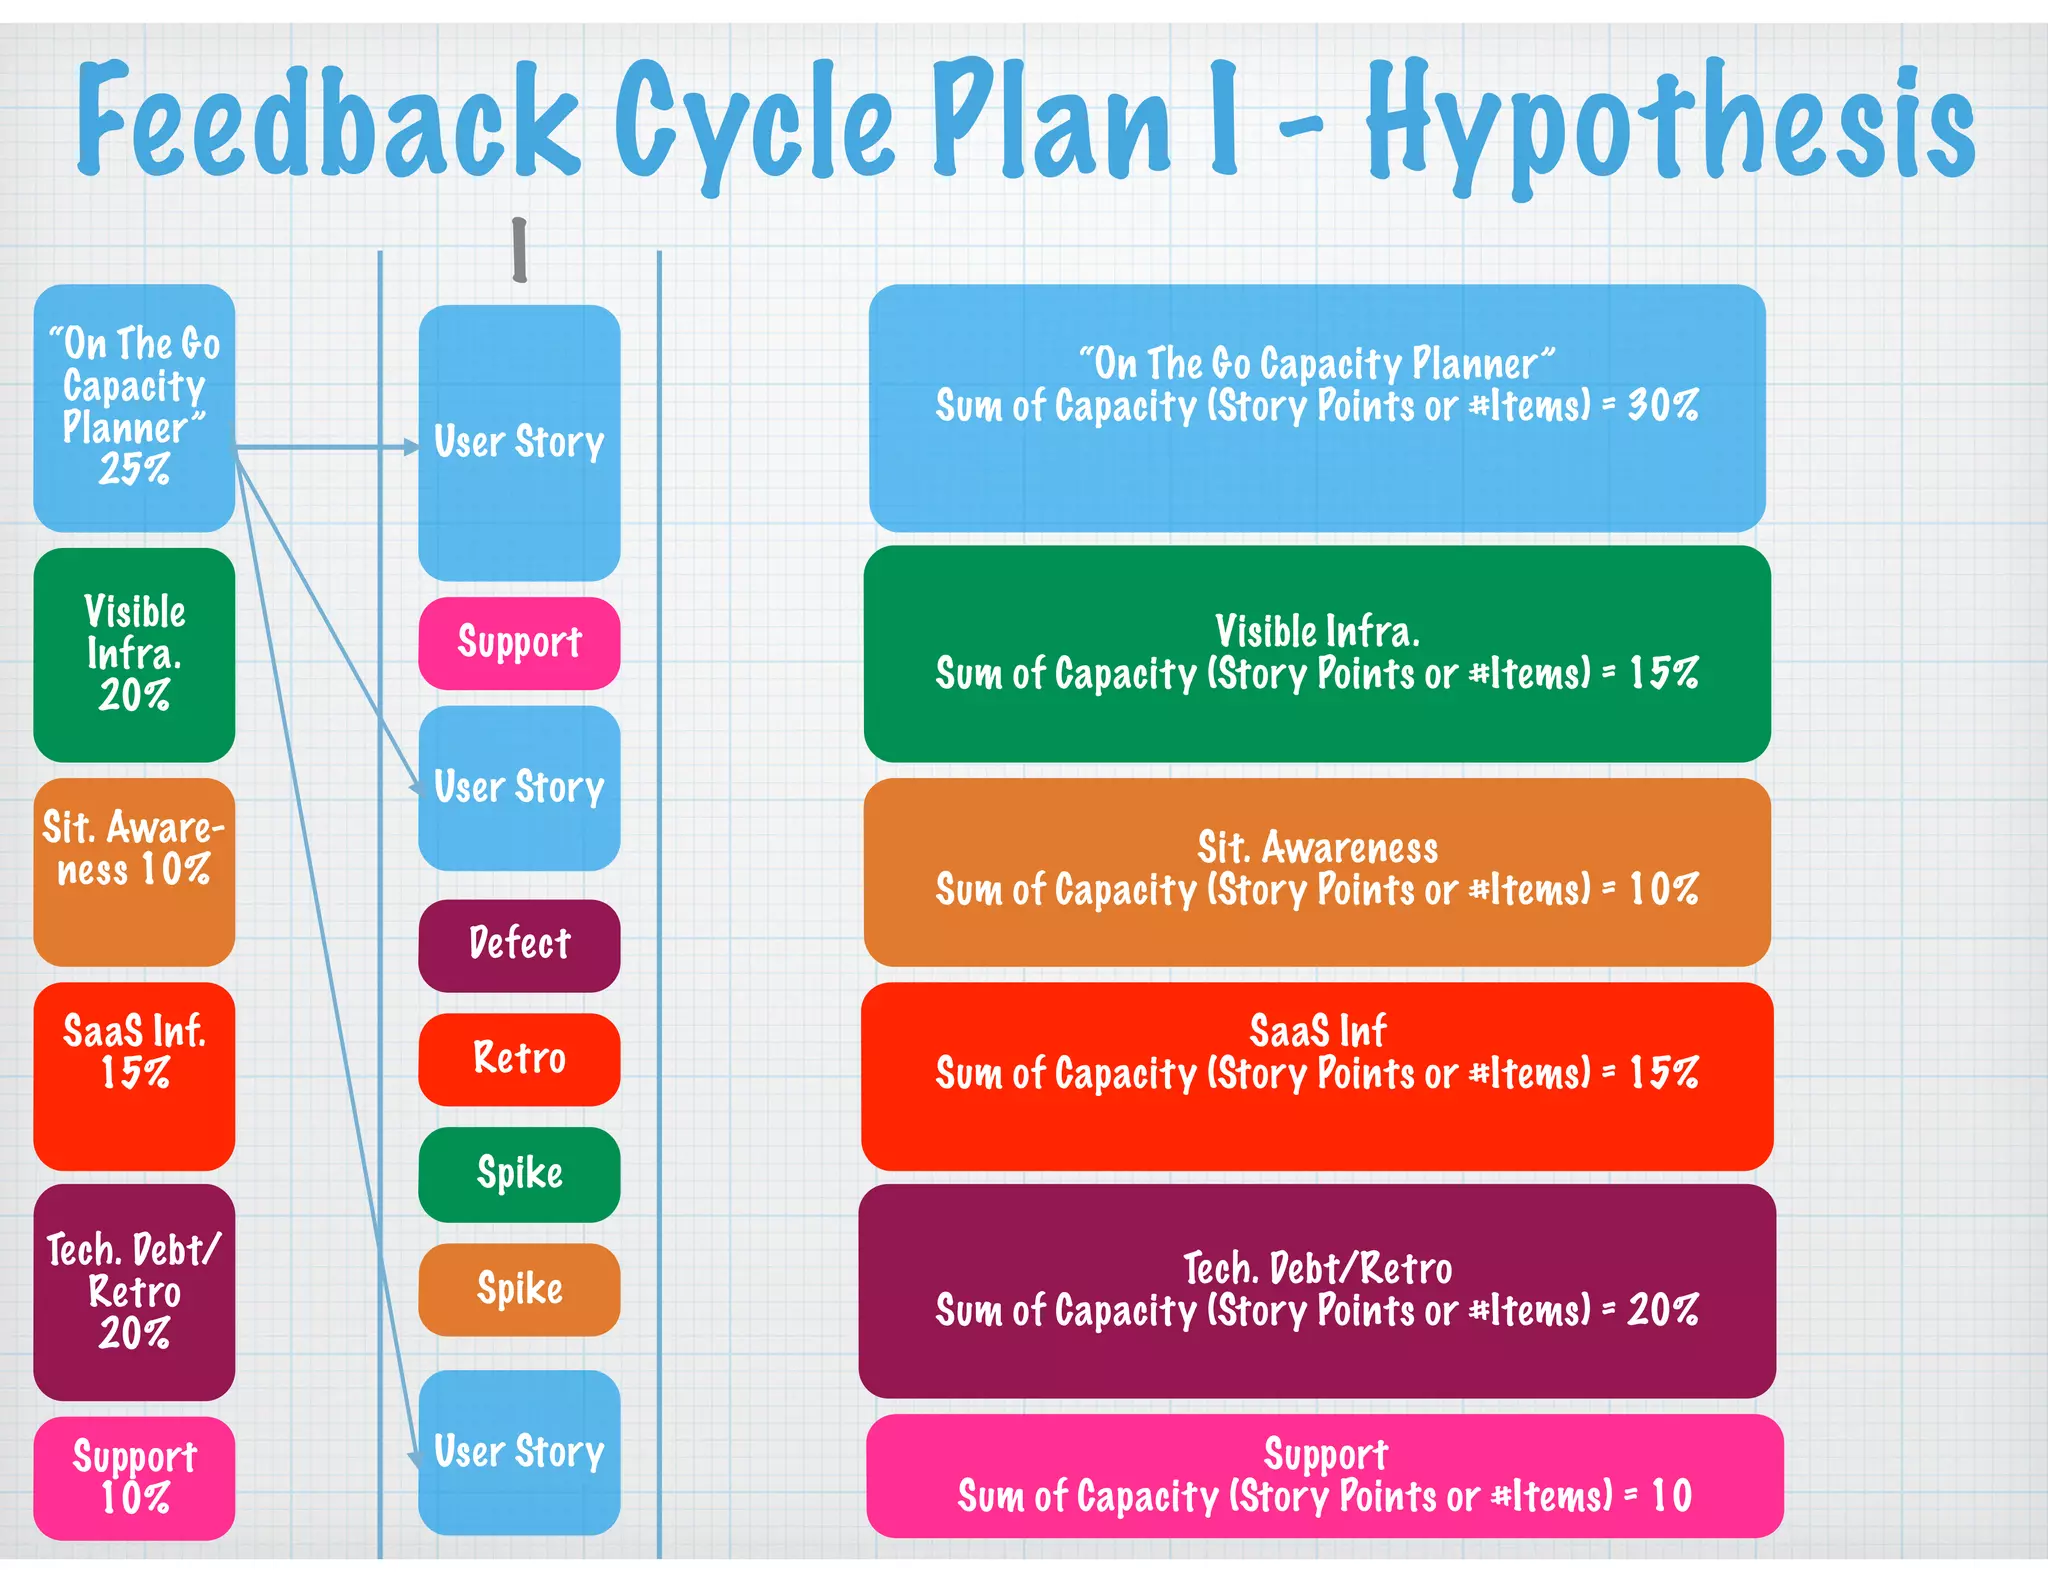
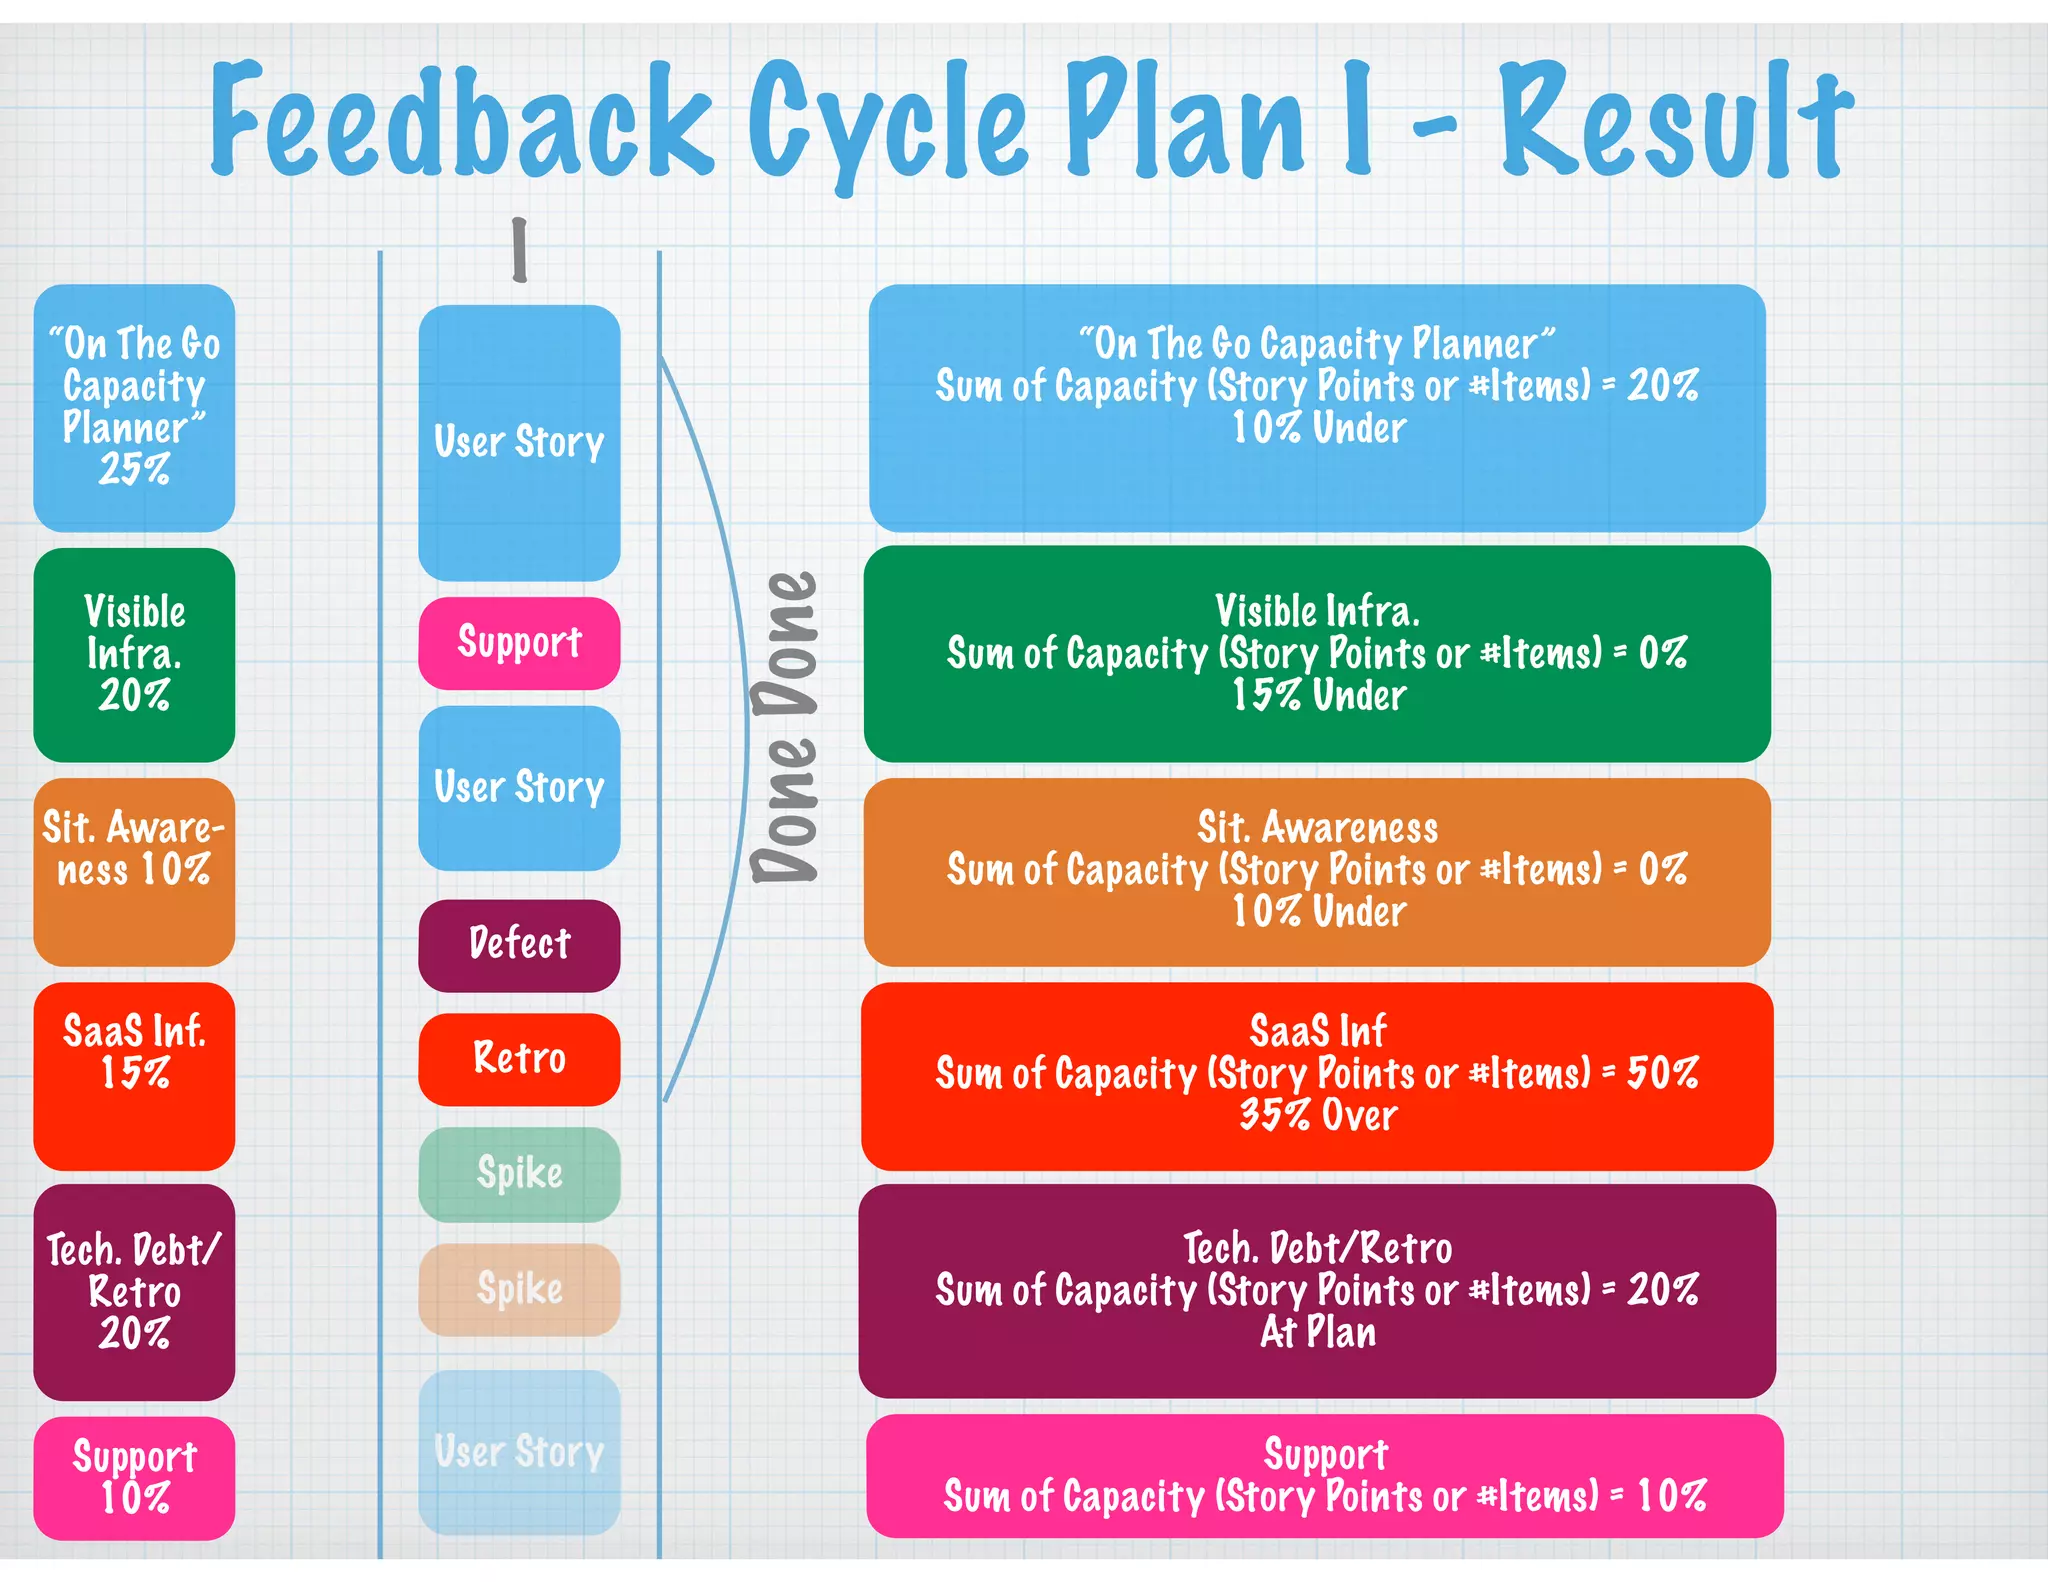
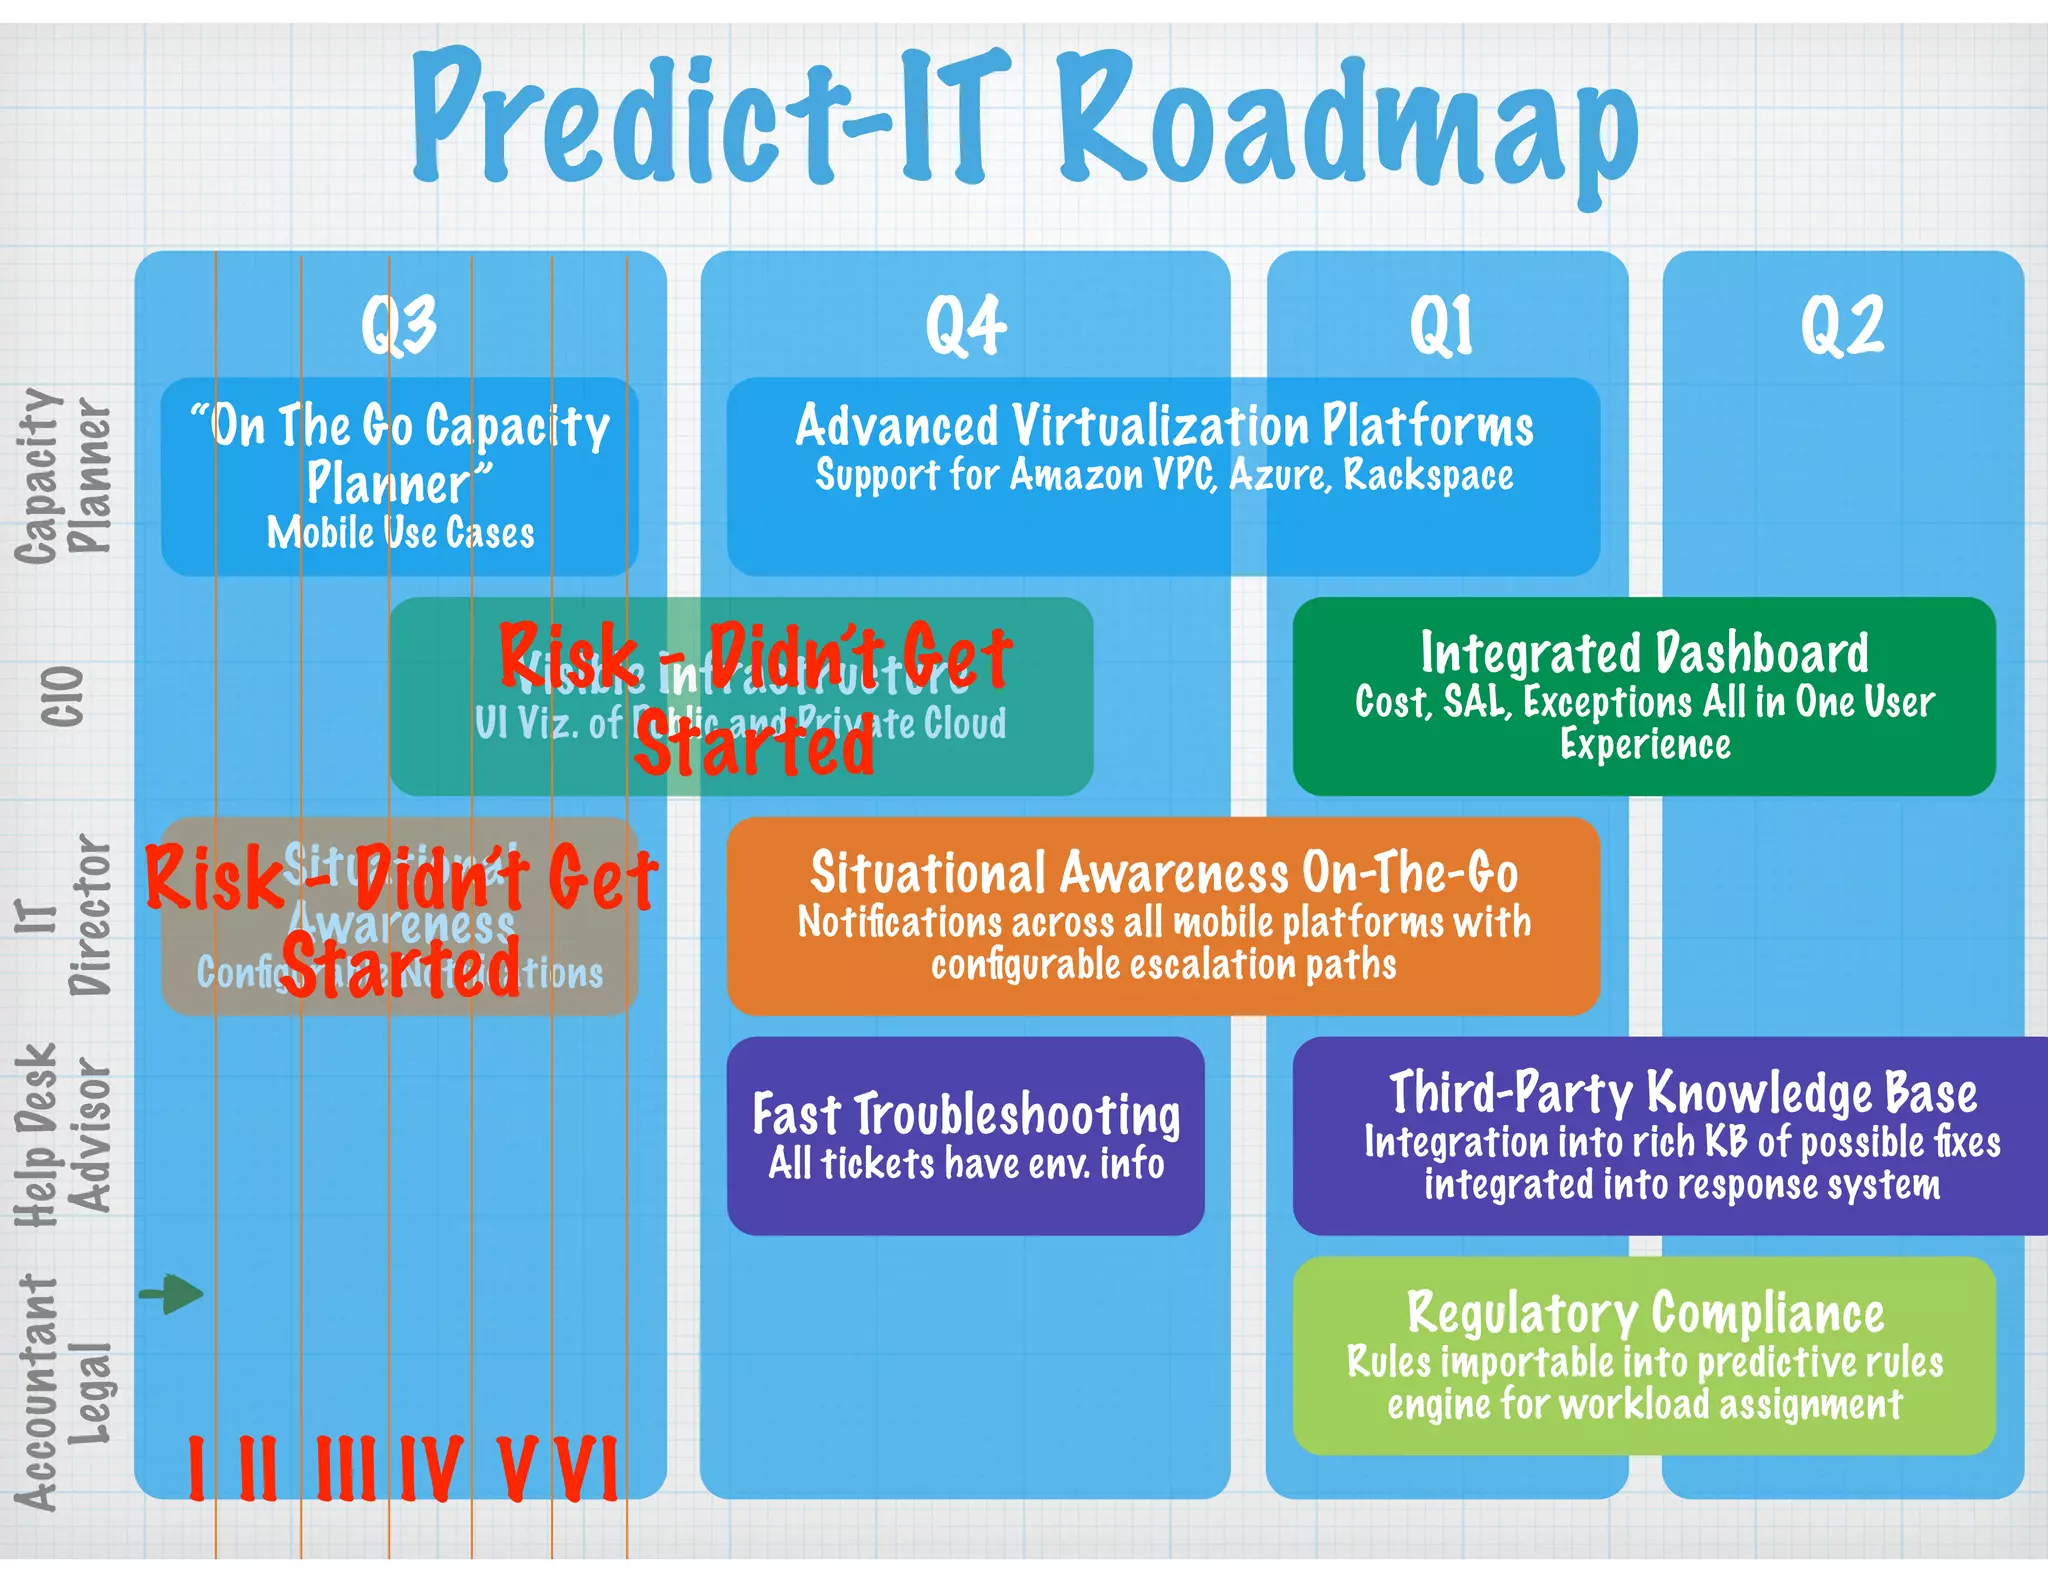
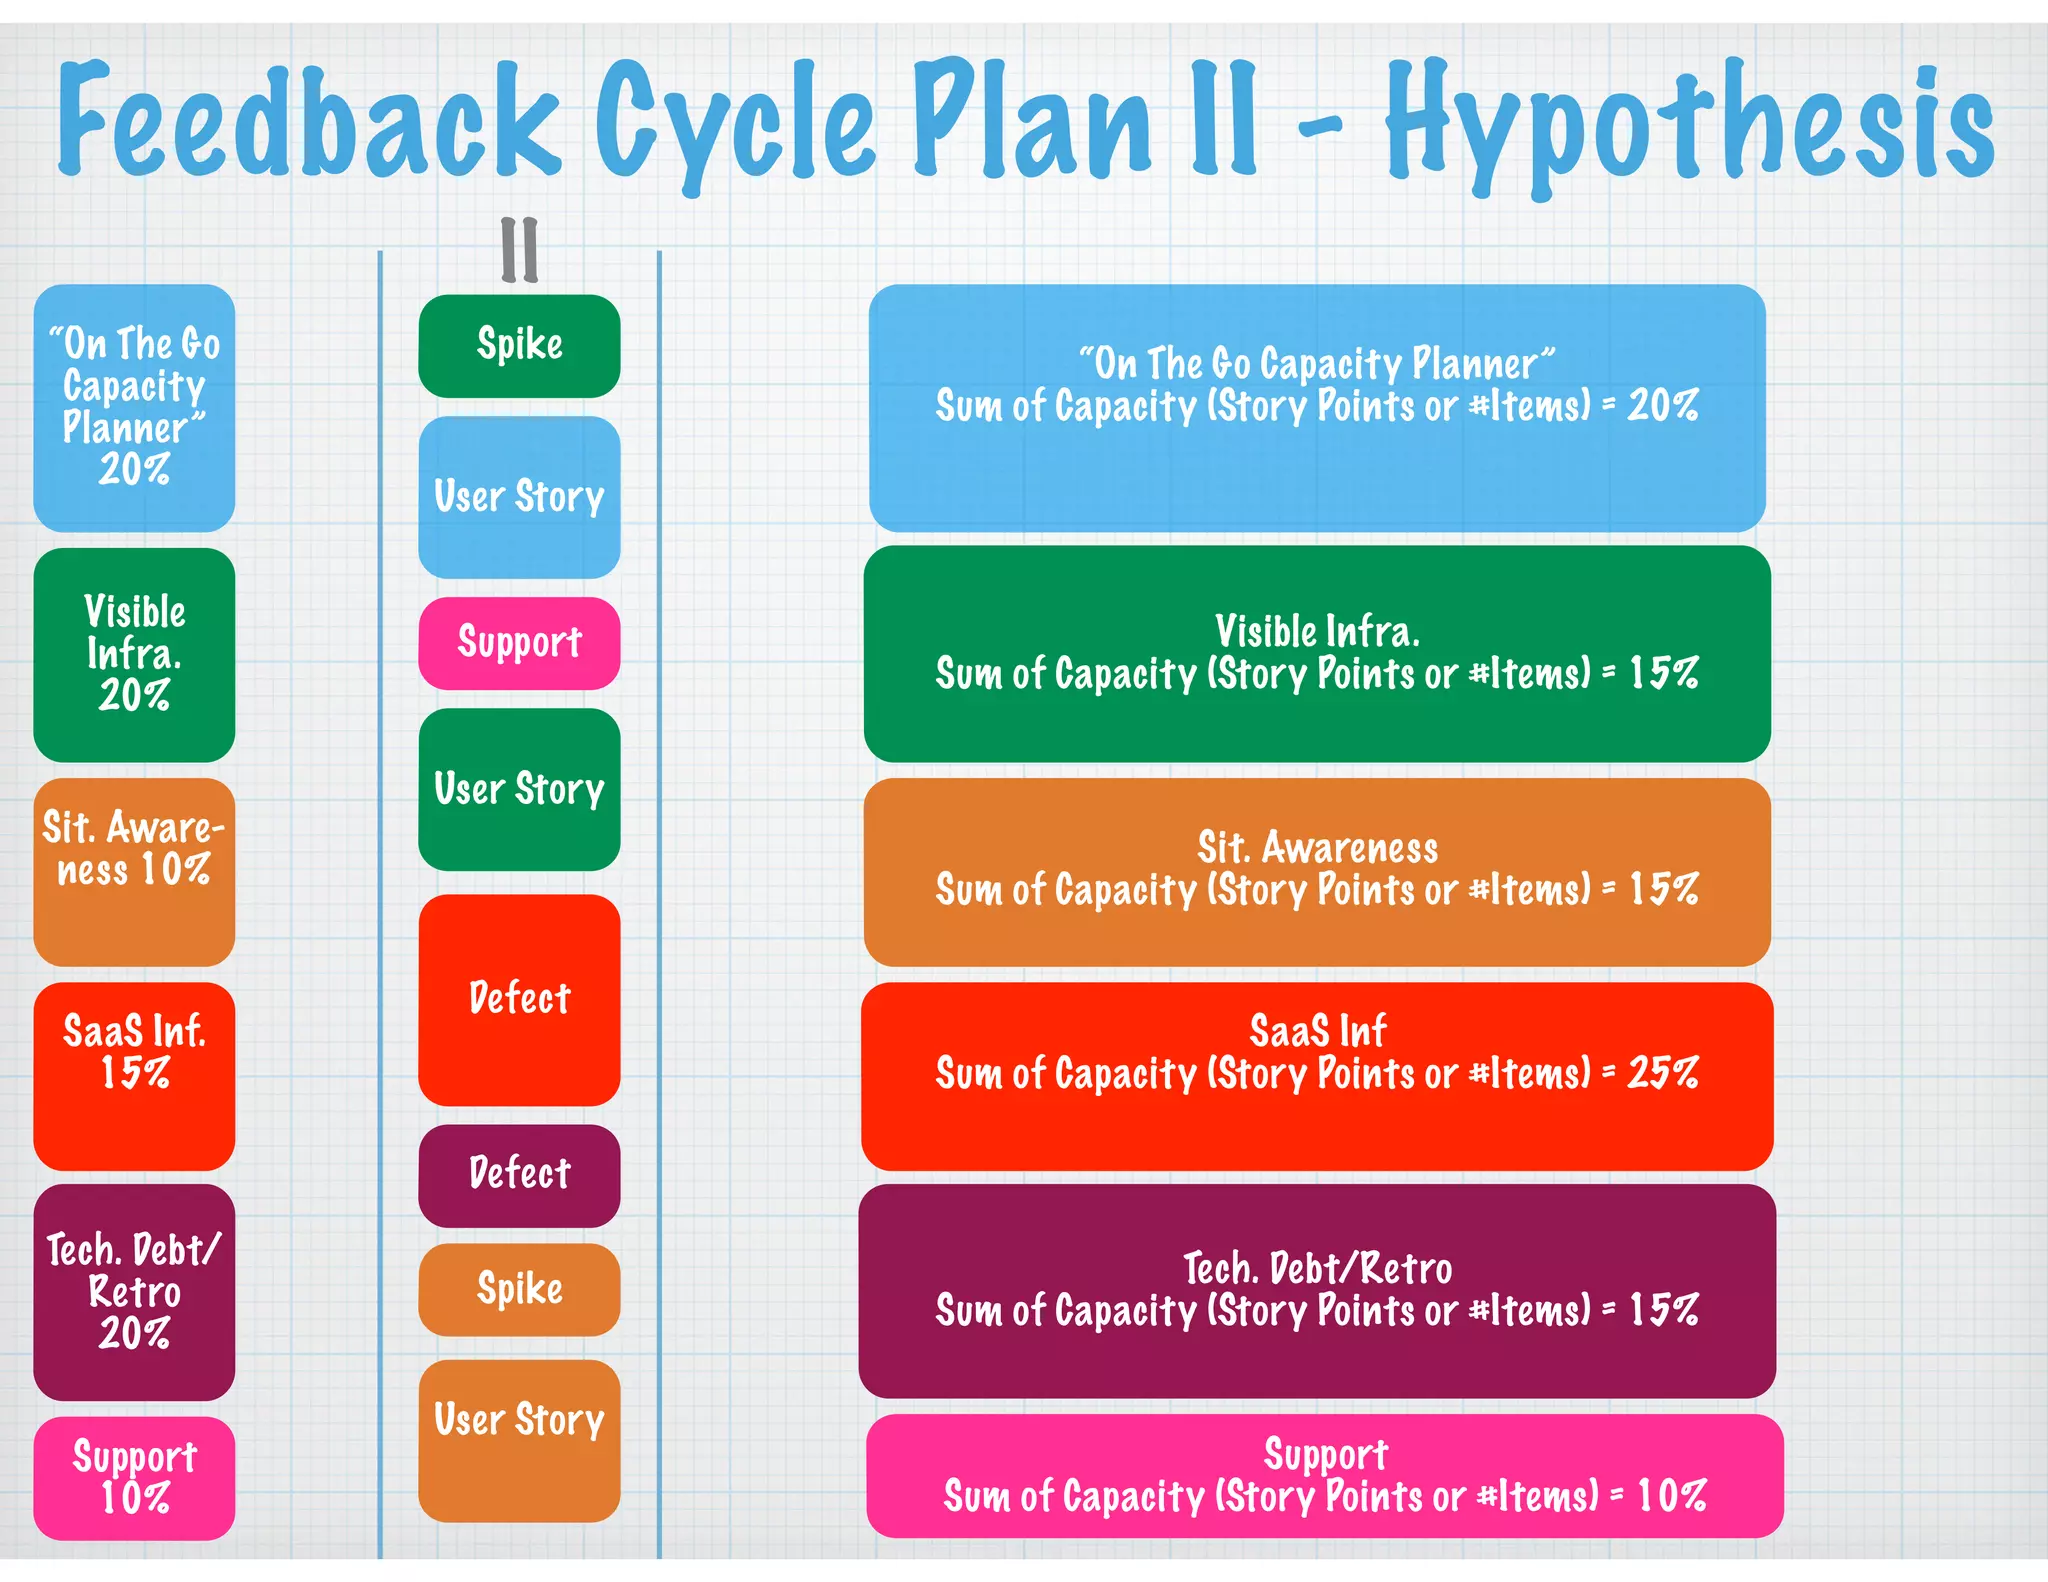
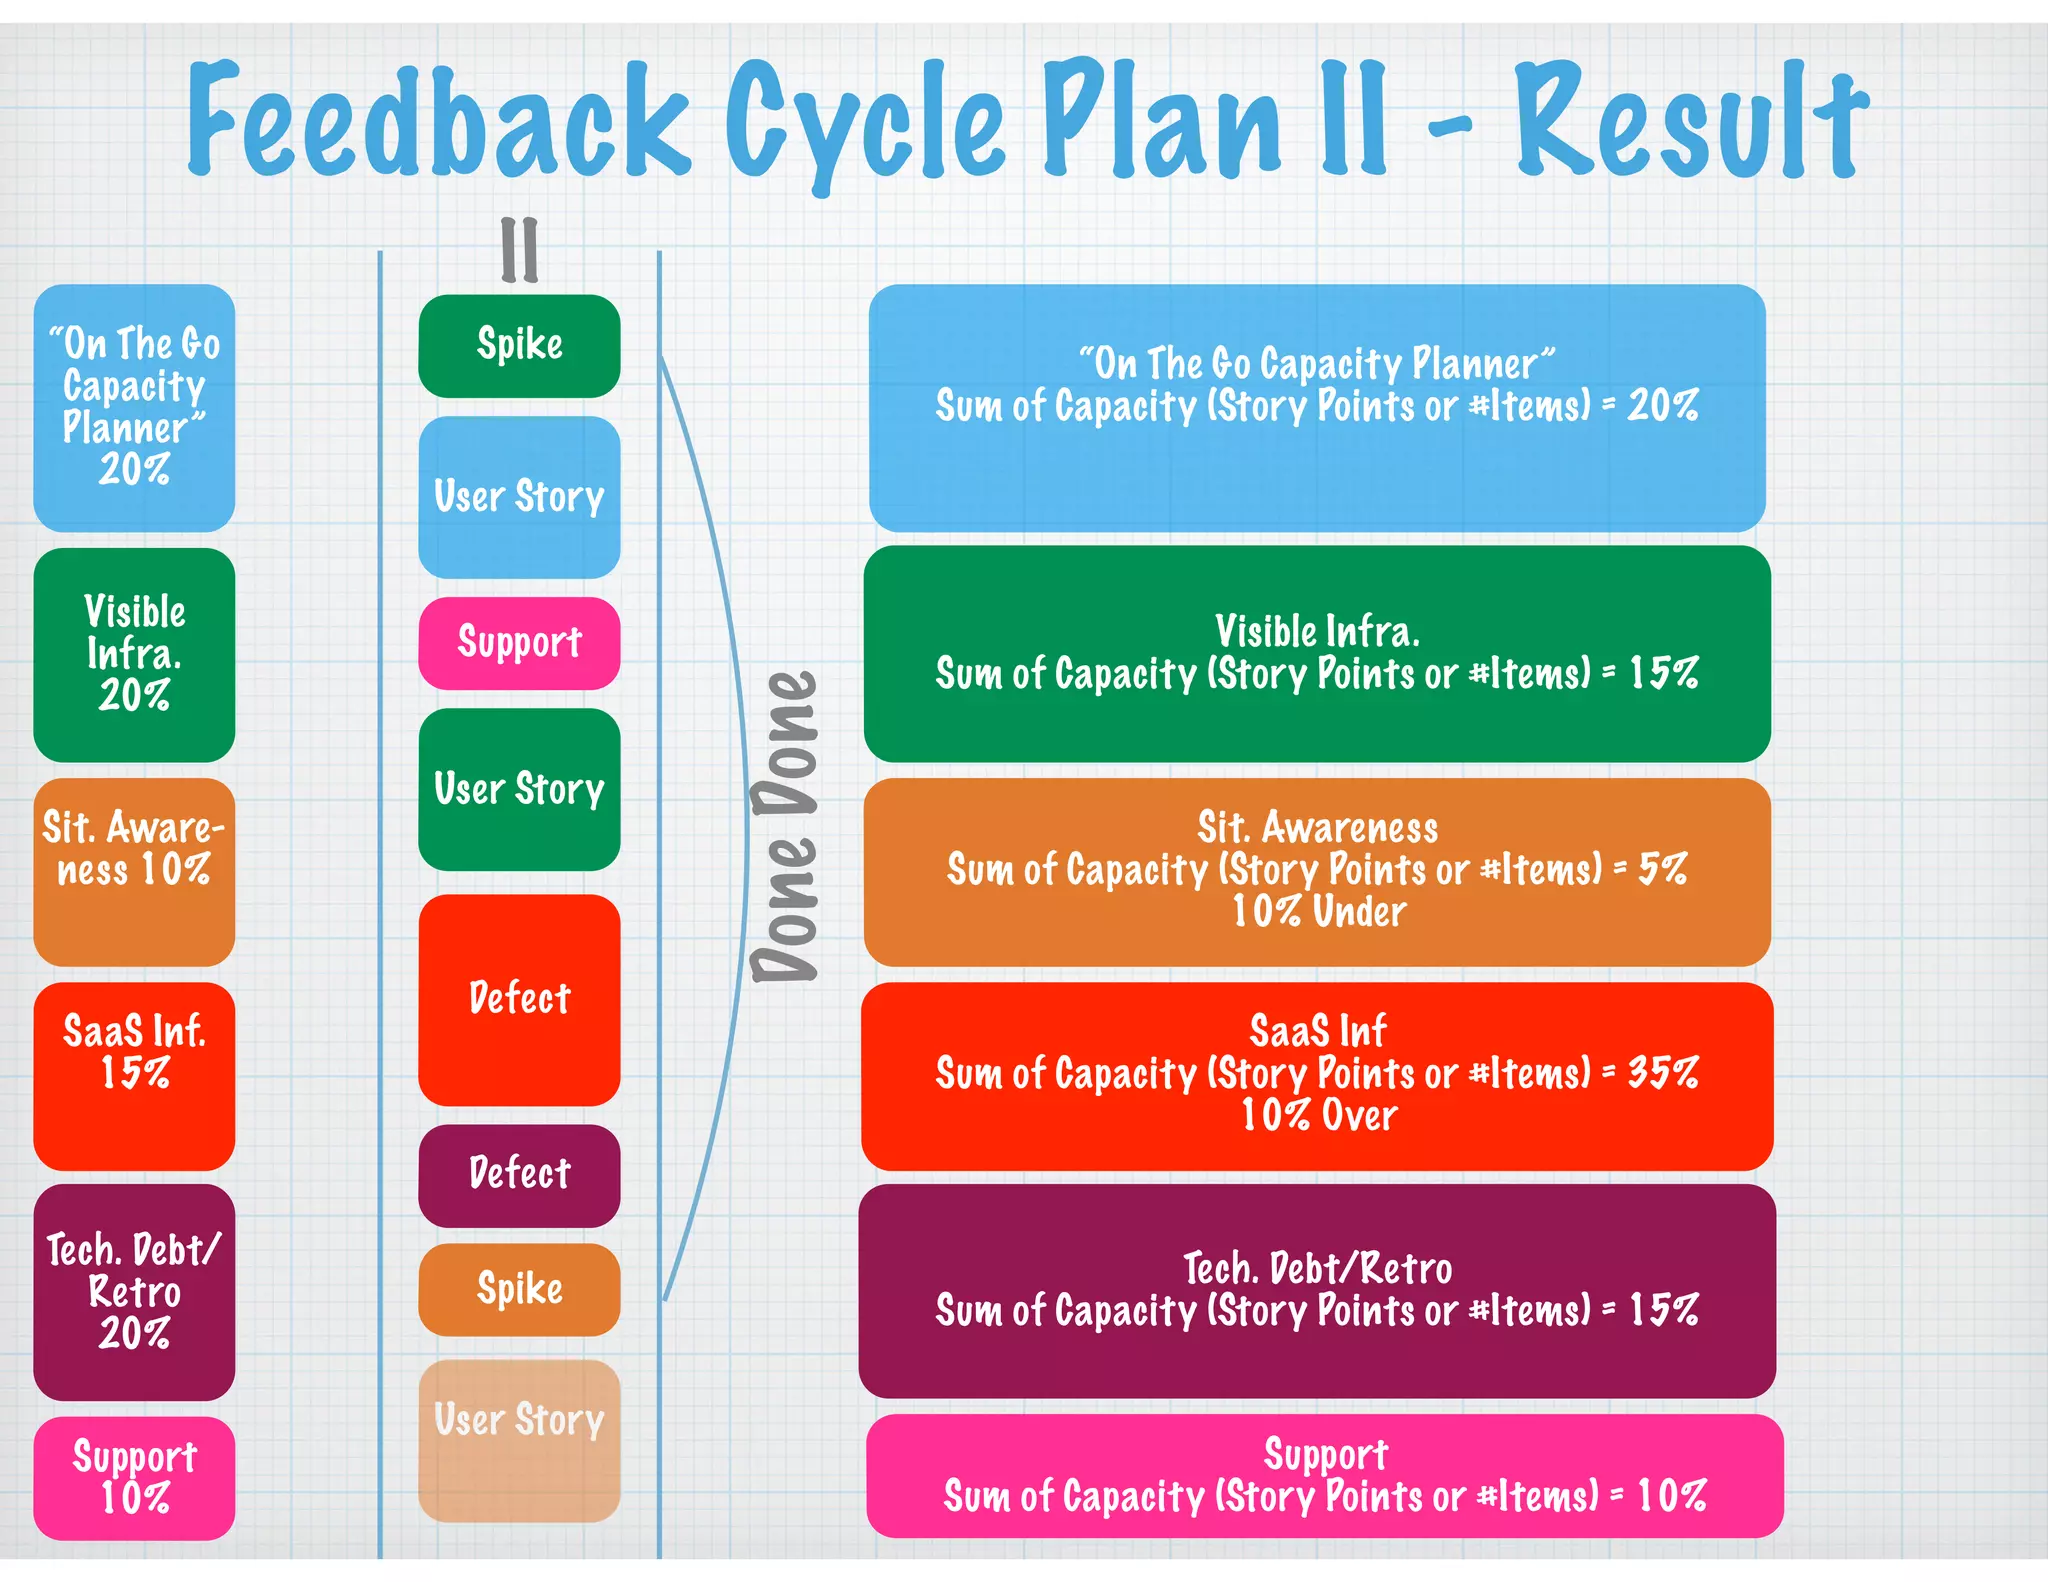
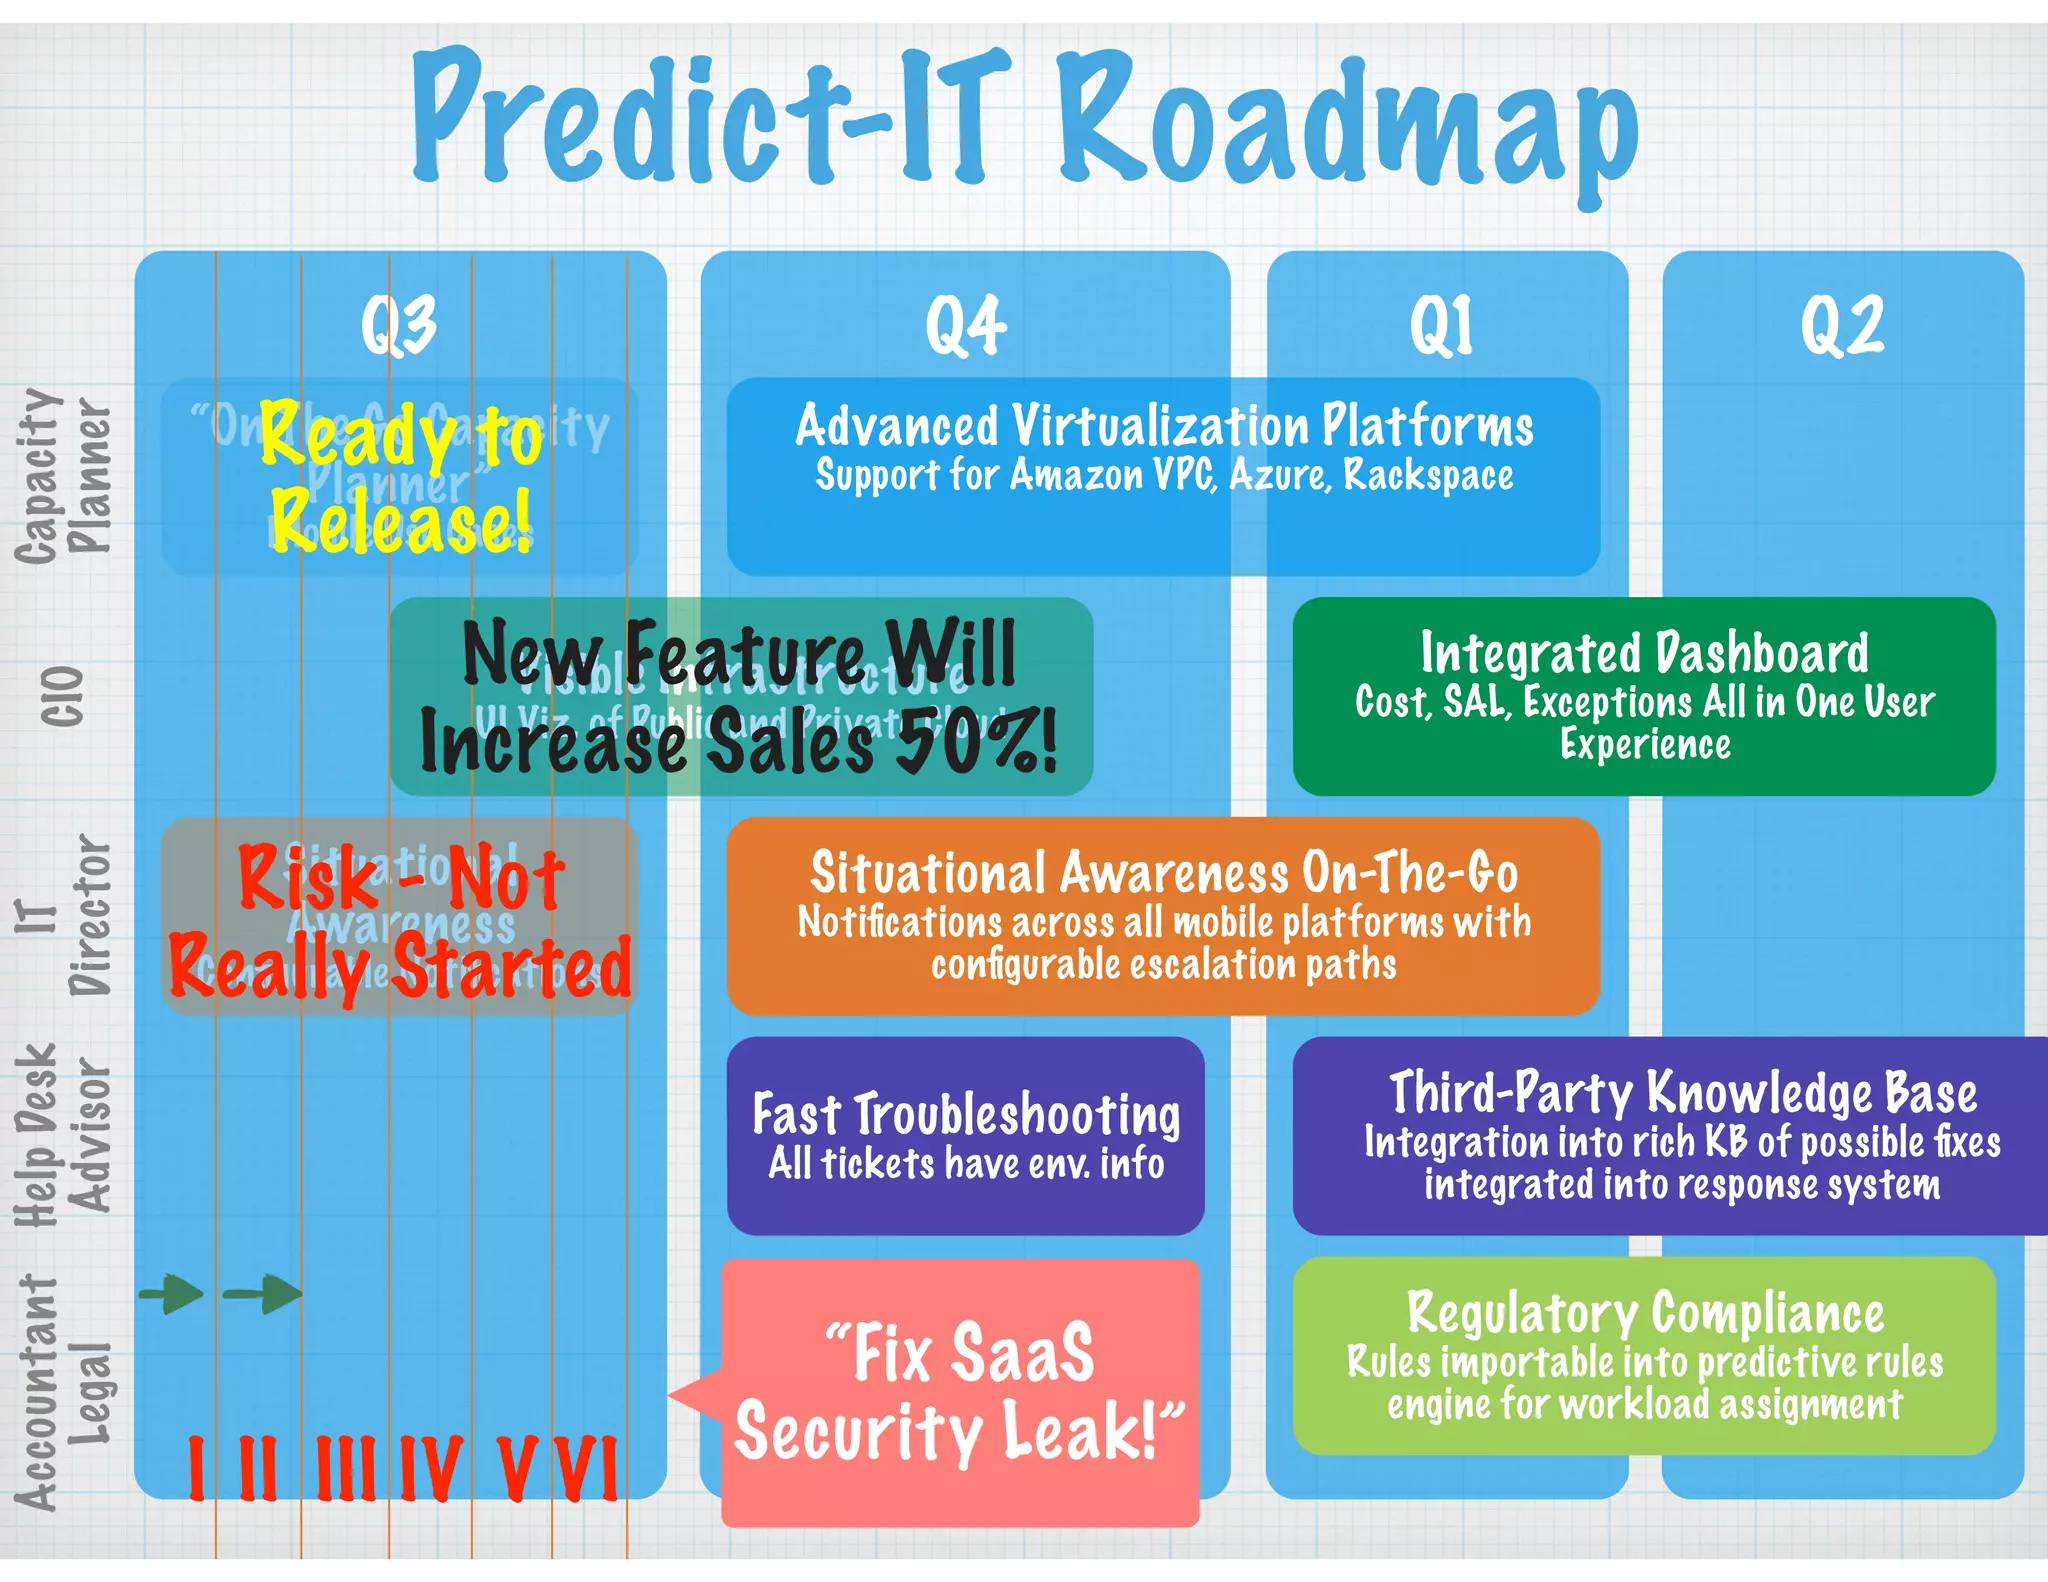
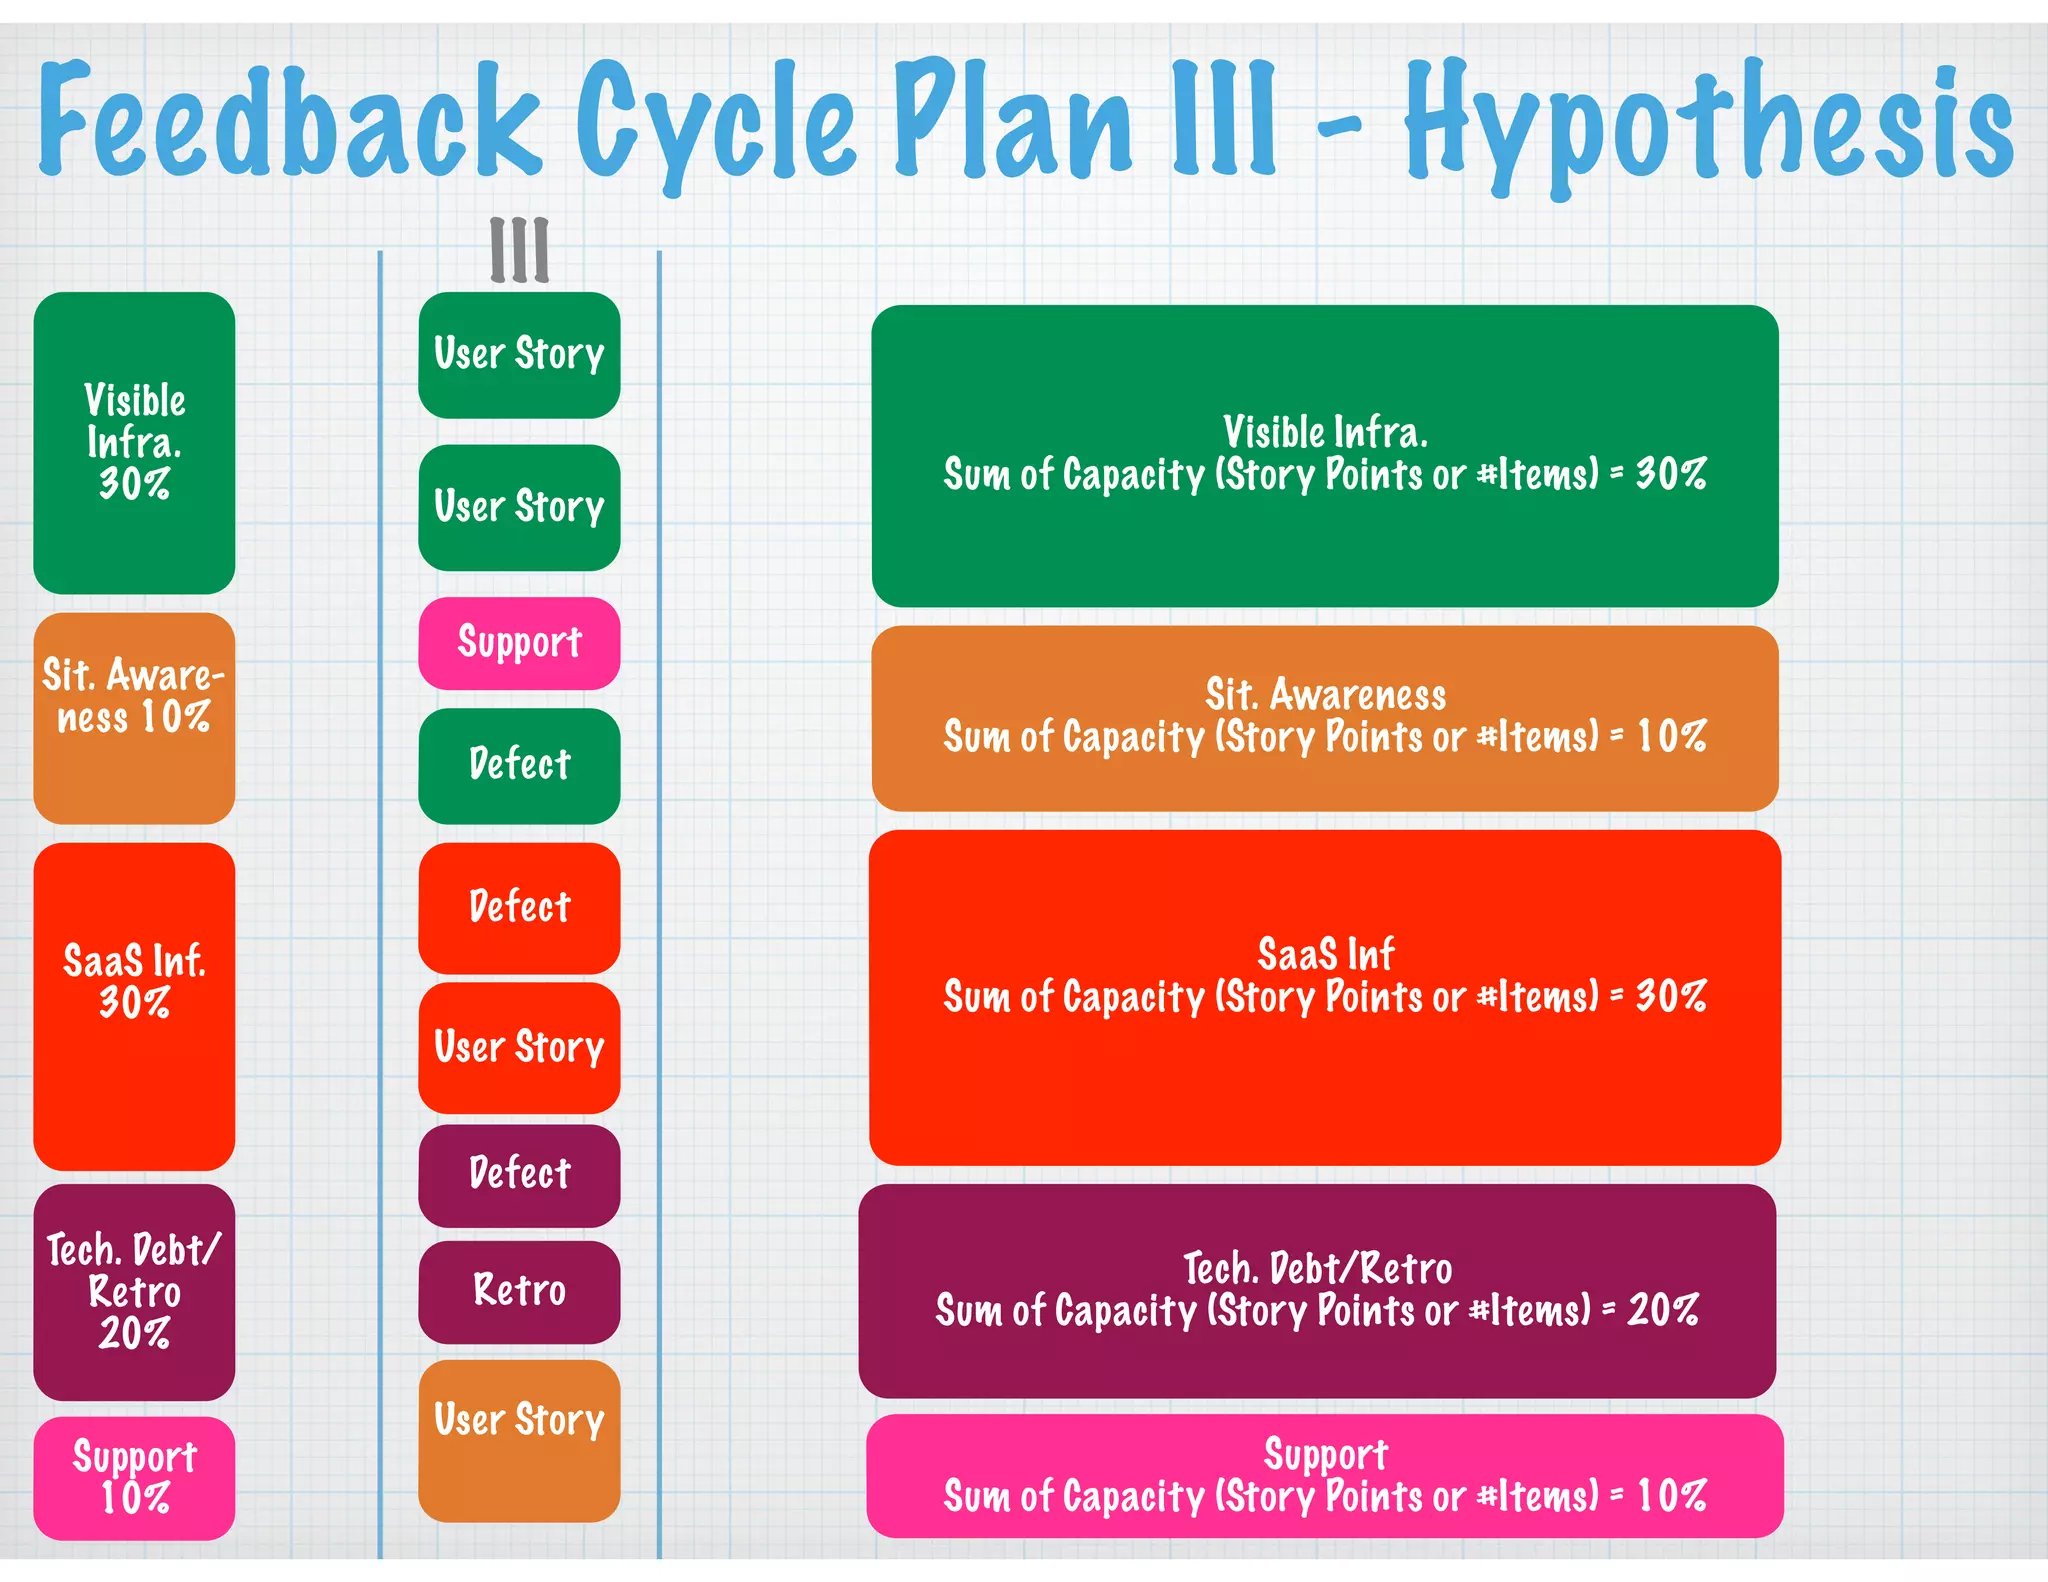
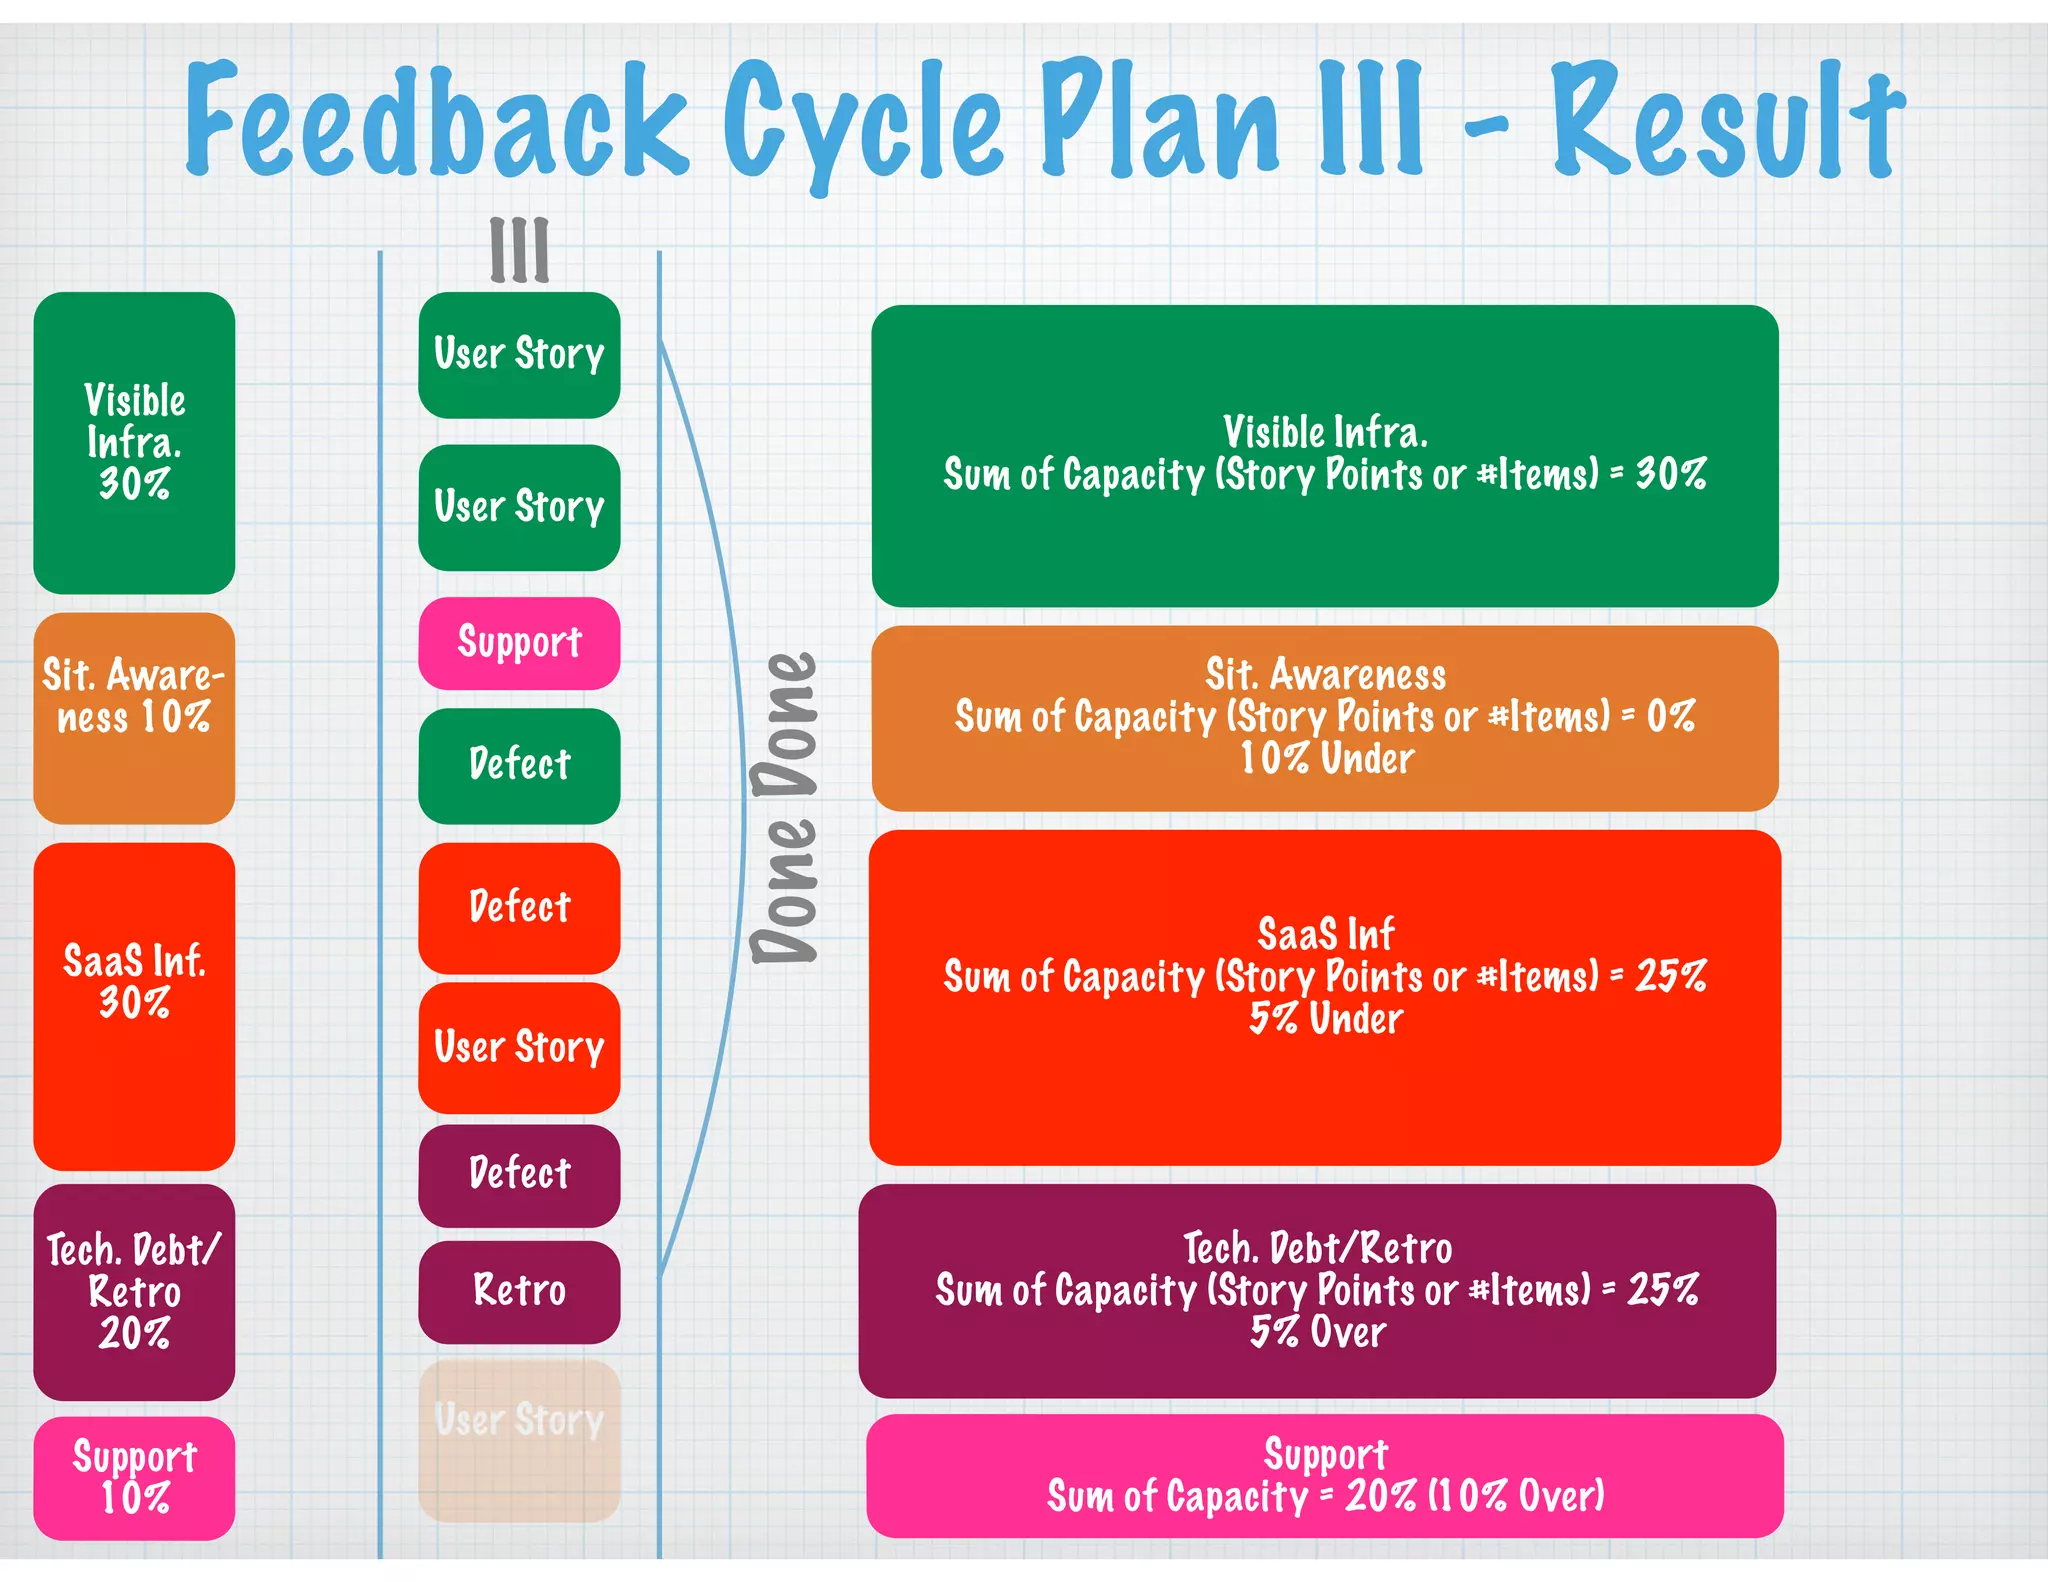
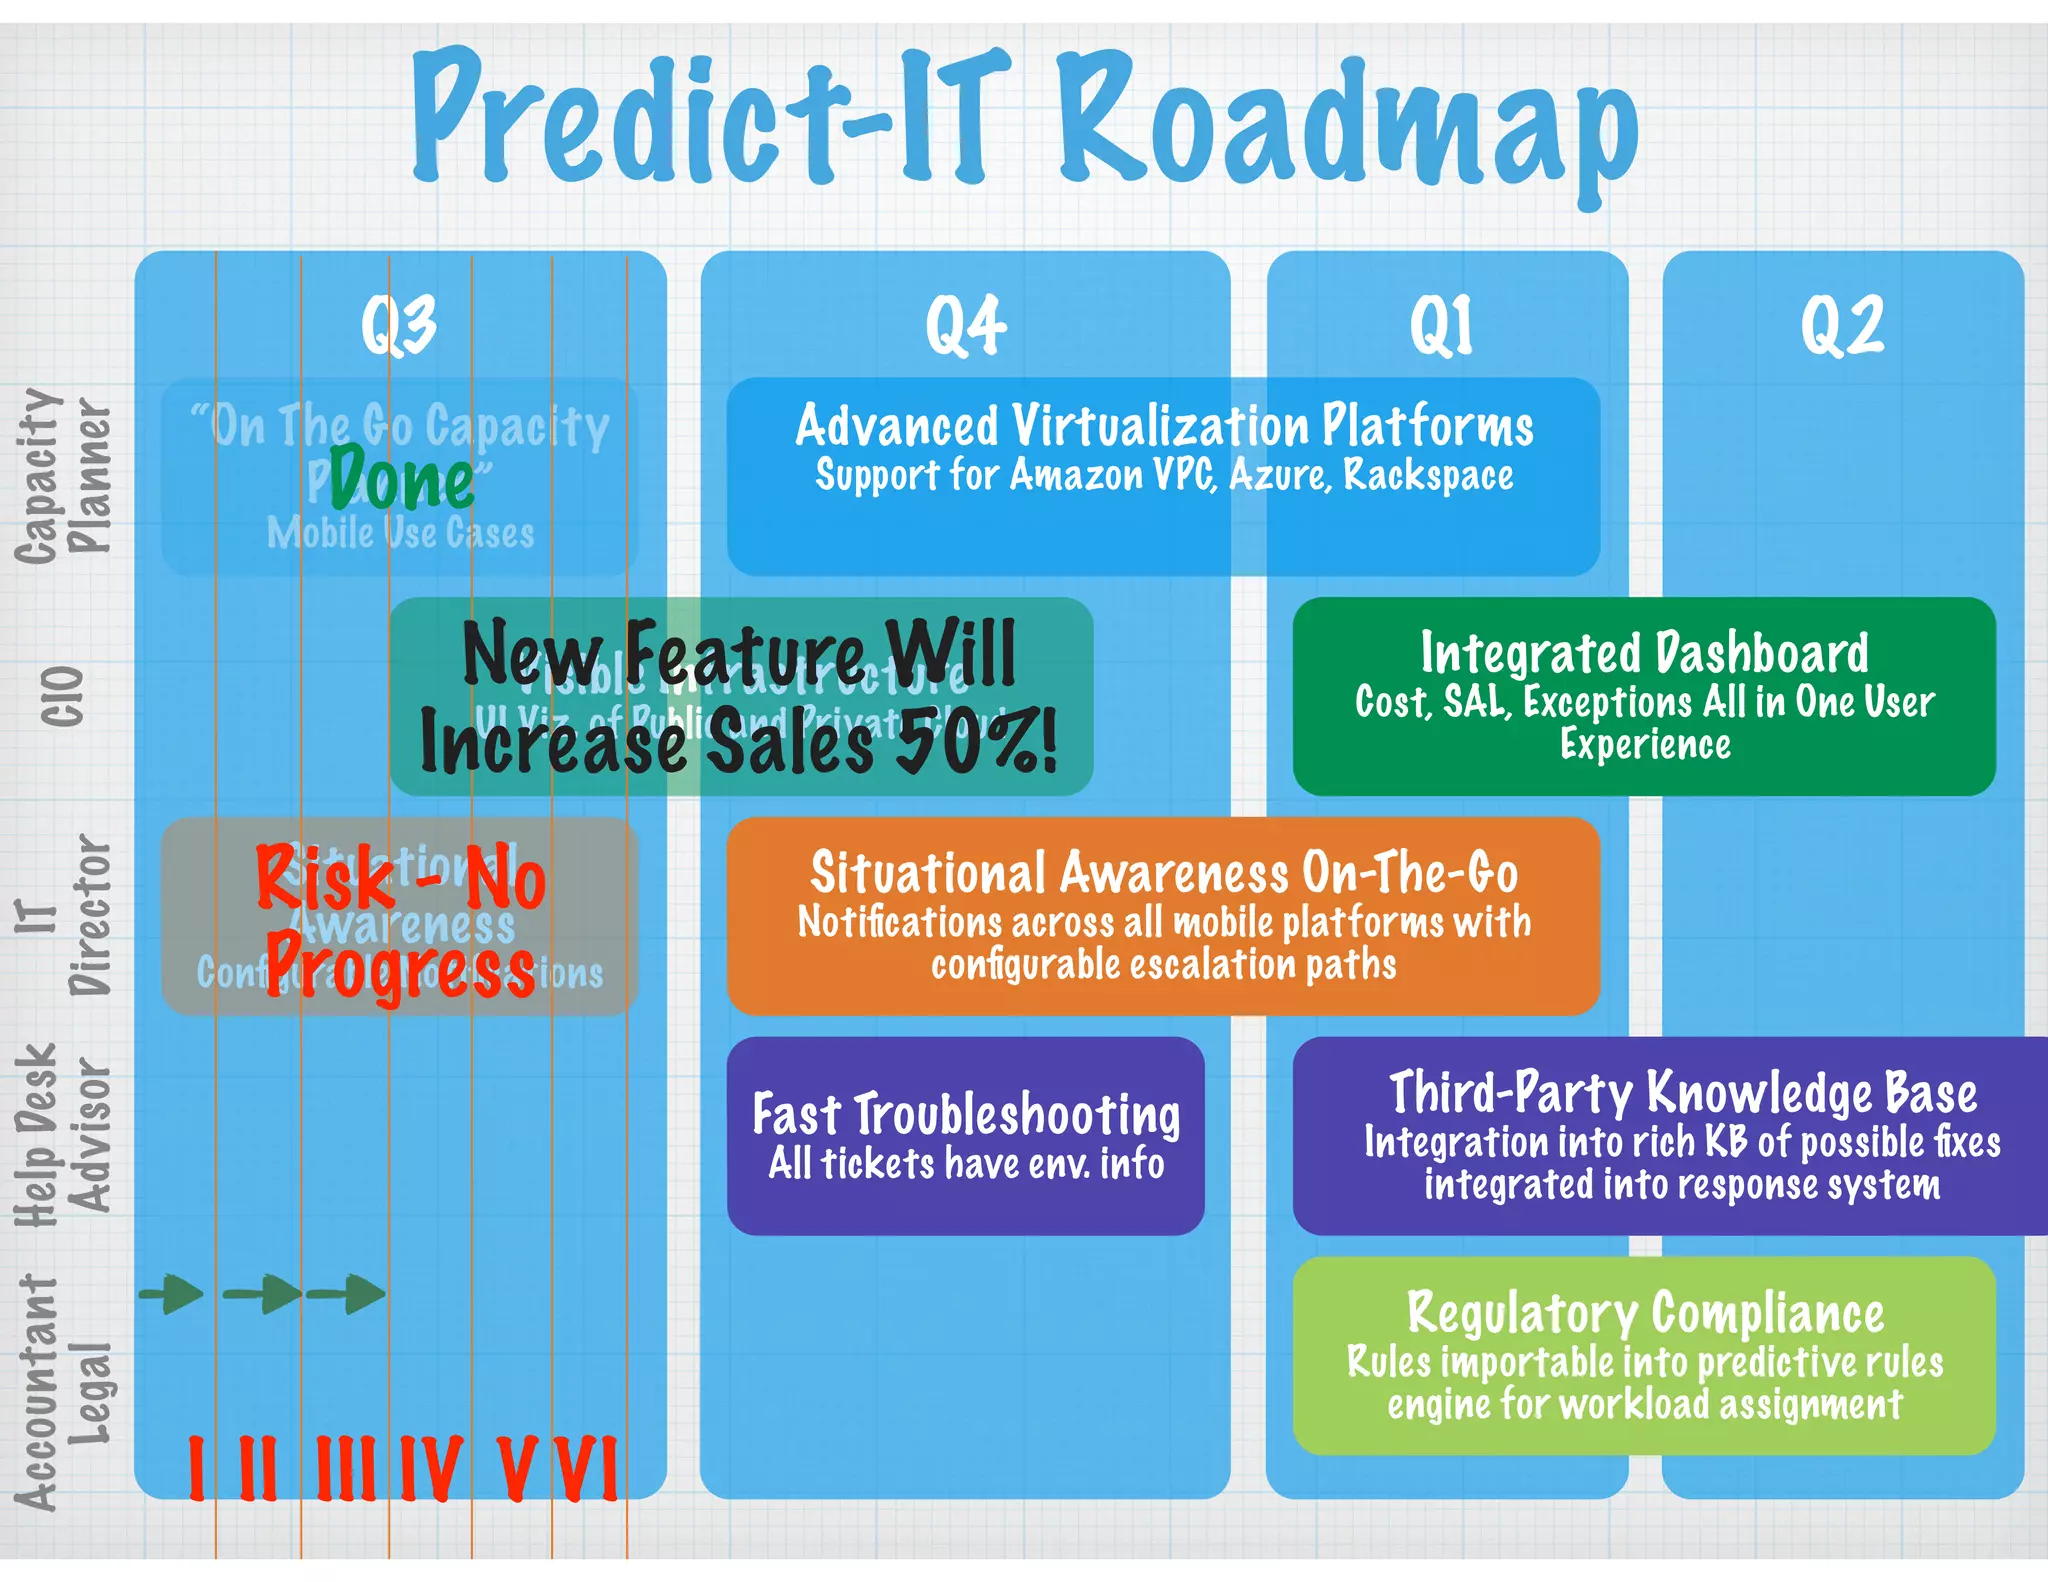
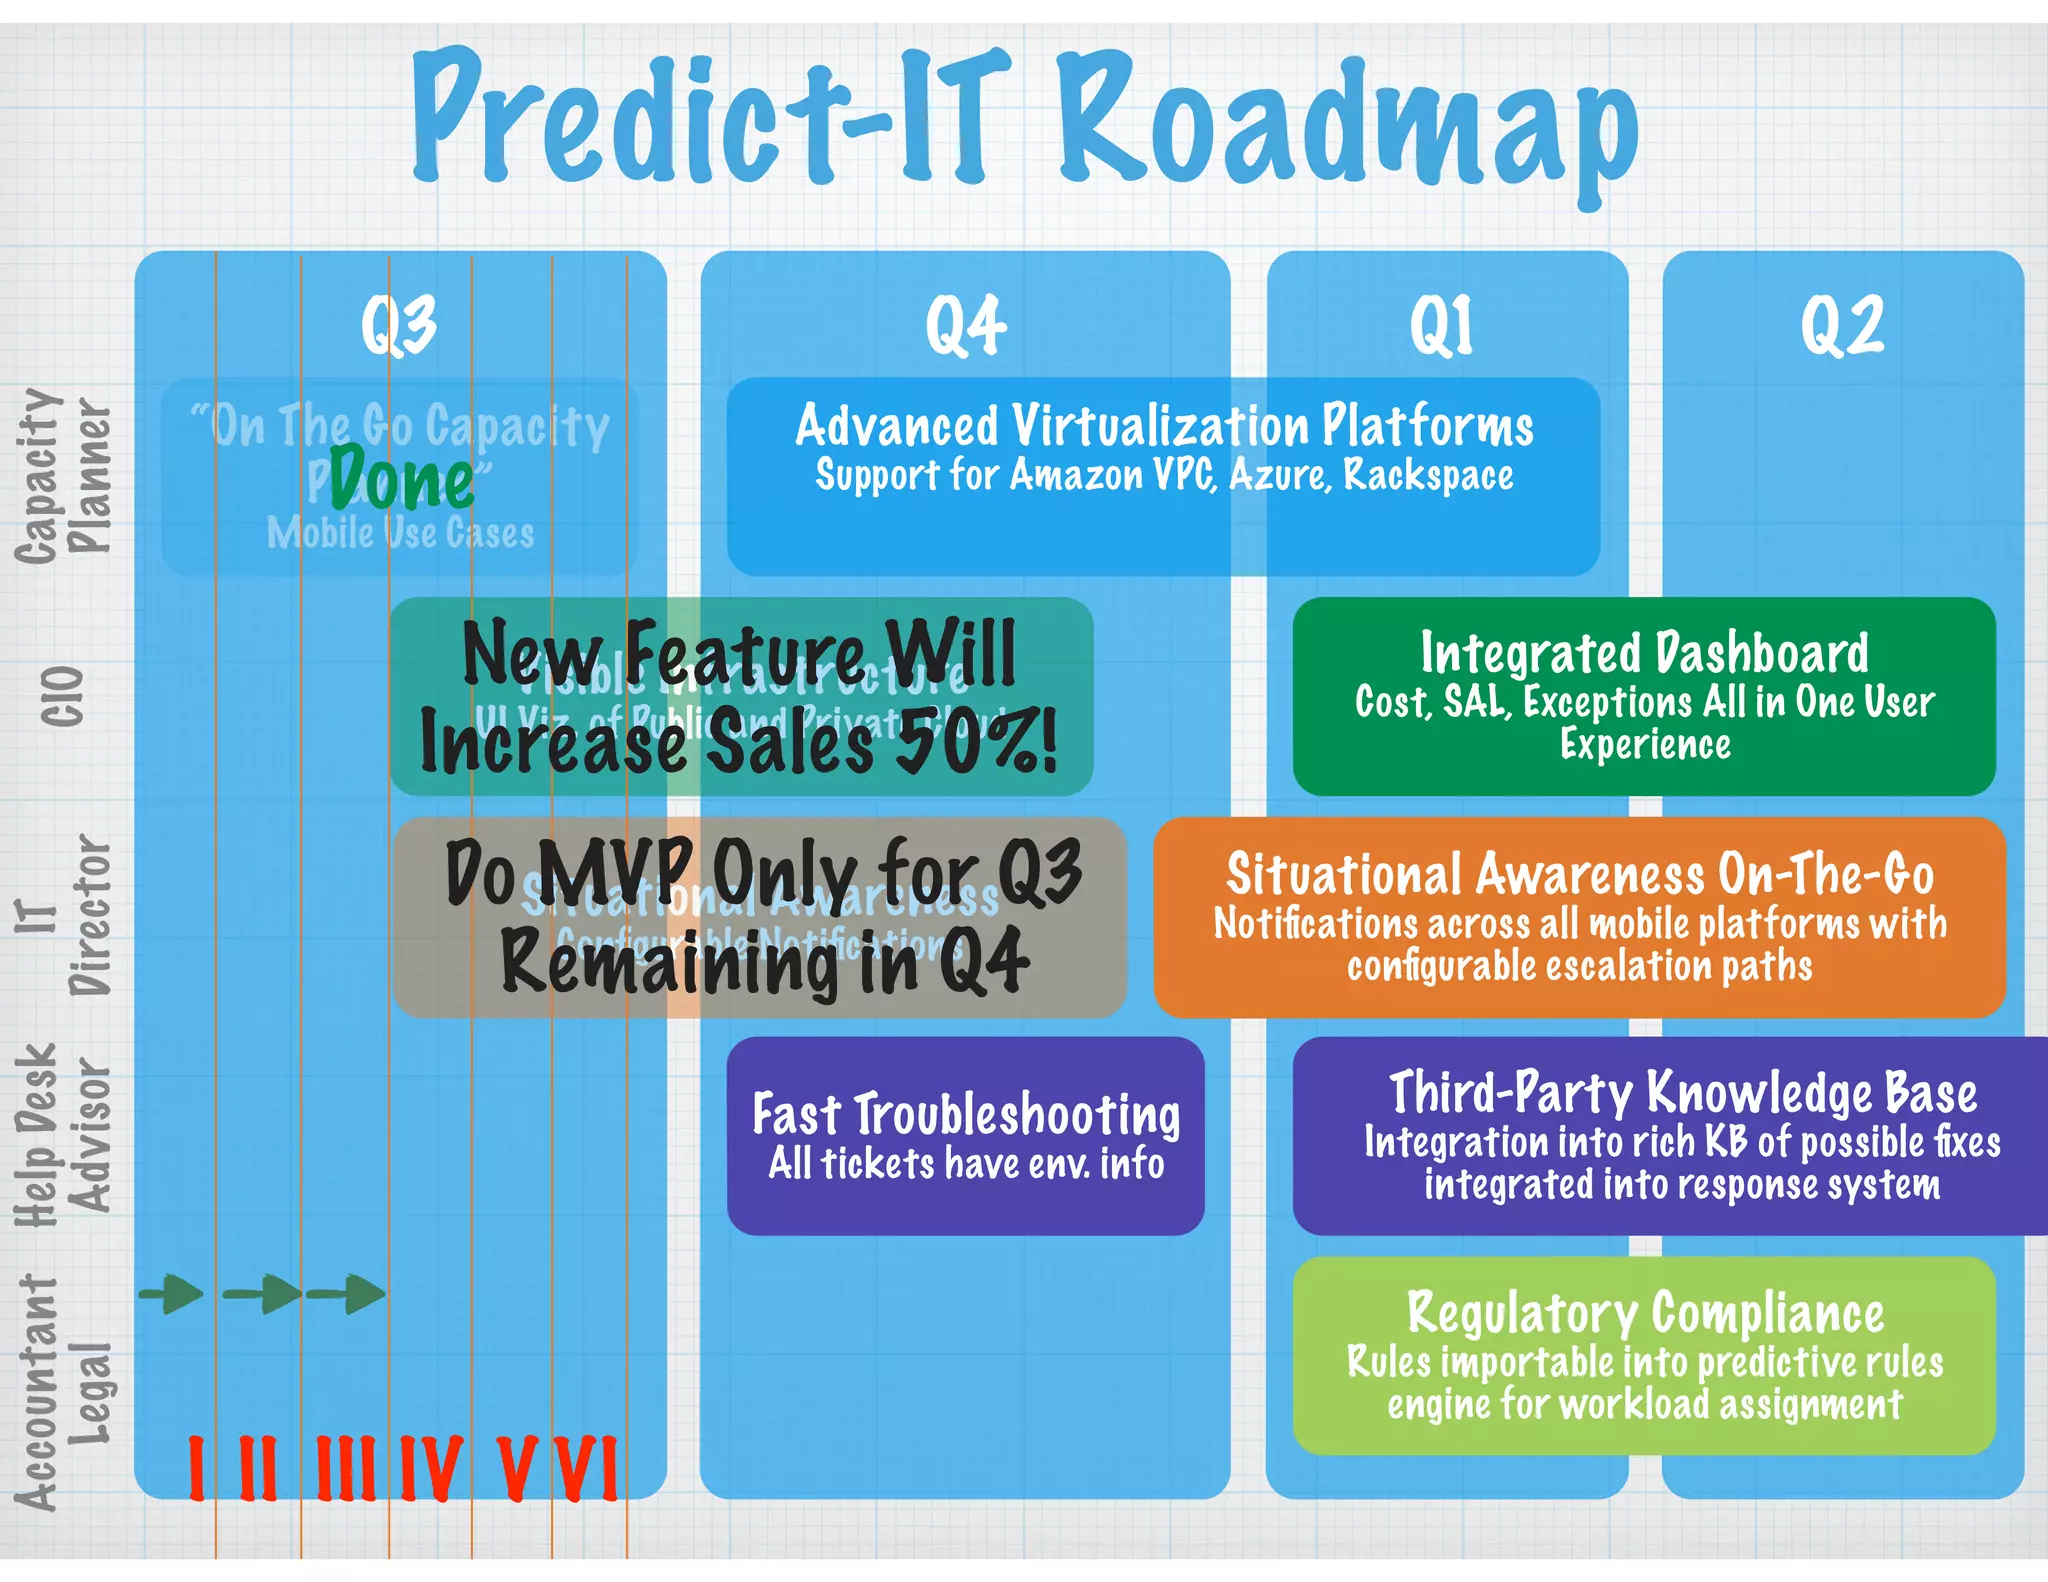
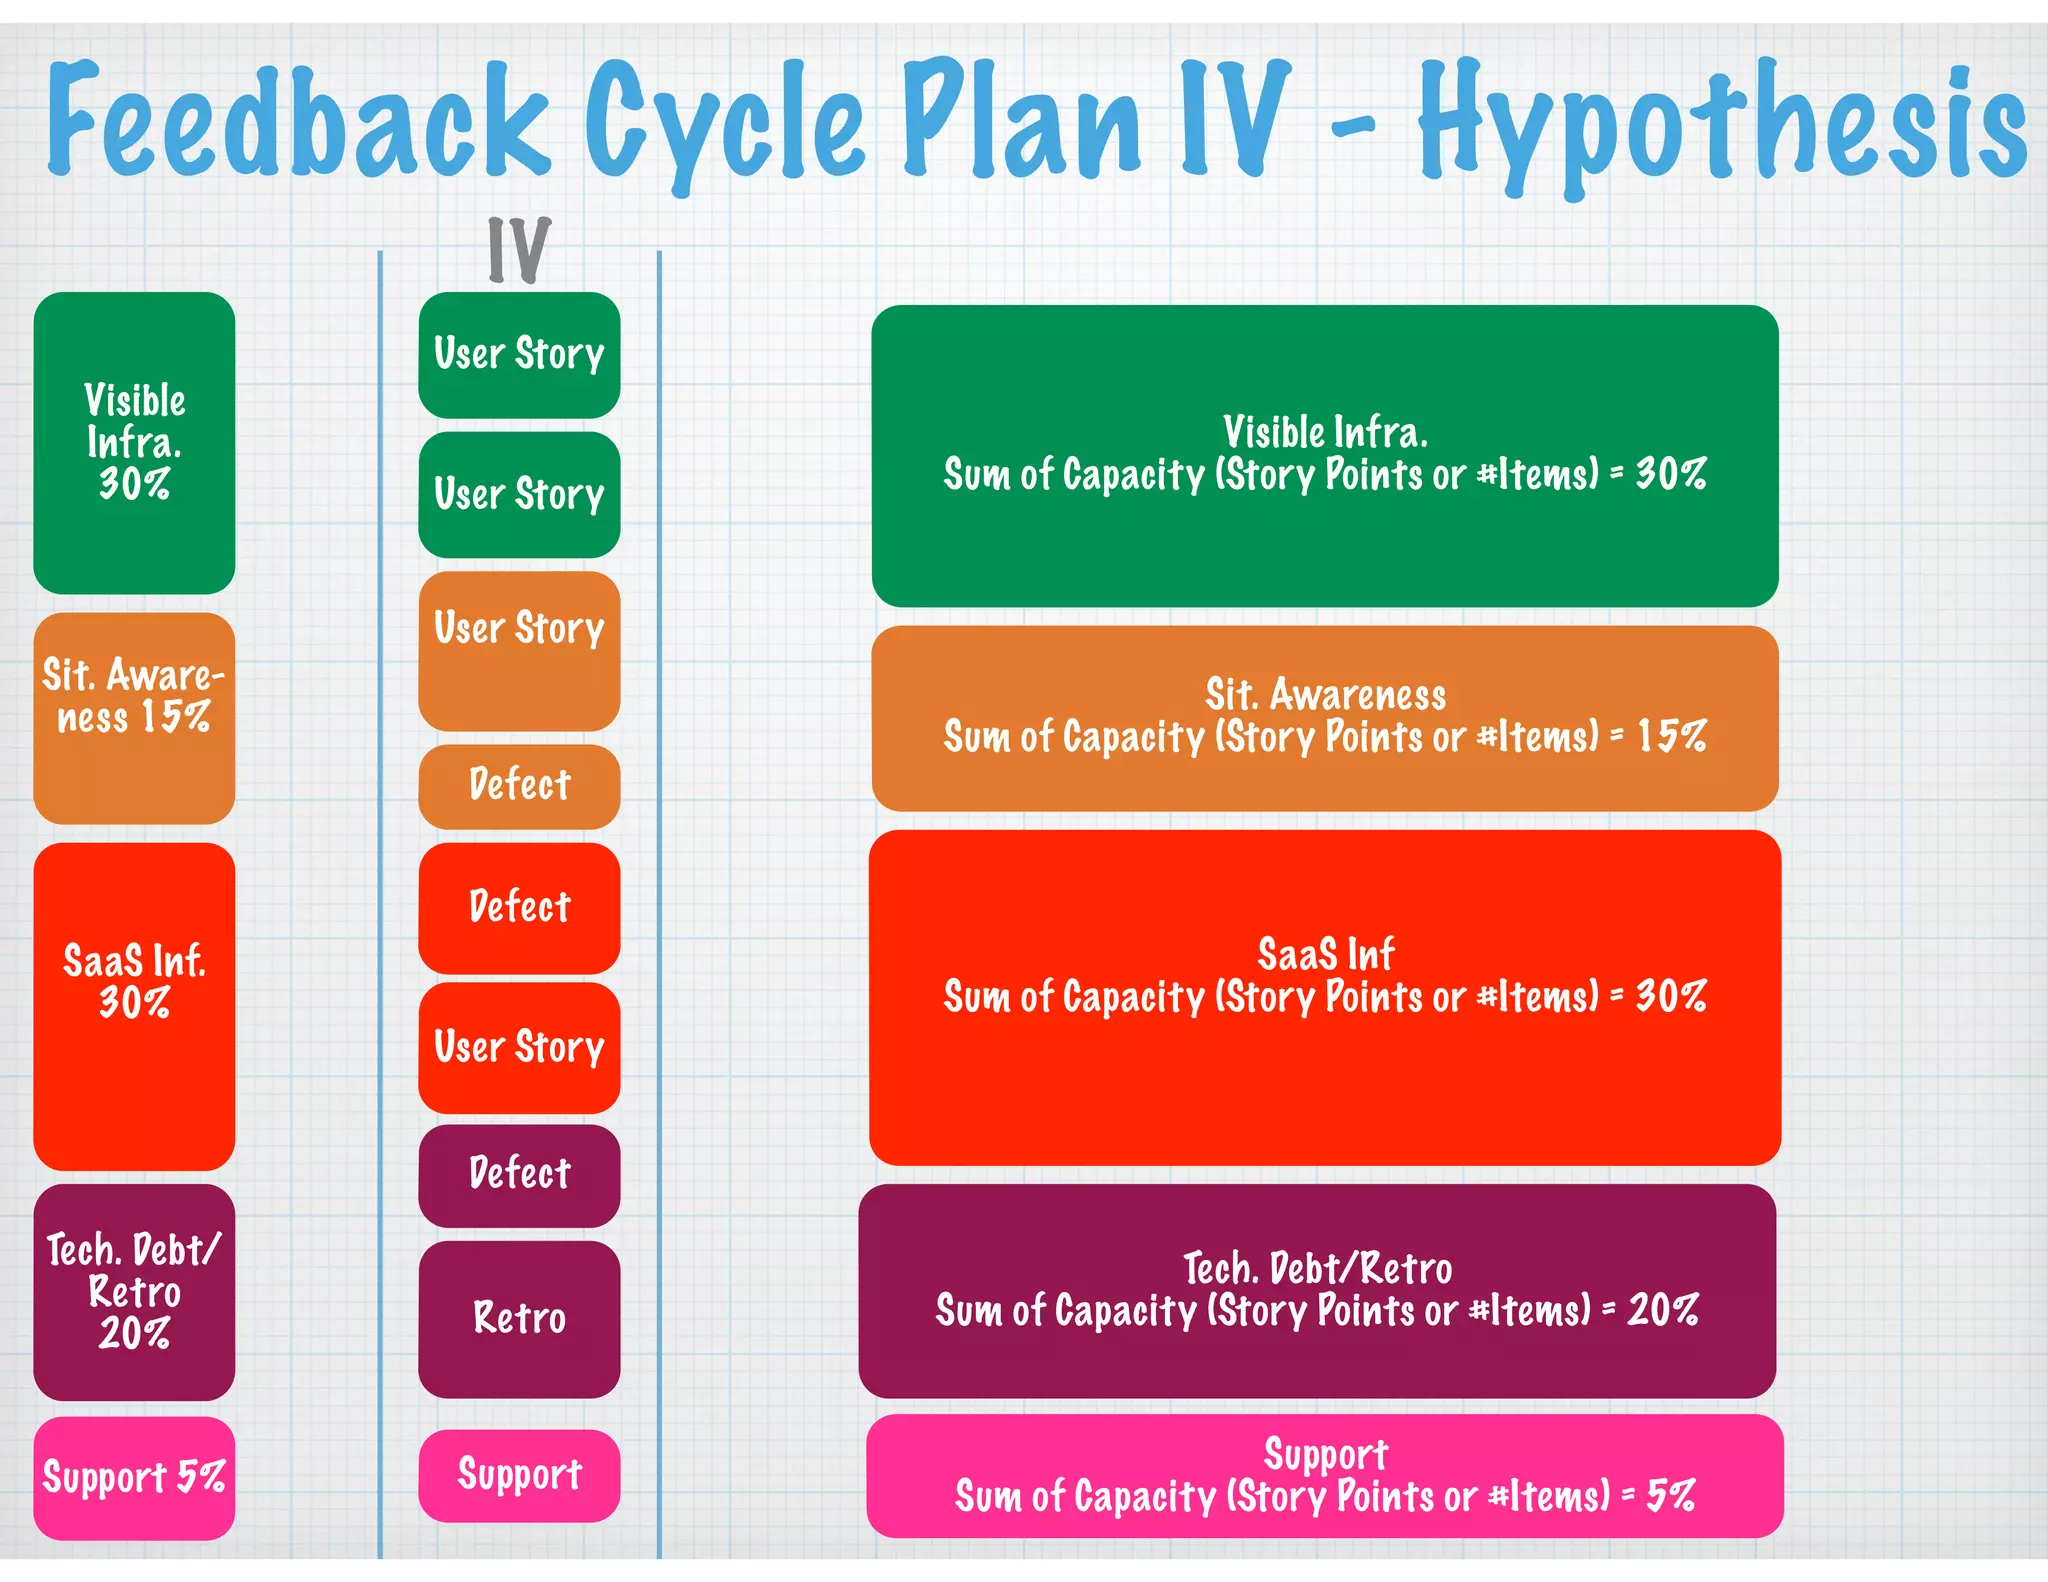
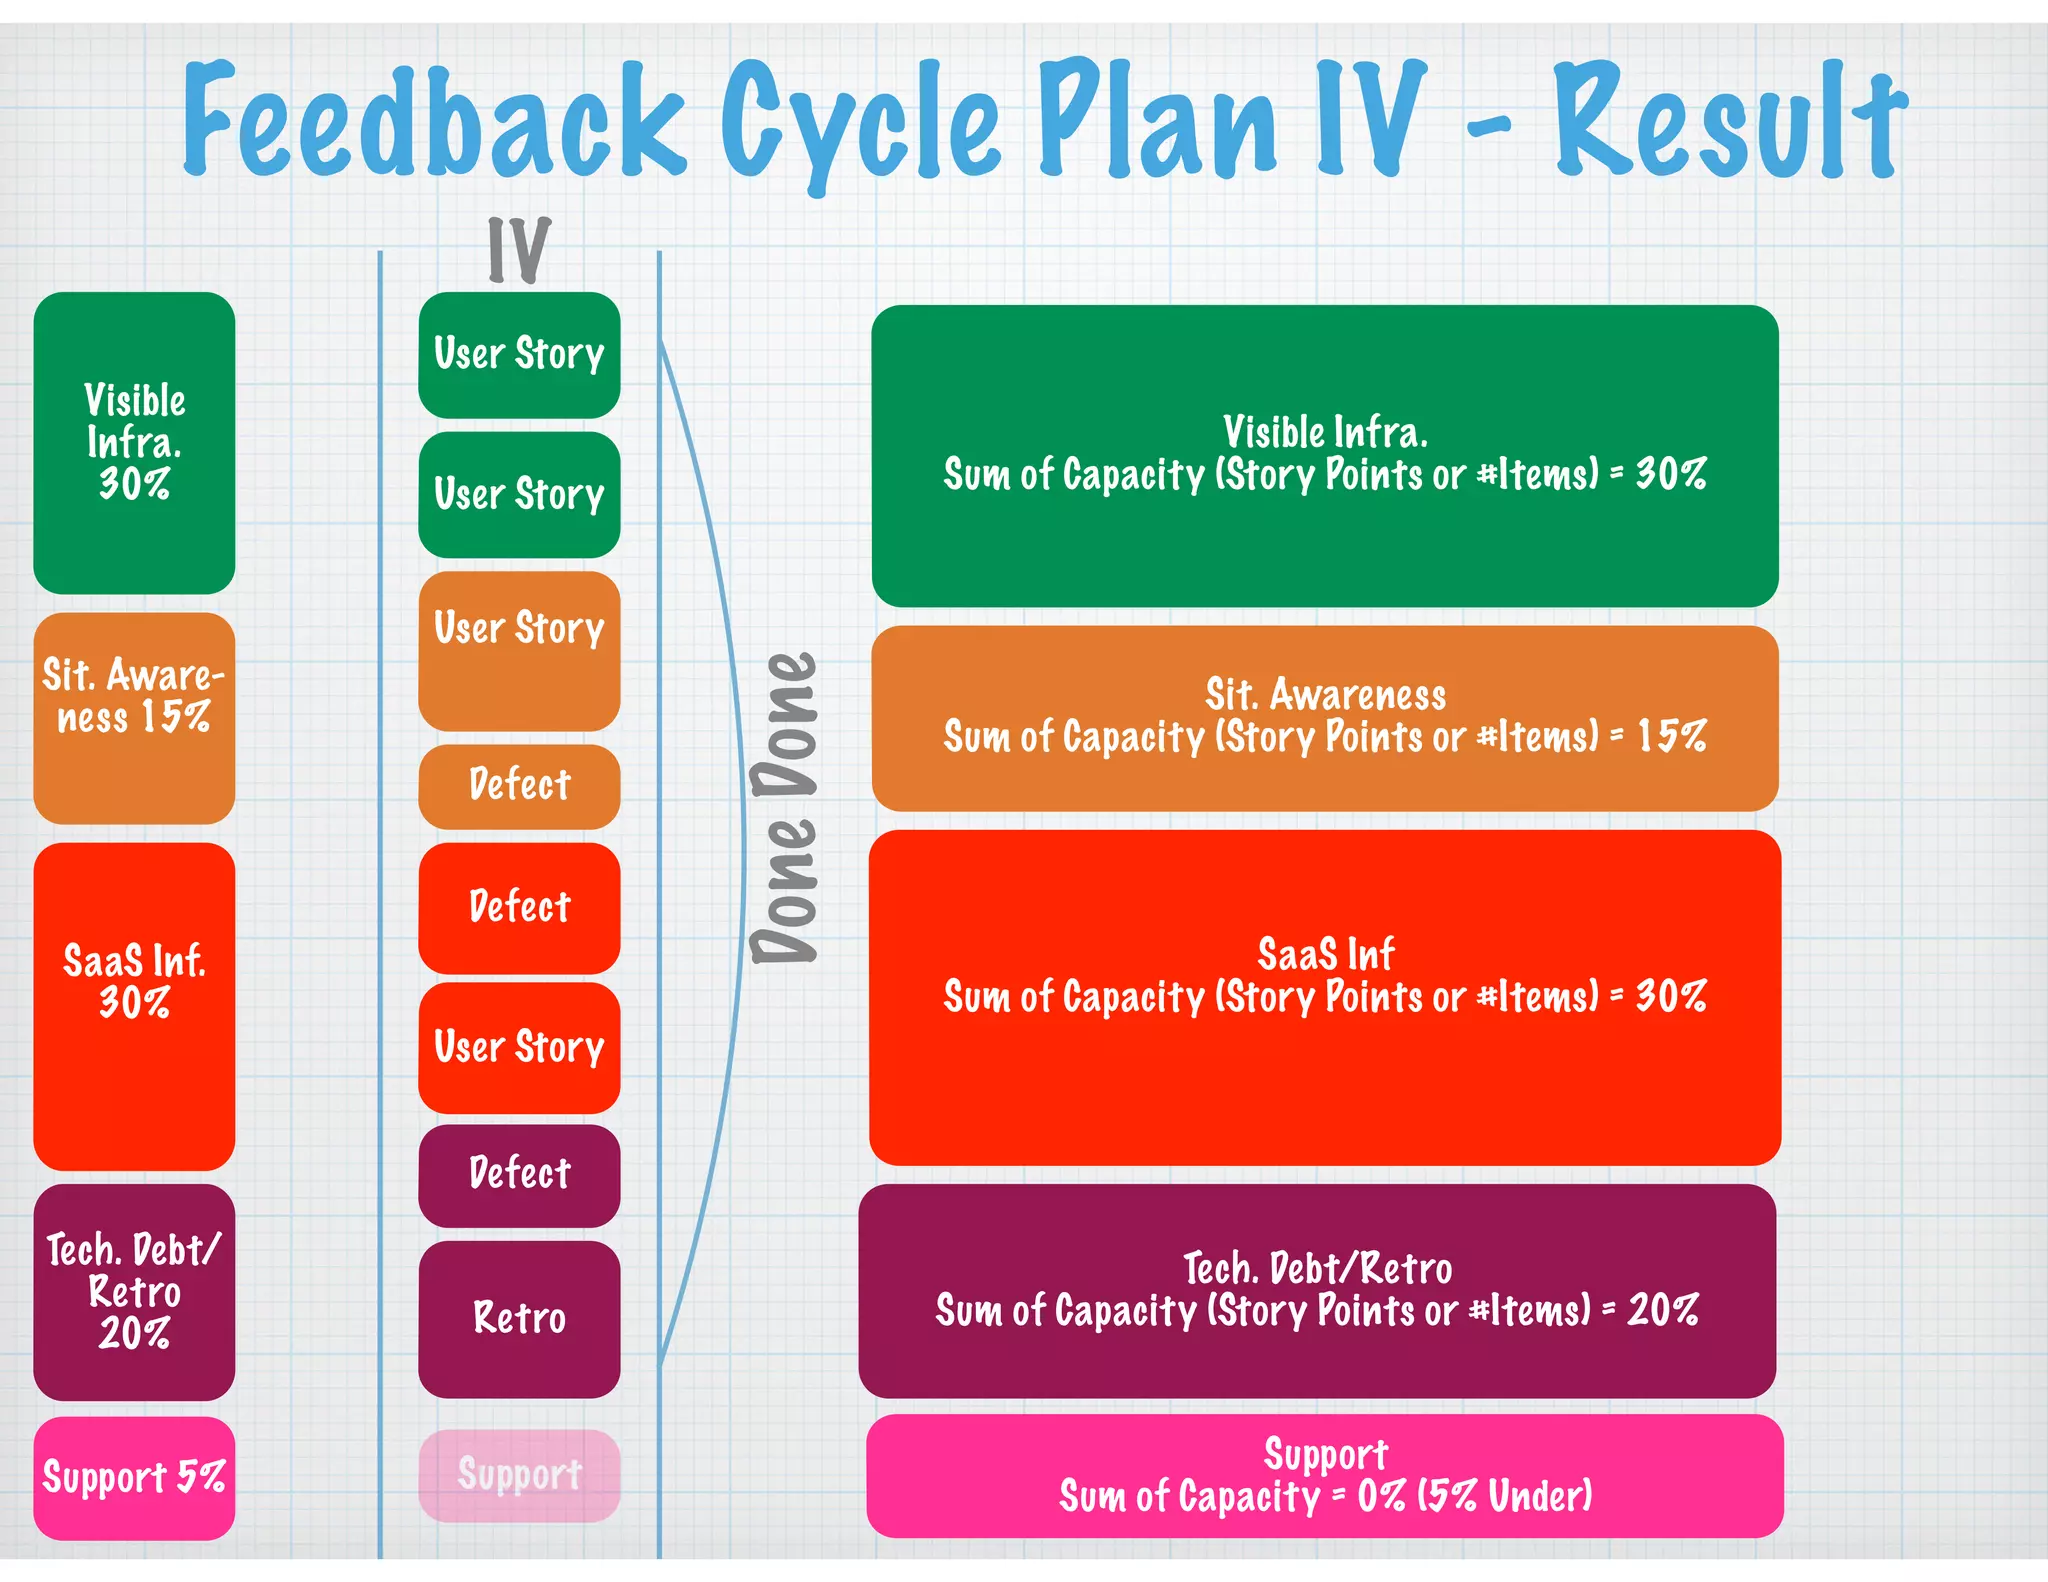
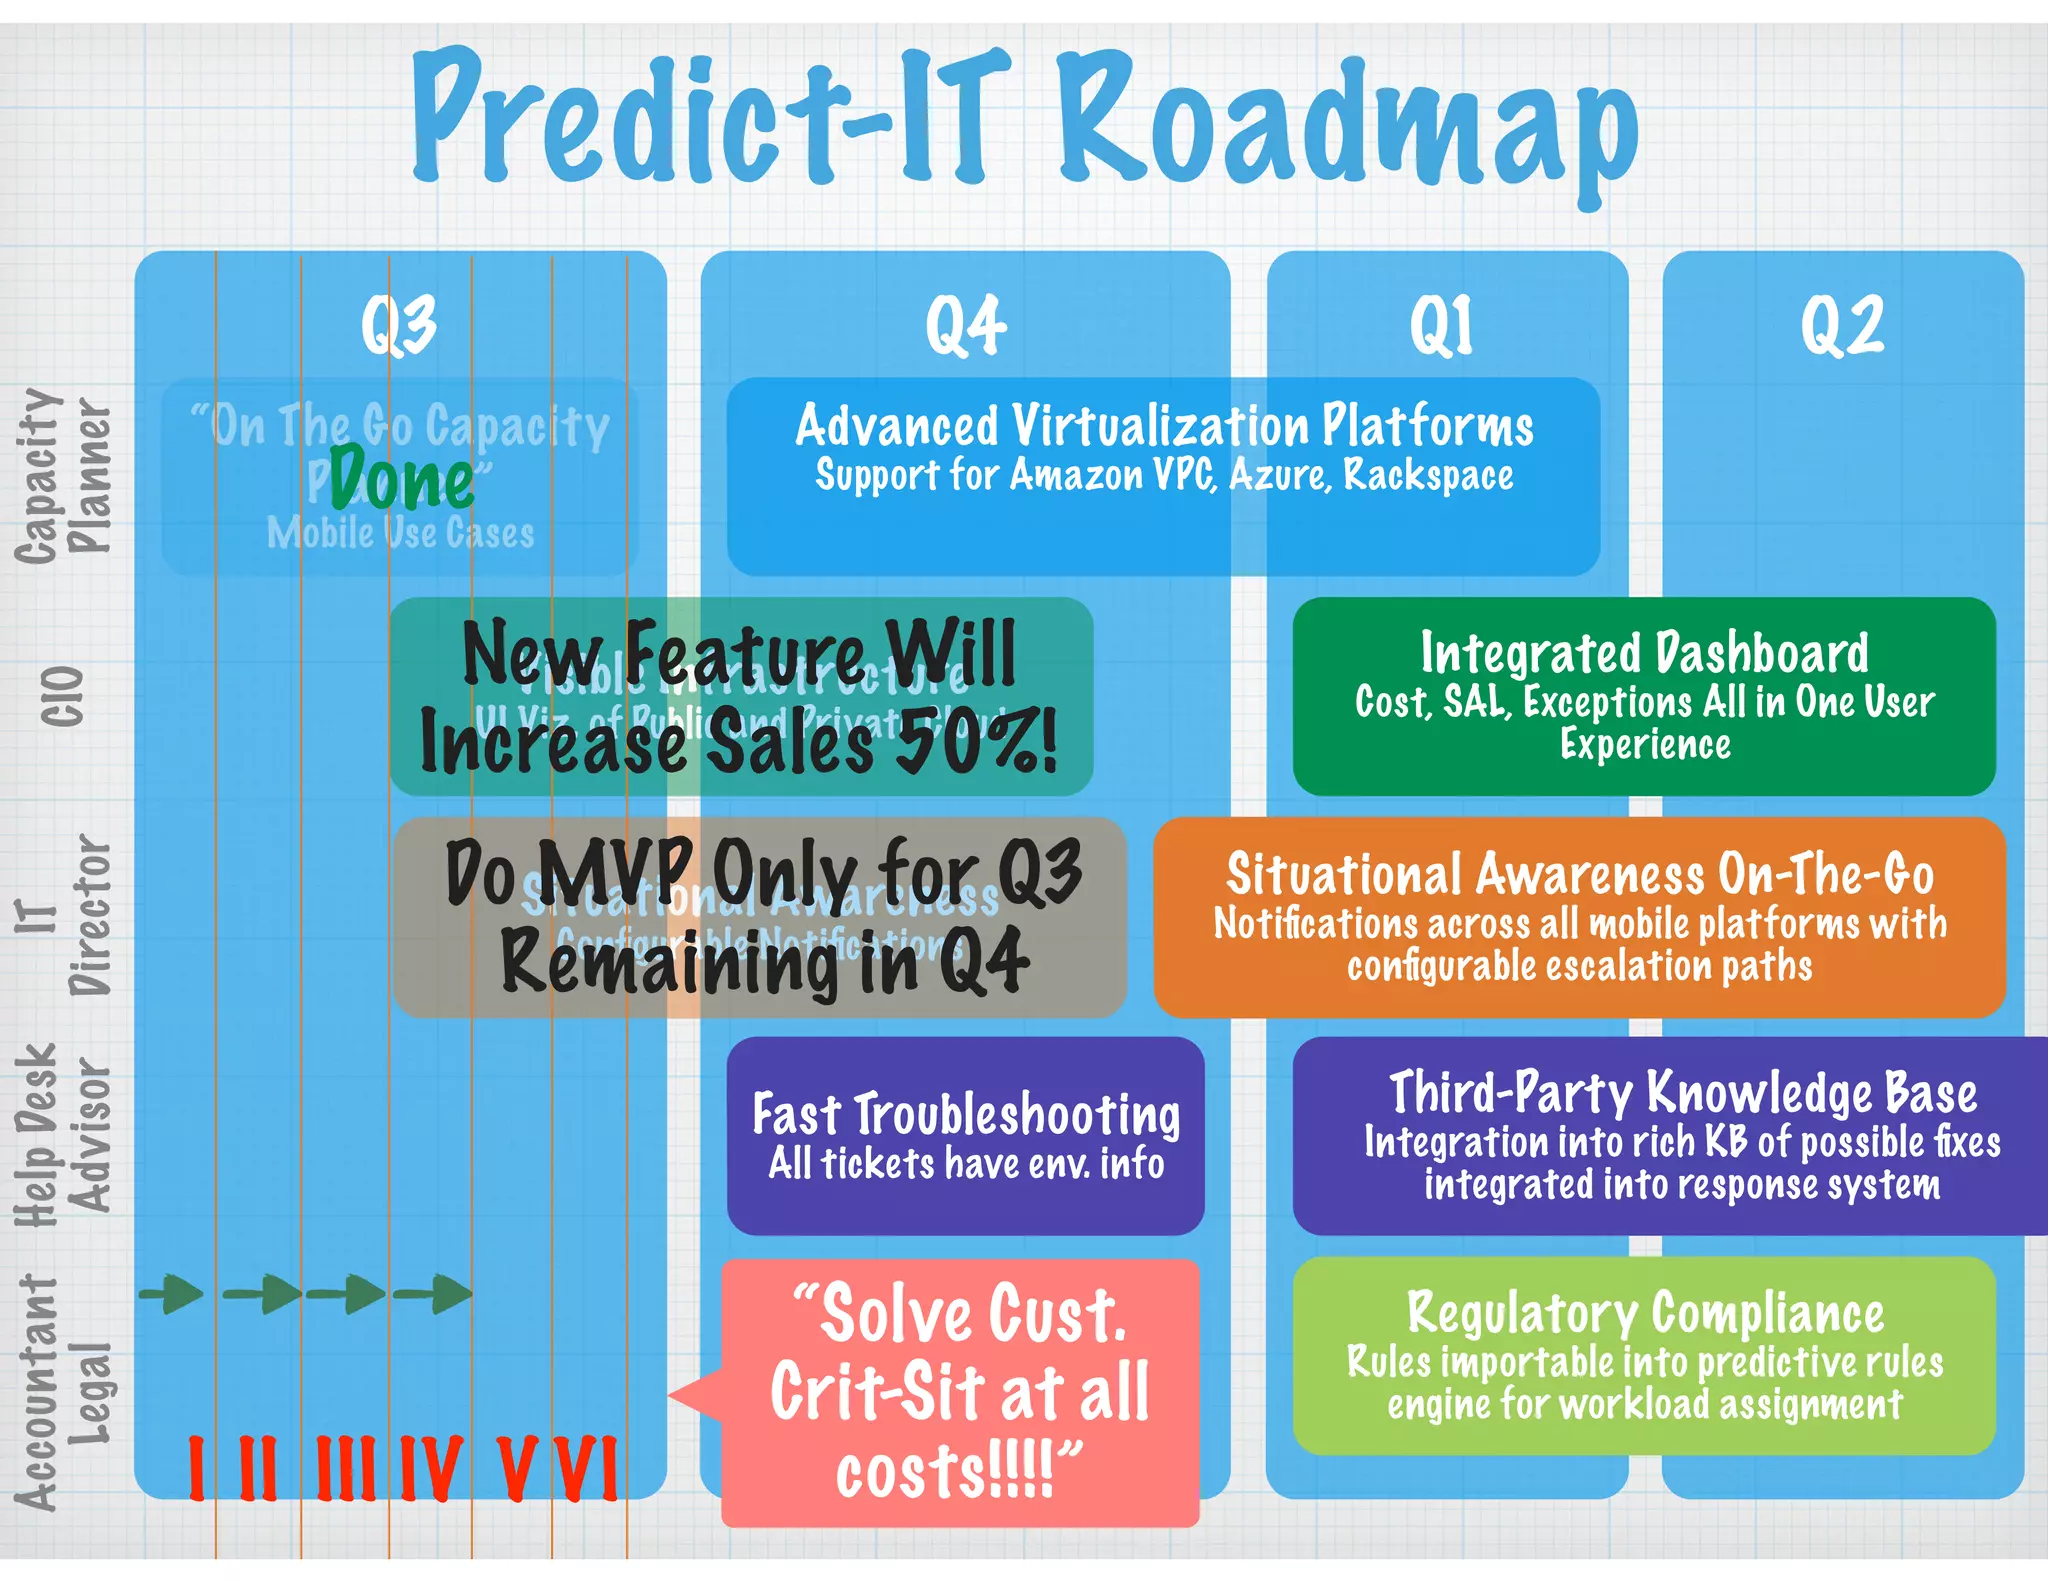
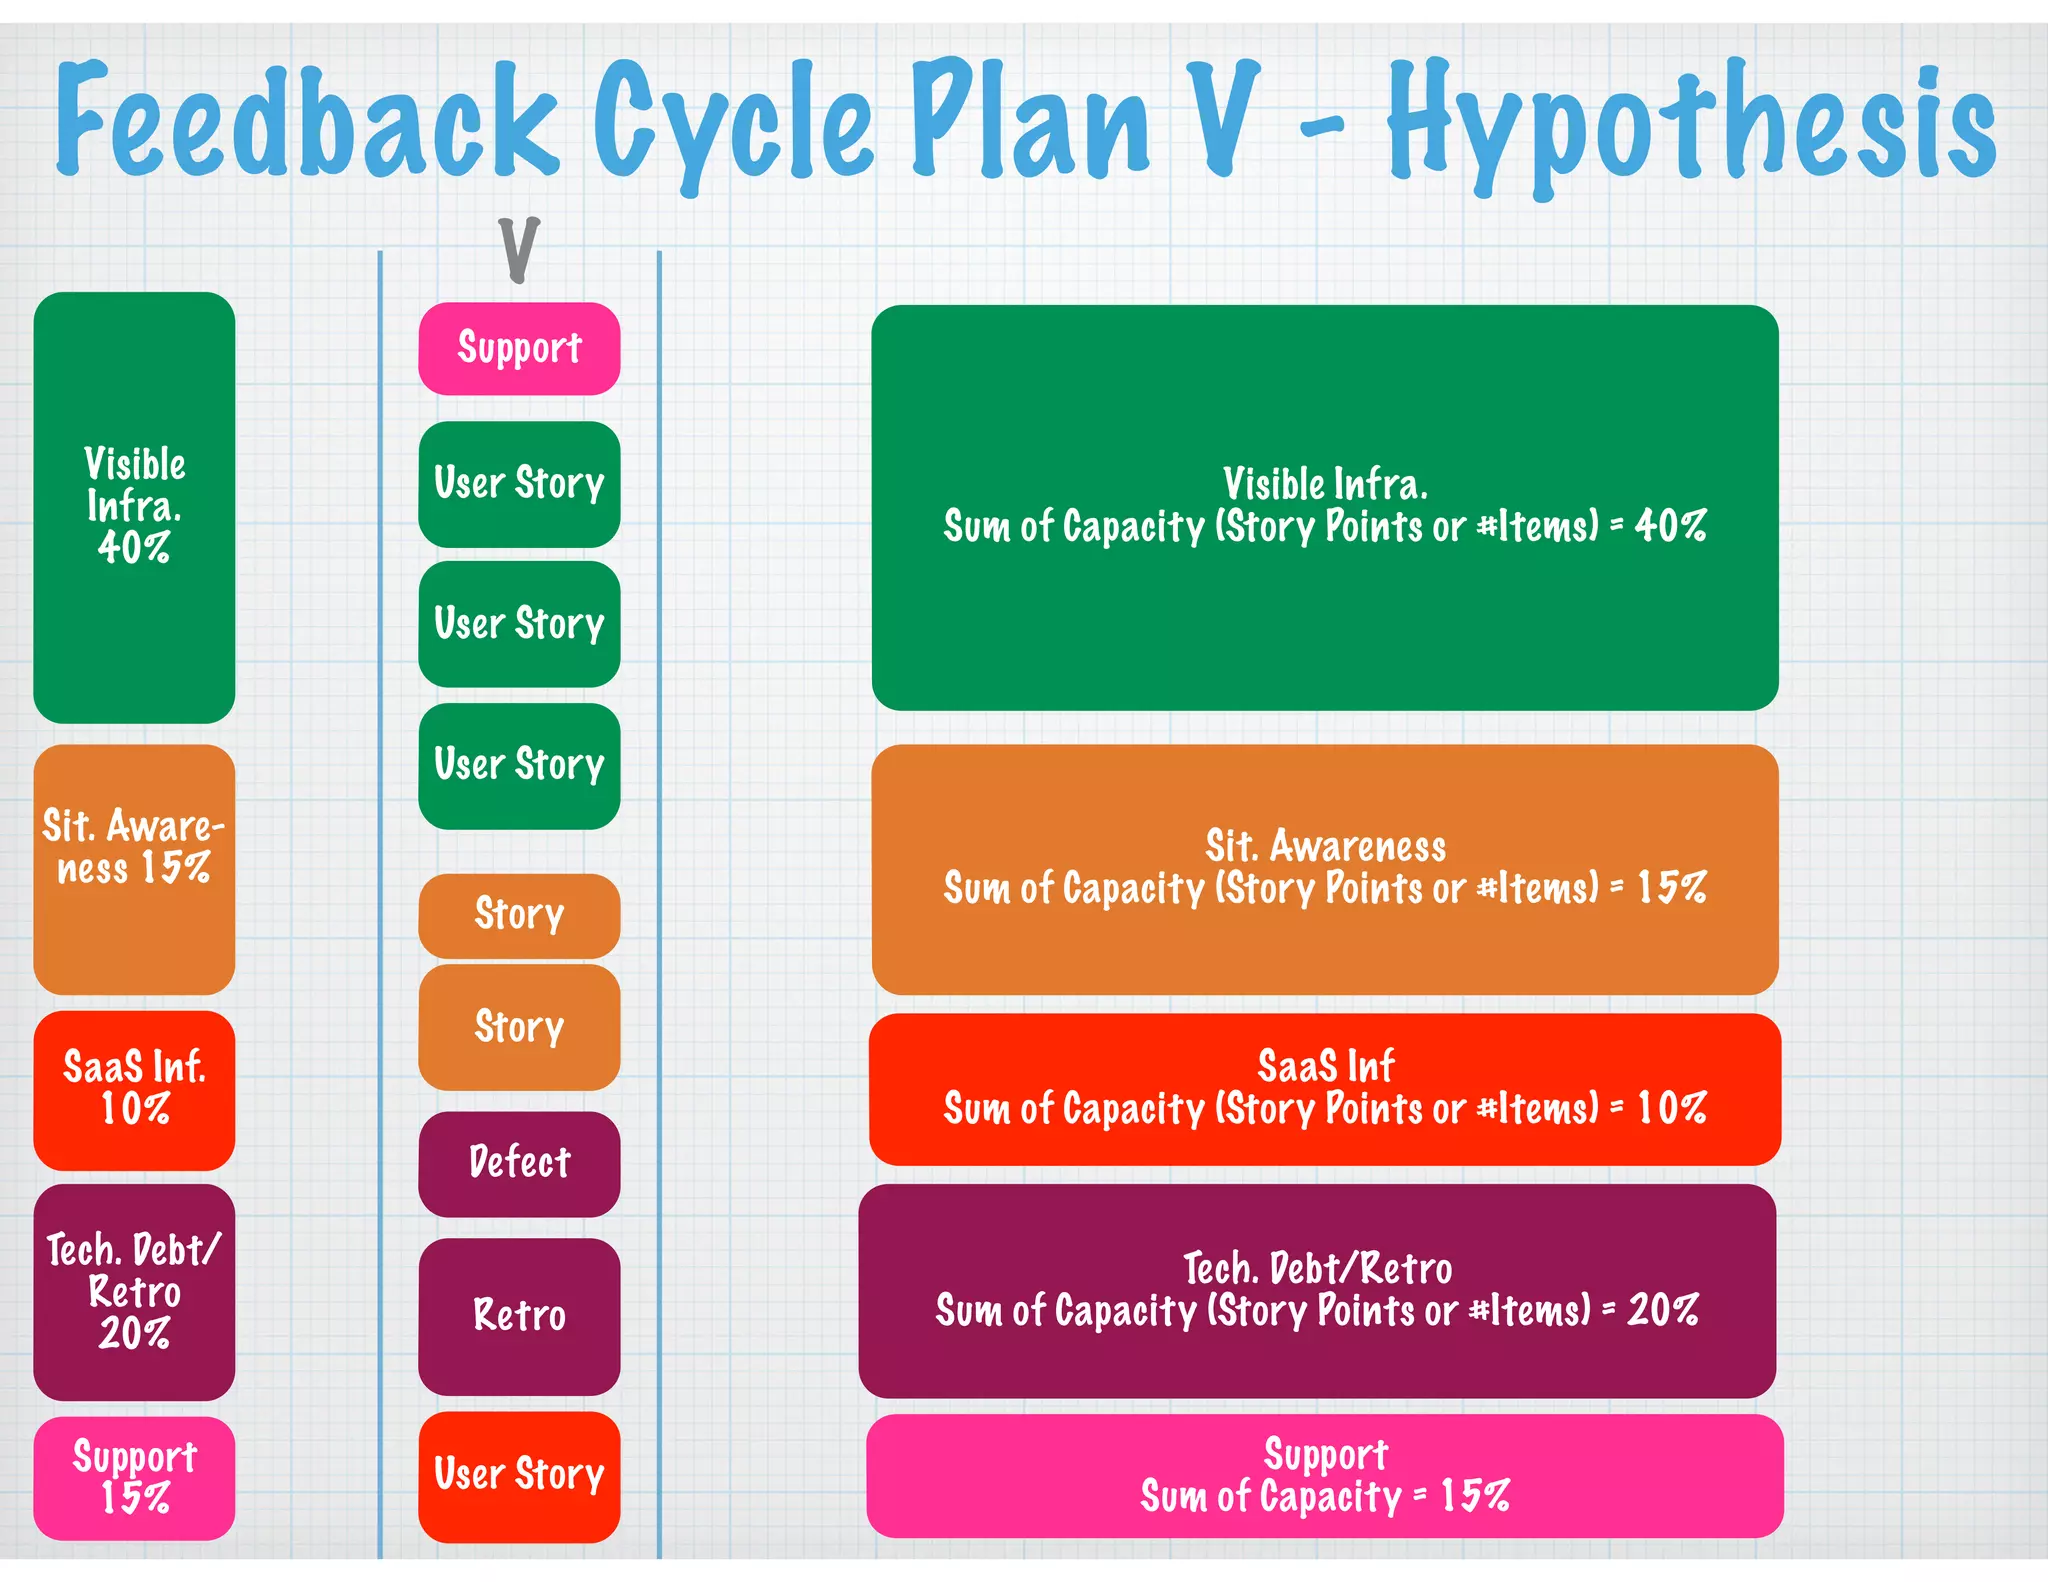
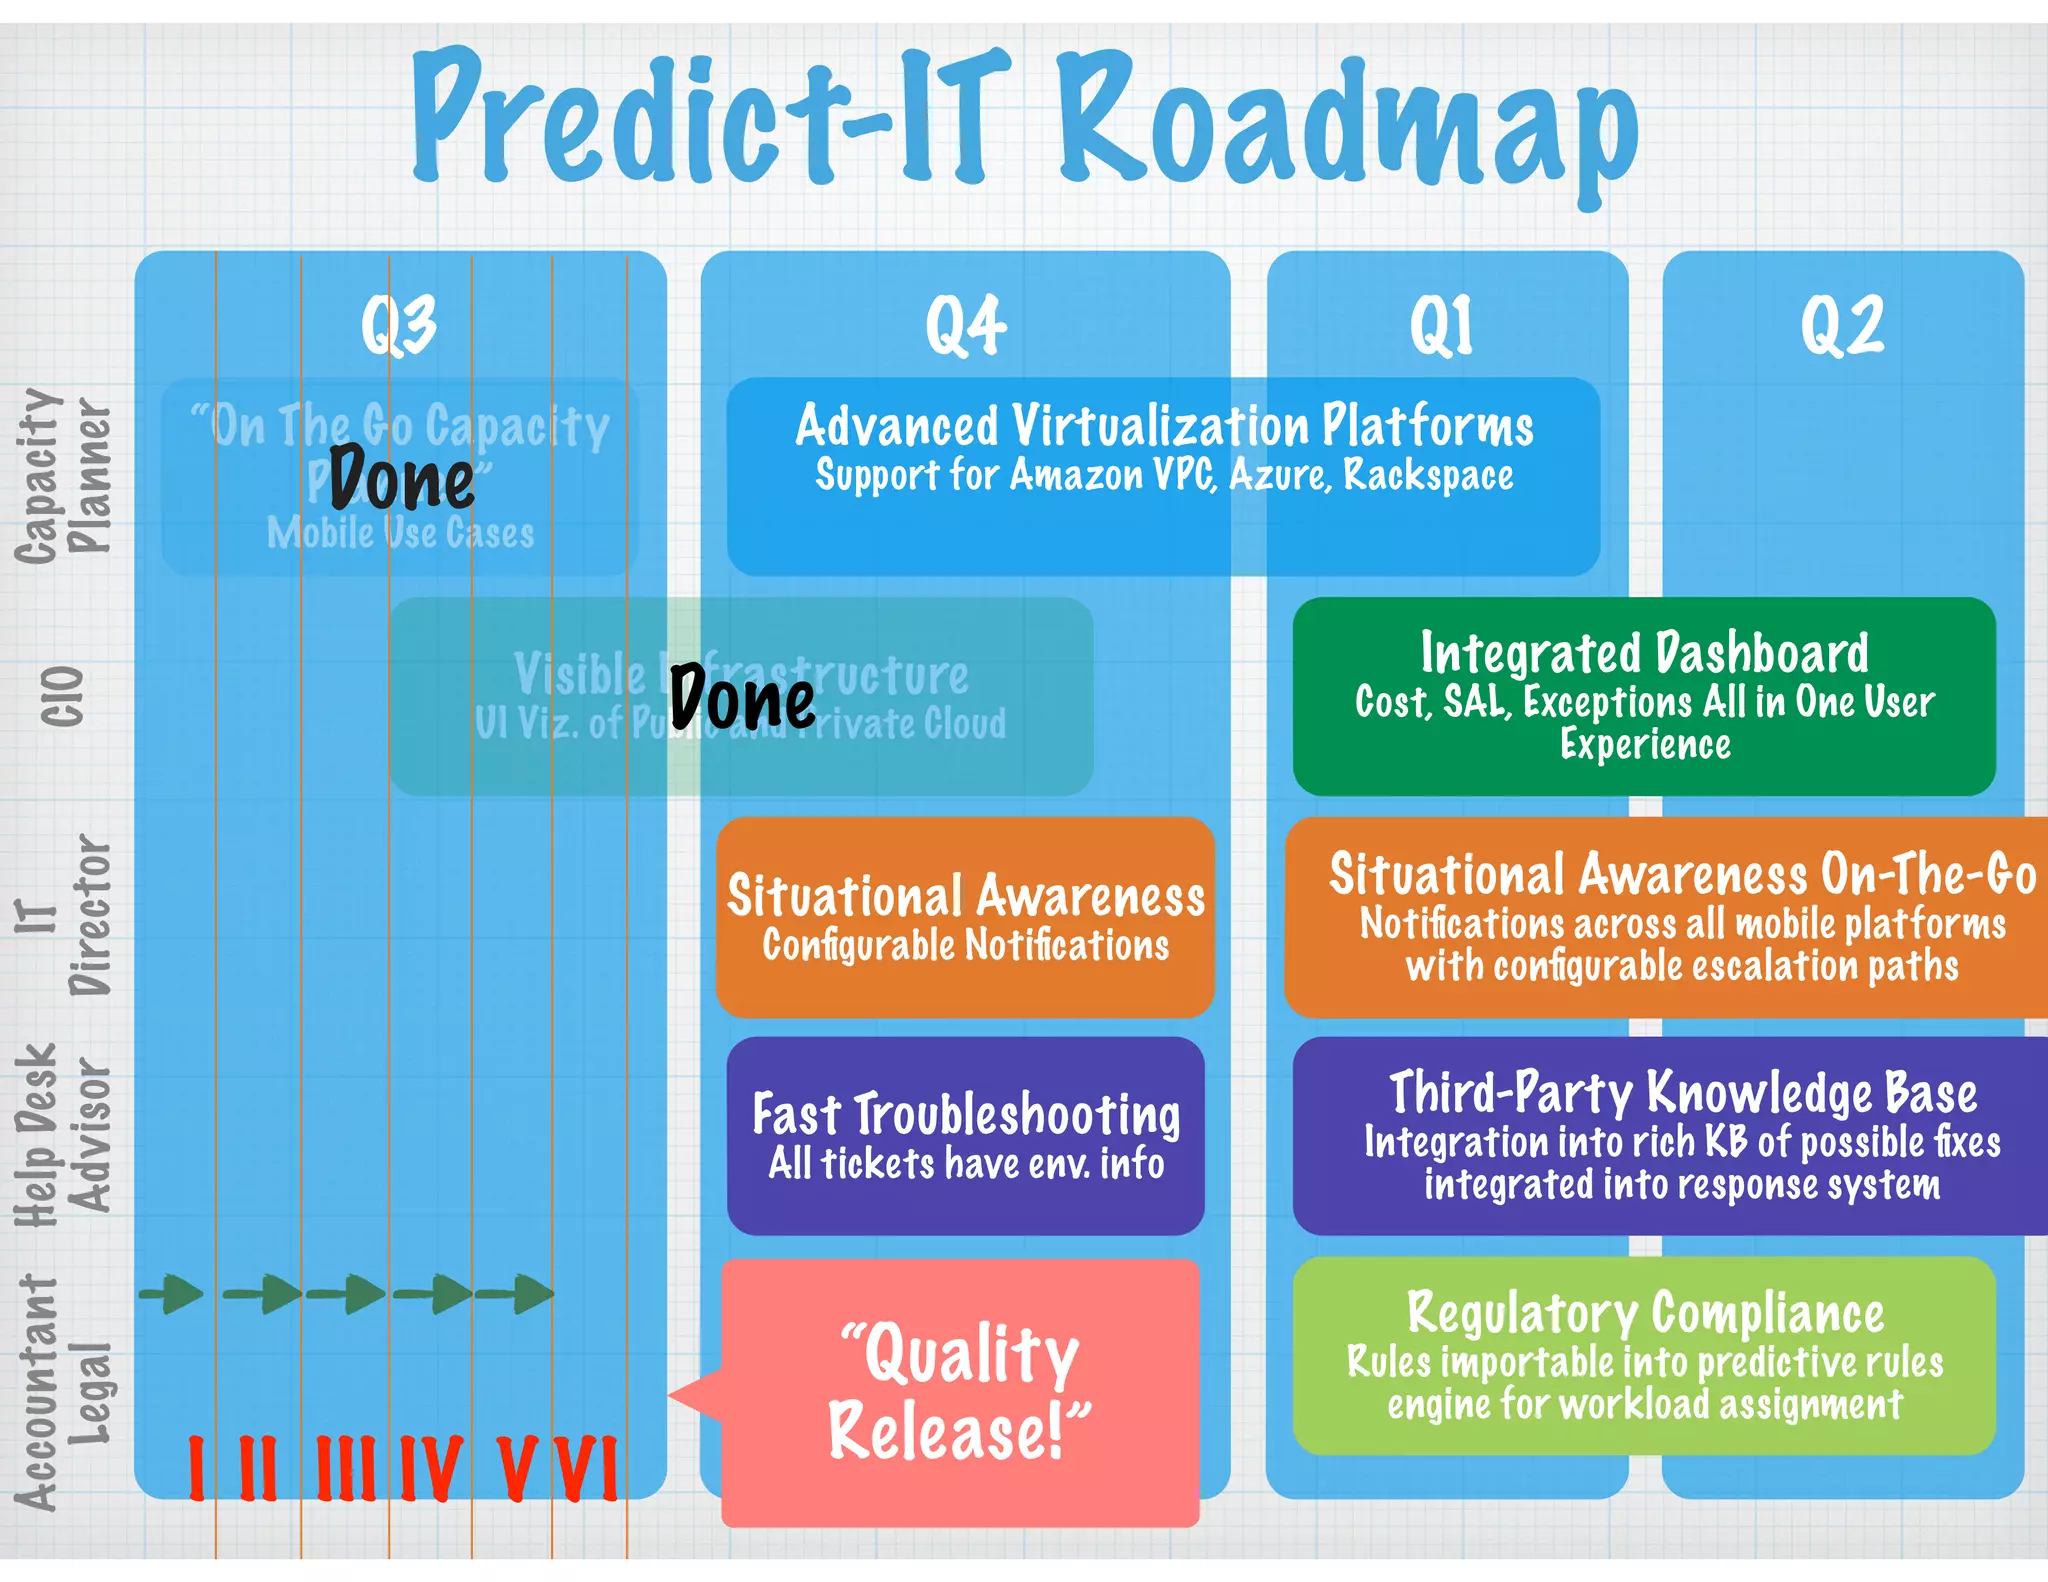
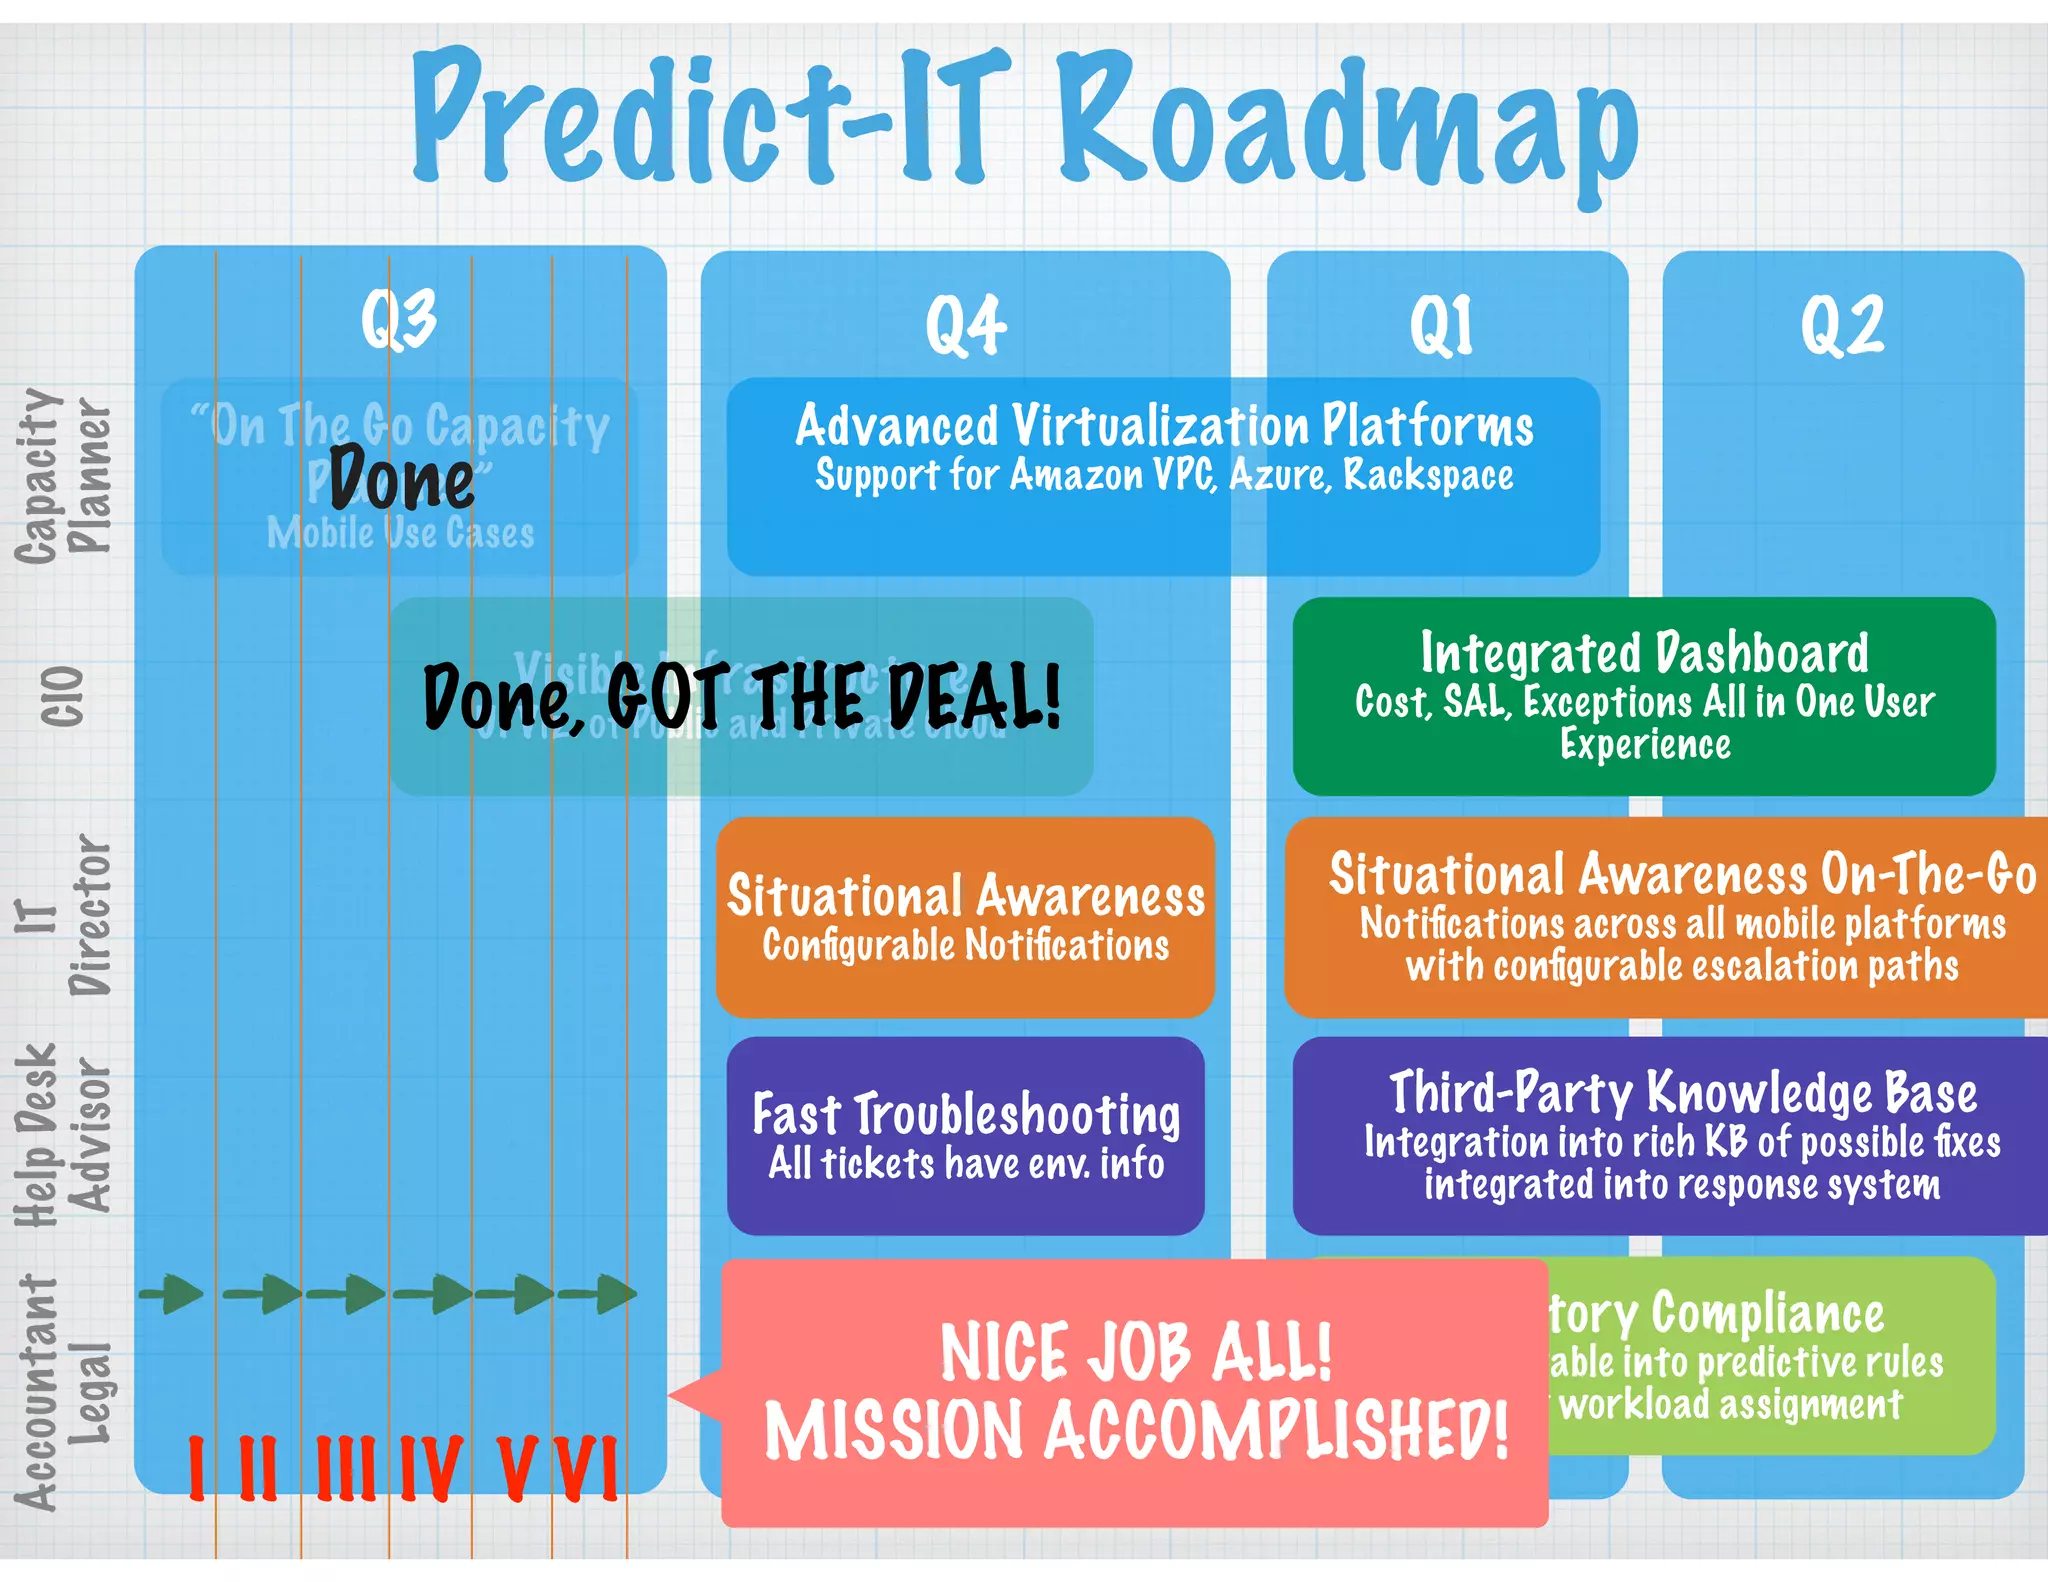
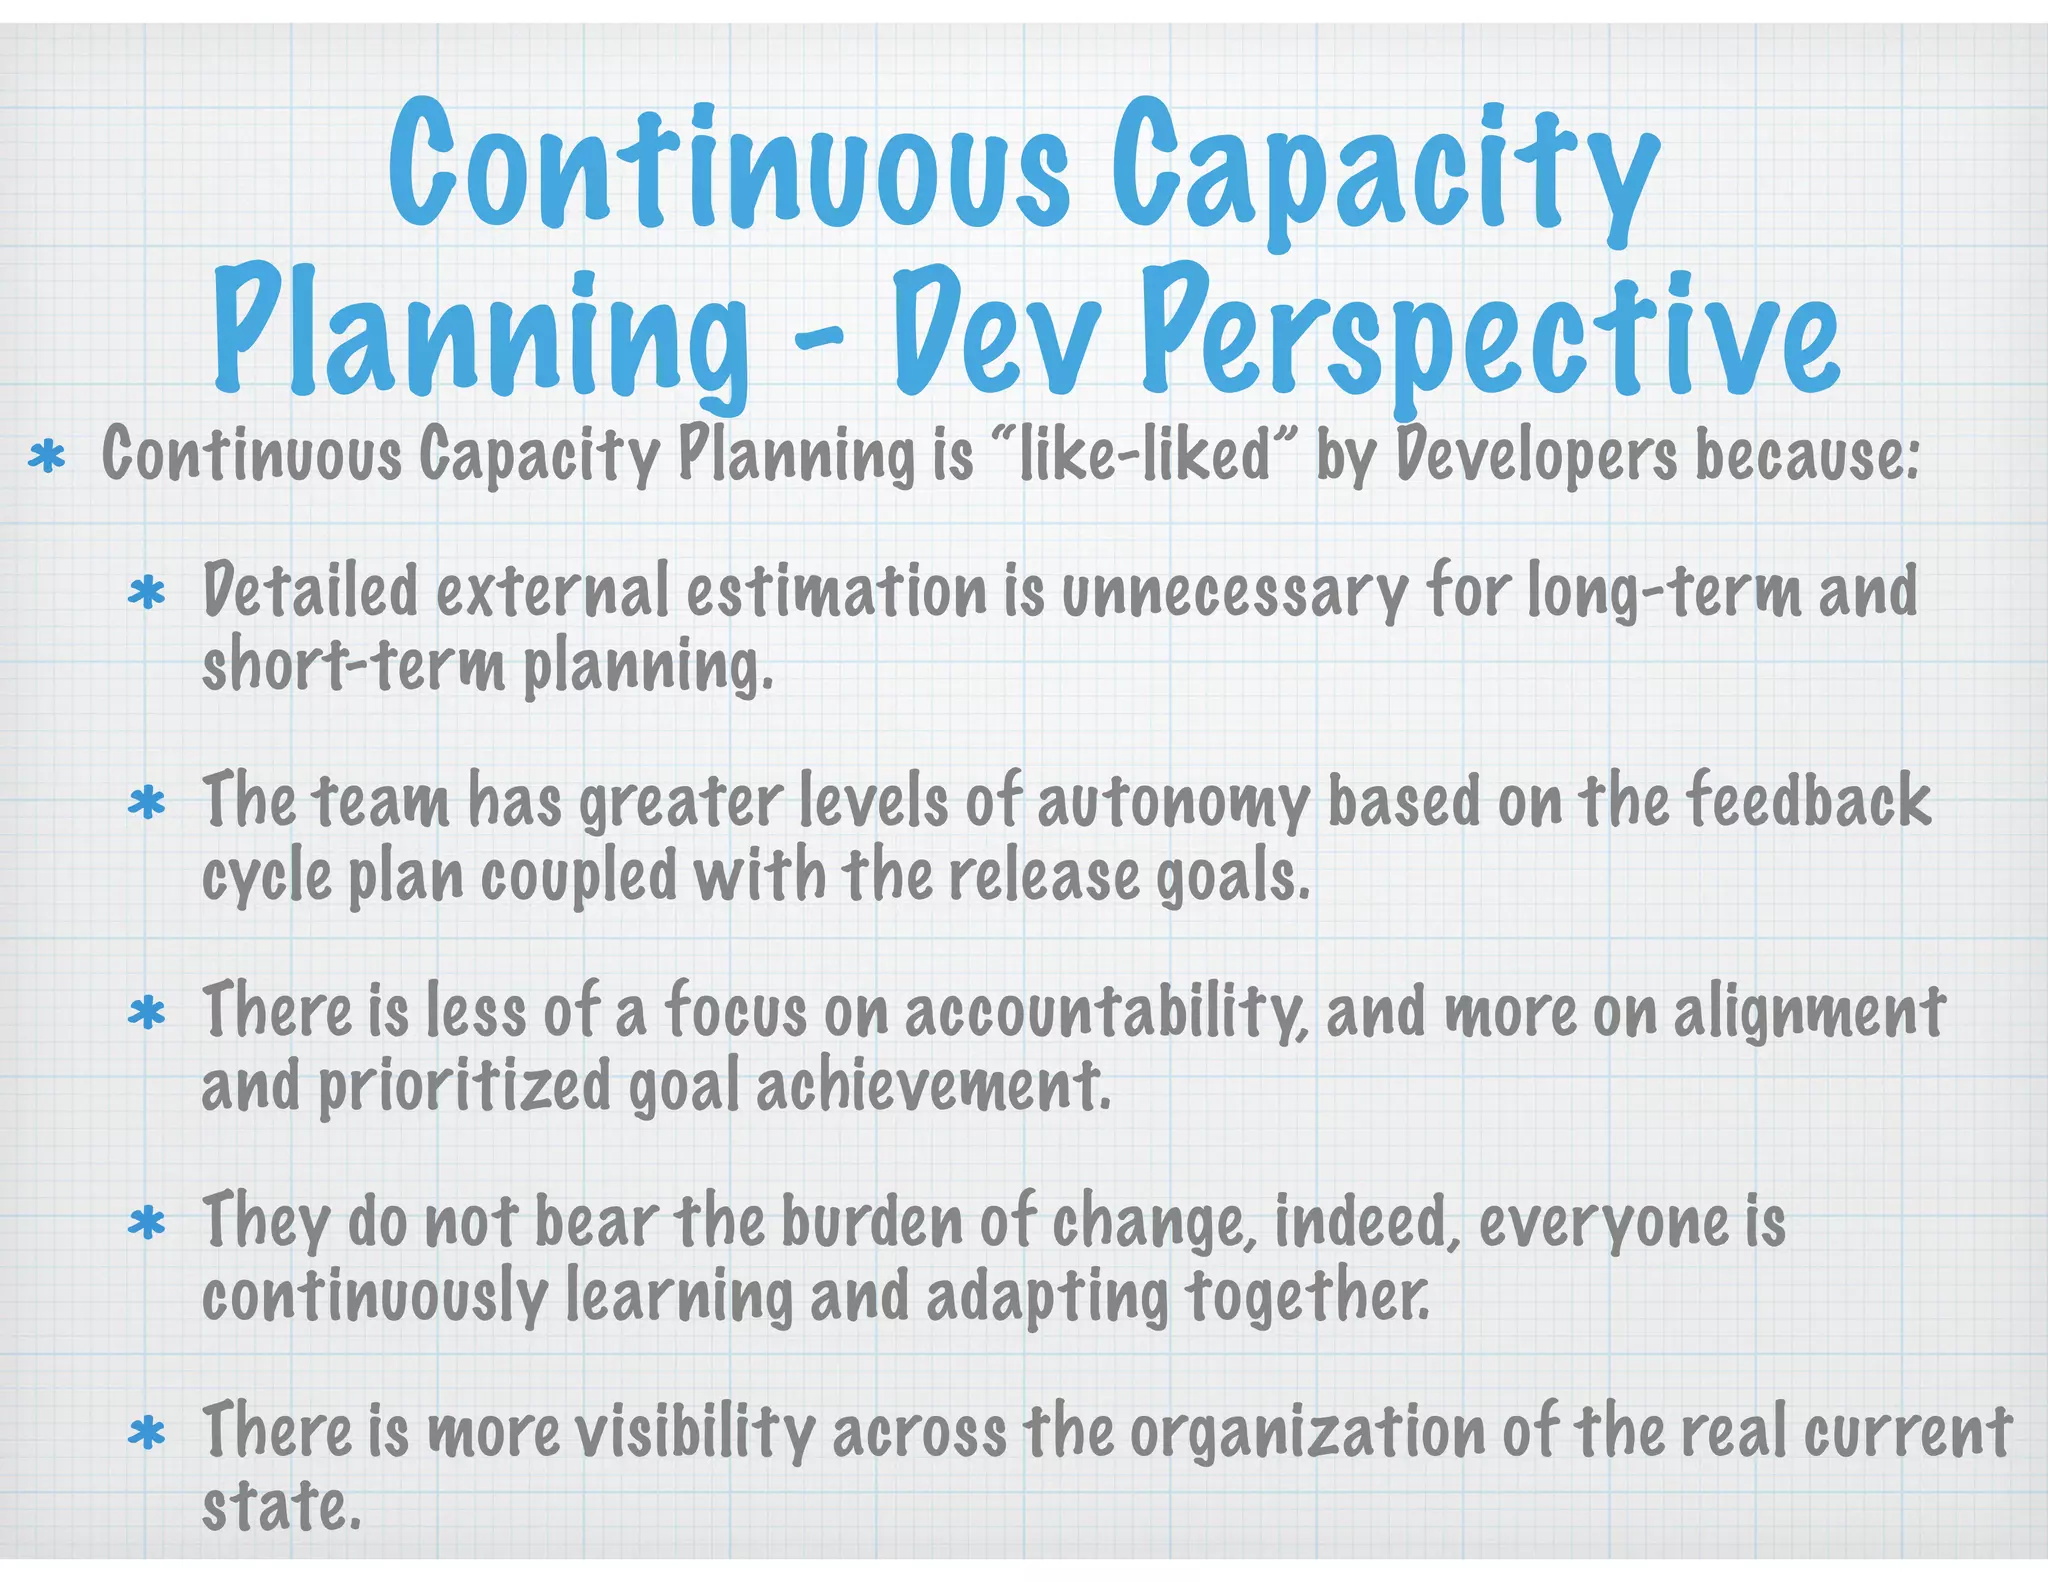
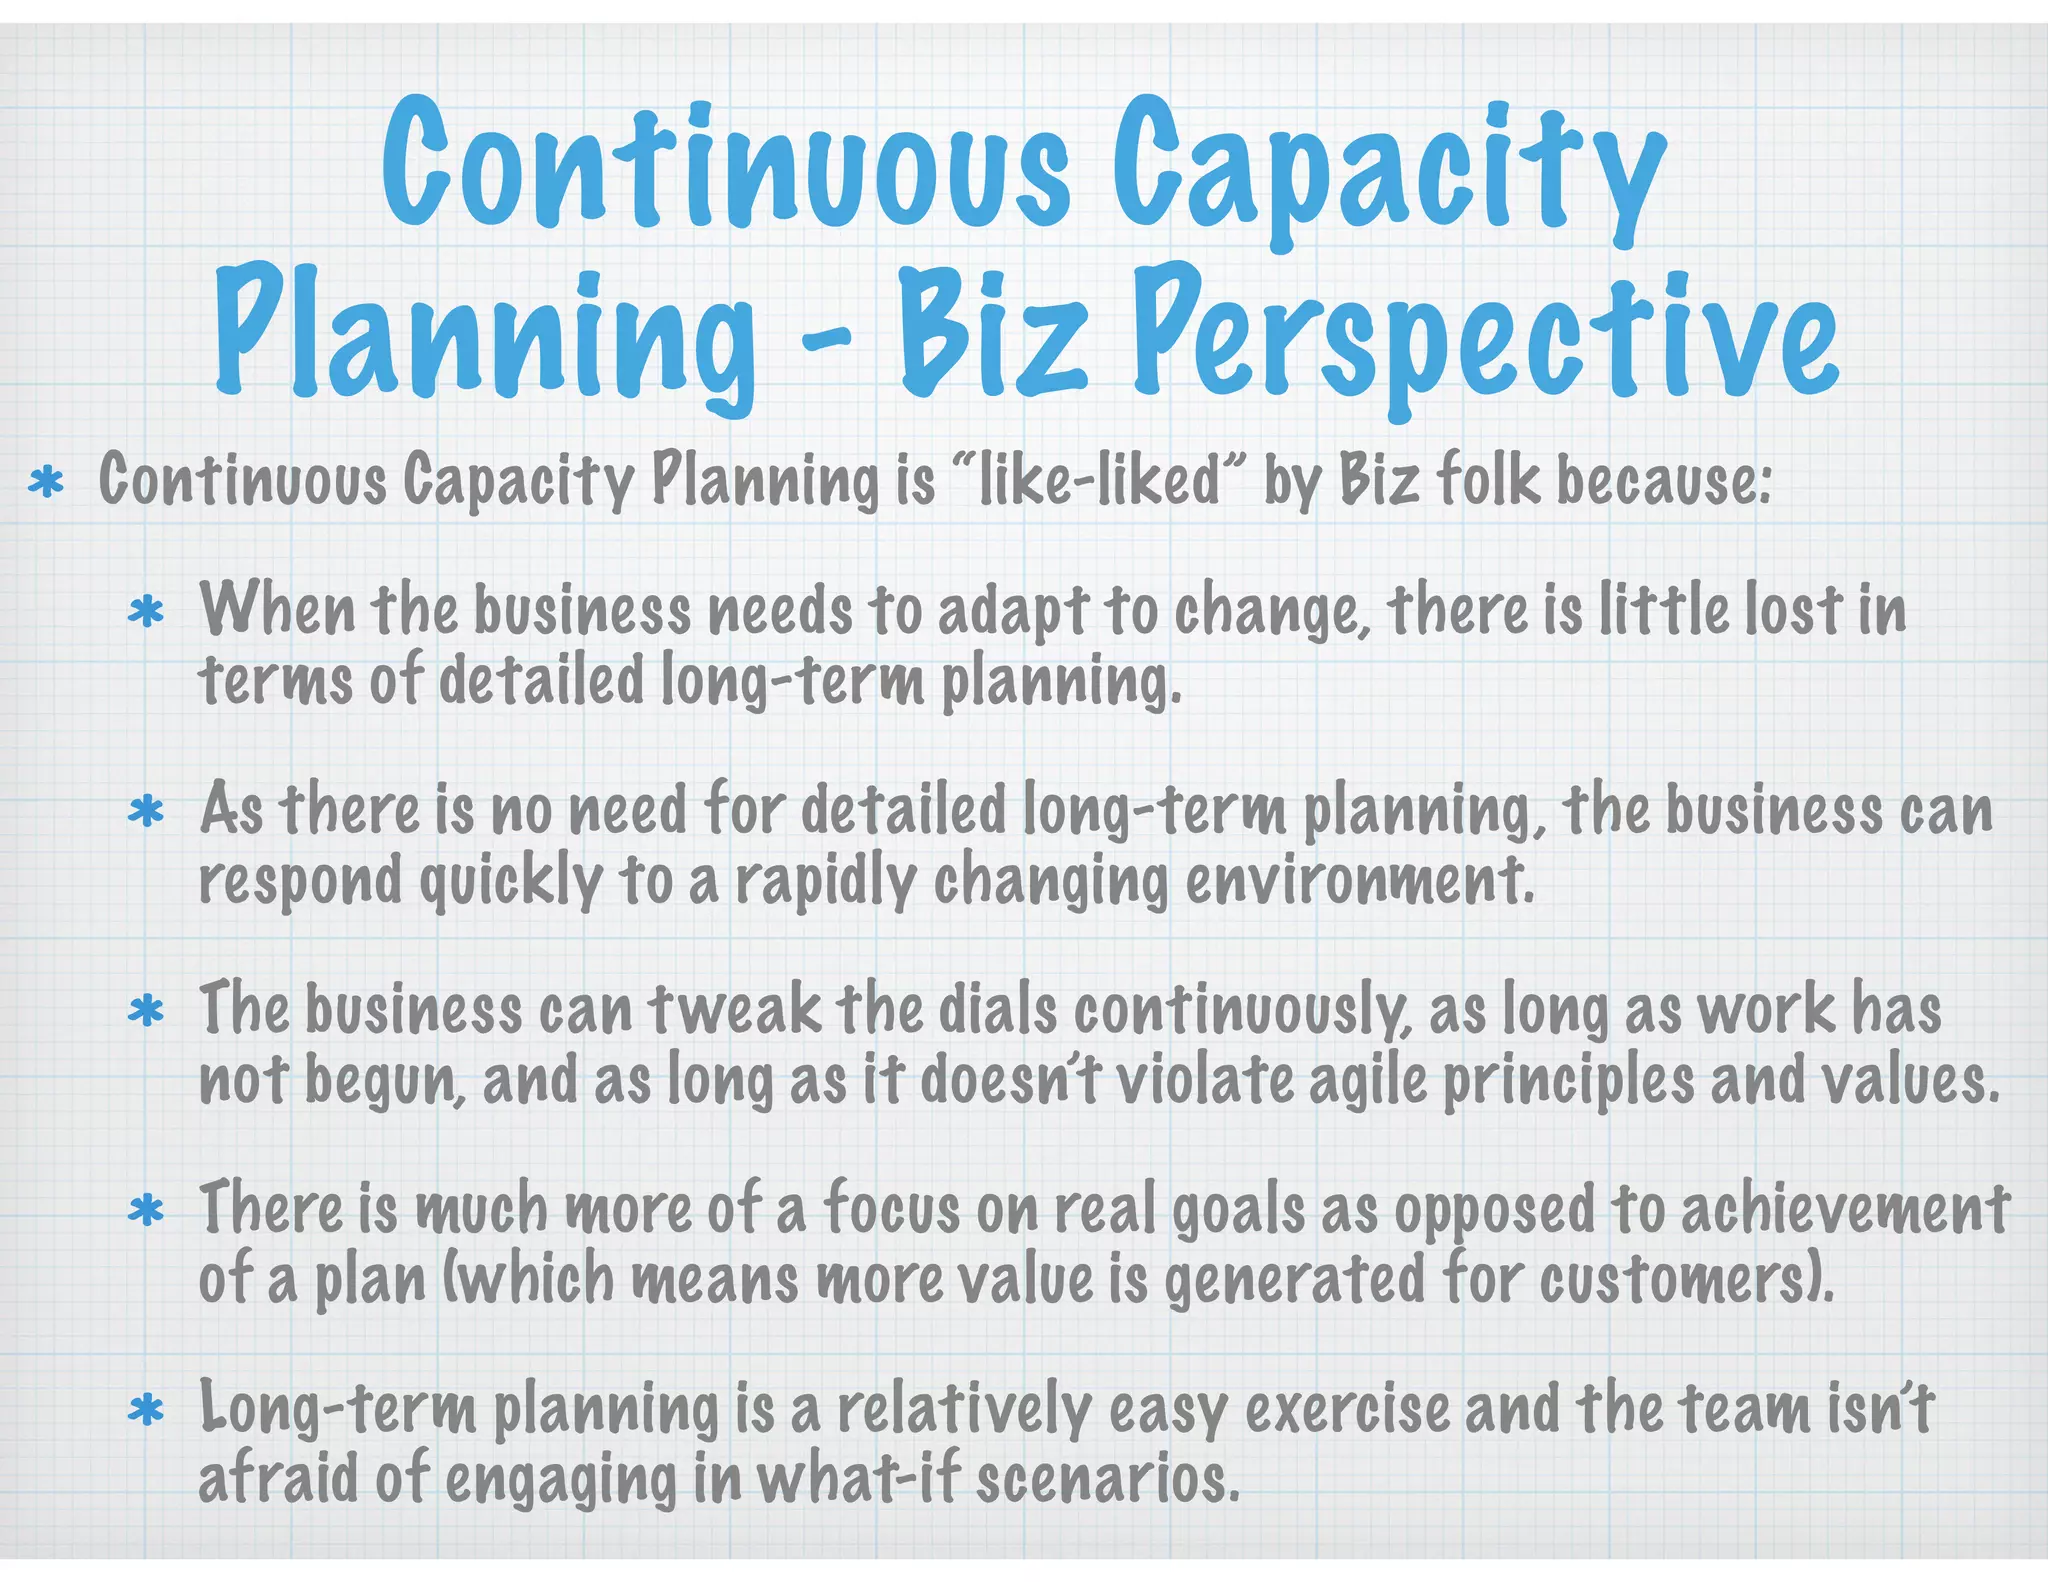
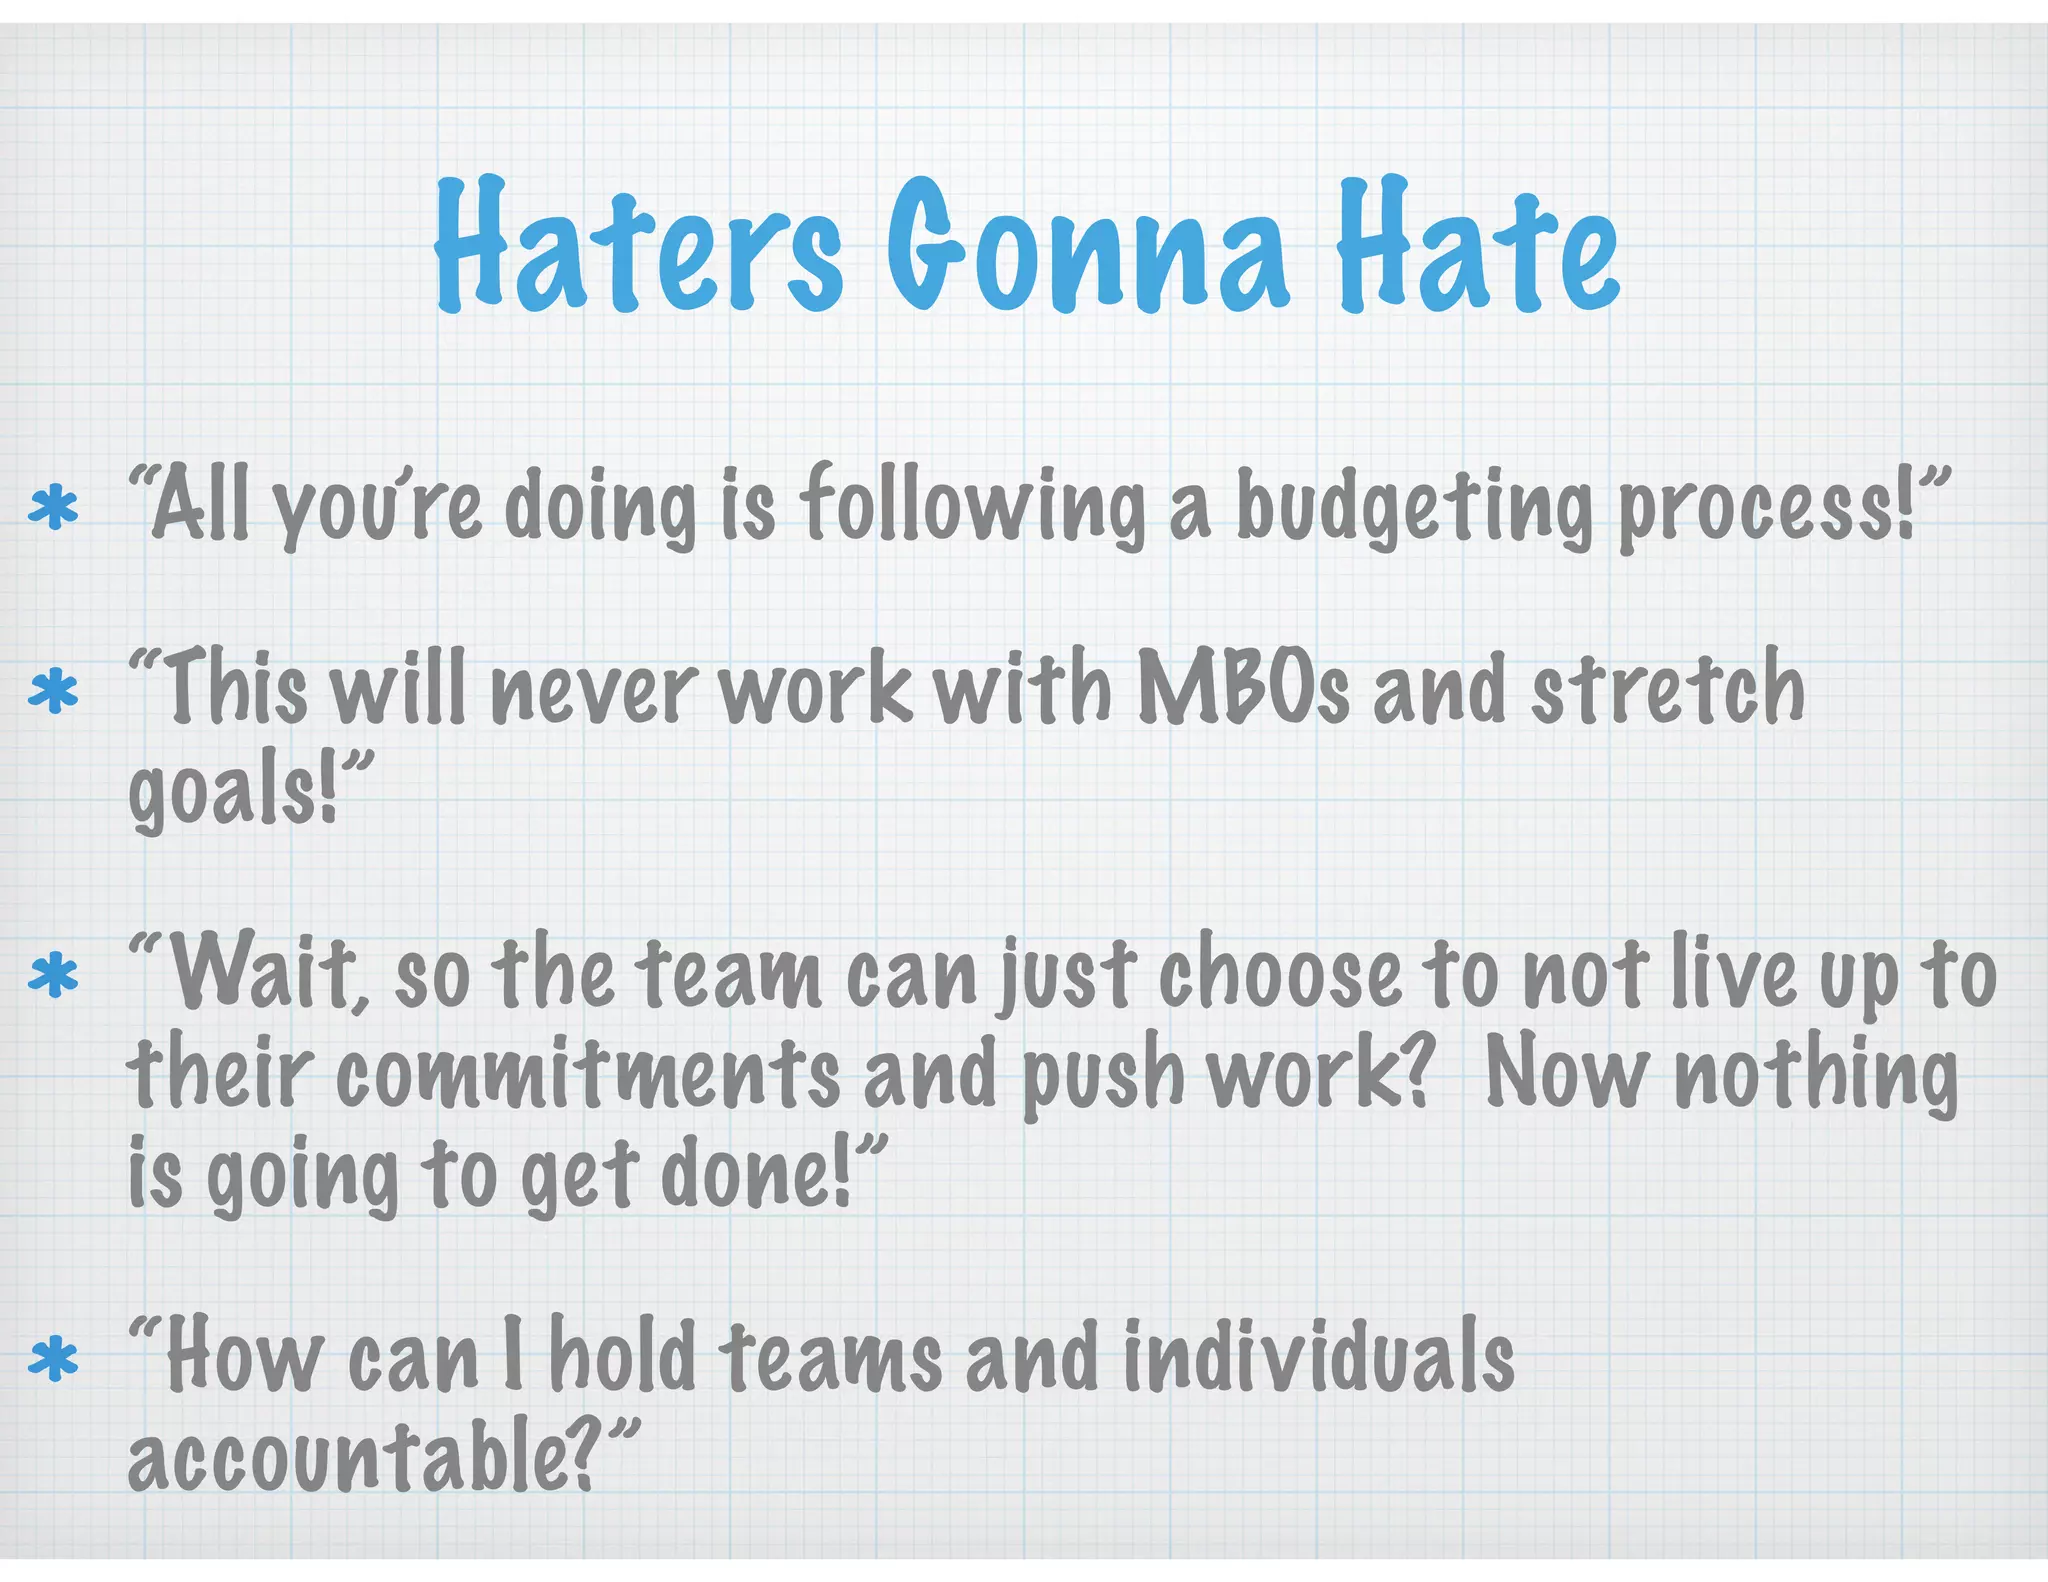
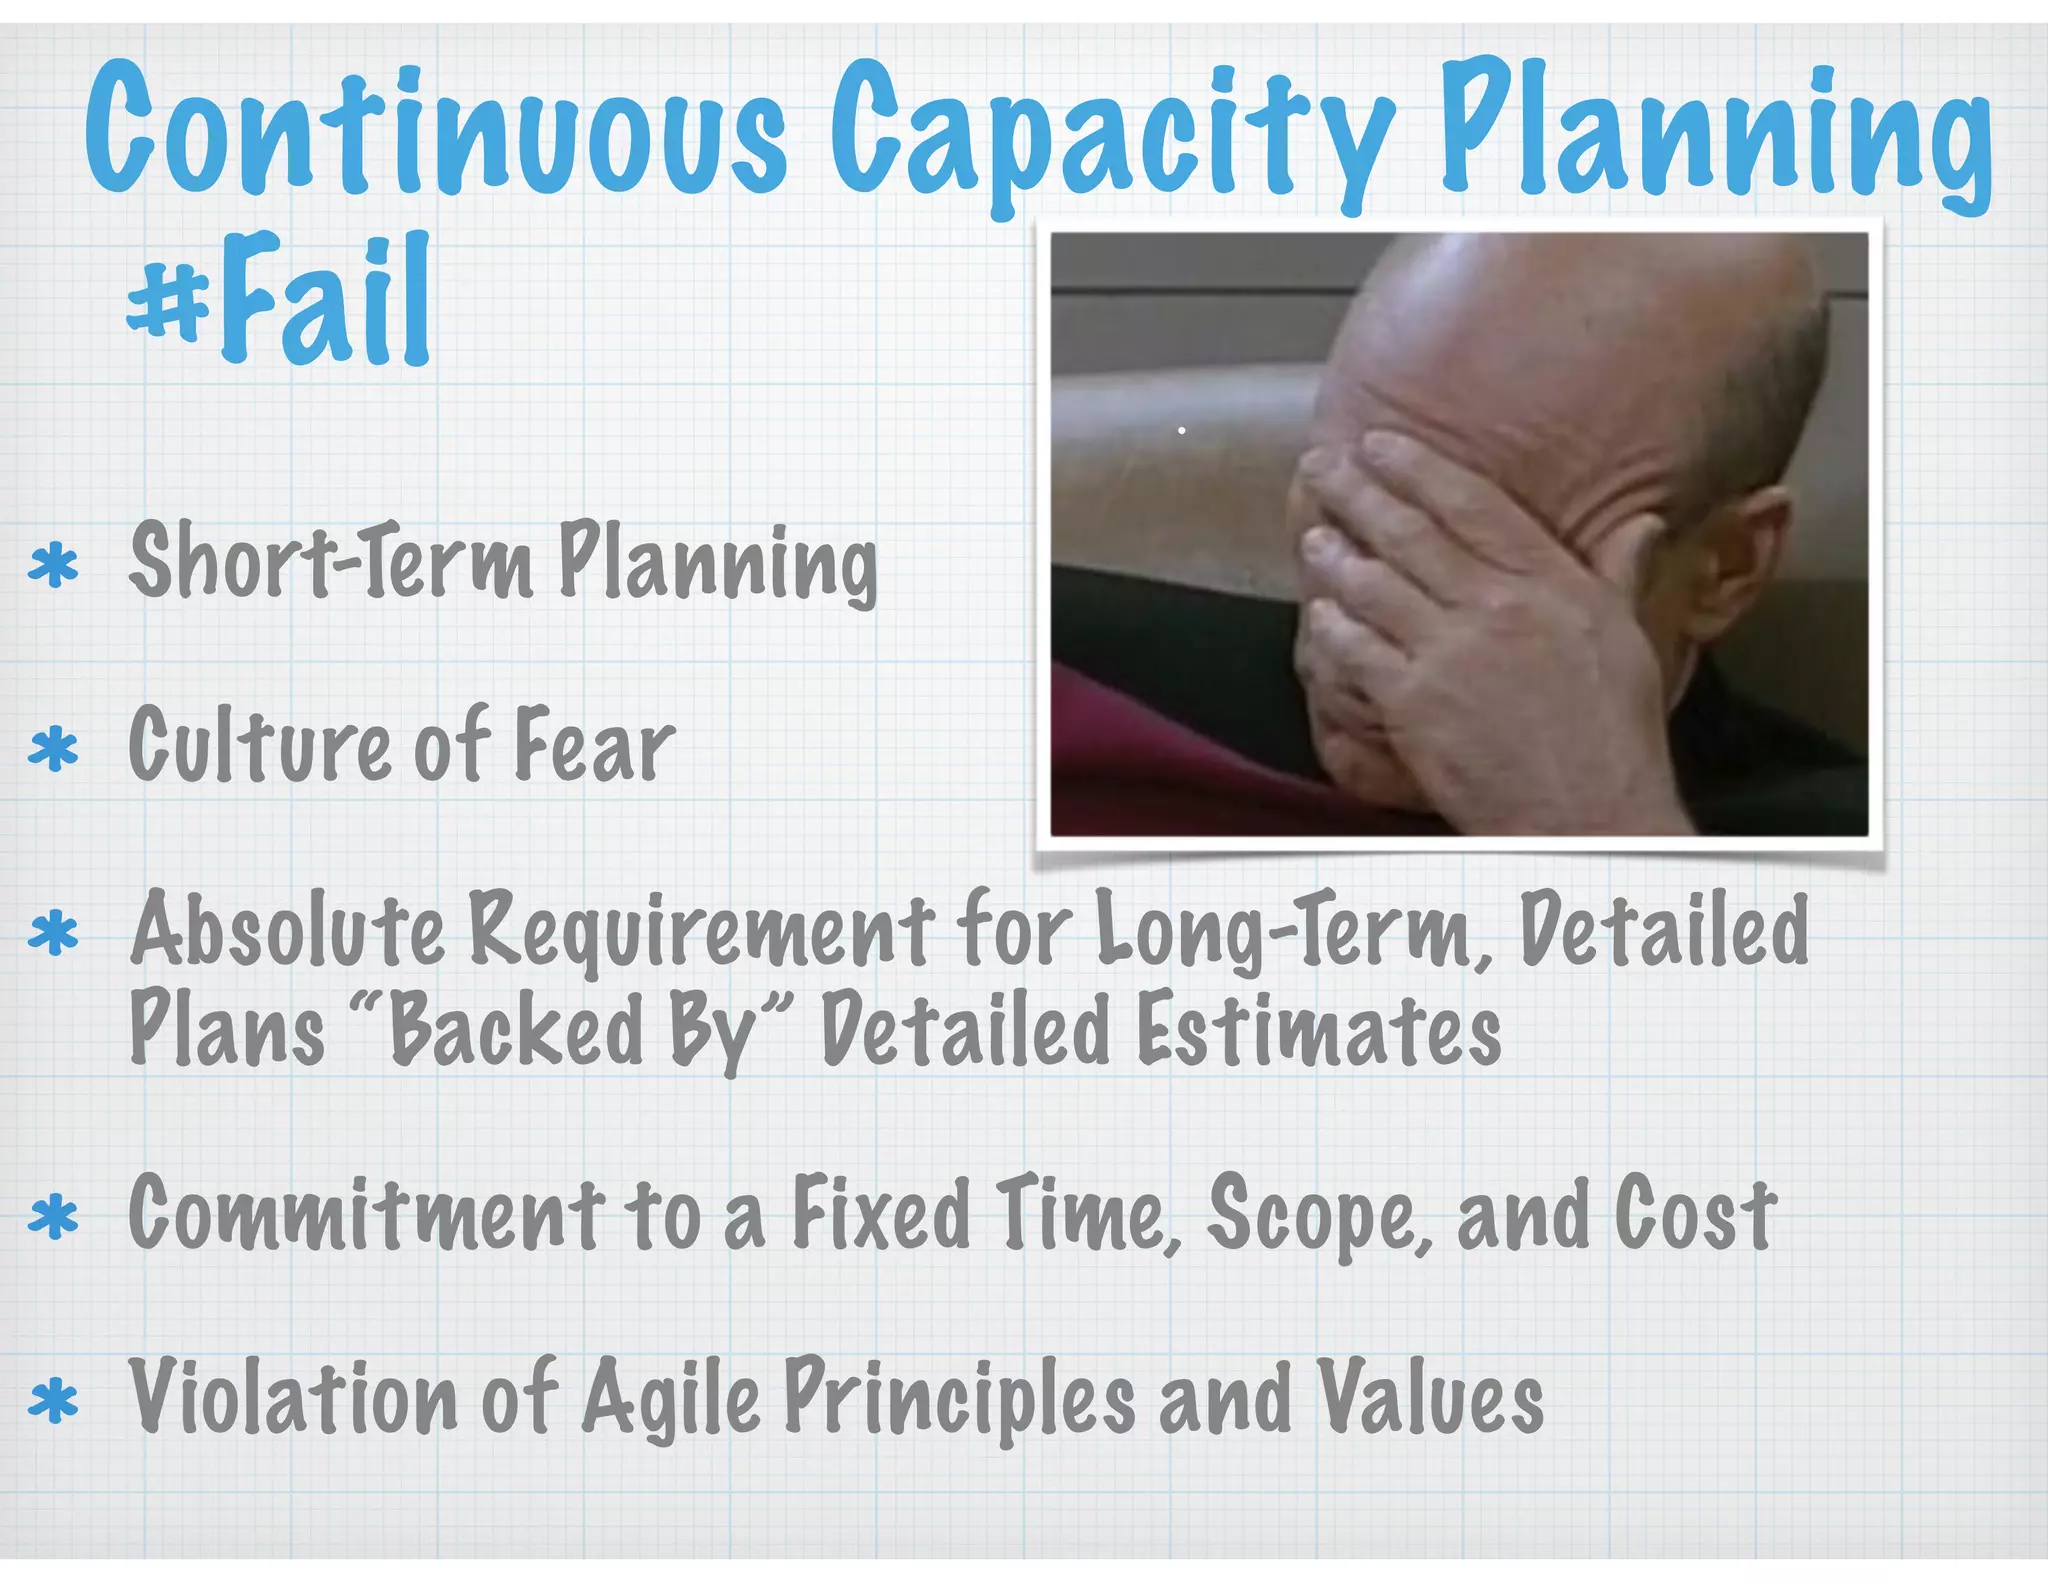
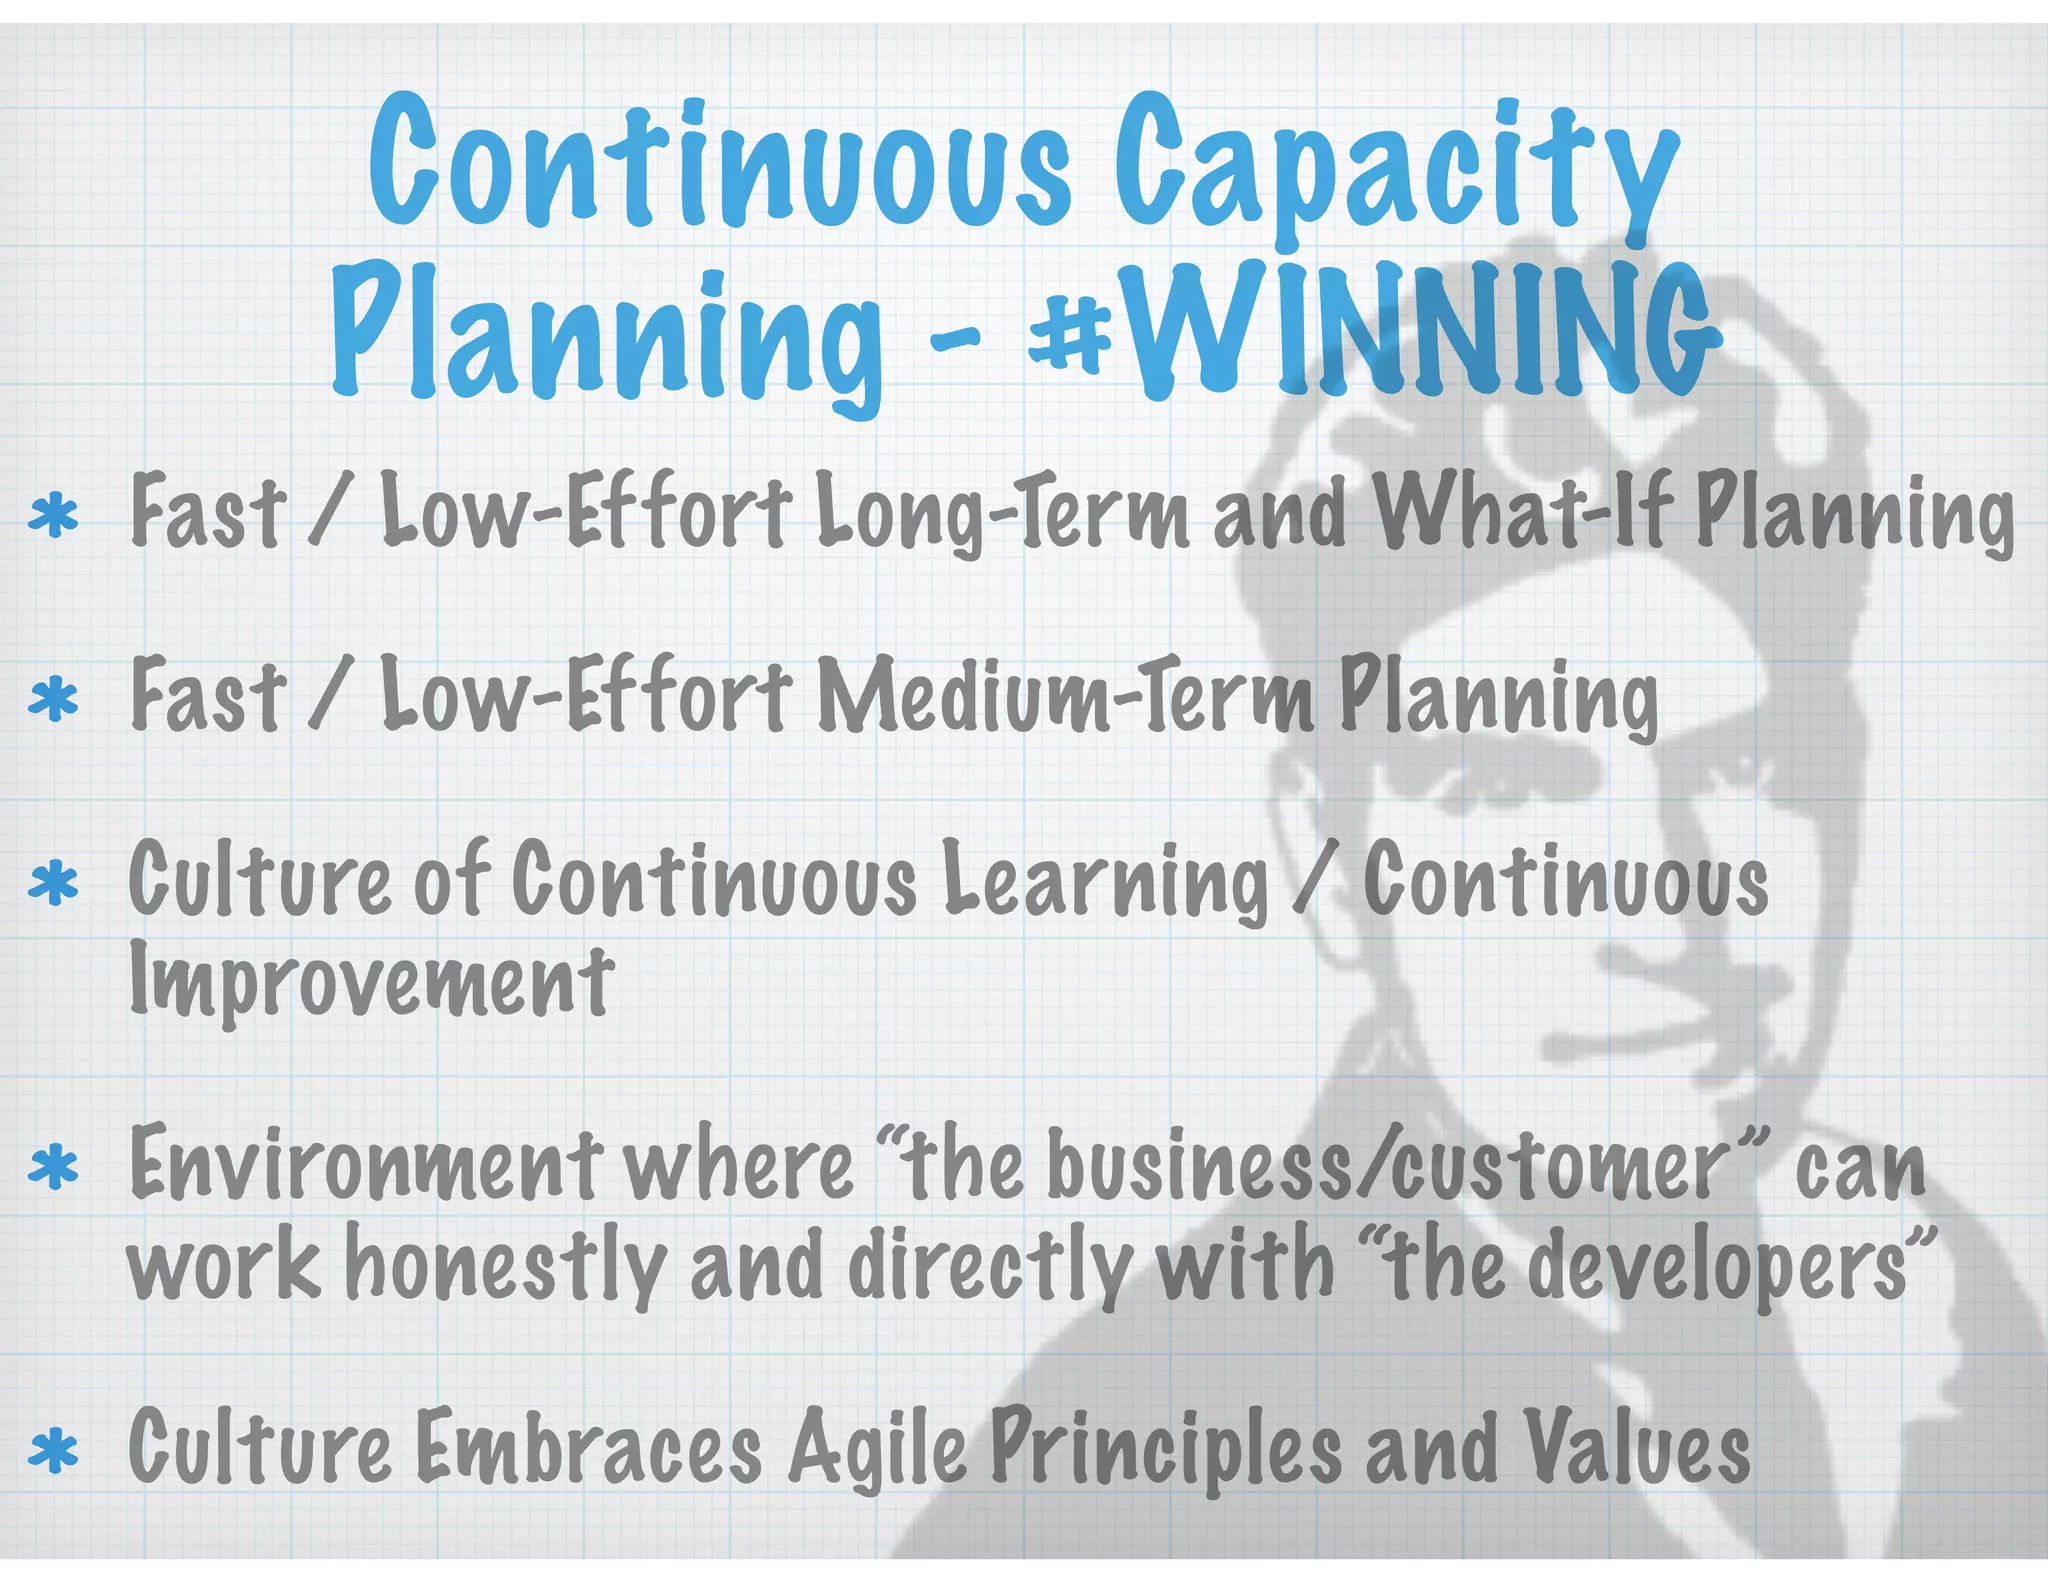
Continuous Agile Planning That the Biz
and Dev Folk can “Like Like”
Matt Roberts , VP Product Development @Socialware
matt@matt-roberts.com | @MulticastMatt
linkedin.com/in/cpgmattr
Abstract:
Many product development teams struggle through “painful” planning
meetings. No one seems to enjoy them but they are deemed necessary for
various reasons that all start off with good intentions and critical needs.
They typically do not harness the power of being responsive to change and
following YAGNI and delaying decision until the last responsible moment
(i.e. more waste than the Austin Community Landfill).
In this talk, Matt will provide an approach that he’s used for years to
strike the delicate balance of building a product and development roadmap
that can be used for long-term planning, medium-term planning, and being
extremely responsive to change. It’s also respectful of the Agile Manifesto
Principles and Values. This approach should make planning an easier, if not
fun, for everyone from Developers to Product Managers to Executives.
Planning - Biz Perspective
“I can’t get those guys to
commit to anything”
“Why can’t they just agree
and move on?”
“Why do we need to have
all these meetings?”
“We already have a date
and scope, why bother?”
Planning - Dev Perspective
“Planning sucks. Estimating sucks”
“You hired me to write software, right?”
“Yesterday, I spent the day in meetings,
today, I’m going to spend the day in
meetings. No blockers”
“We already have a date and scope,
why bother?”
“Why do we need to have all these
meetings?”
“As a developer I want to pad my estimates
excessively so when the requirements
change, I won’t have to stay up all night”
“Responding to change over
following a plan”
“Welcome changing
requirements, even late in
development. Agile processes
harness change for
the customer's competitive
advantage.”
“Simplicity--the art of
maximizing the amount
of work not done--is
essential.”
The Goal
Deliver the highest quality value
to the customer while
maintaining worker safety. This
is accomplished by harnessing
ongoing change through
continuous:
Learning
Planning
Alignment
Risk Reduction / Options
Planning is the Gateway
Drug to Estimating
What
Who / Cost
When?!?!?!
Copyright 2003 Advanced Development Methods
WASTE
How do we achieve the goal?
Long-Term Planning in
Product Development
Product Roadmap
Product Portfolio Strategy
“Long” Releases
Funding (Start-up, New Line of Business, etc.)
Build vs. buy
More?
Medium-Term Planning in
Product Development
Sprint Planning
Small Release Planning
Continuous Flow Backlog Prioritization
Tasking out User Stories
Short-Term Planning in
Product Development
Daily Stand-up
P1 Issues / Critical Situations
Pair Programming
Unit Tests
Coding
Research Spikes
XP Planning
Scrum
Planning
The Way it
Was Envisioned
(unfortunately
generally not
practiced)
Copyright 2003 Advanced Development Methods
Agile Planning Flame
Kanban “Planning”
No formal release planning process as the focus is on
continuous release, but it can be done if needed (e.g. Scrumban)
Measure “Lead
Time” to
determine the
average time for
a piece of work
to flow through
the system
Cumulative flow
identifies waste
Continuous Capacity
Planning
Problem:
Getting ready for another six months of drawn-out planning for a
period to cover a fiscal year that starts at the end of the six months
of planning, I was looking for a better way to serve the needs of the
business and the development team.
Solution:
Continuous Capacity Planning - A New Hope
Capacity Allocation in
Kanban
Capacity Planning
Classify work in terms of:
Product - User Facing: Themes, Epics, User Stories, Research Spikes,
Innovation
Inter-departmental - Support, Service, IT
Internal: Infrastructure (SaaS), DevTools, Technical Debt, Defects,
Research Spikes
Measure all work - historical data from tracking software works great
Involve a small (as responsible) set of the product development team
Establish baseline plan with fixed capacities then adjust to meet the
needs of the customers and team!
Continuous Capacity
Planning
Tag all new work coming into the product development
system in terms of allocations type.
Periodically check that capacity allocations are being
maintained and update release plans, project plans, and
product roadmaps.
Allow the business to prioritize all work within capacity
buckets that has not yet started, but try to stick to
allocations. If allocations need to change, be explicit.
More can be done in the same time quickly through
elimination of waste or eventually with additional capacity.
Agile Planning Flame
Continuous CapacityPlanning
Continuous Capacity
Planning ExamplePredict-IT is an Austin-based software company, delivering the most
innovative value to customers operating large-scale data centers.
They are planning a Q3 release to capture a specific market window,
but don’t want to spend the time on a big up front planning exercise as
everyone wants to get started.
However, executives and product management need to understand
what, who, and when, but want to be responsive to change.
The example is about planning, not the choices that were made
throughout the project (find improvements!)
The “Feedback Cycle” approach could be for Scrum or Kanban/
Continuous Flow Systems. Assume that these are periodic investment
checks for longer-term planning.
Predict-IT Roadmap (v1)
Q3 Q4 Q1 Q2
Capacity
Planner
CIO
IT
Director
HelpDesk
Advisor
Accountant
Legal
“On The Go Capacity
Planner”
Mobile Use Cases
Advanced Virtualization Platforms
Support for Amazon VPC, Azure, Rackspace
Visible Infrastructure
UI Viz. of Public and Private Cloud
Integrated Dashboard
Cost, SAL, Exceptions All in One User
Experience
Situational
Awareness
Configurable Notifications
Situational Awareness On-The-Go
Notifications across all mobile platforms with
configurable escalation paths
Fast Troubleshooting
All tickets have env. info
Third-Party Knowledge Base
Integration into rich KB of possible fixes
integrated into response system
Regulatory Compliance
Rules importable into predictive rules
engine for workload assignment
Release Planning
“On The Go
Capacity
Planner”
25%
Visible
Infra.
20%
Sit. Aware-
ness 10%
SaaS Inf.
15%
Tech. Debt/
Retro
20%
Support
10%
I II III IV V VI
Predict-IT Roadmap (v1)
Q3 Q4 Q1 Q2
Capacity
Planner
CIO
IT
Director
HelpDesk
Advisor
Accountant
Legal
“On The Go Capacity
Planner”
Mobile Use Cases
Advanced Virtualization Platforms
Support for Amazon VPC, Azure, Rackspace
Visible Infrastructure
UI Viz. of Public and Private Cloud
Integrated Dashboard
Cost, SAL, Exceptions All in One User
Experience
Situational
Awareness
Configurable Notifications
Situational Awareness On-The-Go
Notifications across all mobile platforms with
configurable escalation paths
Fast Troubleshooting
All tickets have env. info
Third-Party Knowledge Base
Integration into rich KB of possible fixes
integrated into response system
Regulatory Compliance
Rules importable into predictive rules
engine for workload assignment
I II III IV V VI
Feedback Cycle Plan I - Hypothesis
“On The Go
Capacity
Planner”
25%
Visible
Infra.
20%
Sit. Aware-
ness 10%
SaaS Inf.
15%
Tech. Debt/
Retro
20%
Support
10%
I
User Story
User Story
User Story
Defect
Retro
Spike
Spike
Support
“On The Go Capacity Planner”
Sum of Capacity (Story Points or #Items) = 30%
Visible Infra.
Sum of Capacity (Story Points or #Items) = 15%
Sit. Awareness
Sum of Capacity (Story Points or #Items) = 10%
SaaS Inf
Sum of Capacity (Story Points or #Items) = 15%
Tech. Debt/Retro
Sum of Capacity (Story Points or #Items) = 20%
Support
Sum of Capacity (Story Points or #Items) = 10
All Bets
Down!
Feedback Cycle Plan I - Result
“On The Go
Capacity
Planner”
25%
Visible
Infra.
20%
Sit. Aware-
ness 10%
SaaS Inf.
15%
Tech. Debt/
Retro
20%
Support
10%
I
User Story
User Story
User Story
Defect
Retro
Spike
Spike
Support
“On The Go Capacity Planner”
Sum of Capacity (Story Points or #Items) = 20%
10% Under
Visible Infra.
Sum of Capacity (Story Points or #Items) = 0%
15% Under
Sit. Awareness
Sum of Capacity (Story Points or #Items) = 0%
10% Under
SaaS Inf
Sum of Capacity (Story Points or #Items) = 50%
35% Over
Tech. Debt/Retro
Sum of Capacity (Story Points or #Items) = 20%
At Plan
DoneDone
Support
Sum of Capacity (Story Points or #Items) = 10%
Predict-IT Roadmap
Q3 Q4 Q1 Q2
Capacity
Planner
CIO
IT
Director
HelpDesk
Advisor
Accountant
Legal
“On The Go Capacity
Planner”
Mobile Use Cases
Advanced Virtualization Platforms
Support for Amazon VPC, Azure, Rackspace
Visible Infrastructure
UI Viz. of Public and Private Cloud
Integrated Dashboard
Cost, SAL, Exceptions All in One User
Experience
Situational
Awareness
Configurable Notifications
Situational Awareness On-The-Go
Notifications across all mobile platforms with
configurable escalation paths
Fast Troubleshooting
All tickets have env. info
Third-Party Knowledge Base
Integration into rich KB of possible fixes
integrated into response system
Regulatory Compliance
Rules importable into predictive rules
engine for workload assignment
I II III IV V VI
Risk - Didn’t Get
Started
Risk - Didn’t Get
Started
Feedback Cycle Plan II - Hypothesis
“On The Go
Capacity
Planner”
20%
Visible
Infra.
20%
Sit. Aware-
ness 10%
SaaS Inf.
15%
Tech. Debt/
Retro
20%
Support
10%
II
Defect
Spike
Support
“On The Go Capacity Planner”
Sum of Capacity (Story Points or #Items) = 20%
Visible Infra.
Sum of Capacity (Story Points or #Items) = 15%
Sit. Awareness
Sum of Capacity (Story Points or #Items) = 15%
SaaS Inf
Sum of Capacity (Story Points or #Items) = 25%
Tech. Debt/Retro
Sum of Capacity (Story Points or #Items) = 15%
Support
Sum of Capacity (Story Points or #Items) = 10%
User Story
User Story
Spike
User Story
Defect
All Bets
Down!
Feedback Cycle Plan II - Result
“On The Go
Capacity
Planner”
20%
Visible
Infra.
20%
Sit. Aware-
ness 10%
SaaS Inf.
15%
Tech. Debt/
Retro
20%
Support
10%
II
Defect
Spike
Support
“On The Go Capacity Planner”
Sum of Capacity (Story Points or #Items) = 20%
Visible Infra.
Sum of Capacity (Story Points or #Items) = 15%
Sit. Awareness
Sum of Capacity (Story Points or #Items) = 5%
10% Under
SaaS Inf
Sum of Capacity (Story Points or #Items) = 35%
10% Over
Tech. Debt/Retro
Sum of Capacity (Story Points or #Items) = 15%
Support
Sum of Capacity (Story Points or #Items) = 10%
User Story
User Story
Spike
User Story
Defect
DoneDone
Predict-IT Roadmap
Q3 Q4 Q1 Q2
Capacity
Planner
CIO
IT
Director
HelpDesk
Advisor
Accountant
Legal
“On The Go Capacity
Planner”
Mobile Use Cases
Advanced Virtualization Platforms
Support for Amazon VPC, Azure, Rackspace
Visible Infrastructure
UI Viz. of Public and Private Cloud
Integrated Dashboard
Cost, SAL, Exceptions All in One User
Experience
Situational
Awareness
Configurable Notifications
Situational Awareness On-The-Go
Notifications across all mobile platforms with
configurable escalation paths
Fast Troubleshooting
All tickets have env. info
Third-Party Knowledge Base
Integration into rich KB of possible fixes
integrated into response system
Regulatory Compliance
Rules importable into predictive rules
engine for workload assignment
I II III IV V VI
Ready to
Release!
New Feature Will
Increase Sales 50%!
“Fix SaaS
Security Leak!”
Risk - Not
Really Started
Feedback Cycle Plan III - Hypothesis
Visible
Infra.
30%
Sit. Aware-
ness 10%
SaaS Inf.
30%
Tech. Debt/
Retro
20%
Support
10%
III
Defect
Support
Visible Infra.
Sum of Capacity (Story Points or #Items) = 30%
Sit. Awareness
Sum of Capacity (Story Points or #Items) = 10%
SaaS Inf
Sum of Capacity (Story Points or #Items) = 30%
Tech. Debt/Retro
Sum of Capacity (Story Points or #Items) = 20%
Support
Sum of Capacity (Story Points or #Items) = 10%
Defect
User Story
Defect
User Story
User Story
User Story
Retro
All Bets
Down!
Feedback Cycle Plan III - Result
Visible
Infra.
30%
Sit. Aware-
ness 10%
SaaS Inf.
30%
Tech. Debt/
Retro
20%
Support
10%
III
Defect
Support
Visible Infra.
Sum of Capacity (Story Points or #Items) = 30%
Sit. Awareness
Sum of Capacity (Story Points or #Items) = 0%
10% Under
SaaS Inf
Sum of Capacity (Story Points or #Items) = 25%
5% Under
Tech. Debt/Retro
Sum of Capacity (Story Points or #Items) = 25%
5% Over
Support
Sum of Capacity = 20% (10% Over)
Defect
User Story
Defect
User Story
User Story
User Story
Retro
DoneDone
Predict-IT Roadmap
Q3 Q4 Q1 Q2
Capacity
Planner
CIO
IT
Director
HelpDesk
Advisor
Accountant
Legal
“On The Go Capacity
Planner”
Mobile Use Cases
Advanced Virtualization Platforms
Support for Amazon VPC, Azure, Rackspace
Visible Infrastructure
UI Viz. of Public and Private Cloud
Integrated Dashboard
Cost, SAL, Exceptions All in One User
Experience
Situational
Awareness
Configurable Notifications
Situational Awareness On-The-Go
Notifications across all mobile platforms with
configurable escalation paths
Fast Troubleshooting
All tickets have env. info
Third-Party Knowledge Base
Integration into rich KB of possible fixes
integrated into response system
Regulatory Compliance
Rules importable into predictive rules
engine for workload assignment
I II III IV V VI
Done
New Feature Will
Increase Sales 50%!
Risk - No
Progress
Predict-IT Roadmap
Q3 Q4 Q1 Q2
Capacity
Planner
CIO
IT
Director
HelpDesk
Advisor
Accountant
Legal
“On The Go Capacity
Planner”
Mobile Use Cases
Advanced Virtualization Platforms
Support for Amazon VPC, Azure, Rackspace
Visible Infrastructure
UI Viz. of Public and Private Cloud
Integrated Dashboard
Cost, SAL, Exceptions All in One User
Experience
Situational Awareness
Configurable Notifications
Situational Awareness On-The-Go
Notifications across all mobile platforms with
configurable escalation paths
Fast Troubleshooting
All tickets have env. info
Third-Party Knowledge Base
Integration into rich KB of possible fixes
integrated into response system
Regulatory Compliance
Rules importable into predictive rules
engine for workload assignment
I II III IV V VI
Done
New Feature Will
Increase Sales 50%!
Do MVP Only for Q3
Remaining in Q4
Feedback Cycle Plan IV - Hypothesis
Visible
Infra.
30%
Sit. Aware-
ness 15%
SaaS Inf.
30%
Tech. Debt/
Retro
20%
Support 5%
IV
Defect
Support
Visible Infra.
Sum of Capacity (Story Points or #Items) = 30%
Sit. Awareness
Sum of Capacity (Story Points or #Items) = 15%
SaaS Inf
Sum of Capacity (Story Points or #Items) = 30%
Tech. Debt/Retro
Sum of Capacity (Story Points or #Items) = 20%
Support
Sum of Capacity (Story Points or #Items) = 5%
User Story
Defect
User Story
User Story
User Story
Retro
Defect
All Bets
Down!
Feedback Cycle Plan IV - Result
Visible
Infra.
30%
Sit. Aware-
ness 15%
SaaS Inf.
30%
Tech. Debt/
Retro
20%
Support 5%
IV
Defect
Support
Visible Infra.
Sum of Capacity (Story Points or #Items) = 30%
Sit. Awareness
Sum of Capacity (Story Points or #Items) = 15%
SaaS Inf
Sum of Capacity (Story Points or #Items) = 30%
Tech. Debt/Retro
Sum of Capacity (Story Points or #Items) = 20%
Support
Sum of Capacity = 0% (5% Under)
User Story
Defect
User Story
User Story
User Story
Retro
Defect DoneDone
Predict-IT Roadmap
Q3 Q4 Q1 Q2
Capacity
Planner
CIO
IT
Director
HelpDesk
Advisor
Accountant
Legal
“On The Go Capacity
Planner”
Mobile Use Cases
Advanced Virtualization Platforms
Support for Amazon VPC, Azure, Rackspace
Visible Infrastructure
UI Viz. of Public and Private Cloud
Integrated Dashboard
Cost, SAL, Exceptions All in One User
Experience
Situational Awareness
Configurable Notifications
Situational Awareness On-The-Go
Notifications across all mobile platforms with
configurable escalation paths
Fast Troubleshooting
All tickets have env. info
Third-Party Knowledge Base
Integration into rich KB of possible fixes
integrated into response system
Regulatory Compliance
Rules importable into predictive rules
engine for workload assignment
I II III IV V VI
Done
New Feature Will
Increase Sales 50%!
Do MVP Only for Q3
Remaining in Q4
“Solve Cust.
Crit-Sit at all
costs!!!!”
Feedback Cycle Plan V - Hypothesis
Visible
Infra.
40%
Sit. Aware-
ness 15%
SaaS Inf.
10%
Tech. Debt/
Retro
20%
Support
15%
V
Support
Visible Infra.
Sum of Capacity (Story Points or #Items) = 40%
Sit. Awareness
Sum of Capacity (Story Points or #Items) = 15%
SaaS Inf
Sum of Capacity (Story Points or #Items) = 10%
Tech. Debt/Retro
Sum of Capacity (Story Points or #Items) = 20%
Support
Sum of Capacity = 15%
Defect
User Story
User Story
User Story
Retro
Story
User Story
Story
All Bets
Down!
Feedback Cycle Plan V - Result
Visible
Infra.
40%
Sit. Aware-
ness 15%
SaaS Inf.
10%
Tech. Debt/
Retro
20%
Support
15%
V
Support
Visible Infra.
Sum of Capacity (Story Points or #Items) = 40%
Sit. Awareness
Sum of Capacity (Story Points or #Items) = 0%
15% Under
SaaS Inf
Sum of Capacity (Story Points or #Items) = 0%
10% Under
Tech. Debt/Retro
Sum of Capacity (Story Points or #Items) = 0%
20% Under
Support
Sum of Capacity = 60% (45% Over)
Defect
User Story
User Story
User Story
Retro
Story
User Story
Story
DoneDone
Predict-IT Roadmap
Q3 Q4 Q1 Q2
Capacity
Planner
CIO
IT
Director
HelpDesk
Advisor
Accountant
Legal
“On The Go Capacity
Planner”
Mobile Use Cases
Advanced Virtualization Platforms
Support for Amazon VPC, Azure, Rackspace
Visible Infrastructure
UI Viz. of Public and Private Cloud
Integrated Dashboard
Cost, SAL, Exceptions All in One User
Experience
Situational Awareness
Configurable Notifications
Situational Awareness On-The-Go
Notifications across all mobile platforms
with configurable escalation paths
Fast Troubleshooting
All tickets have env. info
Third-Party Knowledge Base
Integration into rich KB of possible fixes
integrated into response system
Regulatory Compliance
Rules importable into predictive rules
engine for workload assignment
I II III IV V VI
Done
Done
Pull from
release
Predict-IT Roadmap
Q3 Q4 Q1 Q2
Capacity
Planner
CIO
IT
Director
HelpDesk
Advisor
Accountant
Legal
“On The Go Capacity
Planner”
Mobile Use Cases
Advanced Virtualization Platforms
Support for Amazon VPC, Azure, Rackspace
Visible Infrastructure
UI Viz. of Public and Private Cloud
Integrated Dashboard
Cost, SAL, Exceptions All in One User
Experience
Situational Awareness
Configurable Notifications
Situational Awareness On-The-Go
Notifications across all mobile platforms
with configurable escalation paths
Fast Troubleshooting
All tickets have env. info
Third-Party Knowledge Base
Integration into rich KB of possible fixes
integrated into response system
Regulatory Compliance
Rules importable into predictive rules
engine for workload assignment
I II III IV V VI
Done
Done
“Quality
Release!”
Feedback Cycle Plan VI - Hypothesis
SaaS Inf.
50%
Tech. Debt/
Retro
25%
Support
25%
V
SaaS Inf
Sum of Capacity (Story Points or #Items) = 50%
Tech. Debt/Retro
Sum of Capacity (Story Points or #Items) = 25%
Support
Sum of Capacity = 25%
User Story
Defect
Defect
Support
Defect
Retro
User Story
Retro
All Bets
Down!
Feedback Cycle Plan VI - Result
SaaS Inf.
50%
Tech. Debt/
Retro
25%
Support
25%
V
SaaS Inf
Sum of Capacity (Story Points or #Items) = 30%
20% Under
Tech. Debt/Retro
Sum of Capacity (Story Points or #Items) = 25%
Support
Sum of Capacity = 25%
User Story
Defect
Defect
Support
Defect
Retro
User Story
Retro
DoneDone
NEW - All
Hand’s
Sales Demo
20%
Predict-IT Roadmap
Q3 Q4 Q1 Q2
Capacity
Planner
CIO
IT
Director
HelpDesk
Advisor
Accountant
Legal
“On The Go Capacity
Planner”
Mobile Use Cases
Advanced Virtualization Platforms
Support for Amazon VPC, Azure, Rackspace
Visible Infrastructure
UI Viz. of Public and Private Cloud
Integrated Dashboard
Cost, SAL, Exceptions All in One User
Experience
Situational Awareness
Configurable Notifications
Situational Awareness On-The-Go
Notifications across all mobile platforms
with configurable escalation paths
Fast Troubleshooting
All tickets have env. info
Third-Party Knowledge Base
Integration into rich KB of possible fixes
integrated into response system
Regulatory Compliance
Rules importable into predictive rules
engine for workload assignment
I II III IV V VI
Done
Done, GOT THE DEAL!
NICE JOB ALL!
MISSION ACCOMPLISHED!
Continuous Capacity
Planning - Dev Perspective
Continuous Capacity Planning is “like-liked” by Developers because:
Detailed external estimation is unnecessary for long-term and
short-term planning.
The team has greater levels of autonomy based on the feedback
cycle plan coupled with the release goals.
There is less of a focus on accountability, and more on alignment
and prioritized goal achievement.
They do not bear the burden of change, indeed, everyone is
continuously learning and adapting together.
There is more visibility across the organization of the real current
state.
Continuous Capacity
Planning - Biz Perspective
Continuous Capacity Planning is “like-liked” by Biz folk because:
When the business needs to adapt to change, there is little lost in
terms of detailed long-term planning.
As there is no need for detailed long-term planning, the business can
respond quickly to a rapidly changing environment.
The business can tweak the dials continuously, as long as work has
not begun, and as long as it doesn’t violate agile principles and values.
There is much more of a focus on real goals as opposed to achievement
of a plan (which means more value is generated for customers).
Long-term planning is a relatively easy exercise and the team isn’t
afraid of engaging in what-if scenarios.
Haters Gonna Hate
“All you’re doing is following a budgeting process!”
“This will never work with MBOs and stretch
goals!”
“Wait, so the team can just choose to not live up to
their commitments and push work? Now nothing
is going to get done!”
“How can I hold teams and individuals
accountable?”
Short-Term Planning
Culture of Fear
Absolute Requirement for Long-Term, Detailed
Plans “Backed By” Detailed Estimates
Commitment to a Fixed Time, Scope, and Cost
Violation of Agile Principles and Values
Continuous Capacity Planning
#Fail
Continuous Capacity
Planning - #WINNING
Fast / Low-Effort Long-Term and What-If Planning
Fast / Low-Effort Medium-Term Planning
Culture of Continuous Learning / Continuous
Improvement
Environment where “the business/customer” can
work honestly and directly with “the developers”
Culture Embraces Agile Principles and Values
-Helmuth von Moltke the Elder
“No plan survives contact with the enemy”
- Dwight D. Eisenhower
“Plans are useless, but planning is indispensable”
- Kert Peterson
“Agile is the Art of the Possible”
- Kert Peterson
“Agile is the Art of the Possible”
Matt Roberts
VP Product Development @Socialware
matt@matt-roberts.com | @MulticastMatt
linkedin.com/in/cpgmattr
Hope you “Like Liked” It!

Continuous Agile Planning That the Biz and Dev Folk can "Like Like"

  • 1.
    Continuous Agile PlanningThat the Biz and Dev Folk can “Like Like” Matt Roberts , VP Product Development @Socialware matt@matt-roberts.com | @MulticastMatt linkedin.com/in/cpgmattr
  • 2.
    Abstract: Many product developmentteams struggle through “painful” planning meetings. No one seems to enjoy them but they are deemed necessary for various reasons that all start off with good intentions and critical needs. They typically do not harness the power of being responsive to change and following YAGNI and delaying decision until the last responsible moment (i.e. more waste than the Austin Community Landfill). In this talk, Matt will provide an approach that he’s used for years to strike the delicate balance of building a product and development roadmap that can be used for long-term planning, medium-term planning, and being extremely responsive to change. It’s also respectful of the Agile Manifesto Principles and Values. This approach should make planning an easier, if not fun, for everyone from Developers to Product Managers to Executives.
  • 4.
    Planning - BizPerspective “I can’t get those guys to commit to anything” “Why can’t they just agree and move on?” “Why do we need to have all these meetings?” “We already have a date and scope, why bother?”
  • 5.
    Planning - DevPerspective “Planning sucks. Estimating sucks” “You hired me to write software, right?” “Yesterday, I spent the day in meetings, today, I’m going to spend the day in meetings. No blockers” “We already have a date and scope, why bother?” “Why do we need to have all these meetings?” “As a developer I want to pad my estimates excessively so when the requirements change, I won’t have to stay up all night”
  • 6.
    “Responding to changeover following a plan” “Welcome changing requirements, even late in development. Agile processes harness change for the customer's competitive advantage.” “Simplicity--the art of maximizing the amount of work not done--is essential.”
  • 7.
    The Goal Deliver thehighest quality value to the customer while maintaining worker safety. This is accomplished by harnessing ongoing change through continuous: Learning Planning Alignment Risk Reduction / Options
  • 8.
    Planning is theGateway Drug to Estimating What Who / Cost When?!?!?! Copyright 2003 Advanced Development Methods WASTE
  • 9.
    How do weachieve the goal?
  • 10.
    Long-Term Planning in ProductDevelopment Product Roadmap Product Portfolio Strategy “Long” Releases Funding (Start-up, New Line of Business, etc.) Build vs. buy More?
  • 11.
    Medium-Term Planning in ProductDevelopment Sprint Planning Small Release Planning Continuous Flow Backlog Prioritization Tasking out User Stories
  • 12.
    Short-Term Planning in ProductDevelopment Daily Stand-up P1 Issues / Critical Situations Pair Programming Unit Tests Coding Research Spikes
  • 13.
  • 14.
    Scrum Planning The Way it WasEnvisioned (unfortunately generally not practiced) Copyright 2003 Advanced Development Methods
  • 15.
  • 16.
    Kanban “Planning” No formalrelease planning process as the focus is on continuous release, but it can be done if needed (e.g. Scrumban) Measure “Lead Time” to determine the average time for a piece of work to flow through the system Cumulative flow identifies waste
  • 17.
    Continuous Capacity Planning Problem: Getting readyfor another six months of drawn-out planning for a period to cover a fiscal year that starts at the end of the six months of planning, I was looking for a better way to serve the needs of the business and the development team. Solution: Continuous Capacity Planning - A New Hope
  • 18.
  • 19.
    Capacity Planning Classify workin terms of: Product - User Facing: Themes, Epics, User Stories, Research Spikes, Innovation Inter-departmental - Support, Service, IT Internal: Infrastructure (SaaS), DevTools, Technical Debt, Defects, Research Spikes Measure all work - historical data from tracking software works great Involve a small (as responsible) set of the product development team Establish baseline plan with fixed capacities then adjust to meet the needs of the customers and team!
  • 20.
    Continuous Capacity Planning Tag allnew work coming into the product development system in terms of allocations type. Periodically check that capacity allocations are being maintained and update release plans, project plans, and product roadmaps. Allow the business to prioritize all work within capacity buckets that has not yet started, but try to stick to allocations. If allocations need to change, be explicit. More can be done in the same time quickly through elimination of waste or eventually with additional capacity.
  • 21.
  • 22.
    Continuous Capacity Planning ExamplePredict-ITis an Austin-based software company, delivering the most innovative value to customers operating large-scale data centers. They are planning a Q3 release to capture a specific market window, but don’t want to spend the time on a big up front planning exercise as everyone wants to get started. However, executives and product management need to understand what, who, and when, but want to be responsive to change. The example is about planning, not the choices that were made throughout the project (find improvements!) The “Feedback Cycle” approach could be for Scrum or Kanban/ Continuous Flow Systems. Assume that these are periodic investment checks for longer-term planning.
  • 23.
    Predict-IT Roadmap (v1) Q3Q4 Q1 Q2 Capacity Planner CIO IT Director HelpDesk Advisor Accountant Legal “On The Go Capacity Planner” Mobile Use Cases Advanced Virtualization Platforms Support for Amazon VPC, Azure, Rackspace Visible Infrastructure UI Viz. of Public and Private Cloud Integrated Dashboard Cost, SAL, Exceptions All in One User Experience Situational Awareness Configurable Notifications Situational Awareness On-The-Go Notifications across all mobile platforms with configurable escalation paths Fast Troubleshooting All tickets have env. info Third-Party Knowledge Base Integration into rich KB of possible fixes integrated into response system Regulatory Compliance Rules importable into predictive rules engine for workload assignment
  • 24.
    Release Planning “On TheGo Capacity Planner” 25% Visible Infra. 20% Sit. Aware- ness 10% SaaS Inf. 15% Tech. Debt/ Retro 20% Support 10% I II III IV V VI
  • 25.
    Predict-IT Roadmap (v1) Q3Q4 Q1 Q2 Capacity Planner CIO IT Director HelpDesk Advisor Accountant Legal “On The Go Capacity Planner” Mobile Use Cases Advanced Virtualization Platforms Support for Amazon VPC, Azure, Rackspace Visible Infrastructure UI Viz. of Public and Private Cloud Integrated Dashboard Cost, SAL, Exceptions All in One User Experience Situational Awareness Configurable Notifications Situational Awareness On-The-Go Notifications across all mobile platforms with configurable escalation paths Fast Troubleshooting All tickets have env. info Third-Party Knowledge Base Integration into rich KB of possible fixes integrated into response system Regulatory Compliance Rules importable into predictive rules engine for workload assignment I II III IV V VI
  • 26.
    Feedback Cycle PlanI - Hypothesis “On The Go Capacity Planner” 25% Visible Infra. 20% Sit. Aware- ness 10% SaaS Inf. 15% Tech. Debt/ Retro 20% Support 10% I User Story User Story User Story Defect Retro Spike Spike Support “On The Go Capacity Planner” Sum of Capacity (Story Points or #Items) = 30% Visible Infra. Sum of Capacity (Story Points or #Items) = 15% Sit. Awareness Sum of Capacity (Story Points or #Items) = 10% SaaS Inf Sum of Capacity (Story Points or #Items) = 15% Tech. Debt/Retro Sum of Capacity (Story Points or #Items) = 20% Support Sum of Capacity (Story Points or #Items) = 10
  • 27.
  • 28.
    Feedback Cycle PlanI - Result “On The Go Capacity Planner” 25% Visible Infra. 20% Sit. Aware- ness 10% SaaS Inf. 15% Tech. Debt/ Retro 20% Support 10% I User Story User Story User Story Defect Retro Spike Spike Support “On The Go Capacity Planner” Sum of Capacity (Story Points or #Items) = 20% 10% Under Visible Infra. Sum of Capacity (Story Points or #Items) = 0% 15% Under Sit. Awareness Sum of Capacity (Story Points or #Items) = 0% 10% Under SaaS Inf Sum of Capacity (Story Points or #Items) = 50% 35% Over Tech. Debt/Retro Sum of Capacity (Story Points or #Items) = 20% At Plan DoneDone Support Sum of Capacity (Story Points or #Items) = 10%
  • 29.
    Predict-IT Roadmap Q3 Q4Q1 Q2 Capacity Planner CIO IT Director HelpDesk Advisor Accountant Legal “On The Go Capacity Planner” Mobile Use Cases Advanced Virtualization Platforms Support for Amazon VPC, Azure, Rackspace Visible Infrastructure UI Viz. of Public and Private Cloud Integrated Dashboard Cost, SAL, Exceptions All in One User Experience Situational Awareness Configurable Notifications Situational Awareness On-The-Go Notifications across all mobile platforms with configurable escalation paths Fast Troubleshooting All tickets have env. info Third-Party Knowledge Base Integration into rich KB of possible fixes integrated into response system Regulatory Compliance Rules importable into predictive rules engine for workload assignment I II III IV V VI Risk - Didn’t Get Started Risk - Didn’t Get Started
  • 30.
    Feedback Cycle PlanII - Hypothesis “On The Go Capacity Planner” 20% Visible Infra. 20% Sit. Aware- ness 10% SaaS Inf. 15% Tech. Debt/ Retro 20% Support 10% II Defect Spike Support “On The Go Capacity Planner” Sum of Capacity (Story Points or #Items) = 20% Visible Infra. Sum of Capacity (Story Points or #Items) = 15% Sit. Awareness Sum of Capacity (Story Points or #Items) = 15% SaaS Inf Sum of Capacity (Story Points or #Items) = 25% Tech. Debt/Retro Sum of Capacity (Story Points or #Items) = 15% Support Sum of Capacity (Story Points or #Items) = 10% User Story User Story Spike User Story Defect
  • 31.
  • 32.
    Feedback Cycle PlanII - Result “On The Go Capacity Planner” 20% Visible Infra. 20% Sit. Aware- ness 10% SaaS Inf. 15% Tech. Debt/ Retro 20% Support 10% II Defect Spike Support “On The Go Capacity Planner” Sum of Capacity (Story Points or #Items) = 20% Visible Infra. Sum of Capacity (Story Points or #Items) = 15% Sit. Awareness Sum of Capacity (Story Points or #Items) = 5% 10% Under SaaS Inf Sum of Capacity (Story Points or #Items) = 35% 10% Over Tech. Debt/Retro Sum of Capacity (Story Points or #Items) = 15% Support Sum of Capacity (Story Points or #Items) = 10% User Story User Story Spike User Story Defect DoneDone
  • 33.
    Predict-IT Roadmap Q3 Q4Q1 Q2 Capacity Planner CIO IT Director HelpDesk Advisor Accountant Legal “On The Go Capacity Planner” Mobile Use Cases Advanced Virtualization Platforms Support for Amazon VPC, Azure, Rackspace Visible Infrastructure UI Viz. of Public and Private Cloud Integrated Dashboard Cost, SAL, Exceptions All in One User Experience Situational Awareness Configurable Notifications Situational Awareness On-The-Go Notifications across all mobile platforms with configurable escalation paths Fast Troubleshooting All tickets have env. info Third-Party Knowledge Base Integration into rich KB of possible fixes integrated into response system Regulatory Compliance Rules importable into predictive rules engine for workload assignment I II III IV V VI Ready to Release! New Feature Will Increase Sales 50%! “Fix SaaS Security Leak!” Risk - Not Really Started
  • 34.
    Feedback Cycle PlanIII - Hypothesis Visible Infra. 30% Sit. Aware- ness 10% SaaS Inf. 30% Tech. Debt/ Retro 20% Support 10% III Defect Support Visible Infra. Sum of Capacity (Story Points or #Items) = 30% Sit. Awareness Sum of Capacity (Story Points or #Items) = 10% SaaS Inf Sum of Capacity (Story Points or #Items) = 30% Tech. Debt/Retro Sum of Capacity (Story Points or #Items) = 20% Support Sum of Capacity (Story Points or #Items) = 10% Defect User Story Defect User Story User Story User Story Retro
  • 35.
  • 36.
    Feedback Cycle PlanIII - Result Visible Infra. 30% Sit. Aware- ness 10% SaaS Inf. 30% Tech. Debt/ Retro 20% Support 10% III Defect Support Visible Infra. Sum of Capacity (Story Points or #Items) = 30% Sit. Awareness Sum of Capacity (Story Points or #Items) = 0% 10% Under SaaS Inf Sum of Capacity (Story Points or #Items) = 25% 5% Under Tech. Debt/Retro Sum of Capacity (Story Points or #Items) = 25% 5% Over Support Sum of Capacity = 20% (10% Over) Defect User Story Defect User Story User Story User Story Retro DoneDone
  • 37.
    Predict-IT Roadmap Q3 Q4Q1 Q2 Capacity Planner CIO IT Director HelpDesk Advisor Accountant Legal “On The Go Capacity Planner” Mobile Use Cases Advanced Virtualization Platforms Support for Amazon VPC, Azure, Rackspace Visible Infrastructure UI Viz. of Public and Private Cloud Integrated Dashboard Cost, SAL, Exceptions All in One User Experience Situational Awareness Configurable Notifications Situational Awareness On-The-Go Notifications across all mobile platforms with configurable escalation paths Fast Troubleshooting All tickets have env. info Third-Party Knowledge Base Integration into rich KB of possible fixes integrated into response system Regulatory Compliance Rules importable into predictive rules engine for workload assignment I II III IV V VI Done New Feature Will Increase Sales 50%! Risk - No Progress
  • 38.
    Predict-IT Roadmap Q3 Q4Q1 Q2 Capacity Planner CIO IT Director HelpDesk Advisor Accountant Legal “On The Go Capacity Planner” Mobile Use Cases Advanced Virtualization Platforms Support for Amazon VPC, Azure, Rackspace Visible Infrastructure UI Viz. of Public and Private Cloud Integrated Dashboard Cost, SAL, Exceptions All in One User Experience Situational Awareness Configurable Notifications Situational Awareness On-The-Go Notifications across all mobile platforms with configurable escalation paths Fast Troubleshooting All tickets have env. info Third-Party Knowledge Base Integration into rich KB of possible fixes integrated into response system Regulatory Compliance Rules importable into predictive rules engine for workload assignment I II III IV V VI Done New Feature Will Increase Sales 50%! Do MVP Only for Q3 Remaining in Q4
  • 39.
    Feedback Cycle PlanIV - Hypothesis Visible Infra. 30% Sit. Aware- ness 15% SaaS Inf. 30% Tech. Debt/ Retro 20% Support 5% IV Defect Support Visible Infra. Sum of Capacity (Story Points or #Items) = 30% Sit. Awareness Sum of Capacity (Story Points or #Items) = 15% SaaS Inf Sum of Capacity (Story Points or #Items) = 30% Tech. Debt/Retro Sum of Capacity (Story Points or #Items) = 20% Support Sum of Capacity (Story Points or #Items) = 5% User Story Defect User Story User Story User Story Retro Defect
  • 40.
  • 41.
    Feedback Cycle PlanIV - Result Visible Infra. 30% Sit. Aware- ness 15% SaaS Inf. 30% Tech. Debt/ Retro 20% Support 5% IV Defect Support Visible Infra. Sum of Capacity (Story Points or #Items) = 30% Sit. Awareness Sum of Capacity (Story Points or #Items) = 15% SaaS Inf Sum of Capacity (Story Points or #Items) = 30% Tech. Debt/Retro Sum of Capacity (Story Points or #Items) = 20% Support Sum of Capacity = 0% (5% Under) User Story Defect User Story User Story User Story Retro Defect DoneDone
  • 42.
    Predict-IT Roadmap Q3 Q4Q1 Q2 Capacity Planner CIO IT Director HelpDesk Advisor Accountant Legal “On The Go Capacity Planner” Mobile Use Cases Advanced Virtualization Platforms Support for Amazon VPC, Azure, Rackspace Visible Infrastructure UI Viz. of Public and Private Cloud Integrated Dashboard Cost, SAL, Exceptions All in One User Experience Situational Awareness Configurable Notifications Situational Awareness On-The-Go Notifications across all mobile platforms with configurable escalation paths Fast Troubleshooting All tickets have env. info Third-Party Knowledge Base Integration into rich KB of possible fixes integrated into response system Regulatory Compliance Rules importable into predictive rules engine for workload assignment I II III IV V VI Done New Feature Will Increase Sales 50%! Do MVP Only for Q3 Remaining in Q4 “Solve Cust. Crit-Sit at all costs!!!!”
  • 43.
    Feedback Cycle PlanV - Hypothesis Visible Infra. 40% Sit. Aware- ness 15% SaaS Inf. 10% Tech. Debt/ Retro 20% Support 15% V Support Visible Infra. Sum of Capacity (Story Points or #Items) = 40% Sit. Awareness Sum of Capacity (Story Points or #Items) = 15% SaaS Inf Sum of Capacity (Story Points or #Items) = 10% Tech. Debt/Retro Sum of Capacity (Story Points or #Items) = 20% Support Sum of Capacity = 15% Defect User Story User Story User Story Retro Story User Story Story
  • 44.
  • 45.
    Feedback Cycle PlanV - Result Visible Infra. 40% Sit. Aware- ness 15% SaaS Inf. 10% Tech. Debt/ Retro 20% Support 15% V Support Visible Infra. Sum of Capacity (Story Points or #Items) = 40% Sit. Awareness Sum of Capacity (Story Points or #Items) = 0% 15% Under SaaS Inf Sum of Capacity (Story Points or #Items) = 0% 10% Under Tech. Debt/Retro Sum of Capacity (Story Points or #Items) = 0% 20% Under Support Sum of Capacity = 60% (45% Over) Defect User Story User Story User Story Retro Story User Story Story DoneDone
  • 46.
    Predict-IT Roadmap Q3 Q4Q1 Q2 Capacity Planner CIO IT Director HelpDesk Advisor Accountant Legal “On The Go Capacity Planner” Mobile Use Cases Advanced Virtualization Platforms Support for Amazon VPC, Azure, Rackspace Visible Infrastructure UI Viz. of Public and Private Cloud Integrated Dashboard Cost, SAL, Exceptions All in One User Experience Situational Awareness Configurable Notifications Situational Awareness On-The-Go Notifications across all mobile platforms with configurable escalation paths Fast Troubleshooting All tickets have env. info Third-Party Knowledge Base Integration into rich KB of possible fixes integrated into response system Regulatory Compliance Rules importable into predictive rules engine for workload assignment I II III IV V VI Done Done Pull from release
  • 47.
    Predict-IT Roadmap Q3 Q4Q1 Q2 Capacity Planner CIO IT Director HelpDesk Advisor Accountant Legal “On The Go Capacity Planner” Mobile Use Cases Advanced Virtualization Platforms Support for Amazon VPC, Azure, Rackspace Visible Infrastructure UI Viz. of Public and Private Cloud Integrated Dashboard Cost, SAL, Exceptions All in One User Experience Situational Awareness Configurable Notifications Situational Awareness On-The-Go Notifications across all mobile platforms with configurable escalation paths Fast Troubleshooting All tickets have env. info Third-Party Knowledge Base Integration into rich KB of possible fixes integrated into response system Regulatory Compliance Rules importable into predictive rules engine for workload assignment I II III IV V VI Done Done “Quality Release!”
  • 48.
    Feedback Cycle PlanVI - Hypothesis SaaS Inf. 50% Tech. Debt/ Retro 25% Support 25% V SaaS Inf Sum of Capacity (Story Points or #Items) = 50% Tech. Debt/Retro Sum of Capacity (Story Points or #Items) = 25% Support Sum of Capacity = 25% User Story Defect Defect Support Defect Retro User Story Retro
  • 49.
  • 50.
    Feedback Cycle PlanVI - Result SaaS Inf. 50% Tech. Debt/ Retro 25% Support 25% V SaaS Inf Sum of Capacity (Story Points or #Items) = 30% 20% Under Tech. Debt/Retro Sum of Capacity (Story Points or #Items) = 25% Support Sum of Capacity = 25% User Story Defect Defect Support Defect Retro User Story Retro DoneDone NEW - All Hand’s Sales Demo 20%
  • 51.
    Predict-IT Roadmap Q3 Q4Q1 Q2 Capacity Planner CIO IT Director HelpDesk Advisor Accountant Legal “On The Go Capacity Planner” Mobile Use Cases Advanced Virtualization Platforms Support for Amazon VPC, Azure, Rackspace Visible Infrastructure UI Viz. of Public and Private Cloud Integrated Dashboard Cost, SAL, Exceptions All in One User Experience Situational Awareness Configurable Notifications Situational Awareness On-The-Go Notifications across all mobile platforms with configurable escalation paths Fast Troubleshooting All tickets have env. info Third-Party Knowledge Base Integration into rich KB of possible fixes integrated into response system Regulatory Compliance Rules importable into predictive rules engine for workload assignment I II III IV V VI Done Done, GOT THE DEAL! NICE JOB ALL! MISSION ACCOMPLISHED!
  • 52.
    Continuous Capacity Planning -Dev Perspective Continuous Capacity Planning is “like-liked” by Developers because: Detailed external estimation is unnecessary for long-term and short-term planning. The team has greater levels of autonomy based on the feedback cycle plan coupled with the release goals. There is less of a focus on accountability, and more on alignment and prioritized goal achievement. They do not bear the burden of change, indeed, everyone is continuously learning and adapting together. There is more visibility across the organization of the real current state.
  • 53.
    Continuous Capacity Planning -Biz Perspective Continuous Capacity Planning is “like-liked” by Biz folk because: When the business needs to adapt to change, there is little lost in terms of detailed long-term planning. As there is no need for detailed long-term planning, the business can respond quickly to a rapidly changing environment. The business can tweak the dials continuously, as long as work has not begun, and as long as it doesn’t violate agile principles and values. There is much more of a focus on real goals as opposed to achievement of a plan (which means more value is generated for customers). Long-term planning is a relatively easy exercise and the team isn’t afraid of engaging in what-if scenarios.
  • 54.
    Haters Gonna Hate “Allyou’re doing is following a budgeting process!” “This will never work with MBOs and stretch goals!” “Wait, so the team can just choose to not live up to their commitments and push work? Now nothing is going to get done!” “How can I hold teams and individuals accountable?”
  • 55.
    Short-Term Planning Culture ofFear Absolute Requirement for Long-Term, Detailed Plans “Backed By” Detailed Estimates Commitment to a Fixed Time, Scope, and Cost Violation of Agile Principles and Values Continuous Capacity Planning #Fail
  • 56.
    Continuous Capacity Planning -#WINNING Fast / Low-Effort Long-Term and What-If Planning Fast / Low-Effort Medium-Term Planning Culture of Continuous Learning / Continuous Improvement Environment where “the business/customer” can work honestly and directly with “the developers” Culture Embraces Agile Principles and Values
  • 57.
    -Helmuth von Moltkethe Elder “No plan survives contact with the enemy”
  • 58.
    - Dwight D.Eisenhower “Plans are useless, but planning is indispensable”
  • 59.
    - Kert Peterson “Agileis the Art of the Possible” - Kert Peterson “Agile is the Art of the Possible”
  • 60.
    Matt Roberts VP ProductDevelopment @Socialware matt@matt-roberts.com | @MulticastMatt linkedin.com/in/cpgmattr Hope you “Like Liked” It!