SlideShare a Scribd company logo
1 of 6
Download to read offline
Indian Journal of Agricultural Sciences 90 (8): 1593–8, August 2020/Article
Consumption pattern of selected vegetables at five sites in
Delhi NCR region
Sandeep Kumar1*, Shiv Prasad2, Manoj Shrivastava3, Sushil K Kharia4
and Gulshan K Sharma5
ICAR-Indian Agricultural Research Institute, New Delhi 110  012, India
Received: 14 November 2019; Accepted: 12 December 2019
ABSTRACT
In the present study, an investigation was carried out to analyze vegetable consumption rates by the comprehensive
survey at five selected sites (Alipur, Shahdara, Kanjhawala, Mehrauli, and Najafgarh) in Delhi NCR region.Six
vegetables, i.e., potato, carrot, tomato, spinach, mustard, and okra mostly cultivated in the peri-urban areas, data were
collected from each site of 25 families. Results indicated that the gross per capita per day vegetable consumption was
highest at Shahdara (0.314 kg/capita/day), followed by Najafgarh (0.307 kg/capita/day).It was also observed that the
per capita per day consumption of vegetables was highest mostly in the case of potato followed by tomato.Tomato
was the second-highest utilized vegetable at most of the selected sites. While mustard was consumed lowest at most
of the sites except Mehrauli. It was also observed that in selected vegetables, the consumption of root vegetables was
higher as compared to other vegetables.
Key words: Consumption, Delhi, Per capita, Survey, Vegetables, Weight
Nutrition is a fundamental human requirement and
a prerequisite to a healthy lifestyle. A balanced diet is
essential from the very early stages of life for proper growth,
development, and to remain active. The consumption
of food, which largely depends on production, delivery,
manages the health and nutritional status of the consumers.
The recommended dietary allowances (RDA) guidelines
are nutrient-centered and technical in nature. Aside from
providing nutrients, vegetable provides a host of other
elements which have a positive influence on health. Since the
population consumes food, it is essential to support nutrition
in terms of foods rather than nutrients. The primary sources
of heavy metal contamination are industrialization, mining,
milling, fossil fuel burning, agrochemicals that discharge a
variety metals such as As, Cr, Hg, Cd, Cu, Ni, Co, Zn and
Pb into the agricultural soils and water bodies (Kumar et
al. 2019; Gupta et al. 2018).
Vegetables are mostly cultivated in the peri-urban areas
to fulfill the booming demand in time. The sufficient supply
of irrigation water to these vegetables is a challenging task
1Scientist and Corresponding author (sandeep2011iari@gmail.
com); 2Principal Scientist (shiv_drprasad@yahoo.co.in); 3Principal
Scientist, ICAR-IARI, New Delhi (manojshrivastava31@gmail.
com); 4Assistant Professor, College of Agriculture, SKRAU,
Bikaner (pausushil@gmail.com); 5Scientist, ICAR-NBSS & LUP,
Regional Centre, Jorhat,Assam (gulshansharma2222@gmail.com).
in the present time around the cities. Therefore, this booming
demand compensates by applying the sewage wastewater
originated from a nearby polluting source. The wastewater
discharged from industries, and commercial activities is
laden with heavy metals. Vegetables are essential eating
routine used by populations all through the world, being
wellsprings of fundamental nutrients, antioxidants agents,
and metabolites (Shakya and Khwaounjoo 2013). Vegetables
being the carrier of metals, when used up by human beings,
get ingested into the human body. Toxic metals can be
unusually threatening to the human body, even at low levels,
as there is no compelling excretion device (Ghosh et al.
2012; Maurya et al. 2019). Therefore, these toxic metals
are dangerous for human health and cause several problems
such as cancer, liver, heart, hepatic damaging, renal system
damaging, mental retardation, CNS breakdown, looseness
of the bowels, hookworm disease and degeneration of basal
ganglia of brain and liver (Misra and Dinesh 1991).
All the vegetables and fruits are rich reservoirs of
micronutrients and macronutrients. The main micronutrients
presentaremineralsandvitamins,whereasthemacronutrients
present are combined carbohydrates and fibers. They hold
sufficient quantities of iron, calcium, vitamin C, folic acid,
carotenoids, and phytochemicals. Many vegetables give
meager calories, whereas others such as potato, sweet potato,
tapioca, and yam are rich in starch. Hence, vegetables can
be utilized to improve or reduce calories in our daily diet
and maintain the health of consumers.
Vegetables are an essential part of the human diet due
229
1594 [Indian Journal of Agricultural Sciences 90 (8)
to the richness of beneficial and essential minerals and
nutrients (Nankishore 2014).
The Expert Committee (EC) of the Indian Council of
Medical Research (ICMR), taking into attention the nutrient
requirements, has recommended that each individual per
day should consume at least 300 g of vegetables (including
green leafy vegetables: 50 g; other vegetables: 200 g; roots
and tubers: 50 g). As the necessities of iron and folic acid
are essential for pregnant women, they should consume at
least 100g of leafy vegetables per day. Total production
of vegetables is about 30% less than the demand of 100
million tonnes (Mukherjee et al. 2016). The toxic metals
have the tendency of accumulating in the vegetables and,
ultimately via food chain enter into humans. The amount
of vegetables enter into the human body mainly depends
on the quantity and types of vegetables consumed per day,
type of irrigation source, area of production, and age group
of consumers (Kumar et al. 2019).
Unfortunately, vegetables can uptake and accumulate
toxic metals beyond recommended limits in their entire
body, including both edible and inedible parts (Tasrina
et al. 2015). In the last decade, the level of heavy metals
in vegetables (leafy, root, and fruit) has been observed
at high levels (Wai et al. 2017). Ultimately, the build-up
of toxic metals in vegetables and edible parts of crops in
contaminated soils is a matter of grave concern due to the
harmful and irreversible effects of metals impacting the
human's health (Malik 2004).
MARTIALS AND METHODS
Sampling location and demography
Delhi city is resided in Northern India, at 28.7041°N
77.1025°E with 216m elevation. It is surrounded by Uttar
Pradesh (Gautam Budh Nagar, Ghaziabad, and Baghpat) and
by Haryana (Gurugram, Faridabad, Jhajjar, and Sonipat) on
three sides. The NCR Delhi covers an area of 1484 km2,
of which 783 km2 is a rural area and 700 km2 urban area.
According to the 2011 census, the population of Delhi's city
was over 11 million. The river Yamuna was the historical
boundary between Punjab and UP, and its flood plains
provide fertile alluvial soil suitable for agriculture but are
prone to intermittent floods.
Delhi has a dry-winter humid subtropical climate,
including a hot semi-arid climate. Temperatures range from
2 to 47°C with average annual rainfall is around 886mm,
which most of which falls during the monsoon season
(July-August) (ESD 2006).
Sampling sites
In Delhi NCR, 5 sampling sites were selected for
conducted present study . All the information about the
sites were given in Table 1.
Sampling procedure
The data collection sheets were prepared by using
standard parameters required for the assessment of the
toxicity of metal. Families were randomly selected. Data
were collected using standardized questionnaires by face
to face interactions at the time of sampling for each
site in the city of Delhi (INDDEX Project 2018). The
questionnaire requested self-reported information regarding
sociodemographic characteristics, types of consumers,
number of family members, number of vegetable consumers,
age group, types of vegetables consuming, dietary patterns,
and weight. Additionally, some other information also
collected like male: female ratio in family and disease
regarding information (Krebs-Smith et al. 1995). A total of
125 families were surveyed, 25 at each location including
455 members during 2017-18 and 2018-19 (Table 2).
Vegetables selected
For the present study, 6 vegetables of different
categories such as leafy, root, and shoot were collected
from selected sites (Table 3). The consumption pattern of
230
Table 1	 Sampling sites with their latitude, longitude, and altitude
Site District of Delhi Latitude Longitude Altitude
Alipur North West 28.797460 77.132991 214.4 m
Kanjhawala North West 28.735456 77.002011 213.9 m
Najafgarh South West 28.611856 76.981354 219.0 m
Mehrauli South West 28.521586 77.179149 260.8 m
Shahdara North East 28.700868 77.289846 207.0 m
Table 2	 Number of families, family members and vegetable
consumers at selected sites
Site No. of family
surveyed
No. of
members
Vegetable
consumers
Alipur 25 103 92
Kanjhawala 25 92 82
Najafgarh 25 99 97
Mehrauli 25 90 85
Shahdara 25 71 70
Total 125 455 426
Table 3  Selected vegetables and their category
Vegetable Botanical name Family Category Sampling
season
Potato Solanum
tuberosum L.
Solanaceae Root Winter
Carrot Daucus carota
L.
Apiaceae Root Winter
Tomato Solanum
lycopersicum L.
Solanaceae Fruit Winter
Okra Abelmoschus
esculentus L.
Malvaceae Fruit Summer
Spinach Spinacia
oleracea L.
Chenopodiaceae Leafy Winter
Mustard Brassica juncea
L.
Brassicaceae Leafy Winter
Kumar et al
1595August 2020] Consumption pattern of selected vegetables
these vegetables was surveyed and found per day per capita
consumption.
RESULTS AND DISCUSSION
The vegetable consumption data were collected from
all the five selected sites in the Delhi region, i.e. Alipur,
Shahdara, Mehrauli, Kanjhawala and Najafgarh. From each
site 25 families were selected randomly to collect data.
In Alipur, data of 103 individuals were collected from 25
families regarding total vegetable consumption per week,
total number of consumers, and non-consumers. In Alipur,
the total vegetable consumption per week was 41 kg, 22 kg,
38.5 kg, 22.5 kg, 29 kg, and 20 kg of potato, okra, tomato,
spinach, carrot, and mustard respectively.The per capita per
day consumption of leafy vegetable (mustard) is lowest (39g/
day) and of root vegetable (potato) is highest (64g) at this
site. At Alipur, the per day per capita consumption rate of
vegetables is potato > tomato > carrot > okra = spinach =
mustard (Table 4).
From each site, 25 families were selected randomly
to collect data. In Shahdara, data of 92 individuals were
collected from 25 families regarding total vegetable
consumption per week, the total number of consumers and
non-consumers.InShahdara,thetotalvegetableconsumption
per week was 33 kg, 31.7 kg, 32.5 kg, 33.3 kg, 35 kg, and
27.8 kg of potato, okra, tomato, spinach, carrot, and mustard
respectively. The per capita per day consumption of leafy
vegetable (mustard) is lowest (48g/day) and of root vegetable
(potato) is highest (57g) at this site.At Shahdara, the per day
per capita consumption rate of vegetables is potato > carrot
> spinach> okra = tomato > mustard (Table 5).
From each site, 25 families were selected randomly
to collect data. In Mehrauli, data of 99 individuals were
collected from 25 families regarding total vegetable
consumption per week, the total number of consumers
and non-consumers. In Mehrauli, the total vegetable
consumption per week was 36 kg, 36 kg, 38.5 kg, 28.5
kg, 26.3 kg, and 22 kg of potato, okra, tomato, spinach,
carrot, and mustard respectively. The lowest and highest per
capita per day consumption was found in the case of root
vegetable (carrot) 41g/day and in fruit vegetable (tomato)
57g, respectively at this site. At Mehrauli, the per day per
capita consumption rate of vegetables is tomato > potato >
okra > mustard > spinach > carrot (Table 6).
From each site, 25 families were selected randomly
to collect data. In Kanjhawala, data of 90 individuals
were collected from 25 families regarding total vegetable
consumption per week, the total number of consumers
and non-consumers. In Kanjhawala, the total vegetable
consumption per week was 39 kg, 35.5 kg, 31.5 kg, 26
kg, 28.5 kg, and 18 kg of potato, okra, tomato, spinach,
carrot, and mustard respectively. The lowest and highest per
capita per day consumption was found in the case of leafy
vegetable (mustard) 34 g/day and in root vegetable (potato)
66 g, respectively, at this site. At Kanjhawala, the per day
per capita consumption rate of vegetables is potato>okra >
Table 4 Vegetable consumption at Alipur
Parameter Unit Potato Okra Tomato Spinach Carrot Mustard
Total no. of family surveyed - 25 25 25 25 25 25
Quantity of 6 vegetables consumption kg/week/25 families 41 22 38.5 22.5 29 20
Total number of consumers Per 25 families 103 103 103 103 103 103
Number of non-vegetable consumers Out of 103 11 22 0 20 11 30
Net vegetable consumers - 92 81 103 83 92 73
Per capita consumption/week kg 0.446 0.272 0.374 0.271 0.315 0.274
Per capita consumption/day kg 0.064 0.039 0.053 0.039 0.045 0.039
Mean consumption kg/week/25 families 1.64 0.88 1.54 0.90 1.16 0.80
SD 0.98 0.60 0.43 0.74 1.01 1.08
Table 5 Vegetable consumption at Shahdara
Parameter Unit Potato Okra Tomato Spinach Carrot Mustard
Total no. of family surveyed - 25 25 25 25 25 25
Quantity of 6 vegetables consumption kg/week/25 families 33 31.75 32.5 33.25 35 27.75
Total number of consumers Per 25 families 92 92 92 92 92 92
Number of non-vegetable consumers Out of 103 10 2 0 3 0 9
Net vegetable consumers - 82 90 92 89 92 83
Per capita/week kg 0.402 0.353 0.353 0.374 0.380 0.334
Per capita/day kg 0.057 0.050 0.050 0.053 0.054 0.048
Mean consumption kg/week/25 families 1.32 1.27 1.30 1.33 1.40 1.11
SD 0.66 0.65 0.54 0.66 0.54 0.79
231
1596 [Indian Journal of Agricultural Sciences 90 (8)
Table 7  Vegetable consumption at Kanjhawala
Parameter Unit Potato Okra Tomato Spinach Carrot Mustard
Total no. of family surveyed - 25 25 25 25 25 25
Quantity of 6 vegetables consumption kg/week/25 families 39 35.5 31.5 26 28.5 18
Total number of consumers Per 25 families 90 90 90 90 90 90
Number of non-vegetable consumers Out of 103 5 3 0 2 6 15
Net vegetable consumers - 85 87 90 88 84 75
Per capita/week kg 0.459 0.408 0.350 0.295 0.339 0.240
Per capita/day kg 0.066 0.058 0.050 0.042 0.048 0.034
Mean consumption kg/week/25 families 1.56 1.42 1.26 1.04 1.14 0.72
SD 0.68 0.73 0.48 0.32 0.57 0.52
Table 8  Vegetables consumption at Najafgarh
Parameter Unit Potato Okra Tomato Spinach Carrot Mustard
Total no. of family surveyed - 25 25 25 25 25 25
Quantity of 6 vegetables consumption kg/week/25 families 32.5 23.75 25 20.75 29.5 4.75
Total number of consumers Per 25 families 71 71 71 71 71 71
Number of non-vegetable consumers Out of 103 1 5 4 3 2 49
Net vegetable consumers - 70 66 67 68 69 22
Per capita/week kg 0.464 0.360 0.373 0.305 0.428 0.216
Per capita/day kg 0.066 0.051 0.053 0.044 0.061 0.031
Mean consumption kg/week/25 families 1.30 0.95 1.00 0.83 1.18 0.19
SD 0.61 0.64 0.32 0.50 0.72 0.32
Table 6  Vegetables consumption at Mehrauli
Parameter Unit Potato Okra Tomato Spinach Carrot Mustard
Total no. of family surveyed - 25 25 25 25 25 25
Quantity of 6 vegetables consumption kg/week/25 families 36 36 38.5 28.5 26.25 22
Total number of consumers Per 25 families 99 99 99 99 99 99
Number of non-vegetable consumers Out of 103 2 0 0 2 8 33
Net vegetable consumers - 97 99 99 97 91 66
Per capita/week kg 0.371 0.364 0.389 0.294 0.288 0.333
Per capita/day kg 0.053 0.052 0.056 0.042 0.041 0.048
Mean consumption kg/week/25 families 1.44 1.44 1.54 1.14 1.05 0.88
SD 0.62 0.99 0.45 0.65 0.65 0.89
Per capita per day consumption rate of selected
vegetables was observed highest in the case of potato
at all the sites except Mehrauli, where the tomato was
consumed in higher amount (Fig 1).Tomato was second
highest consumed vegetable at most of the sites. Mustard
was consumed lowest at most of the sites except Mehrauli.
The consumption order of selected vegetables given in Table
9. In selected vegetables, we observed that consumption of
root vegetables especially potato was higher as compared
to other vegetables. The consumption pattern of vegetables
determines the risk assessment in further studies of heavy
metals analysis. The type of vegetables consumption pattern
also determines the requirement or demand some specific
vegetables in particular are.
tomato>carrot > spinach > mustard (Table 7).
From each site, 25 families were selected randomly
to collect data. In Najafgarh, data of 71 individuals were
collected from 25 families regarding total vegetable
consumption per week, the total number of consumers
and non-consumers. In Najafgarh, the total vegetable
consumption per week was 32.5 kg, 23.7 kg, 25 kg, 20.7
kg, 29.5 kg, and 4.75 kg of potato, okra, tomato, spinach,
carrot, and mustard respectively. The lowest and highest per
capita per day consumption was found in the case of leafy
vegetable (mustard) 31 g/day and in root vegetable (potato)
66 g, respectively at this site. At Najafgarh, the per day per
capita consumption rate of vegetables is potato >carrot >
tomato >okra > spinach > mustard (Table 8).
232
Kumar et al
1597August 2020]
Acknowledgments
The authors are grateful to the Post Graduate School
and Director, Indian Agricultural Research Institute, New
Delhi, India, for providing all the support and facilities. We
are also thankful to the Centre for Environment Science
and Climate Resilient Agriculture (CESCRA), Indian
Agricultural Research Institute, New Delhi, for providing
necessary facilities for undertaking this study.
REFERENCES
ESD (Economic Survey of Delhi). 2005-2006. Planning
Table 9	 Consumption order of vegetables at selected sites (kg/
capita/day)
Site *Per capita per
day consumption
(kg)
Consumption order
(kg/capita/day)
Alipur 0.279 Potato > Tomato > Carrot > Okra
= Spinach = Mustard
Shahdara 0.314 Potato > Carrot > Spinach > Okra
= Tomato > Mustard
Mehrauli 0.291 Tomato > Potato > Okra >
Mustard > Spinach > Carrot
Kanjhawala 0.299 Potato > Okra > Tomato > Carrot
> Spinach > Mustard
Najafgarh 0.307 Potato > Carrot > Tomato > Okra
> Spinach > Mustard
  *This is the total amount of 6 selected vegetables consumed
per capitaper day.
Fig 1	 Per capita per day consumption rate of selected vegetables.
0.00
0.01
0.02
0.03
0.04
0.05
0.06
0.07
0.08
Potato Okra Tomato Palak Carrot Mustard
Vegetablesconsumption(kg/day)
Per capita per day consumption (kg/capta/day)
Alipur Shahdara Mehrauli Kanjhawala Najafgarh
Department, Government of National Capital Territory of
Delhi, pp 1-7.
Ghosh A K, Bhatt M A, Agrawal H P. 2012. Effect of long-
term application of treated sewage water on heavy metal
accumulation in vegetables grown in Northern India.
Environmental Monitoring and Assessment 184: 1025–36.
Gupta N,Yadav K K, Kumar V, Kumar S, Chadd R Pand KumarA.
2018. Trace elements in soil-vegetables interface: translocation,
bioaccumulation, toxicity and amelioration-a review. Science
of the Total Environmen 651(2): 2927–42.
INDDEX Project. 2018. Data4Diets: Building Blocks for Diet-
related Food Security Analysis. Tufts University, Boston, MA.
https://inddex.nutrition.tufts.edu/data4diets. Accessed on 21
October 2019.
Krebs-Smith S M, Heimendinger J, Subar A F, Patterson B H
and Pivonka E. 1995. Using food frequency questionnaires to
estimate fruit and vegetable intake: association between the
number of questions and total intakes. Journal of Nutrition
Education 27(2): 80–85.
Kumar S, Prasad,S, Yadav K K, Shrivastava M, Gupta N, Nagar
S, Bach Q V, Kamyab H, Khan S A, Yadav S and Malav L C.
2019. Hazardous heavy metals contamination of vegetables
and food chain: Role of sustainable remediation approaches-A
review. Environmental Research 108792.
Malik A. 2004. Metal bioremediation through growing cells.
Environmental International 30: 261–78.
Maurya P K, Malik D S, Yadav K K, Kumar A, Kumar S
and Kamyab H. 2019. Bioaccumulation and potential
sources of heavy metal contamination in fish species in
River Ganga basin: Possible human health risks evaluation.
Toxicology reports.
Misra S G and Dinesh D. 1991. Soil Pollution. Ashing Publishing
House, New Delhi.
233
Consumption pattern of selected vegetables
1598 [Indian Journal of Agricultural Sciences 90 (8)
Mukherjee A, Dutta Sand Goyal T M. 2016. India’s Phytonutrient
Report. New Delhi: Academic Foundation.
Nankishore A. 2014. Heavy metal levels in leafy vegetables from
selected markets in Guyana. Journal of Agricultural Technology
10: 651–63.
Shakya P R and Khwaounjoo N M. 2013. Heavy metal
contamination in green leafy vegetables collected from different
market sites of Kathmandu and their associated health risks.
Scientific World 11(11): 37–42.
Tasrina R C, Rowshon A, Mustafizur A M R, Rafiqul I, Ali M P.
2015. Heavy metals contamination in vegetables and its growing
soil. Journal of Environmental Analytical Chemistry 2: 142.
Wai K M, Dai J, Yu P K N, Zhou X, Wong C M S. 2017. Public
health risk of mercury in China through consumption of
vegetables, a modelling study. Environmental Research 159:
152–57.
234
Kumar et al

More Related Content

What's hot

Environmental Impact of the US Food System
Environmental Impact of the US Food SystemEnvironmental Impact of the US Food System
Environmental Impact of the US Food Systemrobabrams
 
Living conditions of the climate migrant in urban slams implication for the f...
Living conditions of the climate migrant in urban slams implication for the f...Living conditions of the climate migrant in urban slams implication for the f...
Living conditions of the climate migrant in urban slams implication for the f...Karisma Amjad
 
First record of the Pacific bluefin tuna Thunnus orientalis (Temminck & Schle...
First record of the Pacific bluefin tuna Thunnus orientalis (Temminck & Schle...First record of the Pacific bluefin tuna Thunnus orientalis (Temminck & Schle...
First record of the Pacific bluefin tuna Thunnus orientalis (Temminck & Schle...IJEAB
 
The Impact of Climate Change on Agriculture and Health Sectors in Tanzania: A...
The Impact of Climate Change on Agriculture and Health Sectors in Tanzania: A...The Impact of Climate Change on Agriculture and Health Sectors in Tanzania: A...
The Impact of Climate Change on Agriculture and Health Sectors in Tanzania: A...IJEAB
 
Hydroponics – An Overview
Hydroponics – An Overview Hydroponics – An Overview
Hydroponics – An Overview UditDebangshi
 
Impacts of Climate Change on Crop Production in Bangladesh: A Review
Impacts of Climate Change on Crop Production in Bangladesh: A ReviewImpacts of Climate Change on Crop Production in Bangladesh: A Review
Impacts of Climate Change on Crop Production in Bangladesh: A ReviewJournal of Agriculture and Crops
 
Consumption Pattern and Promotion of Green Leafy Vegetables’ Intake among Ado...
Consumption Pattern and Promotion of Green Leafy Vegetables’ Intake among Ado...Consumption Pattern and Promotion of Green Leafy Vegetables’ Intake among Ado...
Consumption Pattern and Promotion of Green Leafy Vegetables’ Intake among Ado...paperpublications3
 
Insights of Agrarian anthropology Conference 2017
Insights of Agrarian anthropology Conference 2017Insights of Agrarian anthropology Conference 2017
Insights of Agrarian anthropology Conference 2017Ruby Med Plus
 
Climate changes and food security in India
Climate changes and food security in IndiaClimate changes and food security in India
Climate changes and food security in IndiaSindhu Ravichandran
 
Food Security in a changing Climate
Food Security in a changing ClimateFood Security in a changing Climate
Food Security in a changing ClimateM'VITA D M'BAMBI
 
Meat consumption, health, and the environment.
Meat consumption, health, and the environment.Meat consumption, health, and the environment.
Meat consumption, health, and the environment.HatemBOUBLAT
 
Impact of agro-ecosystem on risk management in agriculture in some selected a...
Impact of agro-ecosystem on risk management in agriculture in some selected a...Impact of agro-ecosystem on risk management in agriculture in some selected a...
Impact of agro-ecosystem on risk management in agriculture in some selected a...Premier Publishers
 
Food security of women farmers: the impact of climate change
Food security of women farmers: the impact of climate changeFood security of women farmers: the impact of climate change
Food security of women farmers: the impact of climate changeWOREC Nepal
 
Effect of plant density and weeding regime on population and severity of aphi...
Effect of plant density and weeding regime on population and severity of aphi...Effect of plant density and weeding regime on population and severity of aphi...
Effect of plant density and weeding regime on population and severity of aphi...Sheku kanteh
 
Rooftop farming an overview
Rooftop farming an overview Rooftop farming an overview
Rooftop farming an overview UditDebangshi
 
Impact Assessment of Agroforestry Practices on Community Socio-Economic Livel...
Impact Assessment of Agroforestry Practices on Community Socio-Economic Livel...Impact Assessment of Agroforestry Practices on Community Socio-Economic Livel...
Impact Assessment of Agroforestry Practices on Community Socio-Economic Livel...Agriculture Journal IJOEAR
 
11.population growth and sustainable land management in india
11.population growth and sustainable land management in india11.population growth and sustainable land management in india
11.population growth and sustainable land management in indiaAlexander Decker
 

What's hot (20)

2. 15 30
2. 15 302. 15 30
2. 15 30
 
Environmental Impact of the US Food System
Environmental Impact of the US Food SystemEnvironmental Impact of the US Food System
Environmental Impact of the US Food System
 
Living conditions of the climate migrant in urban slams implication for the f...
Living conditions of the climate migrant in urban slams implication for the f...Living conditions of the climate migrant in urban slams implication for the f...
Living conditions of the climate migrant in urban slams implication for the f...
 
First record of the Pacific bluefin tuna Thunnus orientalis (Temminck & Schle...
First record of the Pacific bluefin tuna Thunnus orientalis (Temminck & Schle...First record of the Pacific bluefin tuna Thunnus orientalis (Temminck & Schle...
First record of the Pacific bluefin tuna Thunnus orientalis (Temminck & Schle...
 
The Impact of Climate Change on Agriculture and Health Sectors in Tanzania: A...
The Impact of Climate Change on Agriculture and Health Sectors in Tanzania: A...The Impact of Climate Change on Agriculture and Health Sectors in Tanzania: A...
The Impact of Climate Change on Agriculture and Health Sectors in Tanzania: A...
 
Hydroponics – An Overview
Hydroponics – An Overview Hydroponics – An Overview
Hydroponics – An Overview
 
Impacts of Climate Change on Crop Production in Bangladesh: A Review
Impacts of Climate Change on Crop Production in Bangladesh: A ReviewImpacts of Climate Change on Crop Production in Bangladesh: A Review
Impacts of Climate Change on Crop Production in Bangladesh: A Review
 
Consumption Pattern and Promotion of Green Leafy Vegetables’ Intake among Ado...
Consumption Pattern and Promotion of Green Leafy Vegetables’ Intake among Ado...Consumption Pattern and Promotion of Green Leafy Vegetables’ Intake among Ado...
Consumption Pattern and Promotion of Green Leafy Vegetables’ Intake among Ado...
 
Insights of Agrarian anthropology Conference 2017
Insights of Agrarian anthropology Conference 2017Insights of Agrarian anthropology Conference 2017
Insights of Agrarian anthropology Conference 2017
 
Climate changes and food security in India
Climate changes and food security in IndiaClimate changes and food security in India
Climate changes and food security in India
 
Food Security in a changing Climate
Food Security in a changing ClimateFood Security in a changing Climate
Food Security in a changing Climate
 
Meat consumption, health, and the environment.
Meat consumption, health, and the environment.Meat consumption, health, and the environment.
Meat consumption, health, and the environment.
 
CITATIONS-HortFlora Res. Spectrum 2012
CITATIONS-HortFlora Res. Spectrum 2012CITATIONS-HortFlora Res. Spectrum 2012
CITATIONS-HortFlora Res. Spectrum 2012
 
Citations: HortFlora Res. Spectrum 2012
Citations: HortFlora Res. Spectrum 2012Citations: HortFlora Res. Spectrum 2012
Citations: HortFlora Res. Spectrum 2012
 
Impact of agro-ecosystem on risk management in agriculture in some selected a...
Impact of agro-ecosystem on risk management in agriculture in some selected a...Impact of agro-ecosystem on risk management in agriculture in some selected a...
Impact of agro-ecosystem on risk management in agriculture in some selected a...
 
Food security of women farmers: the impact of climate change
Food security of women farmers: the impact of climate changeFood security of women farmers: the impact of climate change
Food security of women farmers: the impact of climate change
 
Effect of plant density and weeding regime on population and severity of aphi...
Effect of plant density and weeding regime on population and severity of aphi...Effect of plant density and weeding regime on population and severity of aphi...
Effect of plant density and weeding regime on population and severity of aphi...
 
Rooftop farming an overview
Rooftop farming an overview Rooftop farming an overview
Rooftop farming an overview
 
Impact Assessment of Agroforestry Practices on Community Socio-Economic Livel...
Impact Assessment of Agroforestry Practices on Community Socio-Economic Livel...Impact Assessment of Agroforestry Practices on Community Socio-Economic Livel...
Impact Assessment of Agroforestry Practices on Community Socio-Economic Livel...
 
11.population growth and sustainable land management in india
11.population growth and sustainable land management in india11.population growth and sustainable land management in india
11.population growth and sustainable land management in india
 

Similar to Consumption pattern of selected vegetables at five sites in Delhi NCR region

Comparative economic analysis of organic and inorganic wheat
Comparative economic analysis of organic and inorganic wheatComparative economic analysis of organic and inorganic wheat
Comparative economic analysis of organic and inorganic wheatsanaullah noonari
 
Vegetable Cultivation An Alternative Horticultural Farming in Kurnool Distric...
Vegetable Cultivation An Alternative Horticultural Farming in Kurnool Distric...Vegetable Cultivation An Alternative Horticultural Farming in Kurnool Distric...
Vegetable Cultivation An Alternative Horticultural Farming in Kurnool Distric...ijtsrd
 
Abiola samson fertilizer use efficiency
Abiola samson fertilizer use efficiencyAbiola samson fertilizer use efficiency
Abiola samson fertilizer use efficiencySamsonAbiola1
 
A comparative study on socio economic status and agricultural
A comparative study on socio economic status and agriculturalA comparative study on socio economic status and agricultural
A comparative study on socio economic status and agriculturalDr. Binoy Tripura
 
Organic Farming for Sustainable Agriculture - Forestry Nepal
Organic Farming for Sustainable Agriculture - Forestry NepalOrganic Farming for Sustainable Agriculture - Forestry Nepal
Organic Farming for Sustainable Agriculture - Forestry Nepalx3G9
 
Organic Farming for Sustainable Agriculture - Forestry Nepal
Organic Farming for Sustainable Agriculture - Forestry NepalOrganic Farming for Sustainable Agriculture - Forestry Nepal
Organic Farming for Sustainable Agriculture - Forestry Nepalx3G9
 
EFFECTS OF TIME OF APPLICATION AND RATES OF POULTRY MANURE ON THE PERFORMANCE...
EFFECTS OF TIME OF APPLICATION AND RATES OF POULTRY MANURE ON THE PERFORMANCE...EFFECTS OF TIME OF APPLICATION AND RATES OF POULTRY MANURE ON THE PERFORMANCE...
EFFECTS OF TIME OF APPLICATION AND RATES OF POULTRY MANURE ON THE PERFORMANCE...Professor Bashir Omolaran Bello
 
Further analysis on Organic agriculture and organic farming in case of Thaila...
Further analysis on Organic agriculture and organic farming in case of Thaila...Further analysis on Organic agriculture and organic farming in case of Thaila...
Further analysis on Organic agriculture and organic farming in case of Thaila...AI Publications
 
Proximate and Micronutrient analysis of OFSP leaves
Proximate and Micronutrient analysis of OFSP leavesProximate and Micronutrient analysis of OFSP leaves
Proximate and Micronutrient analysis of OFSP leavesMohammadKuddus
 
Bangalorefruits.pdf
Bangalorefruits.pdfBangalorefruits.pdf
Bangalorefruits.pdfovianant
 
Effect of abiotic stress on maize production
Effect of abiotic stress on maize productionEffect of abiotic stress on maize production
Effect of abiotic stress on maize productionSamsonAbiola1
 
Assessment of the knowledge level of potato growers in Madhya Pradesh
Assessment of the knowledge level of potato growers in Madhya PradeshAssessment of the knowledge level of potato growers in Madhya Pradesh
Assessment of the knowledge level of potato growers in Madhya Pradeshhindagrihorticulturalsociety
 
Applications Of Radioisotopes In Agriculture
Applications Of Radioisotopes In AgricultureApplications Of Radioisotopes In Agriculture
Applications Of Radioisotopes In AgricultureDaniel Wachtel
 
Use of climate change resilient technologies in vegetable cultivation by the ...
Use of climate change resilient technologies in vegetable cultivation by the ...Use of climate change resilient technologies in vegetable cultivation by the ...
Use of climate change resilient technologies in vegetable cultivation by the ...Premier Publishers
 
Impact of Pesticides on Farmer’s Health of Western Odisha
Impact of Pesticides on Farmer’s Health of Western OdishaImpact of Pesticides on Farmer’s Health of Western Odisha
Impact of Pesticides on Farmer’s Health of Western OdishaAgriculture Journal IJOEAR
 
Risk assessment of heavy metal distribution and contamination
Risk assessment of heavy metal distribution and contaminationRisk assessment of heavy metal distribution and contamination
Risk assessment of heavy metal distribution and contaminationAlexander Decker
 

Similar to Consumption pattern of selected vegetables at five sites in Delhi NCR region (20)

D0371018026
D0371018026D0371018026
D0371018026
 
10120140504008
1012014050400810120140504008
10120140504008
 
Comparative economic analysis of organic and inorganic wheat
Comparative economic analysis of organic and inorganic wheatComparative economic analysis of organic and inorganic wheat
Comparative economic analysis of organic and inorganic wheat
 
Vegetable Cultivation An Alternative Horticultural Farming in Kurnool Distric...
Vegetable Cultivation An Alternative Horticultural Farming in Kurnool Distric...Vegetable Cultivation An Alternative Horticultural Farming in Kurnool Distric...
Vegetable Cultivation An Alternative Horticultural Farming in Kurnool Distric...
 
Abiola samson fertilizer use efficiency
Abiola samson fertilizer use efficiencyAbiola samson fertilizer use efficiency
Abiola samson fertilizer use efficiency
 
A comparative study on socio economic status and agricultural
A comparative study on socio economic status and agriculturalA comparative study on socio economic status and agricultural
A comparative study on socio economic status and agricultural
 
Organic Farming for Sustainable Agriculture - Forestry Nepal
Organic Farming for Sustainable Agriculture - Forestry NepalOrganic Farming for Sustainable Agriculture - Forestry Nepal
Organic Farming for Sustainable Agriculture - Forestry Nepal
 
Organic Farming for Sustainable Agriculture - Forestry Nepal
Organic Farming for Sustainable Agriculture - Forestry Nepal  Organic Farming for Sustainable Agriculture - Forestry Nepal
Organic Farming for Sustainable Agriculture - Forestry Nepal
 
Organic Farming for Sustainable Agriculture - Forestry Nepal
Organic Farming for Sustainable Agriculture - Forestry NepalOrganic Farming for Sustainable Agriculture - Forestry Nepal
Organic Farming for Sustainable Agriculture - Forestry Nepal
 
EFFECTS OF TIME OF APPLICATION AND RATES OF POULTRY MANURE ON THE PERFORMANCE...
EFFECTS OF TIME OF APPLICATION AND RATES OF POULTRY MANURE ON THE PERFORMANCE...EFFECTS OF TIME OF APPLICATION AND RATES OF POULTRY MANURE ON THE PERFORMANCE...
EFFECTS OF TIME OF APPLICATION AND RATES OF POULTRY MANURE ON THE PERFORMANCE...
 
Further analysis on Organic agriculture and organic farming in case of Thaila...
Further analysis on Organic agriculture and organic farming in case of Thaila...Further analysis on Organic agriculture and organic farming in case of Thaila...
Further analysis on Organic agriculture and organic farming in case of Thaila...
 
Proximate and Micronutrient analysis of OFSP leaves
Proximate and Micronutrient analysis of OFSP leavesProximate and Micronutrient analysis of OFSP leaves
Proximate and Micronutrient analysis of OFSP leaves
 
Bangalorefruits.pdf
Bangalorefruits.pdfBangalorefruits.pdf
Bangalorefruits.pdf
 
Effect of abiotic stress on maize production
Effect of abiotic stress on maize productionEffect of abiotic stress on maize production
Effect of abiotic stress on maize production
 
Assessment of the knowledge level of potato growers in Madhya Pradesh
Assessment of the knowledge level of potato growers in Madhya PradeshAssessment of the knowledge level of potato growers in Madhya Pradesh
Assessment of the knowledge level of potato growers in Madhya Pradesh
 
Applications Of Radioisotopes In Agriculture
Applications Of Radioisotopes In AgricultureApplications Of Radioisotopes In Agriculture
Applications Of Radioisotopes In Agriculture
 
Use of climate change resilient technologies in vegetable cultivation by the ...
Use of climate change resilient technologies in vegetable cultivation by the ...Use of climate change resilient technologies in vegetable cultivation by the ...
Use of climate change resilient technologies in vegetable cultivation by the ...
 
Impact of Pesticides on Farmer’s Health of Western Odisha
Impact of Pesticides on Farmer’s Health of Western OdishaImpact of Pesticides on Farmer’s Health of Western Odisha
Impact of Pesticides on Farmer’s Health of Western Odisha
 
Risk assessment of heavy metal distribution and contamination
Risk assessment of heavy metal distribution and contaminationRisk assessment of heavy metal distribution and contamination
Risk assessment of heavy metal distribution and contamination
 
Vermiculture & Sustainable Agriculture
Vermiculture & Sustainable AgricultureVermiculture & Sustainable Agriculture
Vermiculture & Sustainable Agriculture
 

More from IARI, NEW DELHI

Air pollution tolerance index (apti)
Air pollution tolerance index (apti)Air pollution tolerance index (apti)
Air pollution tolerance index (apti)IARI, NEW DELHI
 
Climate Smart Rice (CSR): Boosting the food security in the changing climate
Climate Smart Rice (CSR): Boosting the food security in the changing climateClimate Smart Rice (CSR): Boosting the food security in the changing climate
Climate Smart Rice (CSR): Boosting the food security in the changing climateIARI, NEW DELHI
 
Wetland restoration: an emerging issue and management in changing climate
Wetland restoration: an emerging issue and management in changing climateWetland restoration: an emerging issue and management in changing climate
Wetland restoration: an emerging issue and management in changing climateIARI, NEW DELHI
 
Climate Smart Agriculture : Food Security of Future to the Climate Change
Climate Smart Agriculture : Food Security of Future to the Climate ChangeClimate Smart Agriculture : Food Security of Future to the Climate Change
Climate Smart Agriculture : Food Security of Future to the Climate ChangeIARI, NEW DELHI
 
Environmental refugees: Searching for the haunt
Environmental refugees: Searching for the hauntEnvironmental refugees: Searching for the haunt
Environmental refugees: Searching for the hauntIARI, NEW DELHI
 

More from IARI, NEW DELHI (6)

Air pollution tolerance index (apti)
Air pollution tolerance index (apti)Air pollution tolerance index (apti)
Air pollution tolerance index (apti)
 
Air pollution modeling
Air pollution modelingAir pollution modeling
Air pollution modeling
 
Climate Smart Rice (CSR): Boosting the food security in the changing climate
Climate Smart Rice (CSR): Boosting the food security in the changing climateClimate Smart Rice (CSR): Boosting the food security in the changing climate
Climate Smart Rice (CSR): Boosting the food security in the changing climate
 
Wetland restoration: an emerging issue and management in changing climate
Wetland restoration: an emerging issue and management in changing climateWetland restoration: an emerging issue and management in changing climate
Wetland restoration: an emerging issue and management in changing climate
 
Climate Smart Agriculture : Food Security of Future to the Climate Change
Climate Smart Agriculture : Food Security of Future to the Climate ChangeClimate Smart Agriculture : Food Security of Future to the Climate Change
Climate Smart Agriculture : Food Security of Future to the Climate Change
 
Environmental refugees: Searching for the haunt
Environmental refugees: Searching for the hauntEnvironmental refugees: Searching for the haunt
Environmental refugees: Searching for the haunt
 

Recently uploaded

VIP Call Girls Moti Ganpur ( Hyderabad ) Phone 8250192130 | ₹5k To 25k With R...
VIP Call Girls Moti Ganpur ( Hyderabad ) Phone 8250192130 | ₹5k To 25k With R...VIP Call Girls Moti Ganpur ( Hyderabad ) Phone 8250192130 | ₹5k To 25k With R...
VIP Call Girls Moti Ganpur ( Hyderabad ) Phone 8250192130 | ₹5k To 25k With R...Suhani Kapoor
 
webinaire-green-mirror-episode-2-Smart contracts and virtual purchase agreeme...
webinaire-green-mirror-episode-2-Smart contracts and virtual purchase agreeme...webinaire-green-mirror-episode-2-Smart contracts and virtual purchase agreeme...
webinaire-green-mirror-episode-2-Smart contracts and virtual purchase agreeme...Cluster TWEED
 
Call Girl Nagpur Roshni Call 7001035870 Meet With Nagpur Escorts
Call Girl Nagpur Roshni Call 7001035870 Meet With Nagpur EscortsCall Girl Nagpur Roshni Call 7001035870 Meet With Nagpur Escorts
Call Girl Nagpur Roshni Call 7001035870 Meet With Nagpur EscortsCall Girls in Nagpur High Profile
 
Horizon Net Zero Dawn – keynote slides by Ben Abraham
Horizon Net Zero Dawn – keynote slides by Ben AbrahamHorizon Net Zero Dawn – keynote slides by Ben Abraham
Horizon Net Zero Dawn – keynote slides by Ben Abrahamssuserbb03ff
 
NO1 Verified kala jadu karne wale ka contact number kala jadu karne wale baba...
NO1 Verified kala jadu karne wale ka contact number kala jadu karne wale baba...NO1 Verified kala jadu karne wale ka contact number kala jadu karne wale baba...
NO1 Verified kala jadu karne wale ka contact number kala jadu karne wale baba...Amil baba
 
Mumbai Call Girls, 💞 Prity 9892124323, Navi Mumbai Call girls
Mumbai Call Girls, 💞  Prity 9892124323, Navi Mumbai Call girlsMumbai Call Girls, 💞  Prity 9892124323, Navi Mumbai Call girls
Mumbai Call Girls, 💞 Prity 9892124323, Navi Mumbai Call girlsPooja Nehwal
 
Call Girls Budhwar Peth Call Me 7737669865 Budget Friendly No Advance Booking
Call Girls Budhwar Peth Call Me 7737669865 Budget Friendly No Advance BookingCall Girls Budhwar Peth Call Me 7737669865 Budget Friendly No Advance Booking
Call Girls Budhwar Peth Call Me 7737669865 Budget Friendly No Advance Bookingroncy bisnoi
 
Booking open Available Pune Call Girls Parvati Darshan 6297143586 Call Hot I...
Booking open Available Pune Call Girls Parvati Darshan  6297143586 Call Hot I...Booking open Available Pune Call Girls Parvati Darshan  6297143586 Call Hot I...
Booking open Available Pune Call Girls Parvati Darshan 6297143586 Call Hot I...Call Girls in Nagpur High Profile
 
Call On 6297143586 Pimpri Chinchwad Call Girls In All Pune 24/7 Provide Call...
Call On 6297143586  Pimpri Chinchwad Call Girls In All Pune 24/7 Provide Call...Call On 6297143586  Pimpri Chinchwad Call Girls In All Pune 24/7 Provide Call...
Call On 6297143586 Pimpri Chinchwad Call Girls In All Pune 24/7 Provide Call...tanu pandey
 
VIP Call Girls Saharanpur Aaradhya 8250192130 Independent Escort Service Saha...
VIP Call Girls Saharanpur Aaradhya 8250192130 Independent Escort Service Saha...VIP Call Girls Saharanpur Aaradhya 8250192130 Independent Escort Service Saha...
VIP Call Girls Saharanpur Aaradhya 8250192130 Independent Escort Service Saha...Suhani Kapoor
 
DENR EPR Law Compliance Updates April 2024
DENR EPR Law Compliance Updates April 2024DENR EPR Law Compliance Updates April 2024
DENR EPR Law Compliance Updates April 2024itadmin50
 
Call Girls Magarpatta Call Me 7737669865 Budget Friendly No Advance Booking
Call Girls Magarpatta Call Me 7737669865 Budget Friendly No Advance BookingCall Girls Magarpatta Call Me 7737669865 Budget Friendly No Advance Booking
Call Girls Magarpatta Call Me 7737669865 Budget Friendly No Advance Bookingroncy bisnoi
 
Proposed Amendments to Chapter 15, Article X: Wetland Conservation Areas
Proposed Amendments to Chapter 15, Article X: Wetland Conservation AreasProposed Amendments to Chapter 15, Article X: Wetland Conservation Areas
Proposed Amendments to Chapter 15, Article X: Wetland Conservation Areas💥Victoria K. Colangelo
 
(ZARA) Call Girls Talegaon Dabhade ( 7001035870 ) HI-Fi Pune Escorts Service
(ZARA) Call Girls Talegaon Dabhade ( 7001035870 ) HI-Fi Pune Escorts Service(ZARA) Call Girls Talegaon Dabhade ( 7001035870 ) HI-Fi Pune Escorts Service
(ZARA) Call Girls Talegaon Dabhade ( 7001035870 ) HI-Fi Pune Escorts Serviceranjana rawat
 
Environmental Toxicology (environmental biology)
Environmental Toxicology (environmental biology)Environmental Toxicology (environmental biology)
Environmental Toxicology (environmental biology)RaviPrajapat11
 

Recently uploaded (20)

young Whatsapp Call Girls in Delhi Cantt🔝 9953056974 🔝 escort service
young Whatsapp Call Girls in Delhi Cantt🔝 9953056974 🔝 escort serviceyoung Whatsapp Call Girls in Delhi Cantt🔝 9953056974 🔝 escort service
young Whatsapp Call Girls in Delhi Cantt🔝 9953056974 🔝 escort service
 
Call Girls In Pratap Nagar꧁❤ 🔝 9953056974🔝❤꧂ Escort ServiCe
Call Girls In Pratap Nagar꧁❤ 🔝 9953056974🔝❤꧂ Escort ServiCeCall Girls In Pratap Nagar꧁❤ 🔝 9953056974🔝❤꧂ Escort ServiCe
Call Girls In Pratap Nagar꧁❤ 🔝 9953056974🔝❤꧂ Escort ServiCe
 
VIP Call Girls Moti Ganpur ( Hyderabad ) Phone 8250192130 | ₹5k To 25k With R...
VIP Call Girls Moti Ganpur ( Hyderabad ) Phone 8250192130 | ₹5k To 25k With R...VIP Call Girls Moti Ganpur ( Hyderabad ) Phone 8250192130 | ₹5k To 25k With R...
VIP Call Girls Moti Ganpur ( Hyderabad ) Phone 8250192130 | ₹5k To 25k With R...
 
webinaire-green-mirror-episode-2-Smart contracts and virtual purchase agreeme...
webinaire-green-mirror-episode-2-Smart contracts and virtual purchase agreeme...webinaire-green-mirror-episode-2-Smart contracts and virtual purchase agreeme...
webinaire-green-mirror-episode-2-Smart contracts and virtual purchase agreeme...
 
Call Girl Nagpur Roshni Call 7001035870 Meet With Nagpur Escorts
Call Girl Nagpur Roshni Call 7001035870 Meet With Nagpur EscortsCall Girl Nagpur Roshni Call 7001035870 Meet With Nagpur Escorts
Call Girl Nagpur Roshni Call 7001035870 Meet With Nagpur Escorts
 
Horizon Net Zero Dawn – keynote slides by Ben Abraham
Horizon Net Zero Dawn – keynote slides by Ben AbrahamHorizon Net Zero Dawn – keynote slides by Ben Abraham
Horizon Net Zero Dawn – keynote slides by Ben Abraham
 
NO1 Verified kala jadu karne wale ka contact number kala jadu karne wale baba...
NO1 Verified kala jadu karne wale ka contact number kala jadu karne wale baba...NO1 Verified kala jadu karne wale ka contact number kala jadu karne wale baba...
NO1 Verified kala jadu karne wale ka contact number kala jadu karne wale baba...
 
Mumbai Call Girls, 💞 Prity 9892124323, Navi Mumbai Call girls
Mumbai Call Girls, 💞  Prity 9892124323, Navi Mumbai Call girlsMumbai Call Girls, 💞  Prity 9892124323, Navi Mumbai Call girls
Mumbai Call Girls, 💞 Prity 9892124323, Navi Mumbai Call girls
 
Call Girls Budhwar Peth Call Me 7737669865 Budget Friendly No Advance Booking
Call Girls Budhwar Peth Call Me 7737669865 Budget Friendly No Advance BookingCall Girls Budhwar Peth Call Me 7737669865 Budget Friendly No Advance Booking
Call Girls Budhwar Peth Call Me 7737669865 Budget Friendly No Advance Booking
 
E Waste Management
E Waste ManagementE Waste Management
E Waste Management
 
Sustainable Packaging
Sustainable PackagingSustainable Packaging
Sustainable Packaging
 
Booking open Available Pune Call Girls Parvati Darshan 6297143586 Call Hot I...
Booking open Available Pune Call Girls Parvati Darshan  6297143586 Call Hot I...Booking open Available Pune Call Girls Parvati Darshan  6297143586 Call Hot I...
Booking open Available Pune Call Girls Parvati Darshan 6297143586 Call Hot I...
 
Call On 6297143586 Pimpri Chinchwad Call Girls In All Pune 24/7 Provide Call...
Call On 6297143586  Pimpri Chinchwad Call Girls In All Pune 24/7 Provide Call...Call On 6297143586  Pimpri Chinchwad Call Girls In All Pune 24/7 Provide Call...
Call On 6297143586 Pimpri Chinchwad Call Girls In All Pune 24/7 Provide Call...
 
VIP Call Girls Saharanpur Aaradhya 8250192130 Independent Escort Service Saha...
VIP Call Girls Saharanpur Aaradhya 8250192130 Independent Escort Service Saha...VIP Call Girls Saharanpur Aaradhya 8250192130 Independent Escort Service Saha...
VIP Call Girls Saharanpur Aaradhya 8250192130 Independent Escort Service Saha...
 
DENR EPR Law Compliance Updates April 2024
DENR EPR Law Compliance Updates April 2024DENR EPR Law Compliance Updates April 2024
DENR EPR Law Compliance Updates April 2024
 
Call Girls Magarpatta Call Me 7737669865 Budget Friendly No Advance Booking
Call Girls Magarpatta Call Me 7737669865 Budget Friendly No Advance BookingCall Girls Magarpatta Call Me 7737669865 Budget Friendly No Advance Booking
Call Girls Magarpatta Call Me 7737669865 Budget Friendly No Advance Booking
 
Proposed Amendments to Chapter 15, Article X: Wetland Conservation Areas
Proposed Amendments to Chapter 15, Article X: Wetland Conservation AreasProposed Amendments to Chapter 15, Article X: Wetland Conservation Areas
Proposed Amendments to Chapter 15, Article X: Wetland Conservation Areas
 
(ZARA) Call Girls Talegaon Dabhade ( 7001035870 ) HI-Fi Pune Escorts Service
(ZARA) Call Girls Talegaon Dabhade ( 7001035870 ) HI-Fi Pune Escorts Service(ZARA) Call Girls Talegaon Dabhade ( 7001035870 ) HI-Fi Pune Escorts Service
(ZARA) Call Girls Talegaon Dabhade ( 7001035870 ) HI-Fi Pune Escorts Service
 
Call Girls In Dhaula Kuan꧁❤ 🔝 9953056974🔝❤꧂ Escort ServiCe
Call Girls In Dhaula Kuan꧁❤ 🔝 9953056974🔝❤꧂ Escort ServiCeCall Girls In Dhaula Kuan꧁❤ 🔝 9953056974🔝❤꧂ Escort ServiCe
Call Girls In Dhaula Kuan꧁❤ 🔝 9953056974🔝❤꧂ Escort ServiCe
 
Environmental Toxicology (environmental biology)
Environmental Toxicology (environmental biology)Environmental Toxicology (environmental biology)
Environmental Toxicology (environmental biology)
 

Consumption pattern of selected vegetables at five sites in Delhi NCR region

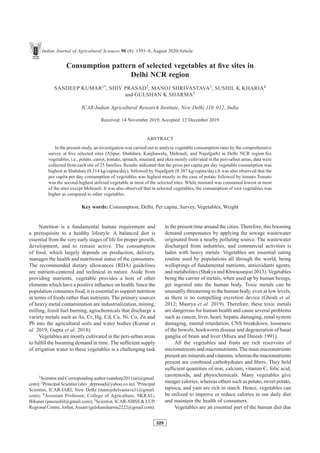
  • 1. Indian Journal of Agricultural Sciences 90 (8): 1593–8, August 2020/Article Consumption pattern of selected vegetables at five sites in Delhi NCR region Sandeep Kumar1*, Shiv Prasad2, Manoj Shrivastava3, Sushil K Kharia4 and Gulshan K Sharma5 ICAR-Indian Agricultural Research Institute, New Delhi 110  012, India Received: 14 November 2019; Accepted: 12 December 2019 ABSTRACT In the present study, an investigation was carried out to analyze vegetable consumption rates by the comprehensive survey at five selected sites (Alipur, Shahdara, Kanjhawala, Mehrauli, and Najafgarh) in Delhi NCR region.Six vegetables, i.e., potato, carrot, tomato, spinach, mustard, and okra mostly cultivated in the peri-urban areas, data were collected from each site of 25 families. Results indicated that the gross per capita per day vegetable consumption was highest at Shahdara (0.314 kg/capita/day), followed by Najafgarh (0.307 kg/capita/day).It was also observed that the per capita per day consumption of vegetables was highest mostly in the case of potato followed by tomato.Tomato was the second-highest utilized vegetable at most of the selected sites. While mustard was consumed lowest at most of the sites except Mehrauli. It was also observed that in selected vegetables, the consumption of root vegetables was higher as compared to other vegetables. Key words: Consumption, Delhi, Per capita, Survey, Vegetables, Weight Nutrition is a fundamental human requirement and a prerequisite to a healthy lifestyle. A balanced diet is essential from the very early stages of life for proper growth, development, and to remain active. The consumption of food, which largely depends on production, delivery, manages the health and nutritional status of the consumers. The recommended dietary allowances (RDA) guidelines are nutrient-centered and technical in nature. Aside from providing nutrients, vegetable provides a host of other elements which have a positive influence on health. Since the population consumes food, it is essential to support nutrition in terms of foods rather than nutrients. The primary sources of heavy metal contamination are industrialization, mining, milling, fossil fuel burning, agrochemicals that discharge a variety metals such as As, Cr, Hg, Cd, Cu, Ni, Co, Zn and Pb into the agricultural soils and water bodies (Kumar et al. 2019; Gupta et al. 2018). Vegetables are mostly cultivated in the peri-urban areas to fulfill the booming demand in time. The sufficient supply of irrigation water to these vegetables is a challenging task 1Scientist and Corresponding author (sandeep2011iari@gmail. com); 2Principal Scientist (shiv_drprasad@yahoo.co.in); 3Principal Scientist, ICAR-IARI, New Delhi (manojshrivastava31@gmail. com); 4Assistant Professor, College of Agriculture, SKRAU, Bikaner (pausushil@gmail.com); 5Scientist, ICAR-NBSS & LUP, Regional Centre, Jorhat,Assam (gulshansharma2222@gmail.com). in the present time around the cities. Therefore, this booming demand compensates by applying the sewage wastewater originated from a nearby polluting source. The wastewater discharged from industries, and commercial activities is laden with heavy metals. Vegetables are essential eating routine used by populations all through the world, being wellsprings of fundamental nutrients, antioxidants agents, and metabolites (Shakya and Khwaounjoo 2013). Vegetables being the carrier of metals, when used up by human beings, get ingested into the human body. Toxic metals can be unusually threatening to the human body, even at low levels, as there is no compelling excretion device (Ghosh et al. 2012; Maurya et al. 2019). Therefore, these toxic metals are dangerous for human health and cause several problems such as cancer, liver, heart, hepatic damaging, renal system damaging, mental retardation, CNS breakdown, looseness of the bowels, hookworm disease and degeneration of basal ganglia of brain and liver (Misra and Dinesh 1991). All the vegetables and fruits are rich reservoirs of micronutrients and macronutrients. The main micronutrients presentaremineralsandvitamins,whereasthemacronutrients present are combined carbohydrates and fibers. They hold sufficient quantities of iron, calcium, vitamin C, folic acid, carotenoids, and phytochemicals. Many vegetables give meager calories, whereas others such as potato, sweet potato, tapioca, and yam are rich in starch. Hence, vegetables can be utilized to improve or reduce calories in our daily diet and maintain the health of consumers. Vegetables are an essential part of the human diet due 229
  • 2. 1594 [Indian Journal of Agricultural Sciences 90 (8) to the richness of beneficial and essential minerals and nutrients (Nankishore 2014). The Expert Committee (EC) of the Indian Council of Medical Research (ICMR), taking into attention the nutrient requirements, has recommended that each individual per day should consume at least 300 g of vegetables (including green leafy vegetables: 50 g; other vegetables: 200 g; roots and tubers: 50 g). As the necessities of iron and folic acid are essential for pregnant women, they should consume at least 100g of leafy vegetables per day. Total production of vegetables is about 30% less than the demand of 100 million tonnes (Mukherjee et al. 2016). The toxic metals have the tendency of accumulating in the vegetables and, ultimately via food chain enter into humans. The amount of vegetables enter into the human body mainly depends on the quantity and types of vegetables consumed per day, type of irrigation source, area of production, and age group of consumers (Kumar et al. 2019). Unfortunately, vegetables can uptake and accumulate toxic metals beyond recommended limits in their entire body, including both edible and inedible parts (Tasrina et al. 2015). In the last decade, the level of heavy metals in vegetables (leafy, root, and fruit) has been observed at high levels (Wai et al. 2017). Ultimately, the build-up of toxic metals in vegetables and edible parts of crops in contaminated soils is a matter of grave concern due to the harmful and irreversible effects of metals impacting the human's health (Malik 2004). MARTIALS AND METHODS Sampling location and demography Delhi city is resided in Northern India, at 28.7041°N 77.1025°E with 216m elevation. It is surrounded by Uttar Pradesh (Gautam Budh Nagar, Ghaziabad, and Baghpat) and by Haryana (Gurugram, Faridabad, Jhajjar, and Sonipat) on three sides. The NCR Delhi covers an area of 1484 km2, of which 783 km2 is a rural area and 700 km2 urban area. According to the 2011 census, the population of Delhi's city was over 11 million. The river Yamuna was the historical boundary between Punjab and UP, and its flood plains provide fertile alluvial soil suitable for agriculture but are prone to intermittent floods. Delhi has a dry-winter humid subtropical climate, including a hot semi-arid climate. Temperatures range from 2 to 47°C with average annual rainfall is around 886mm, which most of which falls during the monsoon season (July-August) (ESD 2006). Sampling sites In Delhi NCR, 5 sampling sites were selected for conducted present study . All the information about the sites were given in Table 1. Sampling procedure The data collection sheets were prepared by using standard parameters required for the assessment of the toxicity of metal. Families were randomly selected. Data were collected using standardized questionnaires by face to face interactions at the time of sampling for each site in the city of Delhi (INDDEX Project 2018). The questionnaire requested self-reported information regarding sociodemographic characteristics, types of consumers, number of family members, number of vegetable consumers, age group, types of vegetables consuming, dietary patterns, and weight. Additionally, some other information also collected like male: female ratio in family and disease regarding information (Krebs-Smith et al. 1995). A total of 125 families were surveyed, 25 at each location including 455 members during 2017-18 and 2018-19 (Table 2). Vegetables selected For the present study, 6 vegetables of different categories such as leafy, root, and shoot were collected from selected sites (Table 3). The consumption pattern of 230 Table 1 Sampling sites with their latitude, longitude, and altitude Site District of Delhi Latitude Longitude Altitude Alipur North West 28.797460 77.132991 214.4 m Kanjhawala North West 28.735456 77.002011 213.9 m Najafgarh South West 28.611856 76.981354 219.0 m Mehrauli South West 28.521586 77.179149 260.8 m Shahdara North East 28.700868 77.289846 207.0 m Table 2 Number of families, family members and vegetable consumers at selected sites Site No. of family surveyed No. of members Vegetable consumers Alipur 25 103 92 Kanjhawala 25 92 82 Najafgarh 25 99 97 Mehrauli 25 90 85 Shahdara 25 71 70 Total 125 455 426 Table 3  Selected vegetables and their category Vegetable Botanical name Family Category Sampling season Potato Solanum tuberosum L. Solanaceae Root Winter Carrot Daucus carota L. Apiaceae Root Winter Tomato Solanum lycopersicum L. Solanaceae Fruit Winter Okra Abelmoschus esculentus L. Malvaceae Fruit Summer Spinach Spinacia oleracea L. Chenopodiaceae Leafy Winter Mustard Brassica juncea L. Brassicaceae Leafy Winter Kumar et al
  • 3. 1595August 2020] Consumption pattern of selected vegetables these vegetables was surveyed and found per day per capita consumption. RESULTS AND DISCUSSION The vegetable consumption data were collected from all the five selected sites in the Delhi region, i.e. Alipur, Shahdara, Mehrauli, Kanjhawala and Najafgarh. From each site 25 families were selected randomly to collect data. In Alipur, data of 103 individuals were collected from 25 families regarding total vegetable consumption per week, total number of consumers, and non-consumers. In Alipur, the total vegetable consumption per week was 41 kg, 22 kg, 38.5 kg, 22.5 kg, 29 kg, and 20 kg of potato, okra, tomato, spinach, carrot, and mustard respectively.The per capita per day consumption of leafy vegetable (mustard) is lowest (39g/ day) and of root vegetable (potato) is highest (64g) at this site. At Alipur, the per day per capita consumption rate of vegetables is potato > tomato > carrot > okra = spinach = mustard (Table 4). From each site, 25 families were selected randomly to collect data. In Shahdara, data of 92 individuals were collected from 25 families regarding total vegetable consumption per week, the total number of consumers and non-consumers.InShahdara,thetotalvegetableconsumption per week was 33 kg, 31.7 kg, 32.5 kg, 33.3 kg, 35 kg, and 27.8 kg of potato, okra, tomato, spinach, carrot, and mustard respectively. The per capita per day consumption of leafy vegetable (mustard) is lowest (48g/day) and of root vegetable (potato) is highest (57g) at this site.At Shahdara, the per day per capita consumption rate of vegetables is potato > carrot > spinach> okra = tomato > mustard (Table 5). From each site, 25 families were selected randomly to collect data. In Mehrauli, data of 99 individuals were collected from 25 families regarding total vegetable consumption per week, the total number of consumers and non-consumers. In Mehrauli, the total vegetable consumption per week was 36 kg, 36 kg, 38.5 kg, 28.5 kg, 26.3 kg, and 22 kg of potato, okra, tomato, spinach, carrot, and mustard respectively. The lowest and highest per capita per day consumption was found in the case of root vegetable (carrot) 41g/day and in fruit vegetable (tomato) 57g, respectively at this site. At Mehrauli, the per day per capita consumption rate of vegetables is tomato > potato > okra > mustard > spinach > carrot (Table 6). From each site, 25 families were selected randomly to collect data. In Kanjhawala, data of 90 individuals were collected from 25 families regarding total vegetable consumption per week, the total number of consumers and non-consumers. In Kanjhawala, the total vegetable consumption per week was 39 kg, 35.5 kg, 31.5 kg, 26 kg, 28.5 kg, and 18 kg of potato, okra, tomato, spinach, carrot, and mustard respectively. The lowest and highest per capita per day consumption was found in the case of leafy vegetable (mustard) 34 g/day and in root vegetable (potato) 66 g, respectively, at this site. At Kanjhawala, the per day per capita consumption rate of vegetables is potato>okra > Table 4 Vegetable consumption at Alipur Parameter Unit Potato Okra Tomato Spinach Carrot Mustard Total no. of family surveyed - 25 25 25 25 25 25 Quantity of 6 vegetables consumption kg/week/25 families 41 22 38.5 22.5 29 20 Total number of consumers Per 25 families 103 103 103 103 103 103 Number of non-vegetable consumers Out of 103 11 22 0 20 11 30 Net vegetable consumers - 92 81 103 83 92 73 Per capita consumption/week kg 0.446 0.272 0.374 0.271 0.315 0.274 Per capita consumption/day kg 0.064 0.039 0.053 0.039 0.045 0.039 Mean consumption kg/week/25 families 1.64 0.88 1.54 0.90 1.16 0.80 SD 0.98 0.60 0.43 0.74 1.01 1.08 Table 5 Vegetable consumption at Shahdara Parameter Unit Potato Okra Tomato Spinach Carrot Mustard Total no. of family surveyed - 25 25 25 25 25 25 Quantity of 6 vegetables consumption kg/week/25 families 33 31.75 32.5 33.25 35 27.75 Total number of consumers Per 25 families 92 92 92 92 92 92 Number of non-vegetable consumers Out of 103 10 2 0 3 0 9 Net vegetable consumers - 82 90 92 89 92 83 Per capita/week kg 0.402 0.353 0.353 0.374 0.380 0.334 Per capita/day kg 0.057 0.050 0.050 0.053 0.054 0.048 Mean consumption kg/week/25 families 1.32 1.27 1.30 1.33 1.40 1.11 SD 0.66 0.65 0.54 0.66 0.54 0.79 231
  • 4. 1596 [Indian Journal of Agricultural Sciences 90 (8) Table 7  Vegetable consumption at Kanjhawala Parameter Unit Potato Okra Tomato Spinach Carrot Mustard Total no. of family surveyed - 25 25 25 25 25 25 Quantity of 6 vegetables consumption kg/week/25 families 39 35.5 31.5 26 28.5 18 Total number of consumers Per 25 families 90 90 90 90 90 90 Number of non-vegetable consumers Out of 103 5 3 0 2 6 15 Net vegetable consumers - 85 87 90 88 84 75 Per capita/week kg 0.459 0.408 0.350 0.295 0.339 0.240 Per capita/day kg 0.066 0.058 0.050 0.042 0.048 0.034 Mean consumption kg/week/25 families 1.56 1.42 1.26 1.04 1.14 0.72 SD 0.68 0.73 0.48 0.32 0.57 0.52 Table 8  Vegetables consumption at Najafgarh Parameter Unit Potato Okra Tomato Spinach Carrot Mustard Total no. of family surveyed - 25 25 25 25 25 25 Quantity of 6 vegetables consumption kg/week/25 families 32.5 23.75 25 20.75 29.5 4.75 Total number of consumers Per 25 families 71 71 71 71 71 71 Number of non-vegetable consumers Out of 103 1 5 4 3 2 49 Net vegetable consumers - 70 66 67 68 69 22 Per capita/week kg 0.464 0.360 0.373 0.305 0.428 0.216 Per capita/day kg 0.066 0.051 0.053 0.044 0.061 0.031 Mean consumption kg/week/25 families 1.30 0.95 1.00 0.83 1.18 0.19 SD 0.61 0.64 0.32 0.50 0.72 0.32 Table 6  Vegetables consumption at Mehrauli Parameter Unit Potato Okra Tomato Spinach Carrot Mustard Total no. of family surveyed - 25 25 25 25 25 25 Quantity of 6 vegetables consumption kg/week/25 families 36 36 38.5 28.5 26.25 22 Total number of consumers Per 25 families 99 99 99 99 99 99 Number of non-vegetable consumers Out of 103 2 0 0 2 8 33 Net vegetable consumers - 97 99 99 97 91 66 Per capita/week kg 0.371 0.364 0.389 0.294 0.288 0.333 Per capita/day kg 0.053 0.052 0.056 0.042 0.041 0.048 Mean consumption kg/week/25 families 1.44 1.44 1.54 1.14 1.05 0.88 SD 0.62 0.99 0.45 0.65 0.65 0.89 Per capita per day consumption rate of selected vegetables was observed highest in the case of potato at all the sites except Mehrauli, where the tomato was consumed in higher amount (Fig 1).Tomato was second highest consumed vegetable at most of the sites. Mustard was consumed lowest at most of the sites except Mehrauli. The consumption order of selected vegetables given in Table 9. In selected vegetables, we observed that consumption of root vegetables especially potato was higher as compared to other vegetables. The consumption pattern of vegetables determines the risk assessment in further studies of heavy metals analysis. The type of vegetables consumption pattern also determines the requirement or demand some specific vegetables in particular are. tomato>carrot > spinach > mustard (Table 7). From each site, 25 families were selected randomly to collect data. In Najafgarh, data of 71 individuals were collected from 25 families regarding total vegetable consumption per week, the total number of consumers and non-consumers. In Najafgarh, the total vegetable consumption per week was 32.5 kg, 23.7 kg, 25 kg, 20.7 kg, 29.5 kg, and 4.75 kg of potato, okra, tomato, spinach, carrot, and mustard respectively. The lowest and highest per capita per day consumption was found in the case of leafy vegetable (mustard) 31 g/day and in root vegetable (potato) 66 g, respectively at this site. At Najafgarh, the per day per capita consumption rate of vegetables is potato >carrot > tomato >okra > spinach > mustard (Table 8). 232 Kumar et al
  • 5. 1597August 2020] Acknowledgments The authors are grateful to the Post Graduate School and Director, Indian Agricultural Research Institute, New Delhi, India, for providing all the support and facilities. We are also thankful to the Centre for Environment Science and Climate Resilient Agriculture (CESCRA), Indian Agricultural Research Institute, New Delhi, for providing necessary facilities for undertaking this study. REFERENCES ESD (Economic Survey of Delhi). 2005-2006. Planning Table 9 Consumption order of vegetables at selected sites (kg/ capita/day) Site *Per capita per day consumption (kg) Consumption order (kg/capita/day) Alipur 0.279 Potato > Tomato > Carrot > Okra = Spinach = Mustard Shahdara 0.314 Potato > Carrot > Spinach > Okra = Tomato > Mustard Mehrauli 0.291 Tomato > Potato > Okra > Mustard > Spinach > Carrot Kanjhawala 0.299 Potato > Okra > Tomato > Carrot > Spinach > Mustard Najafgarh 0.307 Potato > Carrot > Tomato > Okra > Spinach > Mustard   *This is the total amount of 6 selected vegetables consumed per capitaper day. Fig 1 Per capita per day consumption rate of selected vegetables. 0.00 0.01 0.02 0.03 0.04 0.05 0.06 0.07 0.08 Potato Okra Tomato Palak Carrot Mustard Vegetablesconsumption(kg/day) Per capita per day consumption (kg/capta/day) Alipur Shahdara Mehrauli Kanjhawala Najafgarh Department, Government of National Capital Territory of Delhi, pp 1-7. Ghosh A K, Bhatt M A, Agrawal H P. 2012. Effect of long- term application of treated sewage water on heavy metal accumulation in vegetables grown in Northern India. Environmental Monitoring and Assessment 184: 1025–36. Gupta N,Yadav K K, Kumar V, Kumar S, Chadd R Pand KumarA. 2018. Trace elements in soil-vegetables interface: translocation, bioaccumulation, toxicity and amelioration-a review. Science of the Total Environmen 651(2): 2927–42. INDDEX Project. 2018. Data4Diets: Building Blocks for Diet- related Food Security Analysis. Tufts University, Boston, MA. https://inddex.nutrition.tufts.edu/data4diets. Accessed on 21 October 2019. Krebs-Smith S M, Heimendinger J, Subar A F, Patterson B H and Pivonka E. 1995. Using food frequency questionnaires to estimate fruit and vegetable intake: association between the number of questions and total intakes. Journal of Nutrition Education 27(2): 80–85. Kumar S, Prasad,S, Yadav K K, Shrivastava M, Gupta N, Nagar S, Bach Q V, Kamyab H, Khan S A, Yadav S and Malav L C. 2019. Hazardous heavy metals contamination of vegetables and food chain: Role of sustainable remediation approaches-A review. Environmental Research 108792. Malik A. 2004. Metal bioremediation through growing cells. Environmental International 30: 261–78. Maurya P K, Malik D S, Yadav K K, Kumar A, Kumar S and Kamyab H. 2019. Bioaccumulation and potential sources of heavy metal contamination in fish species in River Ganga basin: Possible human health risks evaluation. Toxicology reports. Misra S G and Dinesh D. 1991. Soil Pollution. Ashing Publishing House, New Delhi. 233 Consumption pattern of selected vegetables
  • 6. 1598 [Indian Journal of Agricultural Sciences 90 (8) Mukherjee A, Dutta Sand Goyal T M. 2016. India’s Phytonutrient Report. New Delhi: Academic Foundation. Nankishore A. 2014. Heavy metal levels in leafy vegetables from selected markets in Guyana. Journal of Agricultural Technology 10: 651–63. Shakya P R and Khwaounjoo N M. 2013. Heavy metal contamination in green leafy vegetables collected from different market sites of Kathmandu and their associated health risks. Scientific World 11(11): 37–42. Tasrina R C, Rowshon A, Mustafizur A M R, Rafiqul I, Ali M P. 2015. Heavy metals contamination in vegetables and its growing soil. Journal of Environmental Analytical Chemistry 2: 142. Wai K M, Dai J, Yu P K N, Zhou X, Wong C M S. 2017. Public health risk of mercury in China through consumption of vegetables, a modelling study. Environmental Research 159: 152–57. 234 Kumar et al