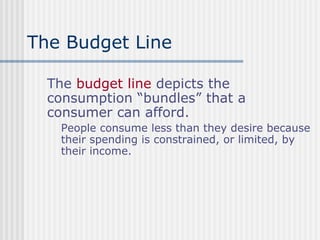
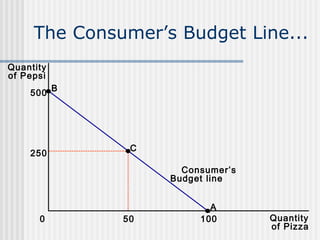
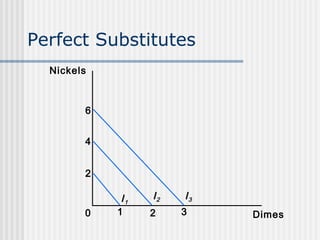
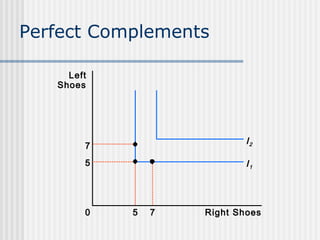
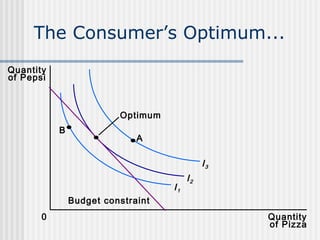
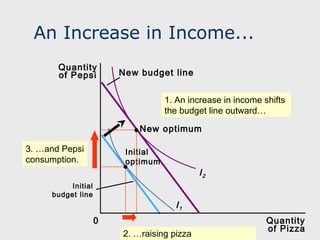
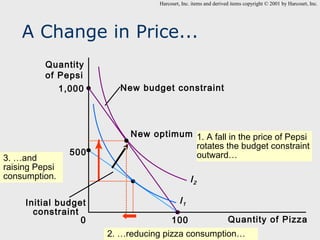
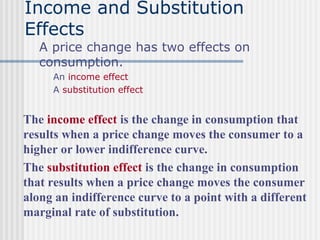
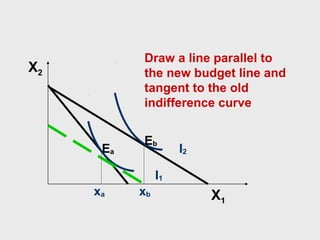
Consumer Behavior
Ch. 7
The Budget Line
The budget line depicts the
consumption “bundles” that a
consumer can afford.
People consume less than they desire because
their spending is constrained, or limited, by
their income.
The Consumer’s Budget Line...
Quantity
of Pepsi
500

250

B

C
Consumer’s
Budget line

0

50

A
100

Quantity
of Pizza
The Consumer’s Budget Line
The slope of the budget line equals
the relative price of the two goods,
that is, the price of one good
compared to the price of the other.
It measures the rate at which the
consumer will trade one good for the
other.
Preferences:
What the Consumer Wants
A consumer’s preference
among consumption bundles
may be illustrated with
indifference curves.
An indifference curve shows
bundles of goods that make the
consumer equally happy.
The Consumer’s Preferences...
Quantity
of Pepsi
C

B

D

I2
A
0

Indifference
curve, I 1
Quantity
of Pizza
The Consumer’s Preferences
The consumer is indifferent, or equally
happy, with the combinations shown at
points A, B, and C because they are all on
the same curve.
The Marginal Rate of
Substitution
The slope at any point on an indifference
curve is the marginal rate of
substitution.
It is the rate at which a consumer is willing
to substitute one good for another.
It is the amount of one good that a
consumer requires as compensation to give
up one unit of the other good.
The Consumer’s Preferences...
Quantity
of Pepsi
C

B

D

I2

MRS 1

A
0

Indifference
curve, I 1
Quantity
of Pizza
Properties of Indifference
Curves
Higher indifference curves are
preferred to lower ones.
Indifference curves are
downward sloping.
Indifference curves do not cross.
Indifference curves are bowed
inward.
Property 1: Higher indifference
curves are preferred to lower
ones.
Consumers usually prefer more of
something to less of it.
Higher indifference curves represent
larger quantities of goods than do
lower indifference curves.
Property 2: Indifference curves
are downward sloping.
A consumer is willing to give up one
good only if he or she gets more of the
other good in order to remain equally
happy.
If the quantity of one good is reduced,
the quantity of the other good must
increase.
For this reason, most indifference
curves slope downward.
Property 3: Indifference curves do
not cross.
Quantity
of Pepsi
C
A
B

0

Quantity
of Pizza
Property 4: Indifference curves
are bowed inward.
People are more willing to
trade away goods that they
have in abundance and less
willing to trade away goods of
which they have little.

Quantity
of Pepsi
14

MRS = 6
8

A

1

4
3
0

MRS = 1
2

3

1
6

B

7

Indifference
curve
Quantity
of Pizza
Perfect Substitutes
Nickels

6
4
2

0

I1
1

I2
2

I3
3

Dimes
Perfect Complements
Left
Shoes

7

I2

5

I1

0

5

7

Right Shoes
The Consumer’s Optimum...
Quantity
of Pepsi

Optimum
B

A

I3
I1

I2

Budget constraint
0

Quantity
of Pizza
How Changes in Income Affect
the Consumer’s Choices
An increase in income shifts the
budget line outward.
The consumer is able to choose a better
combination of goods on a higher
indifference curve.
An Increase in Income...
Quantity
of Pepsi

New budget line
1. An increase in income shifts
the budget line outward…
New optimum

3. …and Pepsi
consumption.

Initial
optimum

Initial
budget line

I2
I1

0
2. …raising pizza

Quantity
of Pizza
How Changes in Prices Affect
Consumer Choices
A fall in the price of any
good rotates the budget
constraint outward and
changes the slope of the
budget line.
Harcourt, Inc. items and derived items copyright © 2001 by Harcourt, Inc.

A Change in Price...
Quantity
of Pepsi
1,000

3. …and
raising Pepsi
consumption.

500

Initial budget
constraint
0

New budget constraint

New optimum 1. A fall in the price of Pepsi
rotates the budget constraint
outward…

I2
I1
100

Quantity of Pizza

2. …reducing pizza consumption…
Income and Substitution
Effects
A price change has two effects on
consumption.
An income effect
A substitution effect

The income effect is the change in consumption that
results when a price change moves the consumer to a
higher or lower indifference curve.
The substitution effect is the change in consumption
that results when a price change moves the consumer
along an indifference curve to a point with a different
marginal rate of substitution.
The new optimum is
Eb on I2.

X2

The Total Price
Effect is xa to xb
Ea

Eb

I2

I1
xa

xb

X1
Draw a line parallel to
the new budget line and
tangent to the old
indifference curve

X2

Ea

Eb

I2

I1
xa

xb

X1
X2

Ea

The new optimum on I1 is
at Ec. The movement from
Ea to Ec (the increase in
quantity demanded from
Xa to Xc) is solely in
response to a change in
Eb
relative prices
I2

Ec I1

xa xc

xb

X1
This is the
substitution effect.

X2

Ea

Xa

Eb
Ec

Substitution
Effect

I2

I1

Xc

X1
A Change in Price:
Substitution Effect
The substituiton effect
increases the quantity
demanded of a good whose
price has fallen and reduces
the quantity demanded of a
good whose price has risen.
A Change in Price:
Income Effect
The income effect leads
consumers to buy more of a
product whose price has fallen, if
it is a normal good.
Because of the combined operation of the
income and substitution effects, the
demand curve for any normal good will be
negatively sloped.

Consumer2 behaviour indifference curve

  • 1.
  • 2.
    The Budget Line Thebudget line depicts the consumption “bundles” that a consumer can afford. People consume less than they desire because their spending is constrained, or limited, by their income.
  • 3.
    The Consumer’s BudgetLine... Quantity of Pepsi 500 250 B C Consumer’s Budget line 0 50 A 100 Quantity of Pizza
  • 4.
    The Consumer’s BudgetLine The slope of the budget line equals the relative price of the two goods, that is, the price of one good compared to the price of the other. It measures the rate at which the consumer will trade one good for the other.
  • 5.
    Preferences: What the ConsumerWants A consumer’s preference among consumption bundles may be illustrated with indifference curves. An indifference curve shows bundles of goods that make the consumer equally happy.
  • 6.
    The Consumer’s Preferences... Quantity ofPepsi C B D I2 A 0 Indifference curve, I 1 Quantity of Pizza
  • 7.
    The Consumer’s Preferences Theconsumer is indifferent, or equally happy, with the combinations shown at points A, B, and C because they are all on the same curve.
  • 8.
    The Marginal Rateof Substitution The slope at any point on an indifference curve is the marginal rate of substitution. It is the rate at which a consumer is willing to substitute one good for another. It is the amount of one good that a consumer requires as compensation to give up one unit of the other good.
  • 9.
    The Consumer’s Preferences... Quantity ofPepsi C B D I2 MRS 1 A 0 Indifference curve, I 1 Quantity of Pizza
  • 10.
    Properties of Indifference Curves Higherindifference curves are preferred to lower ones. Indifference curves are downward sloping. Indifference curves do not cross. Indifference curves are bowed inward.
  • 11.
    Property 1: Higherindifference curves are preferred to lower ones. Consumers usually prefer more of something to less of it. Higher indifference curves represent larger quantities of goods than do lower indifference curves.
  • 12.
    Property 2: Indifferencecurves are downward sloping. A consumer is willing to give up one good only if he or she gets more of the other good in order to remain equally happy. If the quantity of one good is reduced, the quantity of the other good must increase. For this reason, most indifference curves slope downward.
  • 13.
    Property 3: Indifferencecurves do not cross. Quantity of Pepsi C A B 0 Quantity of Pizza
  • 14.
    Property 4: Indifferencecurves are bowed inward. People are more willing to trade away goods that they have in abundance and less willing to trade away goods of which they have little. Quantity of Pepsi 14 MRS = 6 8 A 1 4 3 0 MRS = 1 2 3 1 6 B 7 Indifference curve Quantity of Pizza
  • 15.
  • 16.
  • 17.
    The Consumer’s Optimum... Quantity ofPepsi Optimum B A I3 I1 I2 Budget constraint 0 Quantity of Pizza
  • 18.
    How Changes inIncome Affect the Consumer’s Choices An increase in income shifts the budget line outward. The consumer is able to choose a better combination of goods on a higher indifference curve.
  • 19.
    An Increase inIncome... Quantity of Pepsi New budget line 1. An increase in income shifts the budget line outward… New optimum 3. …and Pepsi consumption. Initial optimum Initial budget line I2 I1 0 2. …raising pizza Quantity of Pizza
  • 20.
    How Changes inPrices Affect Consumer Choices A fall in the price of any good rotates the budget constraint outward and changes the slope of the budget line.
  • 21.
    Harcourt, Inc. itemsand derived items copyright © 2001 by Harcourt, Inc. A Change in Price... Quantity of Pepsi 1,000 3. …and raising Pepsi consumption. 500 Initial budget constraint 0 New budget constraint New optimum 1. A fall in the price of Pepsi rotates the budget constraint outward… I2 I1 100 Quantity of Pizza 2. …reducing pizza consumption…
  • 22.
    Income and Substitution Effects Aprice change has two effects on consumption. An income effect A substitution effect The income effect is the change in consumption that results when a price change moves the consumer to a higher or lower indifference curve. The substitution effect is the change in consumption that results when a price change moves the consumer along an indifference curve to a point with a different marginal rate of substitution.
  • 23.
    The new optimumis Eb on I2. X2 The Total Price Effect is xa to xb Ea Eb I2 I1 xa xb X1
  • 24.
    Draw a lineparallel to the new budget line and tangent to the old indifference curve X2 Ea Eb I2 I1 xa xb X1
  • 25.
    X2 Ea The new optimumon I1 is at Ec. The movement from Ea to Ec (the increase in quantity demanded from Xa to Xc) is solely in response to a change in Eb relative prices I2 Ec I1 xa xc xb X1
  • 26.
    This is the substitutioneffect. X2 Ea Xa Eb Ec Substitution Effect I2 I1 Xc X1
  • 27.
    A Change inPrice: Substitution Effect The substituiton effect increases the quantity demanded of a good whose price has fallen and reduces the quantity demanded of a good whose price has risen.
  • 28.
    A Change inPrice: Income Effect The income effect leads consumers to buy more of a product whose price has fallen, if it is a normal good.
  • 29.
    Because of thecombined operation of the income and substitution effects, the demand curve for any normal good will be negatively sloped.