SlideShare a Scribd company logo
UPSCALING IMPROVEMENT FOR HETEROGENEOUS
FRACTURED RESERVOIR USING A GEOSTATISTICAL
CONNECTIVITY INDEX

M. DELORME, B. ATFEH, V. ALLKEN and B. BOURBIAUX
 Reservoir Engineering Department, IFP, France
.

ABSTRACT
The connectivity of a fracture network is a crucial parameter to understand how
fractures affect the reservoir fluid flow response. We have developed two methods
to estimate the equivalent permeability of a fracture network for any cell of a
fractured field model. Whereas the numerical method is CPU-intensive but
applicable for any fracture network, the continuum analytical method is more
rapid but only valid for well-connected fractured media. An innovating
connectivity analysis based on geo-statistical laws used in fractured reservoir
description is proposed. It consists using a simple fracture network connectivity
index to choose the appropriate up-scaling method regarding both the physical
exactness/accuracy of solutions and the computation cost. It is formulated in
terms of a statistical constitutive fracture sets data function. This explicit index
is validated through the comparison of equivalent fracture permeability results
computed with either discrete or continuum models. Finally, the paper underlines
how that index can be implemented within a combined analytical/numerical up-
scaling methodology for setting up reliable flow models of heterogeneous
fractured reservoirs with minimized computational resources.


INTRODUCTION
Characterizing fractured reservoirs and modelling their flow behaviour are
necessary not only in petroleum engineering but also for various earth sciences
applications. Porous fractured reservoirs have a low matrix permeability such
that fractures are the main fluid-conducting medium. Fluids are stored mainly in
the matrix porosity and transferred to producing wells via that conductive fracture
network. Typical workflows for simulating and predicting the flow behaviour of
such reservoirs goes through a characterization of fractures and the construction
of comprehensive Discrete Fracture Networks (DFN).
M. DELORME et al


Fracture characterization is based on all conventional reservoir data sources,
including seismic, core analysis, well logs and well tests. Fracture sets can be
detected then parameterized in terms of density, orientation, length and
conductivity distributions. Subsequently, fracture sets parameters can constitute
the input data for the construction of representative DFN that can be used for
flow-property calculation.
As large and small fractures play different roles in fluid flow, they need to be
distinguished. Faults that are often larger than the grid cells size are modelled as a
large-scale discrete fault network conditioned by a deterministic seismic-derived
fault map. Small-scale fracture models and joint sets are generated randomly in
space using fracture set data as input parameters. This modelling methodology is
described in Cacas et al (1990) and implemented within FracaFlow , an IFP
software. DFN models are generated for two main reservoir simulation
objectives. First, they integrate fracture-related data or observations into a
representative network that can be further qualified or calibrated in terms of
hydraulic conductivities from well test data matching at a fracture size resolution
scale, for instance. Secondly, calibrated DFN are used for computing the
equivalent fracture permeabilities for subsequent fullfield scale simulations at a
hectometric cell size resolution. With such a methodology and tools, the geologist
can integrate observations and understanding of the genetic episodes of fracturing
into parameterized fracture models.
In this paper we assume that fracture-related data are already interpreted and are
available. That is, in each reservoir cell, fracture set density, orientation, size and
conductivity are characterized from geostatistical distribution laws or models.
Starting from this quantitative fracture model, we herein introduce a fracture
connectivity analysis method to optimize the reliability and computation
efficiency of available techniques for assigning fracture permeability values to
full-field model cells.


EQUIVALENT FRACTURED MEDIA PERMEABILITY TENSOR
Full-field fractured reservoir numerical models consider that flow is taking place
within two continua, the fracture medium characterized by equivalent or effective
fracture permeabilities specified as cell input parameters, and the matrix medium
represented as an array of identical matrix blocks with size and shape also
specified as cell input parameters.
Herein, fracture flows are modelled using Poiseuille's law (equation 1), with an
equivalent hydraulic aperture, eh, defined from the ratio between a conductivity,
c, and an average mechanical aperture, e. Whereas e is derived from the fracture
network porosity, c is the actual flow parameter that relates the flow rate and the
pressure gradient within an individual fracture. eh and e are equal for ideal
fractures with parallel walls but do not coincide in practice because of the
roughness of fracture walls.
                                       2
                                  1 eh        1 c
                          u=−          ∇P = −       ∇P                                 (1)
                                    12         12.e

                                                           GEOSTATS 2008, Santiago, Chile
GEOSTATISTICAL CONNECTIVITY INDEX


with µ the fluid viscosity, ∇P the pressure gradient along the fracture and u the
fluid velocity within the fracture.


Numerical Upscaling
Various computation methods have recently been implemented to determine the
equivalent permeability tensor of a DFN at the reservoir scale. Whereas some
methods involve a discretization of each fracture into finite elements (Koudine et
al., 1998), we adopt a minimum discretization of the DFN based on fracture
intersections in each sedimentary layer (Bourbiaux et al., 1997) in order to reduce
computation costs. Equivalent permeabilities are then determined as the solutions
of a steady-state single-phase Darcy flow problem involving the transmissivities
between fracture nodes. This approach will be considered as our reference
solution method for all DFNs under consideration in this paper. Even though it is
based on a minimum number of fracture nodes, the numerical up-scaling
procedure remains too CPU-intensive when the density of fractures is high, and
cannot in practice be repeated for each cell of a multi-million-cell full-field flow
model. To overcome that limitation, an analytical approach was implemented as
an alternative solution to the fracture permeability up-scaling problem.


Analytical Upscaling
Starting from the approach of Oda (1985), which considers the fracture network
as a flow continuum, we formulated an analytical expression of the equivalent
fracture permeability based on the parameters underlying the DFN realization,
instead of the actual DFN geometry.
Basic assumptions are a linear pressure gradient in the fracture network and
complete connectivity of the fracture network intersecting the studied cell. This
assumption is also valid for faults and well-connected joints.
Under these assumptions, the local velocities                     u f in each fracture are defined as :
                                               1        cf
                                      uf = −       .              . N f .∇ P                         (2)
                                                       12.e
                                                              f
with N f the unitary projection matrix of the cell-scale pressure gradient, ∇P ,
on the fracture f plane.
Then the identification of the averaged local fluid velocities with the cell scale
Darcy velocity,      U , leads to the equivalent permeability tensor that is:
                                 −1     1 nb _ set nb _ fracS         c f ,s
                K f = −µ.U.∇P =            .                  Vf,s .         .N f ,s
                                      Vcell s =1      f =1           12.ef,s                         (3)

where nb_set is the number of fracture sets, nb_fracs is the number of fractures in
set S, Vcell is the cell volume, V f,s is the fracture volume.


VIII International Geostatistics Congress
M. DELORME et al


This analytical up-scaling method may be applied either to the individual
fractures of the DFN, or by considering the density and direction of the
constitutive fracture sets in the reservoir cell. This latter "statistical" approach
was adopted as it saves considerable computation resources that are spent in the
former "discrete" approach in generating the DFN, quantifying its geometry, and
inverting for the transmissivity matrix.
Unfortunately the continuum models are not always applicable, in particular if the
fracture network is not well connected.


Analysis
The CPU performances of the two above-described methods are very different
since the analytical method consists of the integration of statistical laws whereas
the numerical method requires a lot of network-density-dependent computations
(Figure 1). These performances were compared for series of DFN differing in the
number of constitutive sets, and in the parameters of those sets, such as the mean
value and dispersion of fracture orientations and lengths. Herein, results are given
only for three series of DFN involving two fracture sets with respective average
fracture lengths equal to 4m and 6m. These series differ in the angle θ ij made by
the mean azimuths of the two constitutive sets. The DFN realizations of a given
series differ only in their fracture density.


Figure 1: Comparison of the analytical and numerical methods for upscaling fracture permeability,
both in terms of accuracy and computation cost. A relative error on the analytical results is determined
with respect to the reference numerical method.

Relative errors between the analytical and numerical methods are more important
for low fracture densities; that is when the numerical method has a high CPU-
efficiency. However, the fracture density threshold above which differences are
acceptable varies with the nature of the fracture model, i.e. with the parameters of
the constitutive fracture sets (Figure 1). A simple criterion is needed for selecting
either the analytical or the numerical method. Indeed, determining the upscaled
fracture permeabilities of a full-field flow model requires adopting the analytical
method whenever it is applicable, i.e. in the presence of any well-connected
fracture network, and applying the numerical method to the remaining low-
connectivity-fracture networks.


                                                                       GEOSTATS 2008, Santiago, Chile
GEOSTATISTICAL CONNECTIVITY INDEX


CONNECTIVITY INDEX
As already underlined by Berkowitz (1995), we believe that the geometrical DFN
connectivity is the predominant feature affecting flow and that it can be
quantified as the average number of intersections per fracture of the DFN. The
proposed criteria is then assumed to depend exclusively on geometrical
parameters (orientation, length and density geostatistical laws), thus avoiding the
CPU-intensive generation of representative DFN.


Definition
Although the methodology can be applied to 3D networks, we restrict our
analysis to multi-2D networks with fractures that are orthogonal to the considered
layer and crossing their entire thickness. The reason for that restriction lies in that
petroleum accumulations are most often found in sedimentary basins where the
structure of deposition beds drives the fracturing process, with a propagation of
fractures orthogonally to the bed boundaries. Fracture parameters vary within the
reservoir space but a random distribution of fractures is assumed at a given
reservoir location, i.e. within a given reservoir cell. For diffuse, stochastically-
defined fracture networks, the maximal length of fractures is assumed less than
the characteristic cell length.
Hereafter, a fracture network connectivity index is formulated from the statistical
parameters of the fracture sets at the considered reservoir location.
For each fracture set, denoted by subscript S (S=A or B), geometrical fracture
properties are defined by independent orientation and length probability density
laws, respectively ρ a, s and ρ l , s , with Li,S the mean length , and d s the fracture
density defined as the total length of fractures per area unit. To perform our
demonstration, we split each fracture set into different groups of fractures
according to their orientation. That is, fractures of S having an azimuth
θ ± dθ / 2 belong to the group Gi , s . Their density, d i , s , is then defined by:
  i
                                       d i , s = d s × ρ a , s (θ i ) dθ                        (4)

Considering that fractures are randomly distributed in space, the statistical
elementary surface occupied by a discrete fracture Fi , A of group Gi , A equals:
                                            Sei = Li , A .( d i , A ) −1                        (5)

We can express the cumulative length of fractures of set B and azimuth
θ j making the angle θ ij = θ j − θ i with respect to the fracture Fi , A of group
Gi , A within Sei , as:
                                            Lc j , B = d j , B .Se i                            (6)


VIII International Geostatistics Congress
M. DELORME et al


Figure 2: Definition of the intersection area, between a discrete fracture                Fi , A   of group Gi , A and

any fracture of group    G j , B , with Sei     the elementary surface occupied by                 Fi , A .

The intersection probability between                      Fi , A and any fracture of group G j , B can
then be formulated as the intersection area (Figure 2) divided by                                         Sei :
                                            Li , A .Lc j , B sin(θ ij )                                                  (7)
                                 Pij =                                          = d j , B .Li , A sin(θ ij )
                                                        Sei
Taking into account all the fractures of                              Gi , A and considering that fractures
belonging to the same group cannot intersect, the total number of intersections
between fractures of groups Gi , A and G j , B per surface area unit equals:
                                                                       d i, A
                                              Nc A, B = Pij .                                                            (8)
                                                                       Li , A
If we generalize Equation 8 for a distribution of orientations in each fracture set
and a number, nbset, of fracture sets, we can introduce the dimensionless
analytical connectivity index, Ic, defined as the average number of intersections
divided by the total number of fractures, that is:

                                   nbset             nbset nbset                nbset         −1
                                                                                        di
                        Ic =               Nc ii +                 Nc ij .                                               (9)
                                    i =1              i =1 j = i +1              i =1   Li

with   Ncii and Ncij respectively the number of intersections between fractures of
same set i and fractures of different sets i and j:
                  2Π 2Π
Ncii = d i .
              2
                           ρ a ,i (θ )ρ a ,i ( β ) sin( β − θ ) dβ dθ
                  θ = 0 β >θ
                    2Π 2Π
Ncij = d i d j                 ρ a ,i (θ )ρ a , j ( β ) sin( β − θ ) dβ dθ
                    θ =0 β =0


Analysis
In order to validate the fracture connectivity definition, we generated many DFNs
with one or several fracture sets characterized by various values of their density,

                                                                                        GEOSTATS 2008, Santiago, Chile
GEOSTATISTICAL CONNECTIVITY INDEX


orientation, length statistical laws. The connectivity index of each network was
quantified from the previously-stated index, Ic, and compared with the actual
number of intersections observed in the DFN realization. That extensive study
also led to a valuable data base for analyzing the evolution of the connectivity
with the main fracture sets parameters, like density.
An example is shown below for fracture networks made up of two sets with fixed
parameters, except for their respective orientations. Figure 3 shows the excellent
consistency between the fracture connectivity index function and the actual
connectivity (i.e. the average number of intersections per network fracture)
calculated on the generated networks for different orientations and densities.


Figure 3: Consistency between Ic and the actual connectivity of various networks

Hereafter, we consider again the same two fracture sets for three different angles
θij, but the density is now the variable parameter for DFN realization. The number
of fracture clusters, defined as isolated groups of connected fractures (with more
than two fractures) within the network, is drawn as a function of the connectivity
index (Figure 4). One observes three curves corresponding to the three series of
networks characterized by fixed parameters except for the density. Whatever the
considered series, the number of clusters increases with the fracture connectivity
index and reaches a maximum for a fixed index value, close to 1. Above that
value, the number of clusters decreases as they start to connect, until a single
cluster containing all fractures is obtained. That complete connectivity of the
network corresponds again to a fixed value of the connectivity index, close to 3.


Figure 4: Number of fracture clusters as a function of the connectivity index, Ic: for all the fracture
networks, i.e. whatever the angle in the present example, the maximum number of clusters is observed
for Ic close to 1, then all clusters lump together until a single cluster is obtained for an Ic value close
to 3.

VIII International Geostatistics Congress
M. DELORME et al


Such an analysis was also performed for multiple other series of networks
characterized by various distributions of fracture length and orientation of the
constitutive sets and it led to the same observations regarding the Ic index
concept and threshold values:
- the connectivity index, Ic, quantifies the average number of fracture
intersections per fracture of a given fracture network;
- the fracture network forms a single cluster for an Ic value close to 3.

As illustrated in the following section, these two Ic values constitute threshold
values characterizing the flow behaviour of the network.

Application: Flow Interpretation of Ic
The equivalent permeability of previous fracture networks is now analyzed as a
function of their respective connectivity index.
The equivalent horizontal fracture permeability, KH, was computed using the
reference numerical method described before. KH was defined as the geometrical
mean, K K , of the principal permeabilities, K1 and K2, of the 2D fracture
              1 2
permeability tensor at the model cell scale. The analytical model was also applied
in order to investigate the range of applicability of that method with respect to the
connectivity index value of the network.


Figure 5: KH results as a function of the fracture network density and as a function of Ic values

Consistently with the previous connectivity analysis, non-zero fracture network
permeabilities are obtained for Ic values higher than 1: Ic=1 then characterizes
the percolation threshold, i.e. the minimum connectivity for the network to
become conductive at the cell scale. For such networks, at least one fracture
cluster connects the opposite faces of the cell, with each fracture of that cluster
having 2 intersections. The distance between fracture intersections is then in the
order of fracture size.
Linear evolutions of the permeability with Ic are also observed for Ic values
higher than 3: Ic=3 corresponds to a second permeability threshold, related to the
existence of a unique fracture cluster at the cell scale. At that stage, any increase
of the fracture density, or of Ic, results in a proportional increase of the fracture
network permeability because any added fracture then contributes to the network
permeability in proportion to the additional length of fracture, i.e. density,
brought to the single constitutive cluster of the network.

                                                                       GEOSTATS 2008, Santiago, Chile
GEOSTATISTICAL CONNECTIVITY INDEX


The derivative of the upscaled permeability with respect to the network density is
also represented as a function of Ic in Figure 6, considering both numerical and
analytical upscaling methods. Again, the threshold Ic value for continuum flow
behaviour is apparent. The superposition of analytical slopes to numerical ones
confirms that the analytical method is applicable for networks having a fracture
connectivity index higher than 3, i.e. for networks behaving like flow continua.


Figure 6: Evolution with Ic of the partial derivative of KH with respect to the fracture network density


To end with, the connectivity index of a fracture network as defined herein
appears as a reliable parameter for qualifying its flow behaviour and selecting the
proper upscaling method.


HYBRID UPSCALING FOR FULL-FIELD FLOW MODELS
Previous results give the way to proposing a hybrid methodology for upscaling
the fracture permeability of full-field models. That methodology is simply based
on the fracture connectivity index values determined locally in each cell:
     - Ic<1: no effective fracture permeability computation is required;
     - 1<Ic<3: a numerical effective fracture permeability computation method
         is required;
     - Ic > 3: an analytical continuum approach is applicable.
Such a permeability diagnosis can be made a priori from the fracture network
parameters, without having to simulate that network.
This way, the computation time of full-field up-scaling is optimized in a reliable
way and may be drastically reduced, especially in the case of heterogeneous
fracture distributions over the field.
That methodology is applicable to any reservoir where the 3D fracture network
can be modelled as multi-2D networks. A generalization of that Ic formula would
be required for purely-3D fracture networks, such as the ones found in non-
sedimentary geological frameworks, for which a multi-2D modelling is no more
adapted and convenient.


VIII International Geostatistics Congress
M. DELORME et al


CONCLUSIONS
The assumption that the connectivity of a fracture network is the predominant
driving feature of its flow properties motivates the developments and outcome of
this paper.
A geometrical analysis of synthetic fracture networks confirmed the relevance of
this assumption. A connectivity index was established from the statistical
parameters of fracture sets as might be characterized by the geologist for a given
field case. This index was shown to represent the actual connectivity of the
simulated fracture networks. Furthermore, it was shown to be an efficiently
computed and reliable predictor of the up-scaled network permeability behaviour,
through the use of two threshold values.
These results open the way to an optimized up-scaling methodology of
heterogeneous fractured reservoirs. A fast and reliable connectivity analysis of
the fracture networks drives the choice between numerical and analytical
upscaling methods. Thus, the methodology takes advantage of both the accuracy
of the numerical method for low-connectivity fracture networks, and the CPU
efficiency of the analytical method whenever it is applicable.
Improvements of that upscaling methodology would concern the development of
an extended analytical model, that could be applied to low-connectivity networks,
to further increase the upscaling performance for field models with ever-
increasing resolution or size.

ACKNOWLEDGEMENTS
The authors would like to acknowledge Dr. R. Basquet, presently in Statoil
Company, for the discussions we had to elaborate the connectivity index.

REFERENCES
Berkowitz, B. (1995), Analysis of Fracture Network Connectivity Using Percolation Theory,
    Mathematical Geology Vol. 27 No 4. , 467-483
Bourbiaux, B.; Cacas, M-C; Sarda, S.; Sabathier, J-C.; (1998), A Fast and Efficient Methodology
    to Convert Fractured Reservoir Images into a Dual-Porosity Model, SPE No 38907
    presented at the SPE Ann. Tech. Conf. and Exh., San Antonio, Tx, Oct. 5-8.
Cacas, M.C.; Ledoux, E; de Marsily, G.; Tillie, B.; Barbreau, A.; Durand, E.; Feuga, B.; Peaudecerf,
    P.; (1990) Modeling fracture flow with a sthochastic discrete fracture network: calibration and
    validation., Water Resources Research, 26,3,479-489
Delorme M. and Bourbiaux B.(2007), Méthode pour estimer la perméabilité d'un réseau de fractures
    à partir d’une analyse de connectivité, Patent Application FR07/04.703,
Koudine N., Gonzalez Garcia R., Thovert J.-F. and Adler, (1998) Permeability of Three-Dimensional
    Fracture Networks, Physical Review E, 57, No 4. , 4466-4479.
Oda M. (1985): Permeability tensor for discontinuous Rock Masses, Geotechnique Vol 35, 483-495.
Long, J.C.S. and Witherspoon, P.A. (1985), The Relationship of the degree of interconnection to
    Permeability in Fracture Networks, Journal Of Geophysical Research, Vol 90 NOB4, 3087-3098.


                                                                    GEOSTATS 2008, Santiago, Chile

More Related Content

Viewers also liked

LiDAR and its Use in the Identification of Faults, Fractures and Sub surface ...
LiDAR and its Use in the Identification of Faults, Fractures and Sub surface ...LiDAR and its Use in the Identification of Faults, Fractures and Sub surface ...
LiDAR and its Use in the Identification of Faults, Fractures and Sub surface ...
Chuck Knox
 
Fracaflow
FracaflowFracaflow
Fracaflow
Andi Anriansyah
 
Characterizing, Modelling and Simulating Naturally Fractured Reservoirs - Stu...
Characterizing, Modelling and Simulating Naturally Fractured Reservoirs - Stu...Characterizing, Modelling and Simulating Naturally Fractured Reservoirs - Stu...
Characterizing, Modelling and Simulating Naturally Fractured Reservoirs - Stu...Total Campus
 
Fraca Flow Presentation
Fraca Flow PresentationFraca Flow Presentation
Fraca Flow Presentation
Andi Anriansyah
 
New Method for Simulation Of Fractures
New Method for Simulation Of FracturesNew Method for Simulation Of Fractures
New Method for Simulation Of Fractures
david_schechter
 
Van datajournalistiek naar datajournalisme
Van datajournalistiek naar datajournalismeVan datajournalistiek naar datajournalisme
Van datajournalistiek naar datajournalisme
Arjan Fassed
 
Simple Present
Simple PresentSimple Present
Simple Present
Flavio Barba
 
AGU2012 Social Media
AGU2012 Social MediaAGU2012 Social Media
AGU2012 Social Media
darkskyamee
 
Teamviewer
TeamviewerTeamviewer
ios 5 arc完全指南
ios 5 arc完全指南ios 5 arc完全指南
ios 5 arc完全指南lambokini
 
Ask these 5 awesome questions to win sales
Ask these 5 awesome questions to win salesAsk these 5 awesome questions to win sales
Ask these 5 awesome questions to win salesKUMAR LANG
 
การบริหารงานตามหลักอธิปปไตยในพระพุทธศาสนา๒
การบริหารงานตามหลักอธิปปไตยในพระพุทธศาสนา๒การบริหารงานตามหลักอธิปปไตยในพระพุทธศาสนา๒
การบริหารงานตามหลักอธิปปไตยในพระพุทธศาสนา๒วัดดอนทอง กาฬสินธุ์
 
Colonization of indigenous peoples
Colonization of indigenous peoplesColonization of indigenous peoples
Colonization of indigenous peoplesvgrinb
 
Van datajournalistiek naar datajournalisme
Van datajournalistiek naar datajournalismeVan datajournalistiek naar datajournalisme
Van datajournalistiek naar datajournalisme
Arjan Fassed
 
Activity e Ciclo de Vida de Activity
Activity e Ciclo de Vida de ActivityActivity e Ciclo de Vida de Activity
Activity e Ciclo de Vida de Activity
Messias Batista
 
Cuento
CuentoCuento

Viewers also liked (20)

LiDAR and its Use in the Identification of Faults, Fractures and Sub surface ...
LiDAR and its Use in the Identification of Faults, Fractures and Sub surface ...LiDAR and its Use in the Identification of Faults, Fractures and Sub surface ...
LiDAR and its Use in the Identification of Faults, Fractures and Sub surface ...
 
Fracaflow
FracaflowFracaflow
Fracaflow
 
Characterizing, Modelling and Simulating Naturally Fractured Reservoirs - Stu...
Characterizing, Modelling and Simulating Naturally Fractured Reservoirs - Stu...Characterizing, Modelling and Simulating Naturally Fractured Reservoirs - Stu...
Characterizing, Modelling and Simulating Naturally Fractured Reservoirs - Stu...
 
Fraca Flow Presentation
Fraca Flow PresentationFraca Flow Presentation
Fraca Flow Presentation
 
New Method for Simulation Of Fractures
New Method for Simulation Of FracturesNew Method for Simulation Of Fractures
New Method for Simulation Of Fractures
 
Van datajournalistiek naar datajournalisme
Van datajournalistiek naar datajournalismeVan datajournalistiek naar datajournalisme
Van datajournalistiek naar datajournalisme
 
Log
LogLog
Log
 
Simple Present
Simple PresentSimple Present
Simple Present
 
AGU2012 Social Media
AGU2012 Social MediaAGU2012 Social Media
AGU2012 Social Media
 
Teamviewer
TeamviewerTeamviewer
Teamviewer
 
02essay
02essay02essay
02essay
 
Elizabeth paniccia
Elizabeth panicciaElizabeth paniccia
Elizabeth paniccia
 
ios 5 arc完全指南
ios 5 arc完全指南ios 5 arc完全指南
ios 5 arc完全指南
 
Ask these 5 awesome questions to win sales
Ask these 5 awesome questions to win salesAsk these 5 awesome questions to win sales
Ask these 5 awesome questions to win sales
 
การบริหารงานตามหลักอธิปปไตยในพระพุทธศาสนา๒
การบริหารงานตามหลักอธิปปไตยในพระพุทธศาสนา๒การบริหารงานตามหลักอธิปปไตยในพระพุทธศาสนา๒
การบริหารงานตามหลักอธิปปไตยในพระพุทธศาสนา๒
 
Bata Home
Bata HomeBata Home
Bata Home
 
Colonization of indigenous peoples
Colonization of indigenous peoplesColonization of indigenous peoples
Colonization of indigenous peoples
 
Van datajournalistiek naar datajournalisme
Van datajournalistiek naar datajournalismeVan datajournalistiek naar datajournalisme
Van datajournalistiek naar datajournalisme
 
Activity e Ciclo de Vida de Activity
Activity e Ciclo de Vida de ActivityActivity e Ciclo de Vida de Activity
Activity e Ciclo de Vida de Activity
 
Cuento
CuentoCuento
Cuento
 

Similar to Upscaling Improvement for Heterogeneous Fractured Reservoir Using a Geostatistical Connectivity Index delorme atfeh allken bourbiaux fraca fracaflow

Numerical study on free-surface flow
Numerical study on free-surface flowNumerical study on free-surface flow
Numerical study on free-surface flow
miguelpgomes07
 
Flow Modeling Based Wall Element Technique
Flow Modeling Based Wall Element TechniqueFlow Modeling Based Wall Element Technique
Flow Modeling Based Wall Element Technique
CSCJournals
 
100-423-1-PB.pdf
100-423-1-PB.pdf100-423-1-PB.pdf
100-423-1-PB.pdf
AnimeshKumar787928
 
Comparison of Explicit Finite Difference Model and Galerkin Finite Element Mo...
Comparison of Explicit Finite Difference Model and Galerkin Finite Element Mo...Comparison of Explicit Finite Difference Model and Galerkin Finite Element Mo...
Comparison of Explicit Finite Difference Model and Galerkin Finite Element Mo...
AM Publications
 
Cross-checking of numerical-experimental procedures for interface characteriz...
Cross-checking of numerical-experimental procedures for interface characteriz...Cross-checking of numerical-experimental procedures for interface characteriz...
Cross-checking of numerical-experimental procedures for interface characteriz...
Diego Scarpa
 
Ion Channel Simulations for Potassium, Sodium, Calcium, and Chloride Channels...
Ion Channel Simulations for Potassium, Sodium, Calcium, and Chloride Channels...Ion Channel Simulations for Potassium, Sodium, Calcium, and Chloride Channels...
Ion Channel Simulations for Potassium, Sodium, Calcium, and Chloride Channels...
Iowa State University
 
DonatiFabrizio_IEEEEMBC2014
DonatiFabrizio_IEEEEMBC2014DonatiFabrizio_IEEEEMBC2014
DonatiFabrizio_IEEEEMBC2014Fabrizio Donati
 
INRIA-USFD-KCL- Identification of artery wall stiffness - 2014
INRIA-USFD-KCL- Identification of artery wall stiffness - 2014INRIA-USFD-KCL- Identification of artery wall stiffness - 2014
INRIA-USFD-KCL- Identification of artery wall stiffness - 2014
Cristina Staicu
 
Three modeling of soil erosion by water
Three modeling of soil erosion by waterThree modeling of soil erosion by water
Three modeling of soil erosion by water
IAEME Publication
 
Icmf2016 ghodke apte
Icmf2016 ghodke apteIcmf2016 ghodke apte
Icmf2016 ghodke apte
Chaitanya Ghodke
 
An Efficient Algorithm for Contact Angle Estimation in Molecular Dynamics Sim...
An Efficient Algorithm for Contact Angle Estimation in Molecular Dynamics Sim...An Efficient Algorithm for Contact Angle Estimation in Molecular Dynamics Sim...
An Efficient Algorithm for Contact Angle Estimation in Molecular Dynamics Sim...
CSCJournals
 
08039246
0803924608039246
08039246
Thilip Kumar
 
PDEs Coursework
PDEs CourseworkPDEs Coursework
PDEs CourseworkJawad Khan
 
An Immersed Boundary Method To Solve Flow And Heat Transfer Problems Involvin...
An Immersed Boundary Method To Solve Flow And Heat Transfer Problems Involvin...An Immersed Boundary Method To Solve Flow And Heat Transfer Problems Involvin...
An Immersed Boundary Method To Solve Flow And Heat Transfer Problems Involvin...
Courtney Esco
 
Development, Optimization, and Analysis of Cellular Automaton Algorithms to S...
Development, Optimization, and Analysis of Cellular Automaton Algorithms to S...Development, Optimization, and Analysis of Cellular Automaton Algorithms to S...
Development, Optimization, and Analysis of Cellular Automaton Algorithms to S...
IRJET Journal
 
ANALYSIS OF VORTEX INDUCED VIBRATION USING IFS
ANALYSIS OF VORTEX INDUCED VIBRATION USING IFSANALYSIS OF VORTEX INDUCED VIBRATION USING IFS
ANALYSIS OF VORTEX INDUCED VIBRATION USING IFS
IJCI JOURNAL
 
An Application Of Kriging To Rainfall Network Design
An Application Of Kriging To Rainfall Network DesignAn Application Of Kriging To Rainfall Network Design
An Application Of Kriging To Rainfall Network Design
Scott Bou
 

Similar to Upscaling Improvement for Heterogeneous Fractured Reservoir Using a Geostatistical Connectivity Index delorme atfeh allken bourbiaux fraca fracaflow (20)

Numerical study on free-surface flow
Numerical study on free-surface flowNumerical study on free-surface flow
Numerical study on free-surface flow
 
GaripovTT_Ecmor13
GaripovTT_Ecmor13GaripovTT_Ecmor13
GaripovTT_Ecmor13
 
Flow Modeling Based Wall Element Technique
Flow Modeling Based Wall Element TechniqueFlow Modeling Based Wall Element Technique
Flow Modeling Based Wall Element Technique
 
100-423-1-PB.pdf
100-423-1-PB.pdf100-423-1-PB.pdf
100-423-1-PB.pdf
 
Comparison of Explicit Finite Difference Model and Galerkin Finite Element Mo...
Comparison of Explicit Finite Difference Model and Galerkin Finite Element Mo...Comparison of Explicit Finite Difference Model and Galerkin Finite Element Mo...
Comparison of Explicit Finite Difference Model and Galerkin Finite Element Mo...
 
Cross-checking of numerical-experimental procedures for interface characteriz...
Cross-checking of numerical-experimental procedures for interface characteriz...Cross-checking of numerical-experimental procedures for interface characteriz...
Cross-checking of numerical-experimental procedures for interface characteriz...
 
Ion Channel Simulations for Potassium, Sodium, Calcium, and Chloride Channels...
Ion Channel Simulations for Potassium, Sodium, Calcium, and Chloride Channels...Ion Channel Simulations for Potassium, Sodium, Calcium, and Chloride Channels...
Ion Channel Simulations for Potassium, Sodium, Calcium, and Chloride Channels...
 
pof
pofpof
pof
 
0504006v1
0504006v10504006v1
0504006v1
 
DonatiFabrizio_IEEEEMBC2014
DonatiFabrizio_IEEEEMBC2014DonatiFabrizio_IEEEEMBC2014
DonatiFabrizio_IEEEEMBC2014
 
INRIA-USFD-KCL- Identification of artery wall stiffness - 2014
INRIA-USFD-KCL- Identification of artery wall stiffness - 2014INRIA-USFD-KCL- Identification of artery wall stiffness - 2014
INRIA-USFD-KCL- Identification of artery wall stiffness - 2014
 
Three modeling of soil erosion by water
Three modeling of soil erosion by waterThree modeling of soil erosion by water
Three modeling of soil erosion by water
 
Icmf2016 ghodke apte
Icmf2016 ghodke apteIcmf2016 ghodke apte
Icmf2016 ghodke apte
 
An Efficient Algorithm for Contact Angle Estimation in Molecular Dynamics Sim...
An Efficient Algorithm for Contact Angle Estimation in Molecular Dynamics Sim...An Efficient Algorithm for Contact Angle Estimation in Molecular Dynamics Sim...
An Efficient Algorithm for Contact Angle Estimation in Molecular Dynamics Sim...
 
08039246
0803924608039246
08039246
 
PDEs Coursework
PDEs CourseworkPDEs Coursework
PDEs Coursework
 
An Immersed Boundary Method To Solve Flow And Heat Transfer Problems Involvin...
An Immersed Boundary Method To Solve Flow And Heat Transfer Problems Involvin...An Immersed Boundary Method To Solve Flow And Heat Transfer Problems Involvin...
An Immersed Boundary Method To Solve Flow And Heat Transfer Problems Involvin...
 
Development, Optimization, and Analysis of Cellular Automaton Algorithms to S...
Development, Optimization, and Analysis of Cellular Automaton Algorithms to S...Development, Optimization, and Analysis of Cellular Automaton Algorithms to S...
Development, Optimization, and Analysis of Cellular Automaton Algorithms to S...
 
ANALYSIS OF VORTEX INDUCED VIBRATION USING IFS
ANALYSIS OF VORTEX INDUCED VIBRATION USING IFSANALYSIS OF VORTEX INDUCED VIBRATION USING IFS
ANALYSIS OF VORTEX INDUCED VIBRATION USING IFS
 
An Application Of Kriging To Rainfall Network Design
An Application Of Kriging To Rainfall Network DesignAn Application Of Kriging To Rainfall Network Design
An Application Of Kriging To Rainfall Network Design
 

Recently uploaded

Essentials of Automations: The Art of Triggers and Actions in FME
Essentials of Automations: The Art of Triggers and Actions in FMEEssentials of Automations: The Art of Triggers and Actions in FME
Essentials of Automations: The Art of Triggers and Actions in FME
Safe Software
 
FIDO Alliance Osaka Seminar: FIDO Security Aspects.pdf
FIDO Alliance Osaka Seminar: FIDO Security Aspects.pdfFIDO Alliance Osaka Seminar: FIDO Security Aspects.pdf
FIDO Alliance Osaka Seminar: FIDO Security Aspects.pdf
FIDO Alliance
 
Elevating Tactical DDD Patterns Through Object Calisthenics
Elevating Tactical DDD Patterns Through Object CalisthenicsElevating Tactical DDD Patterns Through Object Calisthenics
Elevating Tactical DDD Patterns Through Object Calisthenics
Dorra BARTAGUIZ
 
Pushing the limits of ePRTC: 100ns holdover for 100 days
Pushing the limits of ePRTC: 100ns holdover for 100 daysPushing the limits of ePRTC: 100ns holdover for 100 days
Pushing the limits of ePRTC: 100ns holdover for 100 days
Adtran
 
DevOps and Testing slides at DASA Connect
DevOps and Testing slides at DASA ConnectDevOps and Testing slides at DASA Connect
DevOps and Testing slides at DASA Connect
Kari Kakkonen
 
LF Energy Webinar: Electrical Grid Modelling and Simulation Through PowSyBl -...
LF Energy Webinar: Electrical Grid Modelling and Simulation Through PowSyBl -...LF Energy Webinar: Electrical Grid Modelling and Simulation Through PowSyBl -...
LF Energy Webinar: Electrical Grid Modelling and Simulation Through PowSyBl -...
DanBrown980551
 
Secstrike : Reverse Engineering & Pwnable tools for CTF.pptx
Secstrike : Reverse Engineering & Pwnable tools for CTF.pptxSecstrike : Reverse Engineering & Pwnable tools for CTF.pptx
Secstrike : Reverse Engineering & Pwnable tools for CTF.pptx
nkrafacyberclub
 
The Future of Platform Engineering
The Future of Platform EngineeringThe Future of Platform Engineering
The Future of Platform Engineering
Jemma Hussein Allen
 
Introduction to CHERI technology - Cybersecurity
Introduction to CHERI technology - CybersecurityIntroduction to CHERI technology - Cybersecurity
Introduction to CHERI technology - Cybersecurity
mikeeftimakis1
 
Observability Concepts EVERY Developer Should Know -- DeveloperWeek Europe.pdf
Observability Concepts EVERY Developer Should Know -- DeveloperWeek Europe.pdfObservability Concepts EVERY Developer Should Know -- DeveloperWeek Europe.pdf
Observability Concepts EVERY Developer Should Know -- DeveloperWeek Europe.pdf
Paige Cruz
 
Enhancing Performance with Globus and the Science DMZ
Enhancing Performance with Globus and the Science DMZEnhancing Performance with Globus and the Science DMZ
Enhancing Performance with Globus and the Science DMZ
Globus
 
GenAISummit 2024 May 28 Sri Ambati Keynote: AGI Belongs to The Community in O...
GenAISummit 2024 May 28 Sri Ambati Keynote: AGI Belongs to The Community in O...GenAISummit 2024 May 28 Sri Ambati Keynote: AGI Belongs to The Community in O...
GenAISummit 2024 May 28 Sri Ambati Keynote: AGI Belongs to The Community in O...
Sri Ambati
 
Encryption in Microsoft 365 - ExpertsLive Netherlands 2024
Encryption in Microsoft 365 - ExpertsLive Netherlands 2024Encryption in Microsoft 365 - ExpertsLive Netherlands 2024
Encryption in Microsoft 365 - ExpertsLive Netherlands 2024
Albert Hoitingh
 
By Design, not by Accident - Agile Venture Bolzano 2024
By Design, not by Accident - Agile Venture Bolzano 2024By Design, not by Accident - Agile Venture Bolzano 2024
By Design, not by Accident - Agile Venture Bolzano 2024
Pierluigi Pugliese
 
Why You Should Replace Windows 11 with Nitrux Linux 3.5.0 for enhanced perfor...
Why You Should Replace Windows 11 with Nitrux Linux 3.5.0 for enhanced perfor...Why You Should Replace Windows 11 with Nitrux Linux 3.5.0 for enhanced perfor...
Why You Should Replace Windows 11 with Nitrux Linux 3.5.0 for enhanced perfor...
SOFTTECHHUB
 
FIDO Alliance Osaka Seminar: The WebAuthn API and Discoverable Credentials.pdf
FIDO Alliance Osaka Seminar: The WebAuthn API and Discoverable Credentials.pdfFIDO Alliance Osaka Seminar: The WebAuthn API and Discoverable Credentials.pdf
FIDO Alliance Osaka Seminar: The WebAuthn API and Discoverable Credentials.pdf
FIDO Alliance
 
Securing your Kubernetes cluster_ a step-by-step guide to success !
Securing your Kubernetes cluster_ a step-by-step guide to success !Securing your Kubernetes cluster_ a step-by-step guide to success !
Securing your Kubernetes cluster_ a step-by-step guide to success !
KatiaHIMEUR1
 
State of ICS and IoT Cyber Threat Landscape Report 2024 preview
State of ICS and IoT Cyber Threat Landscape Report 2024 previewState of ICS and IoT Cyber Threat Landscape Report 2024 preview
State of ICS and IoT Cyber Threat Landscape Report 2024 preview
Prayukth K V
 
A tale of scale & speed: How the US Navy is enabling software delivery from l...
A tale of scale & speed: How the US Navy is enabling software delivery from l...A tale of scale & speed: How the US Navy is enabling software delivery from l...
A tale of scale & speed: How the US Navy is enabling software delivery from l...
sonjaschweigert1
 
The Metaverse and AI: how can decision-makers harness the Metaverse for their...
The Metaverse and AI: how can decision-makers harness the Metaverse for their...The Metaverse and AI: how can decision-makers harness the Metaverse for their...
The Metaverse and AI: how can decision-makers harness the Metaverse for their...
Jen Stirrup
 

Recently uploaded (20)

Essentials of Automations: The Art of Triggers and Actions in FME
Essentials of Automations: The Art of Triggers and Actions in FMEEssentials of Automations: The Art of Triggers and Actions in FME
Essentials of Automations: The Art of Triggers and Actions in FME
 
FIDO Alliance Osaka Seminar: FIDO Security Aspects.pdf
FIDO Alliance Osaka Seminar: FIDO Security Aspects.pdfFIDO Alliance Osaka Seminar: FIDO Security Aspects.pdf
FIDO Alliance Osaka Seminar: FIDO Security Aspects.pdf
 
Elevating Tactical DDD Patterns Through Object Calisthenics
Elevating Tactical DDD Patterns Through Object CalisthenicsElevating Tactical DDD Patterns Through Object Calisthenics
Elevating Tactical DDD Patterns Through Object Calisthenics
 
Pushing the limits of ePRTC: 100ns holdover for 100 days
Pushing the limits of ePRTC: 100ns holdover for 100 daysPushing the limits of ePRTC: 100ns holdover for 100 days
Pushing the limits of ePRTC: 100ns holdover for 100 days
 
DevOps and Testing slides at DASA Connect
DevOps and Testing slides at DASA ConnectDevOps and Testing slides at DASA Connect
DevOps and Testing slides at DASA Connect
 
LF Energy Webinar: Electrical Grid Modelling and Simulation Through PowSyBl -...
LF Energy Webinar: Electrical Grid Modelling and Simulation Through PowSyBl -...LF Energy Webinar: Electrical Grid Modelling and Simulation Through PowSyBl -...
LF Energy Webinar: Electrical Grid Modelling and Simulation Through PowSyBl -...
 
Secstrike : Reverse Engineering & Pwnable tools for CTF.pptx
Secstrike : Reverse Engineering & Pwnable tools for CTF.pptxSecstrike : Reverse Engineering & Pwnable tools for CTF.pptx
Secstrike : Reverse Engineering & Pwnable tools for CTF.pptx
 
The Future of Platform Engineering
The Future of Platform EngineeringThe Future of Platform Engineering
The Future of Platform Engineering
 
Introduction to CHERI technology - Cybersecurity
Introduction to CHERI technology - CybersecurityIntroduction to CHERI technology - Cybersecurity
Introduction to CHERI technology - Cybersecurity
 
Observability Concepts EVERY Developer Should Know -- DeveloperWeek Europe.pdf
Observability Concepts EVERY Developer Should Know -- DeveloperWeek Europe.pdfObservability Concepts EVERY Developer Should Know -- DeveloperWeek Europe.pdf
Observability Concepts EVERY Developer Should Know -- DeveloperWeek Europe.pdf
 
Enhancing Performance with Globus and the Science DMZ
Enhancing Performance with Globus and the Science DMZEnhancing Performance with Globus and the Science DMZ
Enhancing Performance with Globus and the Science DMZ
 
GenAISummit 2024 May 28 Sri Ambati Keynote: AGI Belongs to The Community in O...
GenAISummit 2024 May 28 Sri Ambati Keynote: AGI Belongs to The Community in O...GenAISummit 2024 May 28 Sri Ambati Keynote: AGI Belongs to The Community in O...
GenAISummit 2024 May 28 Sri Ambati Keynote: AGI Belongs to The Community in O...
 
Encryption in Microsoft 365 - ExpertsLive Netherlands 2024
Encryption in Microsoft 365 - ExpertsLive Netherlands 2024Encryption in Microsoft 365 - ExpertsLive Netherlands 2024
Encryption in Microsoft 365 - ExpertsLive Netherlands 2024
 
By Design, not by Accident - Agile Venture Bolzano 2024
By Design, not by Accident - Agile Venture Bolzano 2024By Design, not by Accident - Agile Venture Bolzano 2024
By Design, not by Accident - Agile Venture Bolzano 2024
 
Why You Should Replace Windows 11 with Nitrux Linux 3.5.0 for enhanced perfor...
Why You Should Replace Windows 11 with Nitrux Linux 3.5.0 for enhanced perfor...Why You Should Replace Windows 11 with Nitrux Linux 3.5.0 for enhanced perfor...
Why You Should Replace Windows 11 with Nitrux Linux 3.5.0 for enhanced perfor...
 
FIDO Alliance Osaka Seminar: The WebAuthn API and Discoverable Credentials.pdf
FIDO Alliance Osaka Seminar: The WebAuthn API and Discoverable Credentials.pdfFIDO Alliance Osaka Seminar: The WebAuthn API and Discoverable Credentials.pdf
FIDO Alliance Osaka Seminar: The WebAuthn API and Discoverable Credentials.pdf
 
Securing your Kubernetes cluster_ a step-by-step guide to success !
Securing your Kubernetes cluster_ a step-by-step guide to success !Securing your Kubernetes cluster_ a step-by-step guide to success !
Securing your Kubernetes cluster_ a step-by-step guide to success !
 
State of ICS and IoT Cyber Threat Landscape Report 2024 preview
State of ICS and IoT Cyber Threat Landscape Report 2024 previewState of ICS and IoT Cyber Threat Landscape Report 2024 preview
State of ICS and IoT Cyber Threat Landscape Report 2024 preview
 
A tale of scale & speed: How the US Navy is enabling software delivery from l...
A tale of scale & speed: How the US Navy is enabling software delivery from l...A tale of scale & speed: How the US Navy is enabling software delivery from l...
A tale of scale & speed: How the US Navy is enabling software delivery from l...
 
The Metaverse and AI: how can decision-makers harness the Metaverse for their...
The Metaverse and AI: how can decision-makers harness the Metaverse for their...The Metaverse and AI: how can decision-makers harness the Metaverse for their...
The Metaverse and AI: how can decision-makers harness the Metaverse for their...
 

Upscaling Improvement for Heterogeneous Fractured Reservoir Using a Geostatistical Connectivity Index delorme atfeh allken bourbiaux fraca fracaflow

  • 1. UPSCALING IMPROVEMENT FOR HETEROGENEOUS FRACTURED RESERVOIR USING A GEOSTATISTICAL CONNECTIVITY INDEX M. DELORME, B. ATFEH, V. ALLKEN and B. BOURBIAUX Reservoir Engineering Department, IFP, France . ABSTRACT The connectivity of a fracture network is a crucial parameter to understand how fractures affect the reservoir fluid flow response. We have developed two methods to estimate the equivalent permeability of a fracture network for any cell of a fractured field model. Whereas the numerical method is CPU-intensive but applicable for any fracture network, the continuum analytical method is more rapid but only valid for well-connected fractured media. An innovating connectivity analysis based on geo-statistical laws used in fractured reservoir description is proposed. It consists using a simple fracture network connectivity index to choose the appropriate up-scaling method regarding both the physical exactness/accuracy of solutions and the computation cost. It is formulated in terms of a statistical constitutive fracture sets data function. This explicit index is validated through the comparison of equivalent fracture permeability results computed with either discrete or continuum models. Finally, the paper underlines how that index can be implemented within a combined analytical/numerical up- scaling methodology for setting up reliable flow models of heterogeneous fractured reservoirs with minimized computational resources. INTRODUCTION Characterizing fractured reservoirs and modelling their flow behaviour are necessary not only in petroleum engineering but also for various earth sciences applications. Porous fractured reservoirs have a low matrix permeability such that fractures are the main fluid-conducting medium. Fluids are stored mainly in the matrix porosity and transferred to producing wells via that conductive fracture network. Typical workflows for simulating and predicting the flow behaviour of such reservoirs goes through a characterization of fractures and the construction of comprehensive Discrete Fracture Networks (DFN).
  • 2. M. DELORME et al Fracture characterization is based on all conventional reservoir data sources, including seismic, core analysis, well logs and well tests. Fracture sets can be detected then parameterized in terms of density, orientation, length and conductivity distributions. Subsequently, fracture sets parameters can constitute the input data for the construction of representative DFN that can be used for flow-property calculation. As large and small fractures play different roles in fluid flow, they need to be distinguished. Faults that are often larger than the grid cells size are modelled as a large-scale discrete fault network conditioned by a deterministic seismic-derived fault map. Small-scale fracture models and joint sets are generated randomly in space using fracture set data as input parameters. This modelling methodology is described in Cacas et al (1990) and implemented within FracaFlow , an IFP software. DFN models are generated for two main reservoir simulation objectives. First, they integrate fracture-related data or observations into a representative network that can be further qualified or calibrated in terms of hydraulic conductivities from well test data matching at a fracture size resolution scale, for instance. Secondly, calibrated DFN are used for computing the equivalent fracture permeabilities for subsequent fullfield scale simulations at a hectometric cell size resolution. With such a methodology and tools, the geologist can integrate observations and understanding of the genetic episodes of fracturing into parameterized fracture models. In this paper we assume that fracture-related data are already interpreted and are available. That is, in each reservoir cell, fracture set density, orientation, size and conductivity are characterized from geostatistical distribution laws or models. Starting from this quantitative fracture model, we herein introduce a fracture connectivity analysis method to optimize the reliability and computation efficiency of available techniques for assigning fracture permeability values to full-field model cells. EQUIVALENT FRACTURED MEDIA PERMEABILITY TENSOR Full-field fractured reservoir numerical models consider that flow is taking place within two continua, the fracture medium characterized by equivalent or effective fracture permeabilities specified as cell input parameters, and the matrix medium represented as an array of identical matrix blocks with size and shape also specified as cell input parameters. Herein, fracture flows are modelled using Poiseuille's law (equation 1), with an equivalent hydraulic aperture, eh, defined from the ratio between a conductivity, c, and an average mechanical aperture, e. Whereas e is derived from the fracture network porosity, c is the actual flow parameter that relates the flow rate and the pressure gradient within an individual fracture. eh and e are equal for ideal fractures with parallel walls but do not coincide in practice because of the roughness of fracture walls. 2 1 eh 1 c u=− ∇P = − ∇P (1) 12 12.e GEOSTATS 2008, Santiago, Chile
  • 3. GEOSTATISTICAL CONNECTIVITY INDEX with µ the fluid viscosity, ∇P the pressure gradient along the fracture and u the fluid velocity within the fracture. Numerical Upscaling Various computation methods have recently been implemented to determine the equivalent permeability tensor of a DFN at the reservoir scale. Whereas some methods involve a discretization of each fracture into finite elements (Koudine et al., 1998), we adopt a minimum discretization of the DFN based on fracture intersections in each sedimentary layer (Bourbiaux et al., 1997) in order to reduce computation costs. Equivalent permeabilities are then determined as the solutions of a steady-state single-phase Darcy flow problem involving the transmissivities between fracture nodes. This approach will be considered as our reference solution method for all DFNs under consideration in this paper. Even though it is based on a minimum number of fracture nodes, the numerical up-scaling procedure remains too CPU-intensive when the density of fractures is high, and cannot in practice be repeated for each cell of a multi-million-cell full-field flow model. To overcome that limitation, an analytical approach was implemented as an alternative solution to the fracture permeability up-scaling problem. Analytical Upscaling Starting from the approach of Oda (1985), which considers the fracture network as a flow continuum, we formulated an analytical expression of the equivalent fracture permeability based on the parameters underlying the DFN realization, instead of the actual DFN geometry. Basic assumptions are a linear pressure gradient in the fracture network and complete connectivity of the fracture network intersecting the studied cell. This assumption is also valid for faults and well-connected joints. Under these assumptions, the local velocities u f in each fracture are defined as : 1 cf uf = − . . N f .∇ P (2) 12.e f with N f the unitary projection matrix of the cell-scale pressure gradient, ∇P , on the fracture f plane. Then the identification of the averaged local fluid velocities with the cell scale Darcy velocity, U , leads to the equivalent permeability tensor that is: −1 1 nb _ set nb _ fracS c f ,s K f = −µ.U.∇P = . Vf,s . .N f ,s Vcell s =1 f =1 12.ef,s (3) where nb_set is the number of fracture sets, nb_fracs is the number of fractures in set S, Vcell is the cell volume, V f,s is the fracture volume. VIII International Geostatistics Congress
  • 4. M. DELORME et al This analytical up-scaling method may be applied either to the individual fractures of the DFN, or by considering the density and direction of the constitutive fracture sets in the reservoir cell. This latter "statistical" approach was adopted as it saves considerable computation resources that are spent in the former "discrete" approach in generating the DFN, quantifying its geometry, and inverting for the transmissivity matrix. Unfortunately the continuum models are not always applicable, in particular if the fracture network is not well connected. Analysis The CPU performances of the two above-described methods are very different since the analytical method consists of the integration of statistical laws whereas the numerical method requires a lot of network-density-dependent computations (Figure 1). These performances were compared for series of DFN differing in the number of constitutive sets, and in the parameters of those sets, such as the mean value and dispersion of fracture orientations and lengths. Herein, results are given only for three series of DFN involving two fracture sets with respective average fracture lengths equal to 4m and 6m. These series differ in the angle θ ij made by the mean azimuths of the two constitutive sets. The DFN realizations of a given series differ only in their fracture density. Figure 1: Comparison of the analytical and numerical methods for upscaling fracture permeability, both in terms of accuracy and computation cost. A relative error on the analytical results is determined with respect to the reference numerical method. Relative errors between the analytical and numerical methods are more important for low fracture densities; that is when the numerical method has a high CPU- efficiency. However, the fracture density threshold above which differences are acceptable varies with the nature of the fracture model, i.e. with the parameters of the constitutive fracture sets (Figure 1). A simple criterion is needed for selecting either the analytical or the numerical method. Indeed, determining the upscaled fracture permeabilities of a full-field flow model requires adopting the analytical method whenever it is applicable, i.e. in the presence of any well-connected fracture network, and applying the numerical method to the remaining low- connectivity-fracture networks. GEOSTATS 2008, Santiago, Chile
  • 5. GEOSTATISTICAL CONNECTIVITY INDEX CONNECTIVITY INDEX As already underlined by Berkowitz (1995), we believe that the geometrical DFN connectivity is the predominant feature affecting flow and that it can be quantified as the average number of intersections per fracture of the DFN. The proposed criteria is then assumed to depend exclusively on geometrical parameters (orientation, length and density geostatistical laws), thus avoiding the CPU-intensive generation of representative DFN. Definition Although the methodology can be applied to 3D networks, we restrict our analysis to multi-2D networks with fractures that are orthogonal to the considered layer and crossing their entire thickness. The reason for that restriction lies in that petroleum accumulations are most often found in sedimentary basins where the structure of deposition beds drives the fracturing process, with a propagation of fractures orthogonally to the bed boundaries. Fracture parameters vary within the reservoir space but a random distribution of fractures is assumed at a given reservoir location, i.e. within a given reservoir cell. For diffuse, stochastically- defined fracture networks, the maximal length of fractures is assumed less than the characteristic cell length. Hereafter, a fracture network connectivity index is formulated from the statistical parameters of the fracture sets at the considered reservoir location. For each fracture set, denoted by subscript S (S=A or B), geometrical fracture properties are defined by independent orientation and length probability density laws, respectively ρ a, s and ρ l , s , with Li,S the mean length , and d s the fracture density defined as the total length of fractures per area unit. To perform our demonstration, we split each fracture set into different groups of fractures according to their orientation. That is, fractures of S having an azimuth θ ± dθ / 2 belong to the group Gi , s . Their density, d i , s , is then defined by: i d i , s = d s × ρ a , s (θ i ) dθ (4) Considering that fractures are randomly distributed in space, the statistical elementary surface occupied by a discrete fracture Fi , A of group Gi , A equals: Sei = Li , A .( d i , A ) −1 (5) We can express the cumulative length of fractures of set B and azimuth θ j making the angle θ ij = θ j − θ i with respect to the fracture Fi , A of group Gi , A within Sei , as: Lc j , B = d j , B .Se i (6) VIII International Geostatistics Congress
  • 6. M. DELORME et al Figure 2: Definition of the intersection area, between a discrete fracture Fi , A of group Gi , A and any fracture of group G j , B , with Sei the elementary surface occupied by Fi , A . The intersection probability between Fi , A and any fracture of group G j , B can then be formulated as the intersection area (Figure 2) divided by Sei : Li , A .Lc j , B sin(θ ij ) (7) Pij = = d j , B .Li , A sin(θ ij ) Sei Taking into account all the fractures of Gi , A and considering that fractures belonging to the same group cannot intersect, the total number of intersections between fractures of groups Gi , A and G j , B per surface area unit equals: d i, A Nc A, B = Pij . (8) Li , A If we generalize Equation 8 for a distribution of orientations in each fracture set and a number, nbset, of fracture sets, we can introduce the dimensionless analytical connectivity index, Ic, defined as the average number of intersections divided by the total number of fractures, that is: nbset nbset nbset nbset −1 di Ic = Nc ii + Nc ij . (9) i =1 i =1 j = i +1 i =1 Li with Ncii and Ncij respectively the number of intersections between fractures of same set i and fractures of different sets i and j: 2Π 2Π Ncii = d i . 2 ρ a ,i (θ )ρ a ,i ( β ) sin( β − θ ) dβ dθ θ = 0 β >θ 2Π 2Π Ncij = d i d j ρ a ,i (θ )ρ a , j ( β ) sin( β − θ ) dβ dθ θ =0 β =0 Analysis In order to validate the fracture connectivity definition, we generated many DFNs with one or several fracture sets characterized by various values of their density, GEOSTATS 2008, Santiago, Chile
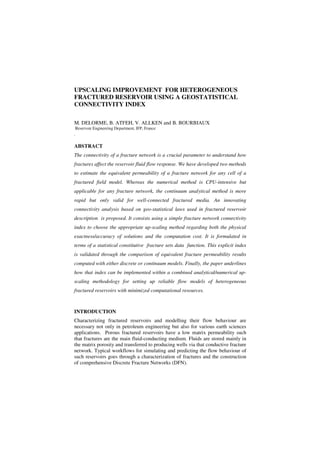
  • 7. GEOSTATISTICAL CONNECTIVITY INDEX orientation, length statistical laws. The connectivity index of each network was quantified from the previously-stated index, Ic, and compared with the actual number of intersections observed in the DFN realization. That extensive study also led to a valuable data base for analyzing the evolution of the connectivity with the main fracture sets parameters, like density. An example is shown below for fracture networks made up of two sets with fixed parameters, except for their respective orientations. Figure 3 shows the excellent consistency between the fracture connectivity index function and the actual connectivity (i.e. the average number of intersections per network fracture) calculated on the generated networks for different orientations and densities. Figure 3: Consistency between Ic and the actual connectivity of various networks Hereafter, we consider again the same two fracture sets for three different angles θij, but the density is now the variable parameter for DFN realization. The number of fracture clusters, defined as isolated groups of connected fractures (with more than two fractures) within the network, is drawn as a function of the connectivity index (Figure 4). One observes three curves corresponding to the three series of networks characterized by fixed parameters except for the density. Whatever the considered series, the number of clusters increases with the fracture connectivity index and reaches a maximum for a fixed index value, close to 1. Above that value, the number of clusters decreases as they start to connect, until a single cluster containing all fractures is obtained. That complete connectivity of the network corresponds again to a fixed value of the connectivity index, close to 3. Figure 4: Number of fracture clusters as a function of the connectivity index, Ic: for all the fracture networks, i.e. whatever the angle in the present example, the maximum number of clusters is observed for Ic close to 1, then all clusters lump together until a single cluster is obtained for an Ic value close to 3. VIII International Geostatistics Congress
  • 8. M. DELORME et al Such an analysis was also performed for multiple other series of networks characterized by various distributions of fracture length and orientation of the constitutive sets and it led to the same observations regarding the Ic index concept and threshold values: - the connectivity index, Ic, quantifies the average number of fracture intersections per fracture of a given fracture network; - the fracture network forms a single cluster for an Ic value close to 3. As illustrated in the following section, these two Ic values constitute threshold values characterizing the flow behaviour of the network. Application: Flow Interpretation of Ic The equivalent permeability of previous fracture networks is now analyzed as a function of their respective connectivity index. The equivalent horizontal fracture permeability, KH, was computed using the reference numerical method described before. KH was defined as the geometrical mean, K K , of the principal permeabilities, K1 and K2, of the 2D fracture 1 2 permeability tensor at the model cell scale. The analytical model was also applied in order to investigate the range of applicability of that method with respect to the connectivity index value of the network. Figure 5: KH results as a function of the fracture network density and as a function of Ic values Consistently with the previous connectivity analysis, non-zero fracture network permeabilities are obtained for Ic values higher than 1: Ic=1 then characterizes the percolation threshold, i.e. the minimum connectivity for the network to become conductive at the cell scale. For such networks, at least one fracture cluster connects the opposite faces of the cell, with each fracture of that cluster having 2 intersections. The distance between fracture intersections is then in the order of fracture size. Linear evolutions of the permeability with Ic are also observed for Ic values higher than 3: Ic=3 corresponds to a second permeability threshold, related to the existence of a unique fracture cluster at the cell scale. At that stage, any increase of the fracture density, or of Ic, results in a proportional increase of the fracture network permeability because any added fracture then contributes to the network permeability in proportion to the additional length of fracture, i.e. density, brought to the single constitutive cluster of the network. GEOSTATS 2008, Santiago, Chile
  • 9. GEOSTATISTICAL CONNECTIVITY INDEX The derivative of the upscaled permeability with respect to the network density is also represented as a function of Ic in Figure 6, considering both numerical and analytical upscaling methods. Again, the threshold Ic value for continuum flow behaviour is apparent. The superposition of analytical slopes to numerical ones confirms that the analytical method is applicable for networks having a fracture connectivity index higher than 3, i.e. for networks behaving like flow continua. Figure 6: Evolution with Ic of the partial derivative of KH with respect to the fracture network density To end with, the connectivity index of a fracture network as defined herein appears as a reliable parameter for qualifying its flow behaviour and selecting the proper upscaling method. HYBRID UPSCALING FOR FULL-FIELD FLOW MODELS Previous results give the way to proposing a hybrid methodology for upscaling the fracture permeability of full-field models. That methodology is simply based on the fracture connectivity index values determined locally in each cell: - Ic<1: no effective fracture permeability computation is required; - 1<Ic<3: a numerical effective fracture permeability computation method is required; - Ic > 3: an analytical continuum approach is applicable. Such a permeability diagnosis can be made a priori from the fracture network parameters, without having to simulate that network. This way, the computation time of full-field up-scaling is optimized in a reliable way and may be drastically reduced, especially in the case of heterogeneous fracture distributions over the field. That methodology is applicable to any reservoir where the 3D fracture network can be modelled as multi-2D networks. A generalization of that Ic formula would be required for purely-3D fracture networks, such as the ones found in non- sedimentary geological frameworks, for which a multi-2D modelling is no more adapted and convenient. VIII International Geostatistics Congress
  • 10. M. DELORME et al CONCLUSIONS The assumption that the connectivity of a fracture network is the predominant driving feature of its flow properties motivates the developments and outcome of this paper. A geometrical analysis of synthetic fracture networks confirmed the relevance of this assumption. A connectivity index was established from the statistical parameters of fracture sets as might be characterized by the geologist for a given field case. This index was shown to represent the actual connectivity of the simulated fracture networks. Furthermore, it was shown to be an efficiently computed and reliable predictor of the up-scaled network permeability behaviour, through the use of two threshold values. These results open the way to an optimized up-scaling methodology of heterogeneous fractured reservoirs. A fast and reliable connectivity analysis of the fracture networks drives the choice between numerical and analytical upscaling methods. Thus, the methodology takes advantage of both the accuracy of the numerical method for low-connectivity fracture networks, and the CPU efficiency of the analytical method whenever it is applicable. Improvements of that upscaling methodology would concern the development of an extended analytical model, that could be applied to low-connectivity networks, to further increase the upscaling performance for field models with ever- increasing resolution or size. ACKNOWLEDGEMENTS The authors would like to acknowledge Dr. R. Basquet, presently in Statoil Company, for the discussions we had to elaborate the connectivity index. REFERENCES Berkowitz, B. (1995), Analysis of Fracture Network Connectivity Using Percolation Theory, Mathematical Geology Vol. 27 No 4. , 467-483 Bourbiaux, B.; Cacas, M-C; Sarda, S.; Sabathier, J-C.; (1998), A Fast and Efficient Methodology to Convert Fractured Reservoir Images into a Dual-Porosity Model, SPE No 38907 presented at the SPE Ann. Tech. Conf. and Exh., San Antonio, Tx, Oct. 5-8. Cacas, M.C.; Ledoux, E; de Marsily, G.; Tillie, B.; Barbreau, A.; Durand, E.; Feuga, B.; Peaudecerf, P.; (1990) Modeling fracture flow with a sthochastic discrete fracture network: calibration and validation., Water Resources Research, 26,3,479-489 Delorme M. and Bourbiaux B.(2007), Méthode pour estimer la perméabilité d'un réseau de fractures à partir d’une analyse de connectivité, Patent Application FR07/04.703, Koudine N., Gonzalez Garcia R., Thovert J.-F. and Adler, (1998) Permeability of Three-Dimensional Fracture Networks, Physical Review E, 57, No 4. , 4466-4479. Oda M. (1985): Permeability tensor for discontinuous Rock Masses, Geotechnique Vol 35, 483-495. Long, J.C.S. and Witherspoon, P.A. (1985), The Relationship of the degree of interconnection to Permeability in Fracture Networks, Journal Of Geophysical Research, Vol 90 NOB4, 3087-3098. GEOSTATS 2008, Santiago, Chile