Download to read offline


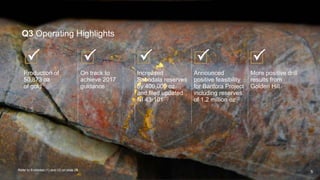
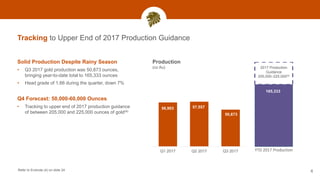
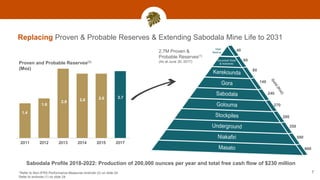
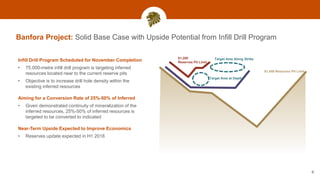

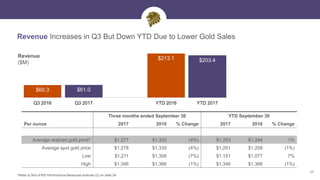
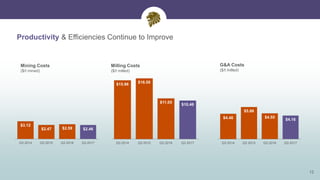
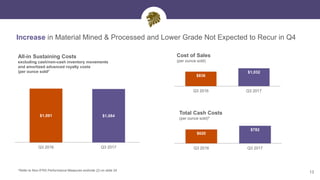
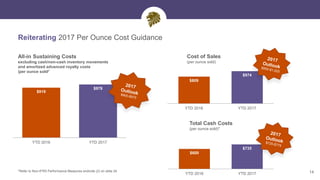
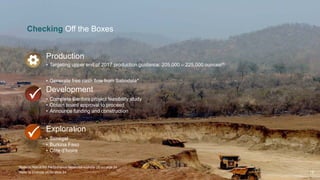
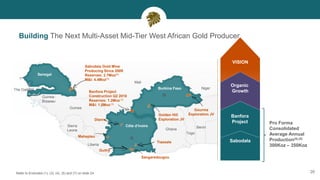


Teranga reported its Q3 2017 highlights. Production for Q3 was 50,873 ounces of gold, keeping the company on track to achieve its 2017 guidance range of 205,000 to 225,000 ounces. Teranga also increased reserves at its Sabodala mine by 400,000 ounces. A feasibility study for the company's Banfora project showed reserves of 1.2 million ounces. Cost improvements continued with mining costs per tonne mined and milling costs per tonne milled decreasing compared to Q3 2016. Revenue was up for Q3 but down year-to-date due to lower gold sales, while cash flows from operations increased.


