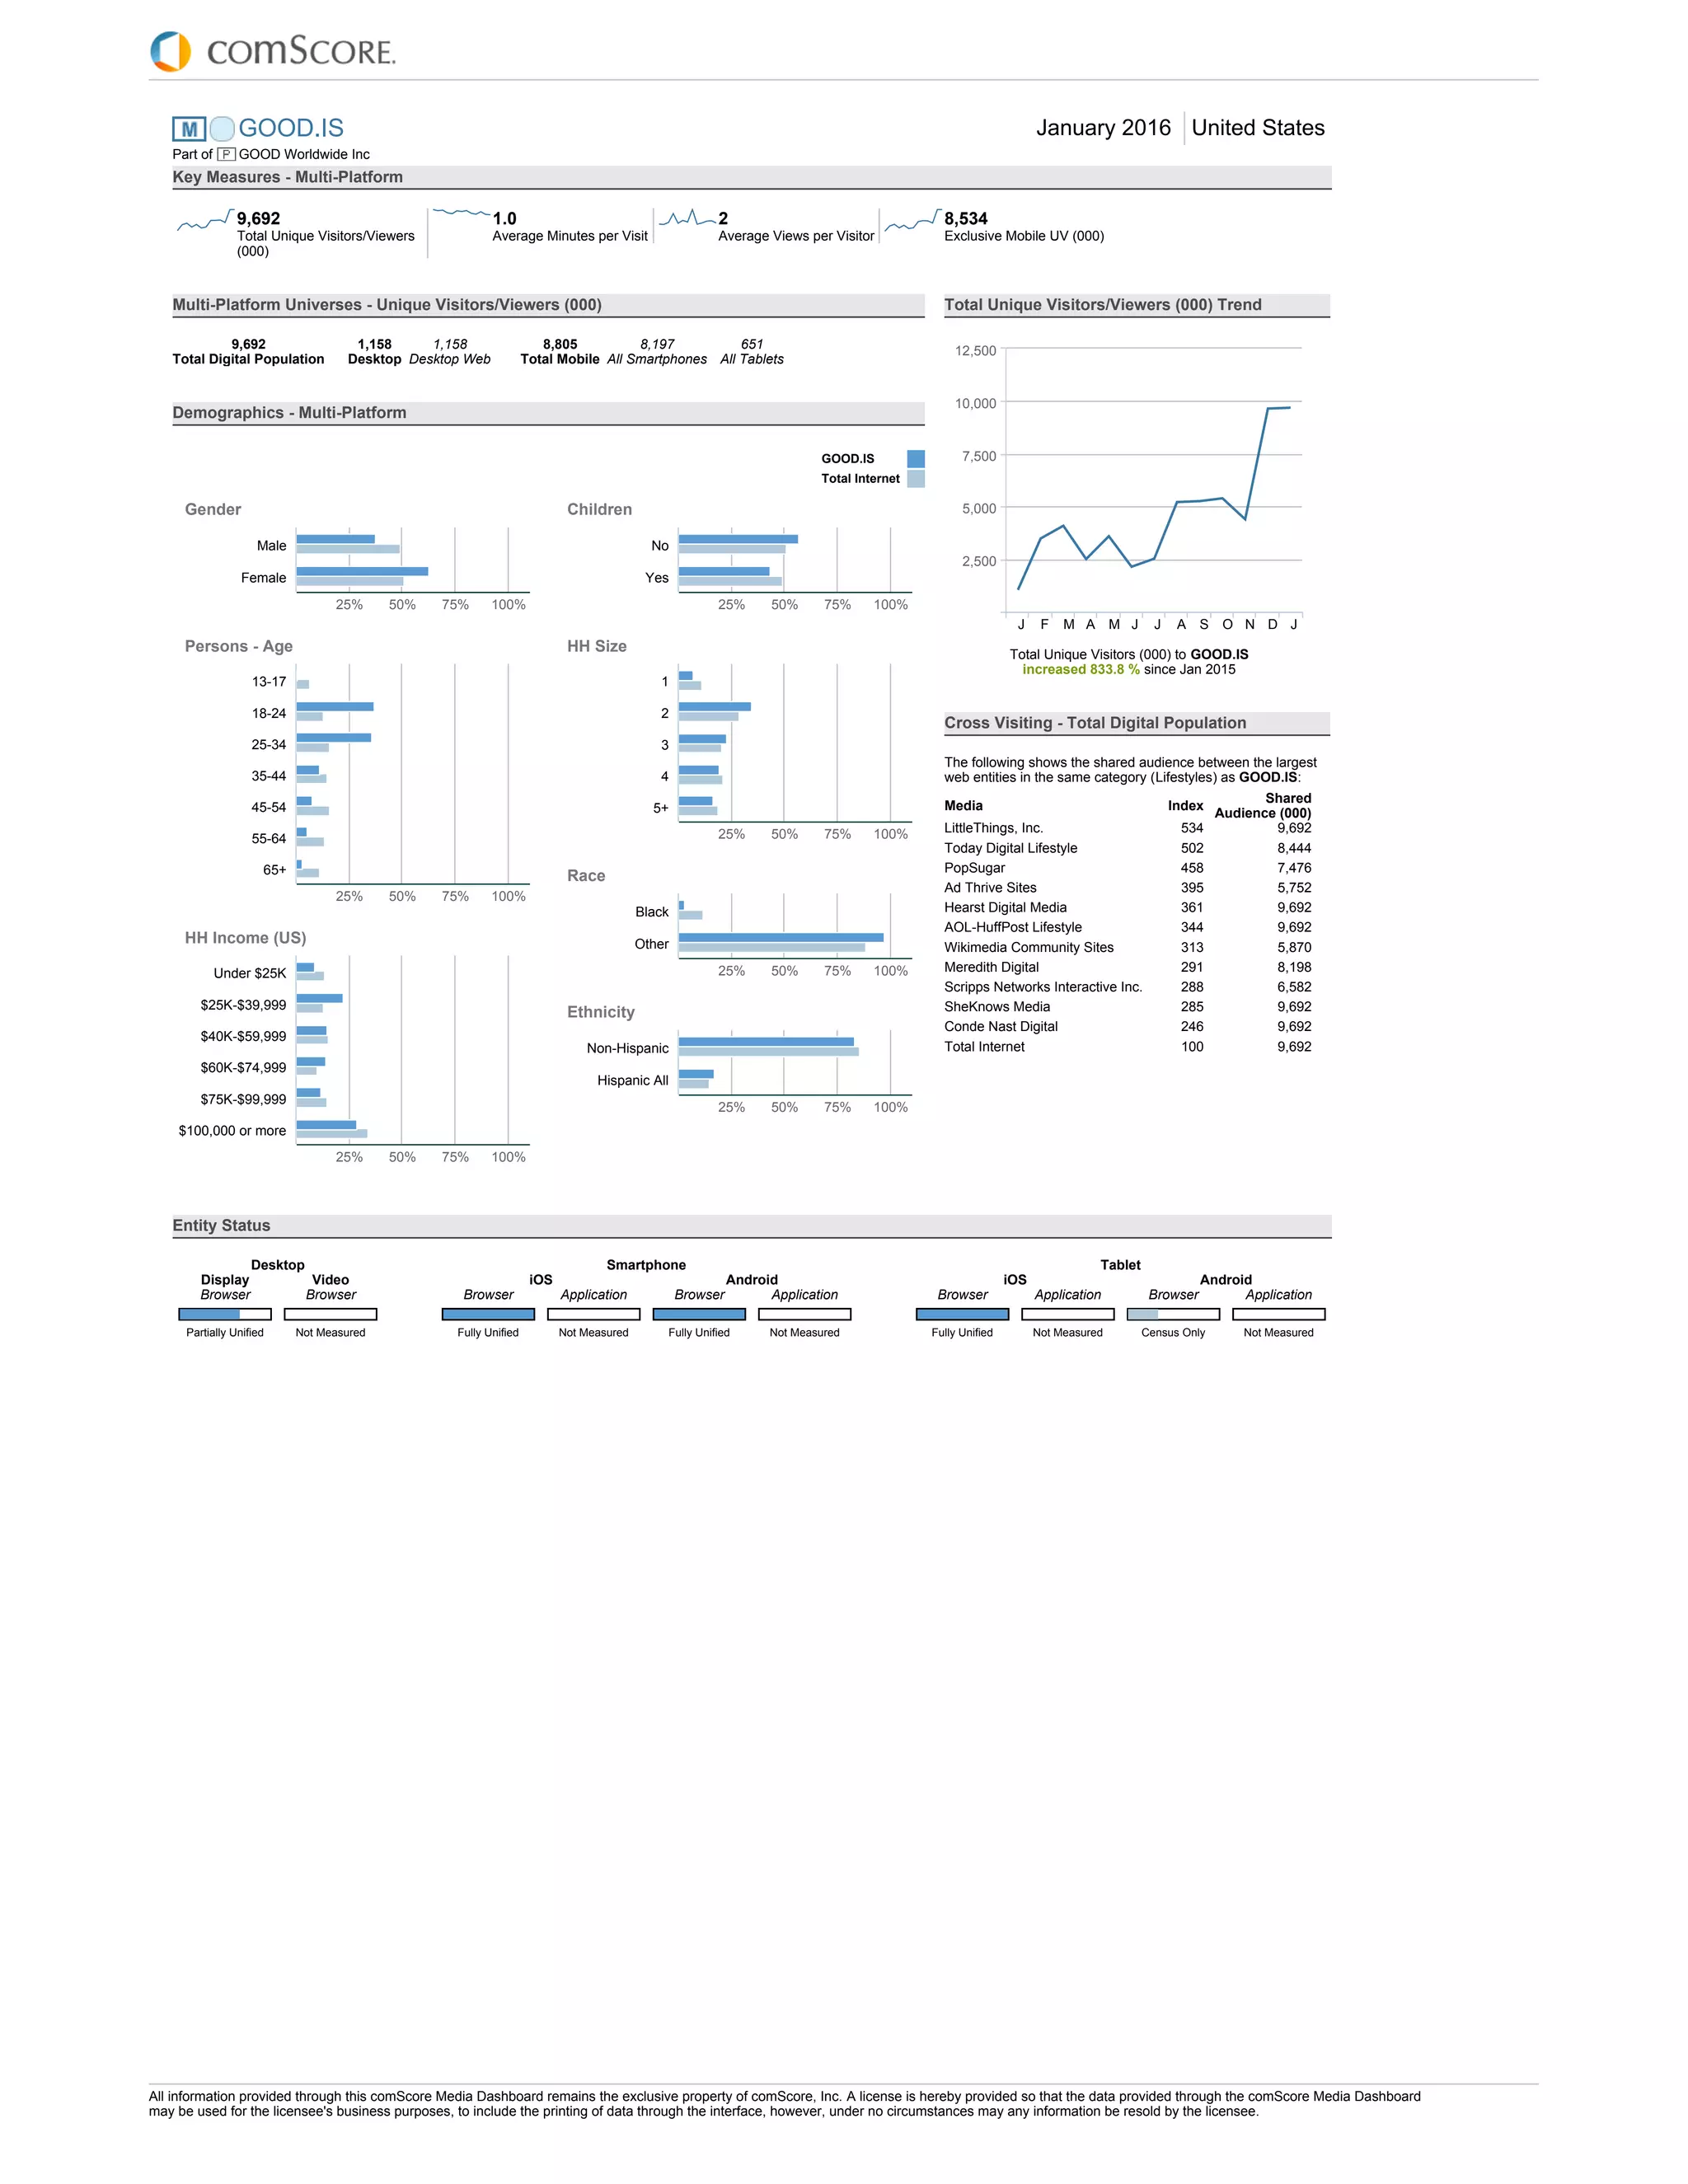
GOOD.IS January 2016 United States
Part of GOOD Worldwide Inc
Key Measures - Multi-Platform
9,692
Total Unique Visitors/Viewers
(000)
1.0
Average Minutes per Visit
2
Average Views per Visitor
8,534
Exclusive Mobile UV (000)
Multi-Platform Universes - Unique Visitors/Viewers (000)
9,692
Total Digital Population
1,158 1,158
Desktop Desktop Web
8,805 8,197 651
Total Mobile All Smartphones All Tablets
Demographics - Multi-Platform
GOOD.IS
Total Internet
Gender
25% 50% 75% 100%
Male
Female
Persons - Age
25% 50% 75% 100%
13-17
18-24
25-34
35-44
45-54
55-64
65+
HH Income (US)
25% 50% 75% 100%
Under $25K
$25K-$39,999
$40K-$59,999
$60K-$74,999
$75K-$99,999
$100,000 or more
Children
25% 50% 75% 100%
No
Yes
HH Size
25% 50% 75% 100%
1
2
3
4
5+
Race
25% 50% 75% 100%
Black
Other
Ethnicity
25% 50% 75% 100%
Non-Hispanic
Hispanic All
Total Unique Visitors/Viewers (000) Trend
2,500
5,000
7,500
10,000
12,500
J F M A M J J A S O N D J
Total Unique Visitors (000) to GOOD.IS
increased 833.8 % since Jan 2015
Cross Visiting - Total Digital Population
The following shows the shared audience between the largest
web entities in the same category (Lifestyles) as GOOD.IS:
LittleThings, Inc.
Today Digital Lifestyle
PopSugar
Ad Thrive Sites
Hearst Digital Media
AOL-HuffPost Lifestyle
Wikimedia Community Sites
Meredith Digital
Scripps Networks Interactive Inc.
SheKnows Media
Conde Nast Digital
Total Internet
Media Index
Shared
Audience (000)
534 9,692
502 8,444
458 7,476
395 5,752
361 9,692
344 9,692
313 5,870
291 8,198
288 6,582
285 9,692
246 9,692
100 9,692
Entity Status
Desktop
Display Video
Browser Browser
Partially Unified Not Measured
Smartphone
iOS Android
Browser Application Browser Application
Fully Unified Not Measured Fully Unified Not Measured
Tablet
iOS Android
Browser Application Browser Application
Fully Unified Not Measured Census Only Not Measured
All information provided through this comScore Media Dashboard remains the exclusive property of comScore, Inc. A license is hereby provided so that the data provided through the comScore Media Dashboard
may be used for the licensee's business purposes, to include the printing of data through the interface, however, under no circumstances may any information be resold by the licensee.
Key Measures - Multi-Platform
This module provides a quick view of key measures to help understand the selected entity. With each data point, we also provide a quick view of the previous thirteen months
trend.
Demographics - Multi-Platform
This module shows the profile of visitors to a media entity by various demographic breaks and compares it to the total internet. In each chart, the row with the highest % comp
UV is highlighted.
Total Unique Visitors/Viewers (000) Trend
This module shows the historical trend of Unique Visitors/Viewers visiting the media entity by month for the selected geography and year-over-year change for the current
month. The row with the highest UV count is highlighted.
Cross Visiting - Total Digital Population
This module shows the top ten entities in the same category that have the largest shared audience with the selected entity. This information can be utilized for planning
marketing strategies, co-brands and partnerships, as well as evaluating the audience on competitor sites.
Entity Status
This module shows the tagging status of the media entity by individual platform for the current month.
All information provided through this comScore Media Dashboard remains the exclusive property of comScore, Inc. A license is hereby provided so that the data provided through the comScore Media Dashboard
may be used for the licensee's business purposes, to include the printing of data through the interface, however, under no circumstances may any information be resold by the licensee.

comScore Multi Platform DashboardGOOD.ISJanuary 2016

  • 1.
    GOOD.IS January 2016United States Part of GOOD Worldwide Inc Key Measures - Multi-Platform 9,692 Total Unique Visitors/Viewers (000) 1.0 Average Minutes per Visit 2 Average Views per Visitor 8,534 Exclusive Mobile UV (000) Multi-Platform Universes - Unique Visitors/Viewers (000) 9,692 Total Digital Population 1,158 1,158 Desktop Desktop Web 8,805 8,197 651 Total Mobile All Smartphones All Tablets Demographics - Multi-Platform GOOD.IS Total Internet Gender 25% 50% 75% 100% Male Female Persons - Age 25% 50% 75% 100% 13-17 18-24 25-34 35-44 45-54 55-64 65+ HH Income (US) 25% 50% 75% 100% Under $25K $25K-$39,999 $40K-$59,999 $60K-$74,999 $75K-$99,999 $100,000 or more Children 25% 50% 75% 100% No Yes HH Size 25% 50% 75% 100% 1 2 3 4 5+ Race 25% 50% 75% 100% Black Other Ethnicity 25% 50% 75% 100% Non-Hispanic Hispanic All Total Unique Visitors/Viewers (000) Trend 2,500 5,000 7,500 10,000 12,500 J F M A M J J A S O N D J Total Unique Visitors (000) to GOOD.IS increased 833.8 % since Jan 2015 Cross Visiting - Total Digital Population The following shows the shared audience between the largest web entities in the same category (Lifestyles) as GOOD.IS: LittleThings, Inc. Today Digital Lifestyle PopSugar Ad Thrive Sites Hearst Digital Media AOL-HuffPost Lifestyle Wikimedia Community Sites Meredith Digital Scripps Networks Interactive Inc. SheKnows Media Conde Nast Digital Total Internet Media Index Shared Audience (000) 534 9,692 502 8,444 458 7,476 395 5,752 361 9,692 344 9,692 313 5,870 291 8,198 288 6,582 285 9,692 246 9,692 100 9,692 Entity Status Desktop Display Video Browser Browser Partially Unified Not Measured Smartphone iOS Android Browser Application Browser Application Fully Unified Not Measured Fully Unified Not Measured Tablet iOS Android Browser Application Browser Application Fully Unified Not Measured Census Only Not Measured All information provided through this comScore Media Dashboard remains the exclusive property of comScore, Inc. A license is hereby provided so that the data provided through the comScore Media Dashboard may be used for the licensee's business purposes, to include the printing of data through the interface, however, under no circumstances may any information be resold by the licensee.
  • 2.
    Key Measures -Multi-Platform This module provides a quick view of key measures to help understand the selected entity. With each data point, we also provide a quick view of the previous thirteen months trend. Demographics - Multi-Platform This module shows the profile of visitors to a media entity by various demographic breaks and compares it to the total internet. In each chart, the row with the highest % comp UV is highlighted. Total Unique Visitors/Viewers (000) Trend This module shows the historical trend of Unique Visitors/Viewers visiting the media entity by month for the selected geography and year-over-year change for the current month. The row with the highest UV count is highlighted. Cross Visiting - Total Digital Population This module shows the top ten entities in the same category that have the largest shared audience with the selected entity. This information can be utilized for planning marketing strategies, co-brands and partnerships, as well as evaluating the audience on competitor sites. Entity Status This module shows the tagging status of the media entity by individual platform for the current month. All information provided through this comScore Media Dashboard remains the exclusive property of comScore, Inc. A license is hereby provided so that the data provided through the comScore Media Dashboard may be used for the licensee's business purposes, to include the printing of data through the interface, however, under no circumstances may any information be resold by the licensee.