
Recommended
Recommended
More Related Content
Similar to Computer Science Presentation for various MATLAB toolboxes
Similar to Computer Science Presentation for various MATLAB toolboxes (20)
Recently uploaded
Recently uploaded (20)
Computer Science Presentation for various MATLAB toolboxes
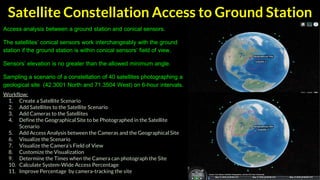
- 1. Satellite Constellation Access to Ground Station Access analysis between a ground station and conical sensors. The satellites’ conical sensors work interchangeably with the ground station if the ground station is within conical sensors’ field of view. Sensors’ elevation is no greater than the allowed minimum angle. Sampling a scenario of a constellation of 40 satellites photographing a geological site (42.3001 North and 71.3504 West) on 6-hour intervals. Workflow: 1. Create a Satellite Scenario 2. Add Satellites to the Satellite Scenario 3. Add Cameras to the Satellites 4. Define the Geographical Site to be Photographed in the Satellite Scenario 5. Add Access Analysis between the Cameras and the Geographical Site 6. Visualize the Scenario 7. Visualize the Camera’s Field of View 8. Customize the Visualization 9. Determine the Times when the Camera can photograph the Site 10. Calculate System-Wide Access Percentage 11. Improve Percentage by camera-tracking the site
- 2. Modified Code 1. Change the date of the SatelliteScenario 2. Change the latitude and longitude of the geological site from default to Area 51 3. Add cameras to satellite #40, #17, and #1 4. Change the color of the contact line to yellow 5. Change the field of view contour so they’re no longer
- 3. Analyze Access between a Satellite Constellation and an Aircraft This reference application gives example of how to model and visualize a mission scenario of the WalkerDelta method of satelliteScenario Object interact with an aircraft Workflow: Define Mission Start Date and Duration Load the Aircraft Trajectory Add the Aircraft to a New Satellite Scenario Add a Walker-Delta Constellation to the Satellite Scenario Add Sensors to the Constellation Configure the Constellation to Point at the Aircraft Determine the Satellite-to-Aircraft Access Intervals Calculate System-Wide Access Percentage Animate the Satellite Scenario
- 4. Create Satellite Scenario Assume that the path through the large constellation to establish access between two ground stations must be determined as of 10 December 2021, 6:27:57 PM UTC Multi-Hop Path Selection Through Large Satellite Constellation This reference application shows how to determine the path through a large constellation consisting of 1000 low-Earth orbit (LEO) satellites to access between 2 ground stations, then how to calculate the intervals of 3-hour period on this path. Add Large Constellation of Satellites large satellite constellation from the Two-Line- Element (TLE) file consists of 1,000 LEO satellites. Work Flow 1. Define the satellite constellation. 2. Define the source and destination nodes. 3. Find the shortest path between the source and destination nodes. 4. Verify the path's reliability.
- 5. Modified Code Error in project4 (line 114) nodes = [nodes, sat(id)]; Error in project4 (line 74) nodes = [nodes, gsTarget]; startTime = datetime(2023, 5, 13, 10, 0, 0); stopTime = startTime + hours(4); sampleTime = 30; sc = satelliteScenario(startTime, stopTime, sampleTime, "AutoSimulate", false); sat = satellite(sc, "largeConstellation.tle"); numSatellites = numel(sat); gsSource = groundStation(sac, 42.3601, -71.0589, ... "Name", "Source Ground Station"); gsTarget = groundStation(sc, 37.7749, -122.4194, ... "Name", "Target Ground Station"); advance(sc); [~, elSourceToSat] = aer(gsSource, sat); [~, elTargetToSat] = aer(gsTarget, sat); elSourceToSatGreaterThanOrEqual30 = (elSourceToSat >= 30)'; elTargetToSatGreaterThanOrEqual30 = (elTargetToSat >= 30)'; trueID = find(elSourceToSatGreaterThanOrEqual30 == true); [~, ~, r] = aer(sat(trueID), gsTarget);
- 6. Modified Code [~, minRangeID] = min(r); id = trueID(minRangeID); nodes = {gsSource, sat(id)}; earthRadius = 6378137; altitude = 800000; % meters horizonElevationAngle = asind(earthRadius / (earthRadius + altitude)) - 90; minSatElevation = -10; pathFound = false; while ~pathFound idCurrent = id; if elTargetToSatGreaterThanOrEqual30(idCurrent) nodes = [nodes, {gsTarget}]; pathFound = true; continue end [~, els] = aer(sat(idCurrent), sat); els(idCurrent) = -90; s = els >= minSatElevation; trueID = find(s == true); [~, ~, r] = aer(sat(trueID), gsTarget); [~, minRangeID] = min(r); id = trueID(minRangeID); nodes = [nodes(:)', {sat(id)}]; end
- 7. Modified Code sc.AutoSimulate = true; ac = access(nodes{:}); ac.LineColor = "red"; intvls = accessIntervals(ac); v = satelliteScenarioViewer(sc, "ShowDetails", false); sat.MarkerSize = 6; % Pixels campos(v, 60, 5); % Latitude and longitude in degrees play(sc);
- 8. Visualization In this modified code, the start time is set to May 13, 2023, at 10:00:00 AM UTC, and the stop time is four hours later, at 2:00:00 PM UTC. The sample time is set to 30 seconds. The latitude and longitude values for the source and target ground stations are updated with approximate coordinates for Boston
- 9. Display Flight Trajectory Data Using Flight Instruments and Flight Animation This toolbox is about displaying flight trajectory data using flight instruments and flight animation. The code in the link uses the Aerospace Toolbox to load flight trajectory data, create flight instruments, and animate the flight trajectories. The flight instruments can be used to display information about the flight, such as the altitude, speed, and heading. The flight animation can be used to visualize the flight trajectory. Workflow: 1. Load the flight trajectory data. 2. Create the flight instruments. 3. Animate the flight trajectories. 4. Display the flight instruments and the flight animation.
- 10. Modified Code Error in LiveEditorEvaluationHelperE570995280 (line 41) sl.ValueChangingFcn = @(sl, event) flightInstrumentsAnimationCallback(fig, simdata, h, event); load('simdata.mat'); yaw = simdata(:, 7); yaw(yaw < 0) = yaw(yaw < 0) + 2 * pi; simdata(:, 7) = yaw; h = Aero.Animation; h.createBody('pa24-250_blue.ac', 'Ac3d'); h.Bodies{1}.TimeSeriesSource = simdata; h.Camera.PositionFcn = @staticCameraPosition; h.Figure.Position(1) = h.Figure.Position(1) + 572/2; h.updateBodies(simdata(1, 1)); h.updateCamera(simdata(1, 1)); h.show(); fig = uifigure('Name', 'Flight Instruments', ... 'Position', [h.Figure.Position(1) - 572, h.Figure.Position(2) + h.Figure.Position(4) - 502, 572, 502], ... 'Color', [0.2667 0.2706 0.2784], 'Resize', 'off'); fig.Visible = "off"; imgPanel = imread('FlightInstrumentPanel.png'); ax = uiaxes('Parent', fig, 'Visible', 'off', 'Position', [10 30 530 460], ... 'BackgroundColor', [0.2667 0.2706 0.2784]); image(ax, imgPanel); disableDefaultInteractivity(ax);
- 11. Modified Code Error in LiveEditorEvaluationHelperE570995280 (line 41) sl.ValueChangingFcn = @(sl, event) flightInstrumentsAnimationCallback(fig, simdata, h, event); alt = uiaeroaltimeter('Parent', fig, 'Position', [369 299 144 144]); head = uiaeroheading('Parent', fig, 'Position', [212 104 144 144]); air = uiaeroairspeed('Parent', fig, 'Position', [56 299 144 144]); air.Limits = [25 250]; air.ScaleColorLimits = [0, 60; 50, 200; 200, 225; 225, 250]; hor = uiaerohorizon('Parent', fig, 'Position', [212 299 144 144]); climb = uiaeroclimb('Parent', fig, 'Position', [369 104 144 144]); climb.MaximumRate = 8000; turn = uiaeroturn('Parent', fig, 'Position', [56 104 144 144]); sl = uislider('Parent', fig, 'Limits', [simdata(1, 1) simdata(end, 1)], 'FontColor', 'white'); sl.Position = [50 60 450 3]; sl.ValueChangingFcn = @(sl, event) flightInstrumentsAnimationCallback(fig, simdata, h, event); lbl = uilabel('Parent', fig, 'Text', ['Time: ' num2str(sl.Value, 4) ' sec'], 'FontColor', 'white'); lbl.Position = [230 10 90 30]; fig.Visible = "on";
- 12. Visualization The modified code generates a flight instrument panel with vertical indicators for altitude, heading, airspeed, horizon, climb rate, and turn rate. The panel is integrated with the Aero.Animation object that loads and displays the 'pa24-250_orange.ac' model with adjusted 'simdata' time series. The uislider allows you to control the animation time, and the uilabel displays the current time value.
- 13. Modeling Satellite Constellations Using Ephemeris Data A tool for modeling satellite constellations using ephemeris data. Ephemeris data is information about the position and velocity of a satellite at a given time. The application uses this data to create a model of the satellite constellation, which can then be used to simulate the behavior of the constellation. The application has a number of features that make it useful for modeling satellite constellations. These features include: 1. The ability to import ephemeris data from a variety of sources. 2. The ability to visualize the satellite constellation in 3D. 3. The ability to simulate the behavior of the satellite constellation over time. 4. The ability to analyze the performance of the satellite constellation.
- 14. Modified Code Error in project5 (line 19) geoscatter([gsUS.Latitude gsDE.Latitude gsIN.Latitude], ... mission.StartDate = datetime(2023, 11, 30, 22, 23, 24); mission.Duration = hours(24); mission.ConstellationDefinition = table( ... 29599.8e3 * ones(24,1), ... % Semi-major axis (m) 0.0005 * ones(24,1), ... % Eccentricity 56 * ones(24,1), ... % Inclination (deg) 350 * ones(24,1), ... % Right ascension of the ascending node (deg) sort(repmat([0 120 240], 1,8))', ... % Argument of periapsis (deg) [0:45:315, 15:45:330, 30:45:345]', ... % True anomaly (deg) 'VariableNames', ["a (m)", "e", "i (deg)", ... "Ω (deg)", "ω (deg)", "ν (deg)"]); mission.ConstellationDefinition mission.Ephemeris = load("SatelliteScenarioEphemerisData.mat", "TimeseriesPosITRF", "TimeseriesVelITRF"); mission.Ephemeris.TimeseriesPosITRF mission.Ephemeris.TimeseriesVelITRF scenario = satelliteScenario(mission.StartDate, mission.StartDate + hours(24), 60); sat = satellite(scenario, mission.Ephemeris.TimeseriesPosITRF, mission.Ephemeris.TimeseriesVelITRF, ... CoordinateFrame="ecef", Name="GALILEO " + (1:24)) disp(scenario)
- 15. Modified Code Error in project5 (line 19) geoscatter([gsUS.Latitude gsDE.Latitude gsIN.Latitude], ... timetable(... datetime(getabstime(mission.Ephemeris.TimeseriesPosITRF), Locale="en_US"), ... squeeze(mission.Ephemeris.TimeseriesPosITRF.Data(1,:,:))', ... squeeze(mission.Ephemeris.TimeseriesPosITRF.Data(2,:,:))', ... squeeze(mission.Ephemeris.TimeseriesPosITRF.Data(3,:,:))',... VariableNames=["Satellite_1", "Satellite_2", "Satellite_3"]) set(sat(1:8), MarkerColor="#FF6929"); set(sat(9:16), MarkerColor="#139FFF"); set(sat(17:24), MarkerColor="#64D413"); orbit = [sat(:).Orbit]; set(orbit(1:8), LineColor="#FF6929"); set(orbit(9:16), LineColor="#139FFF"); set(orbit(17:24), LineColor="#64D413"); gsUS = groundStation(scenario, 37.2350, -115.7930, ... MinElevationAngle=10, Name="Area 51"); gsUS.MarkerColor = "red"; gsDE = groundStation(scenario, 48.23206, 11.68445, ... MinElevationAngle=10, Name="Munchen"); gsDE.MarkerColor = "red"; gsIN = groundStation(scenario, 35.6895, 139.6917, ... MinElevationAngle=10, Name="Tokyo"); gsIN.MarkerColor = "red";
- 16. Modified Code Error in project5 (line 19) geoscatter([gsUS.Latitude gsDE.Latitude gsIN.Latitude], ... figure geoscatter([gsUS.Latitude gsDE.Latitude gsIN.Latitude], ... [gsUS.Longitude gsDE.Longitude gsIN.Longitude], "yellow", "filled") geolimits([-75 75], [-180 180]) title("Ground Stations") accessUS = access(gsUS, sat); accessDE = access(gsDE, sat); accessIN = access(gsIN, sat); set(accessUS, LineWidth="1"); set(accessUS(1:8), LineColor="#FF6929"); set(accessUS(9:16), LineColor="#139FFF"); set(accessUS(17:24), LineColor="#64D413"); set(accessDE, LineWidth="1"); set(accessDE(1:8), LineColor="#FF6929"); set(accessDE(9:16), LineColor="#139FFF"); set(accessDE(17:24), LineColor="#64D413"); set(accessIN, LineWidth="1"); set(accessIN(1:8), LineColor="#FF6929"); set(accessIN(9:16), LineColor="#139FFF"); set(accessIN(17:24), LineColor="#64D413"); Error in project5 (line 43) show(sat.Orbit)
- 17. Modified Code Error in project5 (line 19) geoscatter([gsUS.Latitude gsDE.Latitude gsIN.Latitude], ... intervalsUS = accessIntervals(accessUS); intervalsUS = sortrows(intervalsUS, "StartTime", "ascend") intervalsDE = accessIntervals(accessDE); intervalsDE = sortrows(intervalsDE, "StartTime", "ascend") intervalsIN = accessIntervals(accessIN); intervalsIN = sortrows(intervalsIN, "StartTime", "ascend") viewer3D = satelliteScenarioViewer(scenario, ShowDetails=false); show(sat.Orbit); gsUS.ShowLabel = true; gsUS.LabelFontSize = 11; gsDE.ShowLabel = true; gsDE.LabelFontSize = 11; gsIN.ShowLabel = true; gsIN.LabelFontSize = 11; [statusUS, timeSteps] = accessStatus(accessUS); statusDE = accessStatus(accessDE); statusIN = accessStatus(accessIN); % Sum cumulative access at each timestep statusUS = sum(statusUS, 1); statusDE = sum(statusDE, 1); statusIN = sum(statusIN, 1);
- 18. Modified Code Error in project5 (line 19) geoscatter([gsUS.Latitude gsDE.Latitude gsIN.Latitude], ... subplot(3,1,1); stairs(timeSteps, statusUS); title("51 to GALILEO") ylabel("# of satellites") subplot(3,1,2); stairs(timeSteps, statusDE); title("München to GALILEO") ylabel("# of satellites") subplot(3,1,3); stairs(timeSteps, statusIN); title("Tokyo to GALILEO") ylabel("# of satellites") statusTable = [table(height(intervalsUS), height(intervalsDE), height(intervalsIN)); ... table(sum(intervalsUS.Duration)/3600, sum(intervalsDE.Duration)/3600, sum(intervalsIN.Duration)/3600); ... table(mean(intervalsUS.Duration/60), mean(intervalsDE.Duration/60), mean(intervalsIN.Duration/60)); ... table(mean(statusUS, 2), mean(statusDE, 2), mean(statusIN, 2)); ... table(min(statusUS), min(statusDE), min(statusIN)); ... table(max(statusUS), max(statusDE), max(statusIN))]; statusTable.Properties.VariableNames = ["Area 51", "München", "Tokyo"]; statusTable.Properties.RowNames = ["Total # of intervals", "Total interval time (hrs)",... "Mean interval length (min)", "Mean # of satellites in view", ... "Min # of satellites in view", "Max # of satellites in view"]; statusTable
- 19. Visualization The modified code change the location of the ground station and the numbers of GALILEO satellites to 26
- 20. Project 6 - Create Scenario for 40 Satellites to track 5 Geological Sites Using Satellite Constellation Access to Ground Station application. I’m trying to visualize intelligence gathering using satellites on various countries that are considered hostels to the United States national defense strategies. Workflow: Create a Satellite Scenario Add Satellites to the Satellite Scenario Add Cameras to the Satellites Define the Geographical Site to be Photographed in the Satellite Scenario Add Access Analysis between the Cameras and the Geographical Site Visualize the Scenario Visualize the Camera’s Field of View Customize the Visualization Determine the Times when the Camera can photograph the Site Calculate System-Wide Access Percentage Improve Percentage by camera-tracking the site
- 21. Modified Code startTime = datetime(1945,8,9,6,0,0); stopTime = startTime + hours(6); sampleTime = 30; sc = satelliteScenario(startTime,stopTime,sampleTime) tleFile = "leoSatelliteConstellation.tle"; sat = satellite(sc,tleFile) names = sat.Name + " Camera"; cam = conicalSensor(sat,"Name",names,"MaxViewAngle",90) name = "Geological Site 1"; minElevationAngle = 30; % degrees geoSite = groundStation(sc, ... "Name",name, ... "MinElevationAngle",minElevationAngle, "Latitude",40.712742,"Longitude",- 74.013382)
- 22. Modified Code name = "Geological Site 2"; minElevationAngle = 30; % degrees geoSite = groundStation(sc, ... "Name",name, ... "MinElevationAngle",minElevationAngle, "Latitude",34.3853,"Longitude",132.4553) name = "Geological Site 3"; minElevationAngle = 30; % degrees geoSite = groundStation(sc, ... "Name",name, ... "MinElevationAngle",minElevationAngle, "Latitude",55.7558,"Longitude",37.6173) name = "Geological Site 4"; minElevationAngle = 30; % degrees geoSite = groundStation(sc, ... "Name",name, ... "MinElevationAngle",minElevationAngle, "Latitude",39.0738,"Longitude",125.8198)
- 23. Modified Code name = "Geological Site 5"; minElevationAngle = 30; % degrees geoSite = groundStation(sc, ... "Name",name, ... "MinElevationAngle",minElevationAngle, "Latitude",39.9042,"Longitude",116.4074) ac = access(cam,geoSite); ac(1) v = satelliteScenarioViewer(sc,"ShowDetails",false); sat(4).ShowLabel = true; sat(40).ShowLabel = true; sat(1).ShowLabel = true; sat(17).ShowLabel = true; geoSite.ShowLabel = true; show(sat(4)) show(sat(40)) show(sat(1)) show(sat(17))
- 24. Modified Code fov = fieldOfView(cam([cam.Name] == "Satellite 3 Camera")) fov = fieldOfView(cam([cam.Name] == "Satellite 2 Camera")) fov = fieldOfView(cam([cam.Name] == "Satellite 15 Camera")) fov = fieldOfView(cam([cam.Name] == "Satellite 23 Camera")) fov = fieldOfView(cam([cam.Name] == "Satellite 17 Camera")) fov = fieldOfView(cam([cam.Name] == "Satellite 12 Camera")) fov = fieldOfView(cam([cam.Name] == "Satellite 10 Camera")) fov = fieldOfView(cam([cam.Name] == "Satellite 7 Camera" )) fov = fieldOfView(cam([cam.Name] == "Satellite 4 Camera")) fov = fieldOfView(cam([cam.Name] == "Satellite 40 Camera")) ac.LineColor = 'red'; accessIntervals(ac) for idx = 2:numel(ac) [s,time] = accessStatus(ac(idx)); if idx == 1 systemWideAccessStatus = s; else systemWideAccessStatus = or(systemWideAccessStatus,s); end end
- 25. Modified Code plot(time,systemWideAccessStatus,"LineWidth",2); grid on; xlabel("Time"); ylabel("System-Wide Access Status"); n = nnz(systemWideAccessStatus) systemWideAccessDuration = n*sc.SampleTime % seconds scenarioDuration = seconds(sc.StopTime - sc.StartTime) systemWideAccessPercentage = (systemWideAccessDuration/scenarioDuration)*100 pointAt(sat,geoSite) for idx = 1:numel(ac) [s,time] = accessStatus(ac(idx)); if idx == 1 systemWideAccessStatus = s; else systemWideAccessStatus = or(systemWideAccessStatus,s); end end n = nnz(systemWideAccessStatus); systemWideAccessDuration = n*sc.SampleTime; systemWideAccessPercentageWithTracking = (systemWideAccessDuration/scenarioDuration)*10
- 26. Visualization The modified code change the location of the default ground stations to other five locations located in New York City, Moscow, Hiroshima, Beijing and Pyongyang. These satellites have an elevation angles specified where to point their cameras. Cameras 4, 40, 1 and 17 are shown to allowed to track when they’re close to the “geological sites”