Composition of ethiopian domestic revenues and tax buoyancies (1975 2013)
•
1 like•330 views

This document analyzes the composition and trends of Ethiopian domestic revenues from 1975-2013. It finds that total domestic revenues as a percentage of GDP have increased under the EPRDF government compared to the Derg regime, reaching a high of 17.13% in 2004/05. However, domestic revenues also experienced high volatility, declining sharply at times. Tax revenues are the largest component and have historically been inelastic. Indirect taxes, especially foreign trade taxes, account for the majority of tax revenues. The study aims to examine tax buoyancies under the two governments to better understand domestic resource mobilization challenges in Ethiopia.

Recommended
Recommended
More Related Content
What's hot
What's hot (19)
Similar to Composition of ethiopian domestic revenues and tax buoyancies (1975 2013)
Similar to Composition of ethiopian domestic revenues and tax buoyancies (1975 2013) (20)
More from Alexander Decker
More from Alexander Decker (20)
Recently uploaded
Recently uploaded (20)
Composition of ethiopian domestic revenues and tax buoyancies (1975 2013)
- 1. Research Journal of Finance and Accounting www.iiste.org ISSN 2222-1697 (Paper) ISSN 2222-2847 (Online) Vol.5, No.13, 2014 76 Composition of Ethiopian Domestic Revenues and Tax Buoyancies (1975-2013) Delessa Daba (Corresponding Author) Ethiopian Civil Service University Email: borgaa2000@gmail.com Professor D.K. Mishra Ethiopian Civil Service University Abstract The purpose of this study is to examine the buoyancy of tax revenue in Ethiopia over the period 1974/75- 2012/13. The analysis was made by fitting double log regression model with an interaction variable to the stationary time series data base on Augmented-Dicky Fuller (ADF). The analysis was made in three different categories. The first category dealt with the whole period to analyze total tax revenue buoyancy over the range of the study period while the second category was compared with total tax revenue buoyancy of the Derg regime period (1974/75-1991/92) and the Ethiopian People’s Revolutionary Front (EPRDF) period (1992/93-2012/13). In addition, the comparison of pre and post-tax reforms has been carried out during the EPRDF period in order to identify whether the series of tax reforms with a view to boosting tax revenue mobilization resulted in the expected tax revenues yields. Year 2003 is considered as post comprehensive tax reform period to examine the impact of the reforms on tax revenues collection. The regression results revealed that the estimates of buoyancy of total tax revenue is higher during EPRDF period compared to Derg period, while the pre reform period buoyancy of total tax revenue is lower than the post comprehensive reform period. From the result, it is possible to conclude that the total tax system during the two government systems is inelastic and the broad tax reforms have not resulted in boosting domestic resource mobilization in general and tax revenue collection in particular. Keywords: Domestic revenue composition, trend, tax buoyancies, time series data Introduction The role of a state in economic growth and development in developing countries in general and in African countries in particular has been getting due attention from international multilateral institutions and academic circles since the failure of Structural Adjustment Program (SAP) during 1980s and 1990s. Specifically the role of state is vital in developing countries like Ethiopia where the development of private sector is at its infant stage thereby the pervasive market failure would rule out the possibility of economic growth and development without active government involvement in the economy. Hence, the prevalence of imperfect markets in most developing economies necessitated the active participation of the state in the economy through formulation of guiding policies and implementation of the developmental projects which the private sector cannot take up due to resource incapacity or accompanying high risks associated with the projects. As underscored by African Economic Report (AER) (2011:7), “the development process has to be planned for several reasons. The changes required are substantial and therefore the decision cannot be optimally made by free market force”. The implementation of developmental projects to bring about substantial changes in the economy particularly during the initial period of economic development in turn demands enormous financial resources investment in public goods and services such as education, health, infrastructures and similar projects which are the preconditions of economic growth and development. Acceleration of economic growth requires sound financial resources availability which is scarce in the developing economies in general and African developing countries in particular. High gap between saving and investment of these countries forced the country to look for external sources to bridge the investment gap. Attracting foreign resources to finance economic growth and development led by agricultural export earnings which is vulnerable to international market volatility on the one hand and foreign aid and grants which are tied to a number of conditionality on the other hand posed challenge to the developmental efforts of the countries. In general the developing countries are suffering from severe fiscal crises to finance their developmental programs. As a group of low income countries, the fiscal deficit is the core issue of Ethiopian government mainly due to the low performance of domestic resource mobilization particularly tax revenues. Hence, the concern of enhancing domestic resource mobilization attracted the attention of the Ethiopian Government policy makers during the last twenty years specifically during the Second Five Years Plan- Plan for Accelerated Development and Poverty Reduction Plan and the second five years plan-Growth and Transformation Plan (GTP). To this end, the country has been introducing different policy measures to boost the low level of domestic resources mobilization through implementing various saving scheme such as pension schemes, expanding bank branches to create access to unbanked group of the society, micro financing institution to reach out the majority of the rural areas, diaspora
- 2. Research Journal of Finance and Accounting www.iiste.org ISSN 2222-1697 (Paper) ISSN 2222-2847 (Online) Vol.5, No.13, 2014 77 bonds and housing savings. Though these various measures have been taken place in order to boost domestic resource mobilization yet the country could not increase the savings rate. The domestic saving rate remains low about 6 percent which shows the domestic resource mobilization performance is at a low level as compared to Sub-Saharan African low income countries. The report on economic development in Africa indicates that “In 2009, gross domestic savings as a percentage of gross domestic product was 16 per cent in sub-Saharan Africa, compared with 27 per cent for East Asia and the Pacific, 20 per cent for Europe and Central Asia, and 23 per cent for Latin America and the Caribbean.” (UNIDO and UNCTAD2011:75) As a result the main focus of Growth and Transformation Plan (GTP) (2010) therefore is improving domestic resource mobilization with a view to financing developmental projects by own resources. This is mainly because depending on domestic resources will help to sustain the high economic growth that the country has been registering for more than ten years. In addition, dependence on domestic resources minimizes external economic shocks which affect the inflow of foreign resources to the country. As reported by Ethiopian Economics Association (EEA) (2013), the value of total grants obtained in year 2011/12 showed a reduction compared to the previous year (2010/11) registering a negative growth of 22.4 percent due to recent Western donor countries financial crises which was followed by economic crises. However, the country is still far from meeting its investment financing from domestic resources though efforts have been made to reform public finance over the last couple of decades. Analyzing domestic resource mobilization systematically over a reasonable long period of time (39 years for this study) will shed light on performance of domestic resource mobilization of the country and increase the knowledge of policy makers in formulation of appropriate policy instruments to address the problems that are hindering domestic resources mobilization of the country. The low performance of tax revenues mobilization is mainly attributed to the structure of tax revenues and the flexibility of tax system to generate adequate tax revenues from the national income. The flexibility of a tax system which is commonly measured in terms of buoyancy of tax system would enable us to identify whether tax revenues are growing fast or lagging behind in response to changes in national income. Therefore, it is useful to identify the behavior of tax revenues in relation to change in national income. Such estimation is important for the purpose of formulation of government budgets and monitoring the progress of tax collection. Hence, the guiding question of this study is- do tax revenues rise at the same pace as GDP rises? Or is there any significant structural change in tax revenues? To answer this question, tax buoyancies of the two governments (Derg and EPRDF) of Ethiopia are measured and analyzed. II. Ethiopian Domestic Revenues Composition and Trends The Ethiopian national economic policies and strategies emphasize economic growth and poverty reduction as being at the heart of economic transformation from agricultural sector dependence to an industrialized economy. The transformation will lead to not only eradication of poverty but also help to pave the way to join the middle income countries. To this end, domestic resource mobilization has been given due consideration to sustain the economic growth that has been growing by more than double digits for the last consecutive 10 years. To mobilize the required level of domestic resources from the economy through appropriate policy measures requires harmony with the national objectives in the short term and the long term. To formulate suitable policy instruments with the aim of achieving long terms national policy objectives, analysis of the composition of domestic revenues would shed some light on the problems which can create better understanding to overcome the challenges that are hampering the domestic resource mobilization efforts of the country. Ethiopian domestic revenues components can be broadly classified as tax revenues and non-tax revenues. Tax revenues constitute direct tax and indirect taxes, while non-tax revenues come from fees, charges and State Owned Enterprises (SOEs). Figure-1 highlights the trends of domestic revenues components in terms of share of Gross Domestic Product (GDP) for 39 years considered for the study.
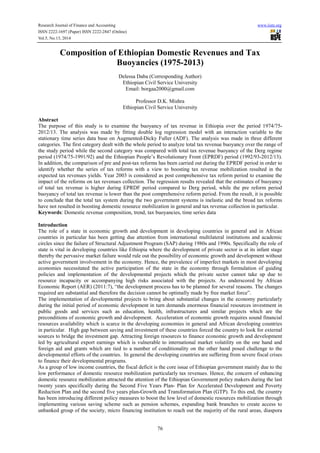
- 3. Research Journal of Finance and Accounting www.iiste.org ISSN 2222-1697 (Paper) ISSN 2222-2847 (Online) Vol.5, No.13, 2014 78 Figure-1: Percentage share of Total Domestic Revenue, Tax Revenue, & Non-Tax Revenue of GDP (1974/75/2012/13 Source: Ministry of Finance & Economic Development (MoFED) The comparison of the two governments’ domestic revenues performance from Figure-1indicates that domestic revenue mobilization of the Derg government of 5.25 percent in 1988/99 as compared with the current government’s (EPRDF) maximum domestic revenues generation effort of 17.13 percent in 2004/05 has shown a great improvement. From the figure it is possible to comprehend that the EPRDF government has shown encouraging performance in domestic resource mobilization in terms of total tax revenue to GDP ratio. However, the sharp decline of total domestic revenue as a ratio of GDP from its high (17.13%) to 10.17 percent in 2007/2008 suggests that the volatility of domestic revenues was high which posed a challenge to the financing of developmental projects specifically during the Second Five Year Plan-Plan for Accelerated and Sustained Development to End Poverty (PASDEP), that ran form 2005/06 to 2009/10. Drawing a lesson from the implementation of PASDEP, the current national plan i.e. the Second Five Year Plan commonly known as Growth and Transformation Plan (GTP) gives due attention to the domestic resource mobilization. Regarding the trends of domestic revenues, the trends of both tax revenue and non-tax revenue exhibit the same pattern. Specifically, the non-tax revenue has declined sharply from 6.4 percent in1998/99 to 2.12 percent in 2012/13 due to the uninterrupted transfer of most of the non-strategic State Owned Enterprises (SOEs) to the private sector through public auctions in an effort to liberalize the economy which was dominated by the public sector. The continuous transfer of SOEs to the private sector is one of the strategies to enhancing the private sector which is considered as engine of the economic growth and development. Though many efforts have been made to boost the private sector, the growth of the private sector remained at its infant stage in the country. SOEs were the major contributors of non-tax revenues in the form of SOEs residual surplus to the central treasury of the country. From the trend it can be comprehended that domestic revenue mobilization of the country is characterized by high volatility in both major components of domestic revenues i.e. tax revenues and non-tax revenues. This high volatility of domestic resources mobilization put great obstacles to developmental financing which in turn cast doubt on the sustainability of the recent double digits economic growth and development from the long run perspective. Turning to the composition of tax revenues, as suggested by Tanzi and Zee (2001), the optimal level of the composition of public revenue is in conflicting theories. The issues involve the taxation of income or consumption that should be the area of focus as both direct and indirect taxes have implications for progress and social justice. In fact the objective of taxation is different in developed and developing economies. The developing nations like Ethiopia where there is huge resource gap to finance the developmental efforts taxation objective should focus on the economic growth and development to create income to be distributed fairly among the citizens. Though there are conflicting arguments concerning the objective of taxation policy of developing countries, there is convergence among the scholars in the field and practitioners concerning the determining factors of tax mix in respect to internal factors such as political will to tax, economic structure and social 17.13% 10.77% 5.25% 8.60% 0.31% 6.40% 2.12% 0.00% 2.00% 4.00% 6.00% 8.00% 10.00% 12.00% 14.00% 16.00% 18.00% 1974/75 1676/77 1978/79 1980/81 1982/83 1984/85 1986/87 1988/89 1990/91 1992/93 1994/95 1996/97 1998/99 2000/01 2002/03 2004/05 2006/07 2008/09 2010/11 2112/13 Percentage share of Total Revenue to GDP Percentage share of Tax Revenue to GDP Percentage share of Non-tax to GDP
- 4. Research Journal of Finance and Accounting www.iiste.org ISSN 2222-1697 (Paper) ISSN 2222-2847 (Online) Vol.5, No.13, 2014 79 awareness about the importance of tax for the national economic growth. In addition, the mix of tax of developing countries can also be determined by international multilateral organizations such as the World Bank (WB), the International Monetary Fund IMF) and the like as the institutions can dictate tax mix as a pre- condition of loan. As a number of authors suggest that the conventional belief that taxing income or direct tax entails a higher efficiency cost than taxing consumption. Taxing consumption on the other hand has mostly been thought to be inherently more regressive than taxing income. The other area of concern in a composition of tax revenues is taxation of foreign trade mostly the import tax as opposed to the taxation of domestic consumption as the exports are duty free regime to encourage foreign earning through export promotion strategy to enhance the competitiveness of the export sector. The tax mix of Ethiopia is classified as direct tax and indirect tax. The direct tax comprises four income schedules namely personal income tax, rental income tax, business profit tax, and other incomes tax at federal level with additional taxes such as agricultural income tax, rural and urban land use fee at regional and chartered cities. On the other hand indirect tax comprises value added/turnover tax, excise tax, import duties, import surtax. Figure-2 presents the composition of direct and indirect taxes during the study period 1974/75-2012/13 to create insight on the tax revenue generation efforts by the two governments with divergent economic policies. Figure-2: Major Tax Categories Share of GDP (1975-2013) Source: Ministry of Finance and Economic Development(MoFED) The analysis based on the data presented in Figure-2 shows that the overall tax performance in all the tax categories has improved comparing the two governments’ performances i.e., the socialist Derg central planned economy with the Ethiopian People’s Revolutionary Democratic Front (EPRDF). Total tax revenue ratio to GDP rose from 3.77 percent on average during 1974/75-1991/92 to approximately 10 percent in the period of 1992/93-2012/13. The major share of total tax revenue comes from indirect tax which was contributing about 67 percent on average to total tax revenues while foreign trade tax revenues take the lion share of the indirect tax compared to domestic indirect tax. The EPRDF government has been implementing trade reforms over the last couple of decades to liberalize international trade including the reduction of customs ad valorem rate from 230 percent to the 35 percent maximum. Though the customs duty rate declined over the years the contribution of foreign trade tax to tax revenues remained high which neutralized the effect of potential loss due to customs duty reduction by huge increase in volume of imported goods. The other contributing factor for the growth of foreign trade tax is the high devaluation of the country’s currency Birr against United States Dollar (USD) from 2.07Birr to 1 USD in 1995 to more the 19 Birr to 1USD in 2013 in the process of pegging the county’s foreign exchange 0.00% 2.00% 4.00% 6.00% 8.00% 10.00% 12.00% Total Tax Direct Tax Total Indirect Tax Domestic Indirect Taxes Foreign Trade Taxes 1974/75-1991/92 1992/93-2012/13
- 5. Research Journal of Finance and Accounting www.iiste.org ISSN 2222-1697 (Paper) ISSN 2222-2847 (Online) Vol.5, No.13, 2014 80 rate. In general, trade tax revenue accounts for a major share in domestic revenues of Ethiopia (37%), which is similar to the other developing countries in general and African countries in particular. According to Fitzgerald (2007), trade taxes account for a larger share of total tax revenue in developing countries (24.9%) as compared to developed countries (0.5%) while the percentage for Africa is highest (33%) among developing regions. Therefore, though serious trade policy reforms have been taking place for over 20 years in Ethiopia in response to global trade liberalization pressures, the impact of foreign trade taxes revenue in domestic resource mobilization remained significant as compared to the Derg socialist economy. From the descriptive analysis of domestic revenue mobilization efforts of the Derg and EPRF regimes made in Figure-1 and Figure-2, the trend of domestic revenues and major compositions of the domestic revenues i.e., tax and non-tax revenues show the increasing trend from 5.25 percent during Derg regime to 17.13 percent during the EPRDF period on average. However, it is difficult to conclude if the increment made is statistically significant or not unless objective statistical measurement is employed to measure objectively the structural changes over a time. With a view to search for structural shift in total tax revenues which is the main source of domestic revenue (more than 85 percent), the statistical tests have been employed between the Derg and EPRF regime on the one hand and pre and post comprehensive tax reforms during the EPRDF period on the other hand. III. Data Sources and Methods Data Sources Relevant data for this study over a period of 1974/75 to 2012/13 have been gathered from pertinent government organizations. The proxy base for total tax revenue derived from gross domestic product at constant market prices has been gathered from the Ministry of Finance and Economic Development (MoFED) and the Central Statistical Agency. Inflation rate was obtained from National Bank of Ethiopia (NBE). Methods Statistical deductions from the time series data basically assume that the economic data must be stationary while in reality most of macroeconomic time series data are characterized by non-stationarity features, which necessitates taking remedial action to maneuver the data in order to maintain the assumptions of stationarity. To test this basic assumption Augmented-Dicky Fuller (ADF) test is employed to log(ttr), log(gdp) Since the calculated ADF statistics at level are less than the critical value for all variables considered in the study the time series variables are non-stationary, ADF should be performed on the first difference of log(ttr), log(dgp). The calculated ADF statistics after first difference are greater than critical values, and the variables are found to be stationary and they are integrated to order one i.e. log (ttr) ˷ I(1), log(dgp) ˷ I(1). Empirical Model for Tax Buoyancy The degree of tax buoyancy during the combined period (1947/75-2012/13) has been examined by fitting in the following equation with the stationary time series data. TR= αGDPβε …………………………………………….………1 The transformation of multiplicative model to linear assume the following functional relationship Log(ttrt)= logβ0 + β1log(gdpt) + € t ……………………..……2 The standard format of the eaquation is Log(ttrt)= β0 + β1log(gdpt) + € t ……………………………...…3 In order to ascertain whether there were structural changes in tax revenue generation between the Derg and EPRDF period dummy variable is introduced to the model Log(ttrt)= β0 + β1dum + β2log(gdpt) + β3(dum*log(gdpt))+ € t ……4 Where: Ttr = total tax revenue Gdp = gross domestic product Dum = dummy variable € = disturbance term Ordinary least square is used to estimate the coefficients β0, β1 β2, and β3. Since the equation is in double log form, it provides an estimate of tax buoyancy because it measures the percentage response in the left-hand side variable. IV. Buoyancy Estimation Results The estimation of coefficient of buoyancies of total tax revenue during the Derg and EPRDF periods and differential total tax buoyancy during both governments have been estimated by fitting a double log regression model [Equation-4] by ordinary least square method as the time series log variables are found stationary in the first difference of the log level, log(ttr) ˷ I(1) and log(gdp) ˷ I(1). Derg and EPRDF Periods Buoyancies: Comparison (1974/75-2012/13) Buoyancy of total tax system is presented in Appendix-1. The result in Appendex-1 shows that the buoyancy of
- 6. Research Journal of Finance and Accounting www.iiste.org ISSN 2222-1697 (Paper) ISSN 2222-2847 (Online) Vol.5, No.13, 2014 81 Ethiopian tax system for 39 years of the study period is 0. 59. On this ground, it is possible to argue that the growth in GDP is accompanied by less than proportionate automatic growth in tax revenues. This means that for every one percent in GDP, revenue from the tax has on average grown by 0. 59 percent. Thus, the government has been collecting less proportion of incremental income in the form of tax revenues, which implies that the tax system of Ethiopia was inelastic for the study period. Comparison between the ‘Derg’ regime (1974/75-1991/92) major tax categories buoyancies with EPRDF periodd (1992/92-2012/13) has been done to identify if difference in ideological and economic policy had resulted in domestic resource mobilization in general and tax revenue performance in particular. The regression results are presented in Table-1 Table-1 Variable Coefficient Std. Error t-Statistic Prob. C 0.069939 0.032957 2.122105 0.0412 DLOG_GDP 0.462787 0.548599 0.843580 0.4048 DUM 0.086580 0.044545 1.943649 0.0603 DUM*DLOG_GDP -0.266251 0.559881 -0.475550 0.6374 F-statistic 3.272848 Durbin-Watson stat 1.757188 Prob(F-statistic) 0.032831 The regression results illustrate that the estimate of total tax revenues i.e. the differential slope β1= 0.427 (prb. < 0.4048) is statistically significant but less than unity during the Derg period illuminating that the total tax revenue is inelastic which means a one percent increase in GDP/income is accompanied by 0.46 percent which is far less than a unitary measurement. Indeed, it can be concluded that the average propensity to tax (the ratio of TTR to GDP) was declining with the increase in GDP during Derg period. This statistical inference is in line with the finding of the descriptive analysis of tax to GDP ratio (propensity to tax) 1975-1991 was in average 3.77 percent in part II of this paper. Turning to the regression coefficient of the differential intercept coefficient of β3= -0.266251 (prb. > 5% (0.6374)) is negative and not significant which shows the propensity to tax during the EPRDF period was not significantly different from the Derg period. From this it is possible to comprehend there was not structural shift in raising tax revenues though there were a series of tax reforms carried out with a view to mobilizing tax revenues to finance developmental projects with own resources. Pre and Post Comprehensive Tax Reforms (1992-2013) The Ethiopian tax reforms after the ‘Derg’ regime can be grouped mainly into two periods. The first period covers the years 1992/93-2001/02 while the second period which is commonly known as comprehensive tax reforms period after the years 2002/03. The first reform was initiated to adjust the economic policy from planned economic system to market oriented resource allocation with a view to liberalizing the economy to enhance the of the private sector involvement in the development process of the country. The comprehensive tax reforms which have been taking place after 2002/03 focused on improving government revenue through reduction of tax rate, expanding tax base and improving tax administration efficiency. Though different policy measures have been taken place with a view to boosting tax revenues collection, tax revenue mobilization yield was not as expected (MoFED, 2013). This low performance necessitated undertaking comprehensive tax reforms focusing on tax policy changes and capacity building of the tax administration. The objectives of tax policy changes and tax administration improvement were: (i) to reduce tax revenue dependency on foreign trade; (ii) to tax consumption rather than production; (iii) to shift the burden of tax from the poor to the rich group of the society; (iv) to reduce tax rates and expand tax base and (v) to enhance tax administration efficiency. To these ends, the government has introduced Civil Service Reform Program (CSRP) of which tax policy and administration reforms at Federal and regional states were an integral part of the program. The buoyancies of total tax revenues pre and post-tax reforms are highlighted in Table-2. Table 2 Variable Coefficient Std. Error t-Statistic Prob. C 0.011582 0.048936 0.236679 0.8156 DUMMY 0.208271 0.063380 3.286081 0.0041 DLOG_GDP 0.524914 0.792449 3.186218 0.0051 DUMMY*DLOG_GDP -2.433604 0.799736 -3.043007 0.0070
- 7. Research Journal of Finance and Accounting www.iiste.org ISSN 2222-1697 (Paper) ISSN 2222-2847 (Online) Vol.5, No.13, 2014 82 Total tax buoyancy presented in Table-2 shows that the coefficient is positive and less the than unity (0.524914) or pre tax reform period signifying that total tax is relatively inelastic. From this result, it can be comprehended that on the average a one percent increment in gross domestic product which a proxy variable for national income is accompanied by less than one percent change i.e. 0.52 percent increases in tax revenue all other affecting variables remaining constant. The regression coefficient of differential intercept is negative showing that a downward shift in degree of ta buoyancy during post comprehensive tax reform period. The estimate of the total tax buoyancy which was less than unity during pre tax reform period is accompanied by less than unity during the post-tax reform period demonstrating the fact that the total tax system is inelastic over the pre and post-tax reforms periods. From this it can also be understood that total tax revenue is declining with the increase in GDP which suggests the propensity to tax is low before and after the comprehensive tax reforms. (See appendix-2 for post reform propensity to tax). V. Conclusions Developmental financing from domestic resources in general and tax revenues in particular is a critical success factor to achieve a long term objective of joining middle income countries by 2025. To this end, greater efforts should be made to mobilize domestic resources so that the double digit economic growth that has been registering for more than 10 years can be sustainable for a reasonably long period of time One of the most significant findings to emerge from this study is that the Domestic Resource Mobilization (DRM) effort of the country over 39 years of the study period is greatly volatile in both tax and non-tax revenues which evinces that the dependence on domestic revenues for financing the development program is not sustainable at least in the short term. The descriptive analysis of tax revenues composition reveals that though tax revenues collection in all major tax categories has been increasing over a time especially during EPRDF period, the share of each tax category to GDP has remained low as compared to the regional tax average performance. The composition of tax revenues is also significantly dominated by indirect taxes in general and foreign trade taxes in particular. Dependency on foreign trade taxes (easy to tax sector) would put revenue challenges to domestic resource mobilization in the long term perspective because the expansion of globalization in the form of regional integration and joining multilateral organizations entails more openness of the external sector. Hence due efforts should be exerted to raise tax revenues from direct taxes and domestic indirect taxes to have fiscal sustainability in a long run perspective. The investigation of empirical data based on stationary time series macro annual data for the period from 1974/75-2012/13, revealed that the total tax buoyancy estimate is less than unity for the whole period indicating that the ratio of total tax to Gross Domestic Product was declining as the economy was growing by double digits. This implies that the ability of the economy to increase revenue on its own remains fairly weak and requires serious policy measures to improve the poor performance to finance development projects with own resources in the long run perspective. References ………(2013). Ethiopian Macroeconomic Performance (2001/02-20111/1. Addis Ababa: Ministry of Finance and Economic Development. Economic Commission for Africa and African Union. (2011).Governing development in Africa: the role of the state in economic transformation. Economic Report on Africa. Addis Ababa: United Nations Economic Commission for Africa Ethiopian Economics Association (EEA) (2013). Report on the Ethiopian Economy. Addis Ababa: Ethiopian Economics Association/Ethiopian Economic Research Institute. Federal Democratic Republic of Ethiopia Ministry of Finance and Economic Development. (2010). Growth and Transformation Plan. Addis Ababa: Ministry of Finance and Economic Development. Fitzgerald Valpy (2007), “Financial Development and Economic Growth: a Critical View” chapter 9 in Jomo, K.S: (ed) Flat World, Big Gaps. Hyderabad: Orient Longman Ministry of Finance (1997). ABC of Taxes in Ethiopia (1942-1996). Addis Ababa: Planning & Research Department, Ministry of Finance. United Nations Industrial Development Organization (UNIDO) & United Nations Conference on Trade and Development (UNCTAD), (2011). ECONOMIC DEVELOPMENT IN AFRICA: Fostering Industrial Development in the New Global Environment. Special Issue, United Nations: New York and Geneva. Weyzig, Francis, (2013). Evaluation of issues in financing for development. IOB Study no. 386: the Netherlands: the Ministry of Foreign Affairs
- 8. The IISTE is a pioneer in the Open-Access hosting service and academic event management. The aim of the firm is Accelerating Global Knowledge Sharing. More information about the firm can be found on the homepage: http://www.iiste.org CALL FOR JOURNAL PAPERS There are more than 30 peer-reviewed academic journals hosted under the hosting platform. Prospective authors of journals can find the submission instruction on the following page: http://www.iiste.org/journals/ All the journals articles are available online to the readers all over the world without financial, legal, or technical barriers other than those inseparable from gaining access to the internet itself. Paper version of the journals is also available upon request of readers and authors. MORE RESOURCES Book publication information: http://www.iiste.org/book/ IISTE Knowledge Sharing Partners EBSCO, Index Copernicus, Ulrich's Periodicals Directory, JournalTOCS, PKP Open Archives Harvester, Bielefeld Academic Search Engine, Elektronische Zeitschriftenbibliothek EZB, Open J-Gate, OCLC WorldCat, Universe Digtial Library , NewJour, Google Scholar
- 9. Business, Economics, Finance and Management Journals PAPER SUBMISSION EMAIL European Journal of Business and Management EJBM@iiste.org Research Journal of Finance and Accounting RJFA@iiste.org Journal of Economics and Sustainable Development JESD@iiste.org Information and Knowledge Management IKM@iiste.org Journal of Developing Country Studies DCS@iiste.org Industrial Engineering Letters IEL@iiste.org Physical Sciences, Mathematics and Chemistry Journals PAPER SUBMISSION EMAIL Journal of Natural Sciences Research JNSR@iiste.org Journal of Chemistry and Materials Research CMR@iiste.org Journal of Mathematical Theory and Modeling MTM@iiste.org Advances in Physics Theories and Applications APTA@iiste.org Chemical and Process Engineering Research CPER@iiste.org Engineering, Technology and Systems Journals PAPER SUBMISSION EMAIL Computer Engineering and Intelligent Systems CEIS@iiste.org Innovative Systems Design and Engineering ISDE@iiste.org Journal of Energy Technologies and Policy JETP@iiste.org Information and Knowledge Management IKM@iiste.org Journal of Control Theory and Informatics CTI@iiste.org Journal of Information Engineering and Applications JIEA@iiste.org Industrial Engineering Letters IEL@iiste.org Journal of Network and Complex Systems NCS@iiste.org Environment, Civil, Materials Sciences Journals PAPER SUBMISSION EMAIL Journal of Environment and Earth Science JEES@iiste.org Journal of Civil and Environmental Research CER@iiste.org Journal of Natural Sciences Research JNSR@iiste.org Life Science, Food and Medical Sciences PAPER SUBMISSION EMAIL Advances in Life Science and Technology ALST@iiste.org Journal of Natural Sciences Research JNSR@iiste.org Journal of Biology, Agriculture and Healthcare JBAH@iiste.org Journal of Food Science and Quality Management FSQM@iiste.org Journal of Chemistry and Materials Research CMR@iiste.org Education, and other Social Sciences PAPER SUBMISSION EMAIL Journal of Education and Practice JEP@iiste.org Journal of Law, Policy and Globalization JLPG@iiste.org Journal of New Media and Mass Communication NMMC@iiste.org Journal of Energy Technologies and Policy JETP@iiste.org Historical Research Letter HRL@iiste.org Public Policy and Administration Research PPAR@iiste.org International Affairs and Global Strategy IAGS@iiste.org Research on Humanities and Social Sciences RHSS@iiste.org Journal of Developing Country Studies DCS@iiste.org Journal of Arts and Design Studies ADS@iiste.org