Download to read offline


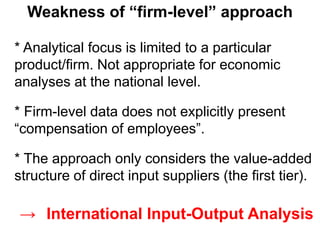
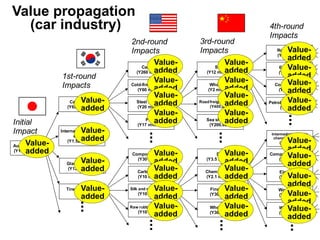
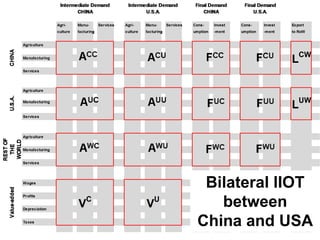
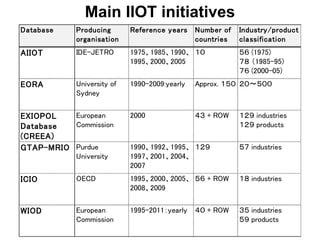
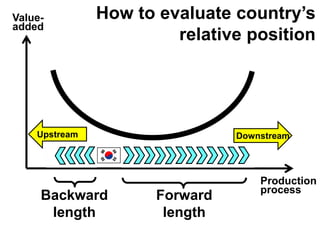
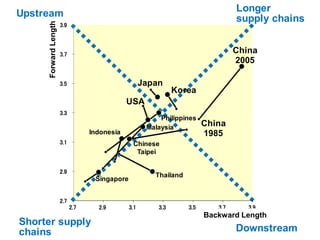
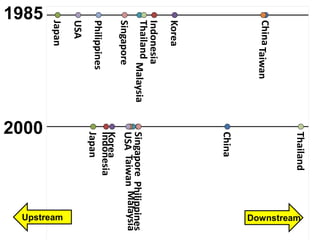
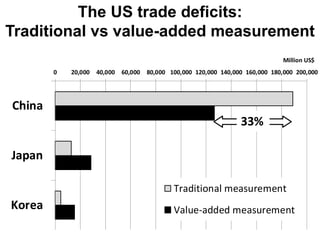

This document discusses international input-output analysis and its use in measuring global trade and value chains. It provides examples of how input-output tables can be used to analyze the domestic and international propagation of value-added through production linkages. International input-output tables allow measurement of countries' positions in global value chains in terms of upstreamness and downstreamness. They also provide a more accurate picture of bilateral trade balances by considering value-added rather than gross trade flows.


![[1] Business Strategy and Innovation Management.pdf](https://cdn.slidesharecdn.com/ss_thumbnails/1businessstrategyandinnovationmanagement-250715180452-9e73c773-thumbnail.jpg?width=640&height=640&fit=bounds)


