Download to read offline
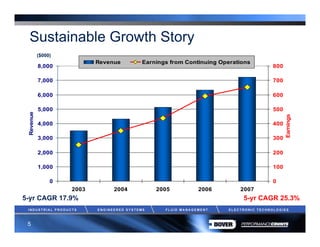
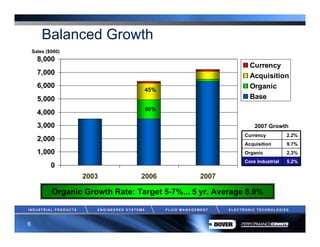
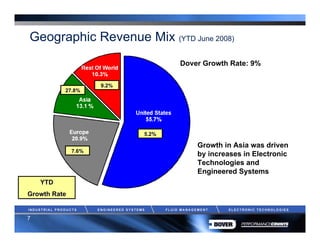
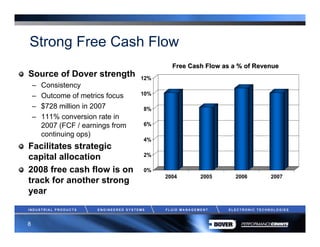
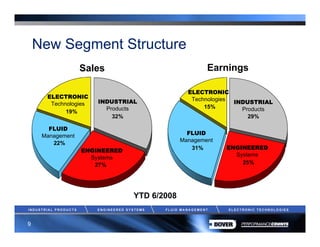
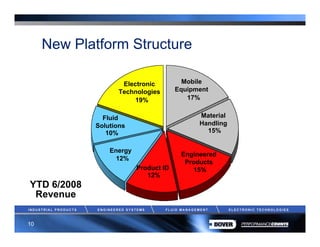
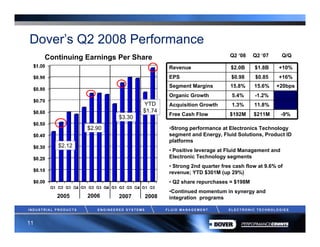
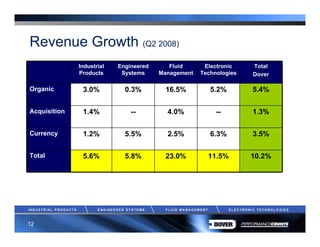
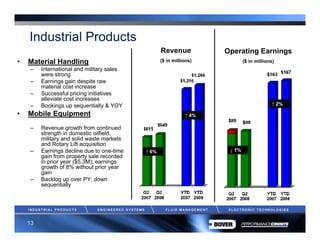
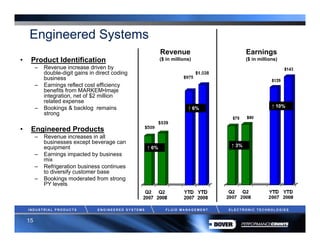
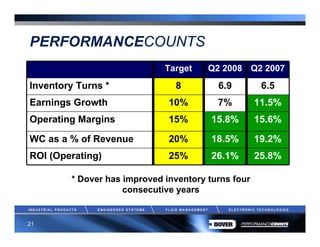
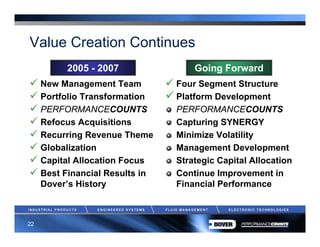
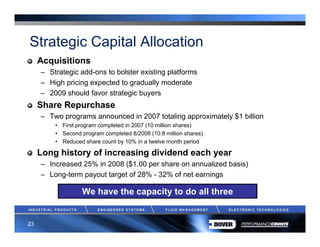
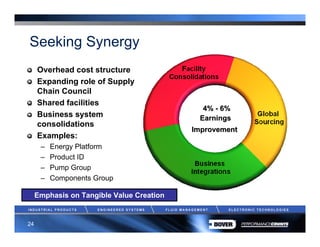
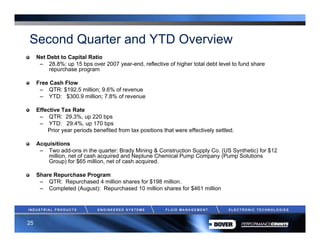
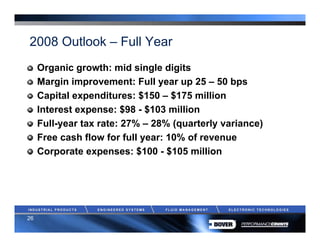
The document provides an overview of RW Baird's Chicago investor roadshow on September 25-26, 2008. It discusses Dover Corporation's record financial results in 2007, its four segment structure, platforms for sustained growth, and strategic capital allocation. Charts are presented showing Dover's revenue and earnings growth over 2003-2007, balanced growth from acquisitions and organic sales, free cash flow generation, and second quarter 2008 performance.


![Execution 04 To 10[1]](https://cdn.slidesharecdn.com/ss_thumbnails/execution04to101-13491792646374-phpapp01-121002070435-phpapp01-thumbnail.jpg?width=640&height=640&fit=bounds)


