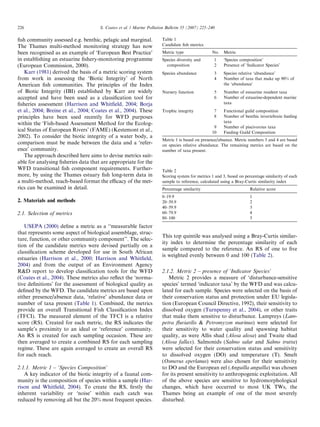
The Transitional Fish Classification Index (TFCI) uses 10 ecological metrics to analyze fish populations in the Thames estuary. These metrics examine species composition, presence of sensitive species, species abundance, number of dominant species, presence of estuary resident species, marine dependent species, trophic guild composition, benthic feeding species, piscivorous species, and feeding guild composition. Samples from different areas and collection methods in the Thames estuary are compared to a reference population from a healthy estuary to determine a relative score for each metric and an overall index score. The TFCI provides an effective way to evaluate fish community health and communicate results to managers and the public.
Tomlinson et al (2016) - sediment & biotaMSTomlinson
This document describes a study that used multivariate statistics to identify sources of analytes in sediments and biota from a shallow-water military munitions disposal site off the coast of O'ahu, Hawaii. 141 sediment samples and 286 biota samples from 4 types of organisms were collected from 4 potential analyte sources and analyzed for elements and explosives. Non-detect values were included as interval-censored data in the analysis rather than being substituted. Nonmetric multidimensional scaling revealed distinct clusters of analytes from discarded military munitions and terrestrial sources. The analyses supported the identification of analyte sources in sediments and showed clustering of biota samples by organism type.
This document summarizes a study examining how selection structures species abundance distributions in an estuarine fish community. The study analyzed 30 years of monthly fish sampling data from the Bristol Channel in the UK. The key findings were:
1) Biomass was concentrated in larger bodied species in guilds occupying habitats with structure (hard-benthic and soft-benthic), which provide protection from predators. However, biomass was not concentrated in larger bodied species in open habitat guilds (pelagic and proximo-benthic) where safety in numbers is important.
2) Guilds differed in the degree to which species associate in groups, with strongly schooling species most common in pel
Population ecology is the study of the relationships between populations and their environment. A population is defined as a group of the same species occupying a particular area. Characteristics of a population include its size, density, and distribution. Biotic interactions like competition and predation regulate population growth. Techniques like quadrat sampling, capture-mark-recapture, and random sampling are used to estimate population size, density, and distribution. Abiotic factors like temperature, light, humidity, and pH influence an organism's population distribution.
This document outlines Anna Cathey's dissertation research on hydro-ecologic modeling in the Okavango River Basin. Her objectives are to: 1) conduct an uncertainty analysis of the Okavango Delta hydrologic model; 2) develop a fish population model driven by the flood pulse; 3) perform an uncertainty analysis of the Pitman rainfall-runoff model in the Okavango Basin; and 4) integrate the models into a linked Okavango modeling environment. She will apply global sensitivity analysis and uncertainty analysis techniques to evaluate parameter importance and model output uncertainty. The research will provide insights into key hydrologic processes and support water resource management under changing conditions.
This document discusses various methods for sampling plant communities. It describes transect and quadrat sampling methods. Transects involve recording plant species along a line or measuring their vertical distribution by digging trenches. Quadrats involve placing a grid and counting organisms within each square. The document also discusses measuring density, coverage, frequency, biomass, and diversity of plant species within samples. It provides formulas for calculating these metrics and comparing values between species.
This document describes two methods for classifying frog calls using machine learning techniques: locality sensitive hashing (LSH) and Gaussian mixture modeling (GMM). For GMM classification, features are extracted from spectrograms of frog calls including filter responses and MFCC coefficients. Gaussian models are trained for each frog species using these features. Classification involves determining the most likely species model for a test call. Tests on 15 frog species showed promising 80% accuracy for GMM, approximating human performance. LSH classification was less accurate, suggesting noise and call variations limit its effectiveness.
This document summarizes a study that investigated the relationship between plasma iron concentration and gastric pH in captive bottlenose dolphins. The study found:
1) There was a strong negative correlation (r = -0.85) between plasma iron concentration and gastric pH in the dolphins, suggesting dolphins with lower gastric pH had higher plasma iron concentration.
2) Gastric pH and plasma iron concentration did not differ significantly over time within individual dolphins or among dolphin pools.
3) Hemosiderosis, an excessive iron storage condition, has been diagnosed in some captive dolphin populations, and gastric pH may play an important role in iron absorption in dolphins.
Emily Shultz-Optimized Seperation of Estuarin Plankton to Determine Associati...Emily Shultz, M.S.
1. The study developed and optimized a method for separating estuarine plankton using a freshwater plankton separator to quantify associations between Vibrio species and different plankton.
2. Results showed the optimal separation time with the least cross-contamination between phytoplankton and zooplankton was between 30-40 minutes.
3. Determining the relationships between plankton species and Vibrio populations could help predict disease outbreaks from contaminated shellfish and inform monitoring of coastal waters.
1) The document describes the quadrat sampling method, a technique used to estimate population sizes of organisms that do not move around much like plants, shells, and some beetles.
2) The method involves constructing quadrats (square frames) of a fixed size within the study area and randomly selecting some number of quadrats. All organisms of the target species within each quadrat are then counted.
3) The average number of each species per quadrat is calculated and multiplied by the total number of quadrats to estimate the overall population size for that species within the entire area.
Plant species and communities assessment in interaction with edaphic and topo...Shujaul Mulk Khan
The current analyses of vegetation were aimed to study the different effects of environmental variables on plant species and communities and their combined interactions to these variables, identified threats to local vegetation and suggestion for remedial measures in the Mount Eelum, Swat, Pakistan. For assessment of environmental variability quantitative ecological techniques were used through quadrats having sizes of 2 × 2, 5 × 5 and 10 × 10 m2 for herbs, shrubs and trees respectively. Result of the present study revealed 124 plant species in the study area. Canonical Correspondence Analysis (CCA) was used to analyze the ecological gradient of vegetation. The environmental data and species abundance were used in CANOCO software version 4.5. The presence absence data of plant species were elaborated with Cluster and Two Way Cluster Analysis techniques using PC-ORD version 5 to show different species composition that resulted in five plant communities. Findings indicate that elevation, aspect and soil texture are the strongest variables that have significant effect on species composition and distribution of various communities shown with P value 0.0500. It is recommended to protect and use sensibly whole of the Flora normally and rare species particularly in the region.
This document analyzes the relationship between flood rhythmicity and ecological patterns and processes in large tropical river systems. It finds that rivers with more rhythmic annual flooding, characterized by predictable timing and magnitude of flood peaks, tend to have higher fish species richness, more stable avian populations, and higher rates of riparian forest productivity compared to rivers with less rhythmic, unpredictable flooding. Climate change and human alterations like water extraction and dams are expected to disrupt the natural hydrologic rhythms of rivers with negative impacts on biodiversity and ecosystem function.
Effect of Climate Change on Copepods Diversity in a Subtropical Pond of JammuAnuragSingh1049
This study examined the diversity of copepod species in Kunjwani pond in Jammu, India over the period of 1989-1990. Five copepod species were identified along with their developmental stages. The copepods exhibited trimodal peaks in density during March, June, and October. Higher densities from January to June were influenced by temperature, suspended matter, pH, dissolved oxygen, calcium and magnesium levels. Species diversity ranged from 0.9583 to 1.6539. The distribution of copepods was found to correlate with physicochemical factors in the pond.
This document summarizes a study that developed habitat suitability models for four cephalopod species (Todaropsis eblanae, Illex coindetii, Eledone moschata, and Eledone cirrhosa) in the Strait of Sicily using data on species densities and environmental variables collected from 1998-2011. Generalized additive models were used to relate species presence/absence and abundance to depth, slope, rugosity, salinity, temperature, chlorophyll-a, and light levels. The models showed different habitat preferences between species that relate to environmental conditions. Predictive maps highlighted key habitat areas that can inform conservation efforts in the region. Further analysis of long-term trends is planned.
corallivory and algal dynamics on some coral reefs in the persian gulfpersiangulf1
Macroalgae are a sign of degradation of coral reefs. Distribution of macroalgae on reefs is moderated by grazers including fish and sea urchins. However, several fish species including certain parrotfishes graze on live coral tissues, at times causing profound damage. In this paper, the positive role of macroalgae in suppressing parrotfish predation on Porites corals, the dominant coral genus in Qeshm Island, is investigated at three research sites at Qeshm Island in the Persian Gulf between April and July 2014 and 2015. Macroalgae, which were abundant in April, decreased significantly in frequency in July, while at the same time, the percentage of Porites colonies, the frequency of fish bite marks on Porites colonies, and the overall area of live coral tissue, which was grazed by parrotfishes increased dramatically, all of which were only negligible in April (with certain exceptions). Nevertheless, no changes were observed in parrotfish abundance. Despite partially supportive statistical data, this phenomenon is more likely to be due to the increased nutritional values of the corals in July in comparison to April. However, to understand the cause(s) and mechanisms involved in this annual phenomenon, more investigations seem necessary.
This document examines the potential effects of Hurricane Katrina on Atlantic bottlenose dolphin reproduction in the Mississippi Sound. It finds that approximately two years after the hurricane, calf encounter rates and the percentage of calves observed significantly increased. This suggests reproduction increased. The increase is likely due to a combination of factors from the hurricane, including increased fish abundance from decreased fishing, fewer boats disturbing dolphins, and more reproductively active females after the storm led to calf losses.
Water-related bird assemblages in an urban pond ‘archipelago’: Winter pattern...Maria Paola Di Santo
This study reports on the patterns of species occurrence, abundance and richness of a wintering water-related bird assemblage in an ‘archipelago’ of 70 small artificial urban ponds (AUPs) embedded in a metropolitan landscape (Rome, central Italy). A total of 20 species in 26 AUPs were sampled. Only the largest AUPs (>0.1 ha) contained all these species, except for Gallinula chloropus. The highest total mean species abundance was observed in the largest ponds, with statistically significant differences evident among size classes. Two significant spatial thresholds in species abundance and richness were observed (between 0.01 and 0.1 ha; between 0.1 and 1 ha in size). The abundance of single species was correlated with their frequency of occurrence. Ponds in urban areas must be larger than 0.1 ha to host a rich winter assemblage of birds, with a further increase in richness noted with a surface area larger than 1 ha. The highest number of species was observed in the larger ponds (>1 ha). The species richness of each AUP is directly correlated to their size (log-transformed species–area relationship: log S = 3.515 + 0.497 log A; R2 = 0.76). Further research should be conducted to confirm these patterns and to implement information useful for planning and management of artificial ponds in urban areas for this purpose.
Lan Nguyen Poster for Science Seminar revisedLan Nguyen
- The study examined the relationship between morphology and niche partitioning of fish assemblages in the Tonle Sap Biosphere Reserve in Cambodia. 27 fish species were sampled and 31 morphological features were measured.
- Principal component and cluster analysis revealed relationships between morphological characteristics and habitat/trophic groups, indicating niche partitioning allows coexistence of competing species.
- The high biodiversity of fish in the Tonle Sap is due to seasonal flooding patterns that provide different habitats and allow fish to occupy different ecological niches. Understanding these relationships can help manage fisheries in this important ecosystem.
- The study quantified predation along an urbanization gradient in Denmark using artificial caterpillars that could be identified by marks left by predators.
- In forest habitats, chewing insects exerted the greatest predation pressure (52.1%), while ants and mammals had lower rates. In suburban forests, mammals had the highest rate of predation (22.2%). In urban forests, ants and chewing insects had similar predation rates of 16.4%.
- Predation rates varied seasonally, with chewing insects increasing from spring to autumn in forests, mammals highest in summer in suburban forests, and ants highest in spring in urban forests. Overall, caterpillars were more likely to survive in urban and suburban areas compared
Marine Species Distributions: From Data to Predictive ModelsSamuel Bosch
Presentation of my PhD as used at the public defence in June 2017.
Thesis outline:
Chapter 1: General Introduction
Chapter 2: Fishing for data and sorting the catch: assessing the data quality, completeness and fitness for use of data in marine biogeographic databases
Chapter 3: sdmpredictors: an R package for species distribution modelling predictor datasets
Chapter 4: In search of relevant predictors for marine species distribution modelling using the MarineSPEED benchmark dataset
Chapter 5: Spatio-temporal patterns of introduced seaweeds in European waters, a critical review
Chapter 6: A risk assessment of aquarium trade introductions of seaweed in European waters
Chapter 7: Modelling the past, present and future distribution of invasive seaweeds in Europe
Chapter 8: General discussion
SAITHE AND HAKE SPATIAL INTERACTIONS IN THE NORTH SEAXochitl CORMON
We investigated the ecology and spatial distribution of saithe (Pollachius virens) and hake (Merluccius merluccius) in a relevant region for fishery economy: the North Sea. While saithe is an important commercial species with spawning stock biomass declining in recent years, hake occurrence have been increasing in the area. In order to understand if these two species are spatially correlated, their potential habitat was studied during winter using binomial generalized linear models (GLMs) based on the 1st quarter data of the International Bottom Trawl Survey from 1991 to 2012. Species occurrence was modeled as a function of different external factors at the scale of the statistical rectangle. Explanatory variables were grouped by category (abiotic, biotic and spatial factors). Each group was then tested either separately or in combination. Biotic explanatory variables included several fish species with a supposed trophic link: saithe, hake, cod (Gadus morhua), Norway pout (Trispoterus esmarkii) herring (Clupeus harengus) and blue whiting (Micromesistius poutassou). Abiotic factors included depth, temperature and sediment type. Based on results we decided to exclude spatial factors before variable selection. The results were then used to map potential habitat for both species and study, for the first time in the North Sea, their spatial overlap. This has been performed by comparing an early (1991-1996) and a late period (2007-2012). An increase in the probability of presence for both saithe and hake has been noticed. Although saithe coverage has remained spatially consistent over the last 20 years (IVa and IIIa), hake distribution has expanded toward south. Whereas the overlap between the two species slightly expanded, the probability of presence of both species together has greatly increased. These results are important in a context of an ecosystem approach to fisheries and will be completed with stomach content analysis study currently in progress.
This study assessed the biodiversity of finfish within and around the Admiral Cockburn Land and Sea National Park MPA near South Caicos. Underwater visual surveys were conducted at 6 sites inside and 6 sites outside the MPA boundary. Species abundance and diversity were calculated using density scores and Shannon-Wiener indices. Results found no significant difference in diversity between sites inside and outside the MPA. This suggests the MPA was not effectively protecting biodiversity, possibly due to being established without scientific planning or lack of connectivity between protected areas. While density scores provided abundance data, Shannon-Wiener indices were needed to accurately compare diversity between sites for MPA assessment.
IRJET - Studies on Algal Flora in Fox Sagar Lake, Jeedimetla, HyderabadIRJET Journal
1. The document studied the algal flora in Fox Sagar Lake in Hyderabad, India over a two year period.
2. Four groups of algae were observed - Cyanophyceae, Chlorophyceae, Bacillariophyceae, and Euglenophyceae. Cyanophyceae dominated all groups, making up around 80% of algae.
3. The abundance and distribution of different algal groups varied seasonally and was influenced by environmental factors like temperature, organic matter, nutrients. Cyanophyceae blooms indicated eutrophic conditions in the lake.
Three distinct groups of picoplankton were identified in the Patagonian Shelf region: Prochlorococcus, Synechococcus, and picoeukaryotes. Prochlorococcus populations were detected at four stations within the Brazil Current but did not extend further south than 40°S. Cyanobacterial abundance, primarily Synechococcus, was greatest in warmer, more oligotrophic conditions corresponding to regions outside the shelf break. Picoeukaryotes dominated at most other stations. Heterotrophic bacteria abundances were two orders of magnitude higher than autotrophs, indicating rapid nutrient recycling. Cyanobacterial abundance correlated positively with temperature and negatively with nutrients, influenced by hydrographic features and seasonal blooms in the
The document outlines a study to determine the population sizes of two plant species, mimosa pudica and imperata cylindrica, in a school field. Quadrats of 1m x 1m will be used to count the coverage of each species in random locations. The percentage coverage will be calculated for each species and compared to test the hypothesis that mimosa pudica has a higher population size than imperata cylindrica in the school field. Materials needed include the two plant species, quadrats, recording materials, and tools for calculating percentages.
This thesis examines population dynamics of Northern Cardinals and Carolina Wrens in an urban forest fragment using capture-mark-recapture analysis of data collected from 2010-2014. The study aims to determine if the forest fragment acts as a safe refuge or ecological trap for these species. Capture-mark-recapture was used to estimate survival, recruitment, and population growth rates as a function of sex, age, body size, season, and year. Results will help understand how these species persist in small habitat fragments and identify life stages most impacting population persistence to inform conservation efforts.
This document discusses a study on the fate and effects of the fragrance material acetyl cedrene (AC) in sediments inhabited by the benthic molluscs Macoma balthica and Mya arenaria. An experiment was conducted over 14 days to analyze the concentrations of AC in sediment, water, and tissue samples using GC-MS analysis. Preliminary results suggested the test organisms were not efficient at biotransforming AC. The presence of AC also delayed burrowing behavior in the studied species. Some mortality was observed but was not attributed to AC exposure. The document provides background on AC properties, uptake routes in aquatic organisms, and hypotheses that M. balthica would have a greater impact on AC fate due to
This document provides floor plans and summaries for two AutoCAD drawings: a single-detached two-storey residential building. The ground floor plan and second floor plan illustrate skills like layer management, accurate dimensions, annotations, and adhering to building code requirements. Creating clean 2D plans is an important skill for planning and development. The ability to efficiently use CAD software makes one a more versatile team member than relying on other departments.
Evaluation 5: How did you attract/address your audeince.LaraMurray1998
The document discusses how the filmmakers attracted their target audience for a mystery film project. They used common horror tropes like a young female protagonist and scenes of blood. They also employed suspense elements like scattered beads and a puddle of blood to engage the audience. The setting of a large country house with fields was meant to seem safe yet allow for unexpected violence. The characters of the middle-class teenage girl and family dog were intended to be relatable.
This document summarizes a study to quantify uncertainty in the Transitional Fish Classification Index (TFCI) tool used to assess ecological status of fish communities in estuaries under the Water Framework Directive. The study conducted a sensitivity analysis of how the observed ecological quality ratio (EQR) is affected by factors like sampling effort, monitoring strategy, and location/timing of sampling. It developed methods to estimate the true EQR and assess confidence in the classification by accounting for biases from different monitoring approaches. The key findings were that observed EQR increases with sampling effort but is also influenced by gear type, number of sites/years sampled, and season. Standardizing monitoring strategies could improve comparability, and statistical techniques like bootstrapping may
James N. Stapleford is seeking a Logistic Management Specialist position at Fort Hood, Texas. He has over 30 years of experience in logistics and leadership roles in the Army Reserve. He is knowledgeable in various logistics systems such as PBUSE, SAMS-E, DPAS, and GCSS-Army. His experience includes providing logistics support to Army units, managing maintenance and inventory, and supervising over 300 mechanics. He has a Secret security clearance and is proficient in Microsoft Office applications.
This resume is for Osama Abdel-Tawab Abou Shady, who has over 18 years of experience in IT management, project management, and service delivery management. He has various technical certifications and is pursuing additional certifications in networking and project management. The resume provides details on his educational background, skills, work history at three previous employers over 11 years, and responsibilities in roles including IT group manager, IT manager, and business analyst for ERP systems.
This document is a resume for Neha Jain, an interior designer based in Ranchi, India. It outlines her education background including a Masters in Product Design from Nottingham Trent University, UK. It details her work experience on various residential and commercial interior design projects from 2013-present. It also lists her skills, responsibilities, educational qualifications, achievements and referees.
Modern Receptionist provides virtual receptionist services that allow businesses to have a dedicated receptionist without the costs of hiring and maintaining staff. It ensures no calls go unanswered and all customers receive personalized, professional service. This allows business owners to focus on growing their business rather than getting distracted by administrative tasks like handling phone calls. Modern Receptionist also offers a free trial so businesses can test the effectiveness of the service.
Portfolio is a document that showcases a designer's work. It includes examples of past design projects to demonstrate their skills and experience. An interior designer's portfolio might contain photos of rooms they have designed along with details about the design brief, materials used, and client feedback to help land new design jobs.
The document introduces the Vinil wallpaper factory in Ukraine. It discusses the factory's 20 years of experience producing high quality wallpaper. The factory uses modern technology and a closed production cycle to produce over 3 million rolls of various types of wallpaper per month, including vinyl, wash-resistant, and hot embossed styles. The factory has certification for quality management and product standards. It distributes products across Ukraine, Europe, and Asia through a large network and truck fleet.
The document summarizes the Amazing Lash Studio eyelash extension franchise opportunity. It describes Amazing Lash Studio as the gold standard in the beauty industry that is dedicated to raising the bar on eyelash extensions. The franchise offers a year-round recurring business model with support including training, marketing assistance, and operational tools. Franchisees can expect to invest between $200,000-$340,500 for a single unit or $212,500-$663,500 as an area representative.
This document discusses cooling water options for new nuclear power stations in the UK. It provides an overview of different cooling system designs, including direct once-through systems and various cooling tower options. It evaluates the environmental impacts of water abstraction and thermal discharges for each system. While direct cooling can have impacts on aquatic life from intake and discharge, the document finds it can be considered best available technology if best practices for design, mitigation and compensation are followed. Site-specific factors will also determine the suitability of different options.
This document provides a review of biomonitoring approaches and bioindicators used for river ecosystems. It discusses key concepts in biomonitoring and defines bioindicators. The most common bioindicators for rivers - periphyton, benthic macroinvertebrates, and fish - are described in detail. Their importance in river ecosystems and advantages for biomonitoring are highlighted. Commonly used biomonitoring approaches include diversity indices, biotic indices, multimetric indices, and functional trait approaches. Biotic indices and multimetric approaches are frequently applied to evaluate river health, but functional measures are increasingly used as a complementary approach. Recent research also demonstrates the potential of molecular techniques to enhance taxonomic
This document describes the development of a food web matrix for the Gulf of Mexico based on combining diet data from various sources. Predators and prey were grouped into 48 functional groups. Diet data from multiple studies were statistically analyzed using Dirichlet distributions to quantify the likely contributions of prey to predator diets and the associated error ranges. A hierarchical cluster analysis was performed to identify functional groups with similar diets. The revised food web was then compared to other published Gulf of Mexico food webs. Finally, an ecosystem model simulation using the revised diet matrix showed improved model fits compared to using the previous diet matrix.
This study compared passive and active macroinvertebrate collection methods along the Susquehanna River in Pennsylvania. Passive methods included rock baskets and Hester-Dendy samplers, while active methods used D-frame nets and Serber samplers. The diversity, pollution tolerance, and taxonomic composition of collected macroinvertebrates were analyzed. Results showed that active methods captured a more diverse set of organisms but passive methods also provided valuable data. Both collection types should be used to fully understand macroinvertebrate communities in non-wadeable rivers.
Reporting the first year of results towards a Canada-wide evaluation of fresh...James Snider
Presentation at the Genomes to Biomes 2014 joint meeting of the Canadian Society of Ecology and Evolution, Canadian Society of Zoology, and the Limnology Society of Canada.
Relationship Between Sampling Area, Sampling Size Vs...Jessica Deakin
This document discusses the importance of order in the public realm and how planning, zoning, transects, and urbanism theories help shape our environment. It mentions several authors who have discussed problems with urban design and provided solutions to make the public realm a better place. The document argues that by improving order and the urban framework, cities could become more cohesive in design.
TitleABC123 Version X18Analyzing Ecological Systems.docxherthalearmont
Title
ABC/123 Version X
1
8Analyzing Ecological SystemsOption 2: Gulf Oil Spill Case Study
Resource: University of Phoenix Library
Write a 700- to 900-word analysis of the British Petroleum Oil Spill in the Gulf of Mexico. Include the following in your paper:
· Describe the main events of the incident and the principle parties involved in a timeline.
· Describe the laws enforced at the time.
· List the ecological risks of the affected area at the time of the spill.
· Forecast what may be required of the oil industry relative to future risk assessments.
· How can economic value be allocated in this scenario?
· Describe the process of defining ecological value and discuss the application of probabilistic risk assessment methods in this case. Discuss the hazards and the risk uncertainties that can lead to a reanalysis of this case using probabilistic assessment.
· Describe how the risk assessment correlated to observed field studies and evaluate the importance of this type of correlation in general for all risk assessment efforts.
· What are the ecological and social values of concern in this case?
· Establish a value for the ecological components in this case. Are there any tradeoffs between wildlife and development? Why or why not? How is this risk assessment actually determined?
Cite two references.
Format your analysis consistent with APA guidelines.
Reference
Chapter 22
Using Probabilistic Risk Assessment Methods to Predict Effects of Pesticides on Aquatic Systems and Waterfowl That Use Them
PATRICK J. SHEEHAN and JOHN WARMERDAM
Exponent, Oakland, California
SHIH SHING FENG
PE Biosystems/Celera, Foster City, California
22.1 INTRODUCTION
One of the most comprehensive of the early prospective ecological risk assessments published is the Canadian Wildlife Service study entitled “The Impact of Pesticides on the Ecology of Prairie Nesting Ducks” (Sheehan et al., 1987). This assessment was conducted to evaluate the potential direct toxic effects of the more commonly used organochlorine and organophosphate insecticides and the more recently developed pyrethroid insecticides on aquatic macroinvertebrates in sloughs in the pothole region of Canada and the subsequent indirect impact of invertebrate mortality (loss of food resources) on duckling survival and recruitment. Although this assessment provided a thorough and quantitative analysis of the potential risks to duck populations associated with the aerial spraying of insecticides in the agricultural region of the Canadian Prairie and was used to develop a program to manage those risks, the assessment was incomplete by today’s standards in that it did not include a quantitative analysis of uncertainties (SETAC, 1998). A probabilistic approach, where input parameters are characterized as distributions of plausible values, is now employed to represent the variability inherent in diverse populations as well as the uncertainty implicit in the quantification of environmental factors ...
Seven Ozark stream sites were sampled and their macroinvertebrate communities assessed. The sites varied in phosphorus concentration from 0.013 to 0.042 μg/L. Results showed Kings River had the highest percentage of pollution-sensitive EPT taxa and lowest ratio of pollution-tolerant to intolerant organisms, indicating best health. White River had the highest percentages of pollution-tolerant organisms and Chironomidae, and lowest EPT, indicating most impairment. Percentage of pollution-tolerant organisms increased with higher phosphorus levels at most sites.
This document discusses the challenges of selecting biodiversity indicators and how different value systems can lead to different indicator choices. It proposes three indices to represent different value systems in agricultural landscapes: 1) conservation value based on rare/threatened species, 2) ecological resilience based on species diversity, and 3) biological control based on diversity of pest antagonists. It emphasizes that indicators need to be tested to ensure they correlate with the biodiversity aspect being measured and that simply adding indicators may be misleading if they represent different values.
This document discusses a study that assessed the genetic diversity of two tree species, Brachystegia boehmii and Burkea africana, across a fire gradient in the Niassa National Reserve in Mozambique using ISSR molecular markers. The results showed high levels of genetic polymorphism and diversity in both species. B. africana displayed higher diversity, likely due to its greater tolerance to fire. While fire differentially impacted genetic diversity between the species, overall diversity was high and population survival does not seem threatened by fire frequency, consistent with the reserve being a less disturbed miombo woodland area.
This document discusses various methodologies for assessing biodiversity, including commonly used indices. It begins by explaining why biodiversity should be studied, such as monitoring obligations from the Convention on Biological Diversity. It then outlines species richness indices like Simpson's and Margalef indices, as well as species diversity indices including Shannon-Wiener. The document also discusses evenness indices and newer approaches like Hill Numbers and Caswell Neutral Models that unify diversity measures. It concludes by noting limitations of conventional indices and recently introduced alternatives.
This document summarizes a study on the age, growth, and mortality of Tylochromis jentinki, an important fish species for fisheries in Ebrié Lagoon, Ivory Coast. Monthly samples of 1850 T. jentinki were collected between 2004-2006. Growth parameters were estimated using length frequency data analyzed with ELEFAN, including L∞=25 cm, K=0.67 yr-1, and t0=-0.28 yr-1. Total mortality (Z) was estimated at 2.38 yr-1, with fishing mortality (F) of 0.93 yr-1 and natural mortality (M) of 1.45 yr-1. The stock was considered
This document summarizes a study that examined biological factors correlated with extinction risk in resident bird species in the Philippines. The researchers compiled data on 446 resident bird species and analyzed 10 biological traits using generalized linear mixed models. The top-ranked model found that endemic species, those with narrower elevational ranges, high forest dependency, and larger body size were most at risk. Based on the model, some species classified as Least Concern may be more threatened than currently thought. The researchers predict higher threat levels for several species.
Near and mid-infrared spectroscopic determination of algal compositionzhenhua82
Near- and mid-infrared spectroscopy were evaluated for their ability to determine the composition of algal turf scrubber (ATS) samples. A set of 117 ATS samples spanning a range of nitrogen, phosphorus, ash, sugar, lipid, and fatty acid contents were analyzed using near-infrared reflectance spectroscopy (NIRS), mid-infrared reflectance spectroscopy (MIRS), and conventional wet chemistry methods. NIRS and MIRS produced accurate determinations of ash and total nitrogen content but not phosphorus, total sugar, or mono-sugar content. Neither NIRS nor MIRS could accurately determine lipid or total fatty acid content in ATS samples. The results indicate that N
Lecture about Monitoring and Biodiversity Indices, with linkage to on-going CBD programs, and a special focus on species monitoring.Many examples, needs some formatting, hope still useful!
Analyses of Community Attributes of Meiofauna Under A Pollution Regime in the...Agriculture Journal IJOEAR
— Meiofauna community attributes of the lower Bonny estuary was investigated under a pollution regime. This is germane because of the strategic importance of meiofauna in the food chain and the sustenance of any aquatic ecosystem. Five stations representing diverse land based activities such as refuse dump site, fuel depot, fishing-landing areas, residential housing and a station located upstream (control) were chosen for investigation. The meiofauna samples were collected from sediments in three replicate spots per station per sampling months at low tide. Sediment samples were stirred through (63-212nm) meshes to separate meiofauna and organic debris. Meiofauna samples were processed by first washing Meiofauna through a sieve of fine mesh size made of silk material, in order to wash off formation and excess silt or mud. Meiofauna samples were sorted out and identified using standard keys. Result from field studies indicate that meiofauna population abundance and diversity varied slightly between stations and seasons. There was however, no established trend. Meiofauna were generally more abundant in the rainy season than in the dry season. In general, pollution indicator meiofaunal taxa were more in all stations except the control station; the increasing impact of pollutants in the river led to a rise in the relative abundance of r-strategist genera like Chromadora. We conclude that the application of meiofaunal indices can be a useful tool for assessing the environmental quality of estuarine ecosystems.
This document reviews research papers on the application of environmental DNA (eDNA) in biomonitoring and assessment of aquatic ecosystems. eDNA refers to genetic material from living organisms present in environmental samples like water and sediment. DNA metabarcoding allows identification of many species simultaneously in a sample by sequencing short, standardized DNA regions. Potential applications of eDNA include detection of single species, surveys of biodiversity and community composition, and bioassessment using biotic indices. Monitoring programs currently rely on time-consuming organism identification but eDNA-based approaches could enable higher temporal and spatial resolution.
The document evaluates 5 methods for sampling benthic macroinvertebrates in desert sinkholes: an epibenthic sled, Hester-Dendy multiplate samplers, light traps, a Ponar grab, and a pump sampler. It finds that light traps captured the most taxa and individuals. H-D samplers and Ponar grabs added additional taxa, especially gastropods. Combined use of light traps, H-D samplers, and Ponar grabs is recommended to obtain a good representation of benthic invertebrates in sinkholes, detecting 84-100% of taxa in each sinkhole. Placement of H-D samplers in both littoral and profund
2017 - Environmental Ordination of Filamentous Bacteria in Activated SludgeWALEBUBLÉ
Reference:
Zornoza, A., Serrano, S. and Alonso, J.L. (2017) Environmental Ordination of Filamentous Bacteria in Activated Sludge. In: Abstracts of the 7th congress of European microbiologists FEMS 2017, Valencia, Spain, 9-13 July 2017.
Biodiversity indices provide mathematical measures of diversity in communities. They quantify species richness, evenness, dominance, and incorporate both the number of species and their abundances. Common indices include Simpson's index, Shannon-Wiener index, and Evenness index. They are used to measure diversity at different spatial scales like alpha, beta, and gamma diversity. The Index of Biotic Integrity also synthesizes biological data to evaluate biological condition and integrity of aquatic ecosystems based on fish communities and metrics.
Effect of Stocking Density on the Resistance to Fasting, Growth and Survival ...Agriculture Journal IJOEAR
Abstract— After artificial reproduction of African catfish Heterobranchus bidorsalis, larvae of two days old and 2.18 ± 0.35 mg of mean weight were used to perform two experiments in order to assess the effect of stocking density on their fasting resistance, growth and survival. During the first experiment which lasted 11 days with four batches of larvae at densities of 1, 2, 3 and 4 individuals/ml, results showed that density did not significantly affect (p˂0,05) the resistance to fasting of larvae. However, first mortalities were observed at D5 for all the densities, the higher daily mortality was recorded at D10 and the last mortalities were obtained at D12.
Results of the second experiment revealed that the weight and growth performance of larvae decreased with the increasing of the density after 28 days of rearing. In contrast, the larval survival rate increased with the density. The values of survival rate were respectively 30.53 ± 4.32 and 55.30 ± 21.70 % for the densities 1 ind./l and 20 ind./l.
Effect of Stocking Density on the Resistance to Fasting, Growth and Survival ...
Coates et al
1. Efficacy of a multi-metric fish index as an analysis tool for
the transitional fish component of the Water Framework Directive
Steve Coates *, Adam Waugh, Alice Anwar, Matthew Robson
Environment Agency, Rivers House, Crossness Works, Belvedere Road, Abbeywood, London SE2 9AQ, UK
Abstract
The WFD has introduced an international commitment to assess the ecological status of transitional waters (TWs), within which fish
communities are a key biological monitoring component. The Transitional Fish Classification Index (TFCI) outlined in this paper uses
10 ecological measures to analyse fish populations caught from various ecological niches using a variety of gear types within the Thames
estuary. These reach and method-specific communities are then compared to a reference population created from a ‘healthy’ population
from TWs of a similar type. The results indicate a progressive downstream increase the quality of fish communities, consistent with pre-
vious work; variation between methods can be accounted for by gear selectivity. Overall, the TFCI is an effective communication tool for
converting ecological information into an easily understood format for managers, policy makers and the general public.
Ó 2006 Elsevier Ltd. All rights reserved.
Keywords: WFD; Thames estuary; IBI; Biological indicators; Ecosystem health; Fish
1. Introduction
The Water Framework Directive (WFD) has introduced
an international commitment to assess the ecological status
of transitional waters (estuaries), within which fish commu-
nities are a key biological monitoring component (Euro-
pean Council Directive, 2000). Fish communities can be
described according to a variety of characteristics such as
composition, trophic structure and diversity of the assem-
blage, as well as abundance and biomass of the individuals
(Harrison et al., 2000; Lobry et al., 2003; Coates et al.,
2004; Harrison and Whitfield, 2004). Trends in one or more
of these community attributes can be used to monitor the
ecological functioning and ‘health’ of a particular ecosys-
tem (Whitfield and Elliott, 2002).
The WFD specifies that the transitional fish quality ele-
ment is to be assessed by taking account of the composition
and abundance of the fish fauna and that of disturbance-
sensitive taxa. In order to carry out an integrated approach
to assess the fish community of the Thames estuary, a num-
ber of attributes have been incorporated into a single multi-
metric index. This methodology has been used in many
other studies, (Miller et al., 1988; Deegan et al., 1997; Har-
rison et al., 2000; USEPA, 2000; Goethals et al., 2002;
Borja et al., 2004; Breine et al., 2004).
As part of the assessment of the fish faunal assemblage
within an estuary, a number of monitoring techniques
and sampling strategies have been developed (Hemingway
and Elliott, 2002). Environment Agency, Thames Region
has established a long-term monitoring programme based
on the recovery of the Thames estuary, with the initial sur-
vey work based on power station fish impingement
(Wheeler, 1979; Attrill, 1998; Kirk et al., 2002). However,
with the decommissioning of the Thames power stations
and the need to address the data gaps caused by this sin-
gle-strand survey approach, a multi-method monitoring
programme was established (Colclough et al., 2000,
2002). This approach combines a variety of methods such
as seine netting, beam trawling and otter trawling. Differ-
ent survey techniques have varying gear selectivities so it
is important to incorporate a suite of techniques (von
Brandt, 1964) to obtain a comprehensive picture of each
0025-326X/$ - see front matter Ó 2006 Elsevier Ltd. All rights reserved.
doi:10.1016/j.marpolbul.2006.08.029
*
Corresponding author.
E-mail address: steve.coates@environment-agency.gov.uk (S. Coates).
www.elsevier.com/locate/marpolbul
Marine Pollution Bulletin 55 (2007) 225–240
2. fish community assessed e.g. benthic, pelagic and marginal.
The Thames multi-method monitoring strategy has now
been recognised as an example of ‘European Best Practice’
in establishing an estuarine fishery-monitoring programme
(European Commission, 2000).
Karr (1981) derived the basis of a metric scoring system
from work in assessing the ‘Biotic Integrity’ of North
American fish communities. The principles of the Index
of Biotic Integrity (IBI) established by Karr are widely
accepted and have been used as a classification tool for
fisheries assessment (Harrison and Whitfield, 2004; Borja
et al., 2004; Breine et al., 2004; Coates et al., 2004). These
principles have been used recently for WFD purposes
within the ‘Fish-based Assessment Method for the Ecolog-
ical Status of European Rivers’ (FAME) (Kestemont et al.,
2002). To consider the biotic integrity of a water body, a
comparison must be made between the data and a ‘refer-
ence’ community.
The approach described here aims to devise metrics suit-
able for analysing fisheries data that are appropriate for the
WFD transitional fish component requirements. Further-
more, by using the Thames estuary fish long-term data in
a multi-method, reach-based format the efficacy of the met-
rics can be examined in detail.
2. Materials and methods
2.1. Selection of metrics
USEPA (2000) define a metric as a ‘‘measurable factor
that represents some aspect of biological assemblage, struc-
ture, function, or other community component’’. The selec-
tion of the candidate metrics were devised partially on a
classification scheme developed for use in South African
estuaries (Harrison et al., 2000; Harrison and Whitfield,
2004) and from the output of an Environment Agency
R&D report to develop classification tools for the WFD
(Coates et al., 2004). These metrics also reflect the ‘norma-
tive definitions’ for the assessment of biological quality as
defined by the WFD. The candidate metrics are based upon
either presence/absence data, ‘relative’ abundance data or
number of taxa present (Table 1). Combined, the metrics
provide an overall Transitional Fish Classification Index
(TFCI). The measured element of the TFCI is a relative
score (RS). Created for each metric, the RS indicates the
sample’s proximity to an ideal or ‘reference’ community.
An RS is created for each sampling occasion. These are
then averaged to create a combined RS for each sampling
regime. These are again averaged to create an overall RS
for each reach.
2.1.1. Metric 1 – ‘Species Composition’
A key indicator of the biotic integrity of a faunal com-
munity is the composition of species within a sample (Har-
rison and Whitfield, 2004). To create the RS, firstly the
inherent variability or ‘noise’ within each catch was
reduced by removing all but the 20% most frequent species.
This top quintile was analysed using a Bray-Curtis similar-
ity index to determine the percentage similarity of each
sample compared to the reference. An RS of one to five
is weighted evenly between 0 and 100 (Table 2).
2.1.2. Metric 2 – presence of ‘Indicator Species’
Metric 2 provides a measure of ‘disturbance-sensitive
species’ termed ‘indicator taxa’ by the WFD and was calcu-
lated for each sample. Species were selected on the basis of
their conservation status and protection under EU legisla-
tion (European Council Directive, 1992), their sensitivity to
dissolved oxygen (Turnpenny et al., 2004), or other traits
that make them sensitive to disturbance. Lampreys (Lam-
petra fluviatilis & Petromyzon marinus) were selected for
their sensitivity to water quality and spawning habitat
quality, as were Allis shad (Alosa alosa) and Twaite shad
(Alosa fallax). Salmonids (Salmo salar and Salmo trutta)
were selected for their conservation status and sensitivity
to dissolved oxygen (DO) and temperature (T). Smelt
(Osmerus eperlanus) were also chosen for their sensitivity
to DO and the European eel (Anguilla anguilla) was chosen
for its present sensitivity to anthropogenic exploitation. All
of the above species are sensitive to hydromorphological
changes, which have occurred to most UK TWs, the
Thames being an example of one of the most severely
disturbed.
Table 1
Candidate fish metrics
Metric type No. Metric
Species diversity and
composition
1 ‘Species composition’
2 Presence of ‘Indicator Species’
Species abundance 3 Species relative ‘abundance’
4 Number of taxa that make up 90% of
the ‘abundance’
Nursery function 5 Number of estuarine resident taxa
6 Number of estuarine-dependent marine
taxa
Trophic integrity 7 Functional guild composition
8 Number of benthic invertebrate feeding
taxa
9 Number of piscivorous taxa
10 Feeding Guild Composition
Metric 1 is based on presence/absence. Metric numbers 3 and 4 are based
on species relative abundance. The remaining metrics are based on the
number of taxa present.
Table 2
Scoring system for metrics 1 and 3, based on percentage similarity of each
sample to reference, calculated using a Bray-Curtis similarity index
Percentage similarity Relative score
0–19.9 1
20–39.9 2
40–59.9 3
60–79.9 4
80–100 5
226 S. Coates et al. / Marine Pollution Bulletin 55 (2007) 225–240
3. If any of the above taxonomic groups were present, a
score of 1 was assigned to the sample. Scores were adjusted
according to the sample method and are based upon the
probability of capture for each species per sample tech-
nique. Seine net samples, for example, included shads, lam-
preys, salmonids, eels and smelt whereas only eels, smelt
and lampreys were included for beam and otter trawling.
2.1.3. Metric 3 – species relative ‘abundance’
Similarly to Metric 1, the abundance of species provides
an excellent indicator of biotic integrity (Harrison and
Whitfield, 2004). Unlike Metric 1 where a presence or
absence of taxa was used to create an RS, the relative abun-
dance of individuals per sample was used to create the
score. Similarly to metric 1, only the top quintile of most
abundant species per sample were compared to the refer-
ence using a Bray-Curtis similarity index. The RS was
derived from the per cent similarity values. It is calculated
as a percentage of each taxa present in relation to total
number or relative abundance caught.
2.1.4. Metric 4 – number of taxa that make up 90% of
abundance
A healthy, unimpacted estuary will contain many species
without a dominating presence from one or only a few spe-
cies. By considering how many species make up 90% of the
catch, one can determine whether dominating taxa are
present.
The number of taxa were counted for each sample and
ranked from the most to the least frequent. The mean num-
ber of taxa within the upper quintile (top 20%) was deter-
mined and used as the boundary value between RS4 and
RS5. Percentages of this value were used to calculate the
boundaries for each metric. Each boundary range had an
associated score (Table 3).
2.1.5. Metric 5 – number of estuarine resident taxa
Metrics 5–7 are based on the number of functional
guilds represented by the fish in each sample. Each fish spe-
cies was allocated to a ‘Guild’ that best describes its life his-
tory characteristics within an estuary (Elliott and Dewailly,
1995; Hemingway and Elliott, 2002):
• Estuarine residents (ER) – Fishes that spend their entire
life in estuaries.
• Marine seasonal species (MS) – Fishes that use estuaries
for part of the year.
• Freshwater species (FW) – Fishes that are present
mainly or exclusively at low salinity values.
• Marine juvenile species (MJ) – Fishes that use estuaries
as nursery grounds or during juvenile phases of their life
cycle.
• Diadromous species (CA) – Species that migrate
between fresh and salt water during different life stages.
• Marine adventitious species (MA) – Species that are
considered fully marine but inhabit estuaries
temporarily.
For Metric 5 the estuarine resident species were filtered
in each sample. The method described above in Metric 4
was followed to create a score from one to five.
2.1.6. Metric 6 – number of estuarine-dependent marine taxa
For this metric, fish that are dependent on estuaries dur-
ing the early life phases or during particular parts of the
year (marine juveniles or marine seasonal) were treated in
the similarly to Metric 4.
2.1.7. Metric 7 – functional guild composition
An unimpacted, healthy estuary should contain species
of fish that represent all functional guilds (Elliott and
Dewailly, 1995; Hemingway and Elliott, 2002), although
one must account for the fact that an estuary is highly het-
erogeneous. It is therefore unlikely to catch freshwater spe-
cies in the lower estuary, for instance. So Metric 7 was
adjusted according to the section of the transitional water
(TW) analysed. All functional guilds apart from the fresh-
water taxa were scored in the mid and lower data sets and
in the upper TW, all guilds were scored except marine
adventitious species. Scores were assigned according to
the number of taxa present (Table 4).
2.1.8. Metric 8 – number of benthic invertebrate feeding taxa
Feeding guilds have been used for some time as a way to
evaluate fish communities and structure (e.g. Goldman and
Talbot, 1976). Increased levels of anthropogenic stress have
also been shown to remove one of more of the feeding
guilds (Harrison and Whitfield, 2006). The feeding guilds
used for metrics 8–10 were developed by Whitfield (1998):
benthic invertebrate feeders, zooplankton feeders, piscivo-
rous feeders and detritus feeders. For this metric, fish
caught that are considered to feed exclusively or mainly
on bottom-dwelling invertebrates were considered for anal-
ysis. RS creation and score allocation was derived in a sim-
ilar fashion to metric 4.
Table 3
Example of scoring system used for metrics 4–6, 8 and 9. Example is based
on the upper quintile having a mean of 6 taxa
Percentage of mean Boundaries RS
0–19.9 <1.19 1
20–39.9 1.2–2.39 2
40–59.9 2.4–3.59 3
60–79.9 3.6–4.79 4
80–100 4.8+ 5
Table 4
Scoring system for metric 7 showing the score assigned according to the
number of taxa present
Number of taxa Score
0–1 1
2 2
3 3
S. Coates et al. / Marine Pollution Bulletin 55 (2007) 225–240 227
4. 2.1.9. Metric 9 – number of piscivorous taxa
For this metric, only fish caught that are recognised as
only or exclusively feeding on other fish were analysed
(Hemingway and Elliott, 2002). The method used to create
the RS and score for metric 4 was used.
2.1.10. Metric 10 – feeding guild composition
The premise of metric 7, that a healthy estuary should
contain certain functional guilds of fish, is presented here
for feeding guilds. For an estuary to be considered of good
quality in terms of fish species, a member of each guild
should be represented in each sample (Table 5).
2.2. Method-specific reference
An ideal reference community is derived from the same
site at the same time of year using the same methods, dur-
ing a period when the environment is pristine and no
anthropogenic changes have occurred. For many water
bodies, samples have only been taken after significant
changes in hydrology and morphology are present so no
‘reference’ data is available for the actual site analysed.
Such a situation exists for the Thames estuary. London
was the first city in the world to witness changes from a less
agrarian towards a more urban society during the indus-
trial revolution. At this point 150 years ago, changes in
water quality, community structure and hydrology began,
causing a change away from a ‘reference’ community
(Wheeler, 1979).
Spatial and temporal variations in fish communities can
lead to bias in both sampling and analysis and can result in
a false representation of the ecosystem measured (Malavasi
et al., 2004). Therefore the data was compared to a refer-
ence community that was limited spatially, temporally
and by type.
The Thames TW is defined by UK typology (UK TAG,
2004; Vincent et al., 2002) of ecotype E4T3 i.e. the water-
body is within the North Sea (WFD Ecoregion 4) and is
a fully mixed, polyhaline, macrotidal, sheltered estuary
with extensive intertidal areas (Type 3). All available data
from all TWs of E4T3 was used as a reference against
which to compare the Thames data.
The abundance data for each of these TWs (Thames,
Medway, Swale, Humber, Great Ouse and the Wash) was
divided into three reaches or ‘bodies of surface water’
(WFD Ref Article 2.9). These reaches represent an upper,
middle and lower section consistent with local sampling
divisions, salinity changes and the fish community changes
from freshwater to marine species. The data was also
grouped by spring and autumn, to take into account sea-
sonal variation. The data for each separate sample method
(seine net, beam and otter trawl) was aggregated by sam-
pling gear for all E4T3 TWs to form a ‘method-specific’
reference. Therefore nine separate reference communities
were created to compare against each sampling occasion.
The reference community used to compare the Thames
(upper reach) spring 1993 seine netting raw results is sum-
marised in Table 7. The reference data was ranked, then
divided into quintiles and the mean species richness for
the upper quintile calculated (Fig. 1). This mean was then
used as a ‘reference’ for calculating metrics 1 and 3. Tables
8–17 list the reference figure used to create the RS. These
relative scores were then averaged per year.
2.3. Metric scoring
Karr et al. (1986) assigned grades of 1, 3 or 5 to quantify
the metric scores to develop a scoring system of biotic
integrity. This approach has been adapted to a 1, 2, 3, 4
or 5 system as the five bands corresponded more appropri-
ately to the ecological status bands of the WFD (WFD CIS
Working Group 2.4 (COAST), 2003; Vincent et al., 2002).
Once the metrics had been calculated for each method-
specific reference for each reach, the sample-level data were
compared to its ecotype ‘reach-reference’. For example, the
upper Thames seine net samples were compared against a
reference value of all E4T3 upper seine net samples. Each
metric was scored according to its respective reference, with
the exception of metrics 2, 7 and 10, which were based
directly on the number of taxa present.
Once the metrics were calculated, the scores were
totalled for each sample and a ‘Relative Score’ (RS) was
generated using the following formula:
RS ¼
Total score of the 10 metrics
Maximum score possible
2.4. Sample methods
Historically, estuarine fish monitoring in the UK has
concentrated on localised surveys within impacted, indus-
trialised estuaries (CEFAS, 2004; Rogers and Millner,
1996). Since 2002, the multi-method approach has been
considered a more effective way of assessing the ‘ecological
status’ of a TW across the UK (Coates et al., 2004).
The use of fish communities in estuaries as indicators of
biotic integrity has received much attention from many
authors (Harrison and Whitfield, 2004; Karr, 1981; Karr
et al., 1986; USEPA, 2000). Using fish as environmental
indicators has many advantages including relative ease of
identification and presence in most estuaries.
The Thames estuary is one of the few TWs in the UK
that has robust data sets using the multi-method approach
Table 5
Scoring system for metric 10 showing the score assigned according to the
number of feeding guilds present
No. of guilds present Score
0 1
1 2
2 3
3 4
4 5
228 S. Coates et al. / Marine Pollution Bulletin 55 (2007) 225–240
6. designed to assess both the pelagic and benthic communi-
ties using seine nets, otter trawls and beam trawls at a vari-
ety of locations throughout the estuary.
The Thames estuary also provides the largest long-term
UK fish data set (Colcough, pers. com.), incorporating a
range of sampling techniques and monitoring sites from
freshwater to marine. Fig. 2 displays the sites sampled. Site
locations were chosen mainly on their substrate regime and
ease of access. A stable shingle shore allows researchers to
gain purser underfoot when pulling in the seine net and
prevents a build up of material in the net, which can cause
the net to roll and loose fish. A firm and even riverbed also
proves a better site for trawling, since less inorganic matter
is disturbed. The sites allowed an extended sampling win-
dow, ranging from almost freshwater upstream to almost
marine downstream.
This approach combines a variety of methods such as
seine netting, beam trawling and otter trawling. Different
survey techniques have varying gear selectivities so it is
important to incorporate a suite of techniques to obtain
a comprehensive picture of each fish community assessed
e.g. benthic, pelagic and marginal.
Table 7
E4T3 (upper reach) spring seine netting results
Functional guild Rare/threatened Feeding guild n % Relative richness Total abundance
Abramis brama FW BI 49 38.6 414
Alburnus spp. FW Y Z 26 20.5 622
Anguilla anguilla CA Y P 56 44.1 145
Atherina presbyter MJ Z 29 22.8 217
Barbatula barbatula FW BI 1 0.8 1
Barbus barbus FW BI 1 0.8 7
Chelon labrosus MS D 4 3.1 32
Clupea harengus MJ Z 1 0.8 27
Cottus gobio FW Y BI 4 3.1 4
Cyprinus carpio FW BI 3 2.4 5
Dicentrarchus labrax MJ P 46 36.2 904
Esox lucius FW P 1 0.8 1
Gadus morhua MJ P 0 0.0 0
Gasterosteus aculeatus CA Z 40 31.5 111
Gobio gobio FW D 13 10.2 67
Leuciscus cephalus FW P 5 3.9 47
Leuciscus leuciscus FW Z 100 78.7 3490
Liza ramada CA D 10 7.9 34
Merlangius merlangus MJ P 0 0.0 0
Osmerus eperlanus CA Y Z 30 23.6 872
Perca fluviatilis FW P 49 38.6 215
Phoxinus phoxinus FW Z 6 4.7 7
Platichthys flesus ER BI 102 80.3 2798
Pleuronectes platessa MJ BI 0 0.0 0
Pomatoschistus microps ER BI 41 32.3 972
Pomatoschistus minutus ER BI 24 18.9 415
Pungitius pungitius CA Z 3 2.4 3
Rutilus rutilus FW Z 103 81.1 4579
Salmo salar CA Y P 3 2.4 5
Salmo trutta CA P 6 4.7 6
Scardinius erythrophthalmus FW Z 1 0.8 1
Solea solea MJ BI 0 0.0 0
Sprattus sprattus MS Z 3 2.4 31
Syngnathus rostellatus ER Z 0 0.0 0
Tinca tinca FW BI 1 0.8 1
Mean 21.7 17.1 458.1
Total 761 599.2 16033
(TWs = 3; years = 11; sampling occasions = 127; total species = 35).
Fig. 1. Example of species richness against rank, generated for each
‘reference’ list. Lines denote divisions into five equal quintiles. The mean
richness of the upper quintile was used to generate a reference for
calculating metrics 1 and 3.
230 S. Coates et al. / Marine Pollution Bulletin 55 (2007) 225–240
12. In the upper to mid estuary a 45 · 3.5 m seine net with a
5 mm knotless mesh centre and 20 mm wings was deployed
from the shore with a 17 ft open dory. The net was
deployed during the low water slack period twice. This
method was designed to capture small to large adult active
fish within the margins of the river. A 1.52 m (50
) wide
beam trawl with a 20 mm knotless outer mesh and 5 mm
knotless cod end, designed to capture demersal species,
was trawled for 250 m parallel to the seining site. In the
mid and lower estuary seine netting & beam trawling was
complimented by paired 8 m wide otter trawls with a
40 mm outer mesh with a 5 mm knotless ‘cod end’ mesh.
It was deployed usually during low water slack or on a
flooding tide and was used to assess the pelagic & benthic
fish community present within the main channel of the
Thames estuary.
3. Results
Table 6 shows the raw results for Thames (upper reach)
spring 1993. Table 7 includes the data for all years for
spring seine netting, that was used to create ‘reference’ con-
ditions for Table 6 values. Reference conditions were cre-
ated in the same way for spring and autumn for seine,
beam and otter trawling for the upper, middle and lower
reaches. Tables 8–17 display the metric scores for Thames
(upper reach) spring 1993 results. The total count, the ref-
erence total, % similarity to reference (where appropriate)
and the RS is displayed for each metric.
The annual RSs for the upper, mid and lower Thames
compared to the ecotype reference values between 1992
and 2004 are shown in Figs. 3–5. It is evident that the rel-
ative scores are higher in the lower TW than those in the
mid TW and those in the mid TW are higher than those
in the upper TW.
Analysing variations between methods, the seine net
has a higher RS compared to the beam trawl in every year
in the upper Thames. The difference between the two
methods is lowest in 1992 and highest in 2000. Similarly,
within the mid Thames, the seine net and otter trawl have
a higher RS compared to the beam trawl in all years.
Otter trawling was introduced in 1997 as part of the
CEFAS & EA bass (Dicentrarchus labrax) population sur-
vey work. Between 1997 and 2000, the seine net had a
slightly higher RS than the otter trawl samples whilst in
2002 and 2003, the otter trawl had a higher RS which var-
ied between 0.1 and 0.4. Within the lower Thames, there
is a similar pattern evident to that in the mid Thames,
where the seine net samples have a higher RS compared
to the beam and otter trawl in most years during the
1990s. Again between 2000 and 2003, the otter trawl sam-
ples have the highest RS.
Fig. 2. Thames estuary indicating division into separate upper, mid and lower reaches for statistical analysis. Points indicate all sampling locations.
236 S. Coates et al. / Marine Pollution Bulletin 55 (2007) 225–240
13. Comparing within-method variation along the TW, the
beam trawl samples had a higher RS in most years in the
lower Thames than further upstream. In the lower TW,
the beam trawl samples also had the greatest range of RS
(0.1–0.6). The overall RSs of the seine net samples
increased slightly between the upper to lower reaches.
There was little difference between the RSs of the otter
trawl samples in the mid and lower Thames.
Initial assessment of dissolved oxygen and the relative
scores within the upper reaches of the Thames suggest that
there may be some correlation between the RS and DO
concentration, for example when DO levels are reduced,
RSs are also low. This exploratory work will be investi-
gated further as part of developing physicochemical stan-
dards for WFD in support of the ‘biological quality
elements’ for transitional and coastal waters.
0.00
0.10
0.20
0.30
0.40
0.50
0.60
0.70
0.80
0.90
1.00
92 93 94 95 96 97 98 99 00 01 02 03 04
Year
RS
Beam
Seine
B & S Mean
Fig. 3. Mean annual relative scores for beam trawl and seine net samples in the upper Thames. Samples were compared against a method-specific
reference based on TWs in E4T3. Bars indicate minimum and maximum relative scores per annum.
0
0.1
0.2
0.3
0.4
0.5
0.6
0.7
0.8
0.9
1
92 93 94 95 96 97 98 99 00 01 02 03 04
Year
MeanRS
Beam
Seine
Otter
Mean (B, S & O)
Fig. 4. Mean annual relative scores for beam trawl, seine net and otter trawl samples in the mid Thames. Samples were compared against a method-
specific reference based on TWs in E4T3. Bars indicate minimum and maximum relative scores per annum.
S. Coates et al. / Marine Pollution Bulletin 55 (2007) 225–240 237
14. 4. Discussion
Prior analysis indicated that the assessment methodol-
ogy used provided a statistically robust way of analysing
the long-term fish data of the Thames (Coates, unpublished
data). An alternative was to compare each data set against
a ‘multi-method’ reference incorporating all survey tech-
niques (Coates et al., 2004). This was initially trialed but
because it was not possible to have standard ‘sampling-
effort’ for each monitoring technique within reference, the
resulting assessment of the single-strand data against the
reference was not statistically comparable.
The progressive downstream increase in RS and possible
increase in ecological status could indicate a general
increase in the health of the ecosystem and therefore in
the diversity and abundance of the fish communities. This
change is likely to reflect a shift from the urbanised, mor-
phologically modified channel of London to that of the
lower Thames estuary, which has a more diverse fish com-
munity (Astley, 2004; Kirk et al., 2002). Upper reaches of
the Thames have a greater freshwater influence and sup-
port less species diversity than lower reaches (Colclough
et al., 1992, 1993, 2000).
The mid reach of the Thames is highly channelised and
provides few habitats for juvenile and adult fish (Astley,
2004; Attrill, 1998). There are also high fluctuations in
salinity and so fewer species are able to tolerate the
dynamic macro-tidal environment (Colclough et al., 1992,
1993, 2000). Channel morphology and habitat niche
requirements are known to influence fish communities
(Hemingway and Elliott, 2002). Lower reaches are more
stable in terms of salinity and anthropogenic and there is
a greater diversity of habitat (Astley, 2004) thereby provid-
ing suitable refuges/food sources to support more diverse
communities (Hemingway and Elliott, 2002).
The variation between the results of the methods in all
reaches of the TW is unlikely to be due to variation in sam-
pling effort as each method is based upon consistent sam-
pling effort and gear selectivity (Coates et al., 2004). The
beam trawl is likely to produce samples with lower relative
scores than the seine net and otter trawl because it targets
benthic fish communities. It is a much more discriminative
technique than the other methods and therefore captures
lower species diversity than seine and otter trawling (Colc-
lough et al., 2000). Seine netting is carried out from the
shore and is used for marginal habitat sampling of pelagic
species and those fish communities utilising this habitat.
The otter trawl is towed through the water column and
samples a wide range of benthic and pelagic species, which
would account for the higher RSs during 2000–2004.
5. Conclusions
Although the patterns evident from the analysis fit with
what would be biologically expected to happen within the
Thames TW, the multi-metric tool and assessment outlined
in this paper requires further development as part of WFD
implementation in December 2006.
WFD guidance from Ecostat states that current refer-
ence conditions are not valid as they have been derived
from TWs that are not at ‘Reference’ or High Status (Euro-
pean Council Directive, Section 1.3 (iv), 2000). As the ref-
erence sites selected for TW3 within Ecoregion 4 are not
‘existing undisturbed sites with only very minor distur-
bances’ (WFD CIS Working Group 2.4 (COAST), 2003),
the data comparison needs to be revised because it is based
0
0.1
0.2
0.3
0.4
0.5
0.6
0.7
0.8
0.9
1
92 93 94 95 96 97 98 99 00 01 02 03 04
Year
MeanRS
Beam
Seine
Otter
Mean (B, S & O)
Fig. 5. Mean annual relative scores for beam trawl, seine net and otter trawl samples in the lower Thames. Samples were compared against a method-
specific reference based on TWs in E4T3. Bars indicate minimum and maximum relative scores per annum.
238 S. Coates et al. / Marine Pollution Bulletin 55 (2007) 225–240
15. on abundance data from TWs already impacted by certain
pressures.
Reference ideally needs to be based on the fish commu-
nities found in historically unimpacted sites (Coates,
unpublished data). If the abundance data per sample from
the current analysis were compared to such a pristine refer-
ence, the resulting RSs would be particularly low, reflecting
poor conditions compared to an unimpacted situation.
Although the method used is statistically robust at the sam-
ple level, the inherent temporal and spatial variability
would be too high to provide any meaningful results. Fish
populations do not aggregate spatially within TWs and are
highly variable throughout the year. These biological char-
acteristics, coupled with the fact that sampling has not been
historically consistent in effort or locality, mean that the
data cannot be analysed at the sample level. Further anal-
ysis will therefore involve pooling the data on an annual
survey basis from all reaches and methods and then com-
paring to reference. Two to three years of combined annual
sample data may also be used to assess ecological status in
this way.
Although the level of analysis can be revised, there are
no ‘reference’ TWs in E4T3 with long-term data sets
against which the Thames data can be compared. Expert
judgement will therefore need to be used in conjunction
with existing data to generate a suitable reference for each
of the candidate metrics (European Council Directive,
2000).
The assessment of the fish community also has to be
considered in relation to the assessment of the hydromor-
phology of the Thames estuary. The Thames is likely to
be classified as a Heavily Modified Water Body (HMWB)
under the WFD and has to meet the requirements of ‘good
ecological potential’ (European Council Directive, 2000).
The RSs will therefore have to be considered in relation
to ‘ecological potential’, rather than in relation to ‘ecolog-
ical status’. The criteria for ecological potential require a
water body to not deteriorate and will most probably will
be compared to the same reference conditions as those that
are not heavily modified, but the boundary criteria may be
different. Confirmation of the ecological potential criteria
have yet to be confirmed by the UK.
Although further development, testing and validation of
the TFCI is necessary, the current analysis has however
provided a valuable insight into comparing differing mon-
itoring techniques. The results indicate the varied selectivi-
ties of the methods and the benefits of the use of a range of
these techniques, in order to provide a complete picture of
functionality within transitional waters. Although still at a
preliminary stage, these results highlight the importance of
a multi-method sampling regime.
The current analysis of the Thames also highlights the
benefit of dividing large TWs into specific reaches and
analysing each independently. Each section is exposed to
different anthropogenic pressures and different hydromor-
phological regimes such as variations in salinity and
habitats. Fish composition and abundance is highly likely
to vary within each reach and as such, should be analysed
separately.
The TFCI developed here incorporates both structural
and functional attributes of estuarine fish communities. It
has been tested here to provide both a robust method for
assessing the ecological status of transitional waters. Fur-
thermore the TFCI could be refined and related to a range
of environmental pressures such water quality, shoreline
reinforcement and flow manipulation once reference condi-
tions have been established. Overall, the TFCI is an effec-
tive communication tool for converting ecological
information into an easily understood format for environ-
mental managers, policy makers and local communities
and stakeholders.
Acknowledgements
We would like to thank Peter Lloyd, Maxine Clement
and Lars Akesson of Environment Agency, Thames Re-
gion for their advice and support with the AQMS data.
We would also like to thank all our transitional fish col-
leagues and associates throughout the UK, Ireland and
Europe for their support and guidance in developing these
classification tools as part of WFD implementation.
References
Astley, T., 2004. Thames estuary environmental framework fisheries
scoping report. Thames Estuary 2100 Project, Environment Agency,
Thames Region.
Attrill, M.J. (Ed.), 1998. A Rehabilitated Estuarine Ecosystem. The
Environment and Ecology of the Thames Estuary. Kluwer Academic
Publishers.
Borja, A., Franco, J., Valencia, V., Bald, J., Muxika, I., Belzunce, M.J.,
Solaun, O., 2004. Implementation of the European water framework
directive from the Basque country (Northern Spain): a methodological
approach. Marine Pollution Bulletin 48, 209–218.
Breine, J., Simoens, I., Goethals, P., Quataert, P., Ercken, D., Van
Liefferinghe, V., Belpaire, C., 2004. A fish-based index of biotic
integrity for upstream brooks in Flanders (Belgium). Hydrobiologia
522, 133–148.
CEFAS, 2004. UK National Marine Monitoring Programme – Second
Report (1999–2001). Marine Environment Monitoring Group,
CEFAS.
Coates, S.A., Colclough, S.R., Robson, M.A., Harrison, T.D. 2004.
Development of an estuarine classification scheme for the Water
Framework Directive. Phases 1& 2 – transitional fish component.
R&D Technical Report E1-131/TR. Bristol: Environment Agency.
Colclough, S.R., Dutton, C., Coates, S.A., 1992. Tidal Thames Quarterly
Fisheries Survey. National Rivers Authority, Thames Region.
Colclough, S.R., Dutton, C., Coates, S.A., 1993. Tidal Thames Quarterly
Fisheries Survey. National Rivers Authority, Thames Region.
Colclough, S.R., Dutton, C., Cousins, T., Martin, A., 2000. A Fish
Population Survey of the Tidal Thames. Environment Agency, Bristol.
Colclough, S.R., Gray, G., Bark, A., Knights, B., 2002. Fish and fisheries
of the tidal Thames: management of the for fishing gear designs. FAO
Fishing Manual. Fishing News Books Ltd.
Elliott, M., Dewailly, F., 1995. The structure and components of
European estuarine fish assemblages. Netherlands Journal of Aquatic
Ecology 29, 397–417.
Goethals, P.L.M., Adriaenssens, V., Breine, J., Simoens, I., Van Lieffer-
inghe, C., Ercken, D., Maes, J., Verhaegen, G., Ollevier, F., De Pauw,
N., Belpaire, C., 2002. Developing an index of biotic integrity to assess
S. Coates et al. / Marine Pollution Bulletin 55 (2007) 225–240 239
16. fish communities of the Scheldt estuary in Flanders (Belgium). Aquatic
Ecology 36, 131–143.
Goldman, B., Talbot, F., 1976. Aspects of the ecology of coral reef fishes.
Biology and geology of coral reefsBiology 2, vol. III. Academic Press,
New York, pp. 125–154.
Harrison, T.D., Whitfield, A.K., 2004. A multi-metric fish index to assess
the environmental condition of estuaries. Journal of Fish Biology 65,
683–710.
Harrison, T.D., Whitfield, A.K., 2006. Estuarine typology and the
structuring of fish communities in South Africa. Environmental
Biology of Fishes 75, 269–293.
Harrison, T.D., Cooper, J.A.G., Ramm, A.E.L., 2000. State of South
African estuaries. Geomorphology, ichthyofauna, water quality and
asthetics. State of the Environment Series Report No. 2, Department
of Environmental Affairs and Tourism, Pretoria.
Hemingway, K., Elliott, M., 2002. Fishes in Estuaries. Blackwell Science
Ltd., Oxford.
Karr, J.R., 1981. Assessment of biotic integrity using fish communities.
Fisheries 6, 21–27.
Karr, J.R., Fausch, K.D., Angermeier, P.L., Yant, P.R., Schlosser, I.J.,
1986. Assessment biological integrity in running waters: a method and
its rationale. Illinois Natural, History Survey Special Publication 5,
Champaign, IL, USA.
Kirk, R.S., Colclough, S.R., Sheridan, S., 2002. Fish diversity in the River
Thames. The London Naturalist 81, 75–85.
Lobry, J., Mourand, L., Rochard, E., Elie, P., 2003. Structure of the
Gironde estuarine fish assemblages: a comparison of European
estuaries perspective in 2003. Aquatic Living Resources 16, 47–58.
Malavasi, S., Fiorin, R., Franco, A., Franzoi, P., Granzotto, A., Riccato,
F., Mainardi, D., et al., 2004. Fish assemblages of Venice Lagoon
shallow waters: an analysis based on species, families and functional
guilds. Journal of Marine Systems 51, 19–31.
Rogers, S.I., Millner, R.S., 1996. Factors affecting the annual abundance
and regional distribution of English inshore demersal fish populations:
1973 to 1995. ICES Journal of Marine Science 53, 1094–1112.
Turnpenny, A.W.H., Clough, S.C., Holden, S.D.J., Bridges, M., Bird, H.
O’Keeffe, N.J., Johnson, D., Edmonds, M., Hinks, C., 2004. Thames
tideway strategy: experimental studies on the dissolved oxygen
requirements on fish. Baptie Aquatic Report, Thames Water Utilities.
UK TAG Task 2.a, 2004. Guidance on typology for coastal & transitional
waters of the UK and Republic of Ireland, UK TAG.
Vincent, C., Heinrich, H, Edwards, A., Nygaard, K., Haythornthwaite, J.,
2002. Guidance on typology, reference conditions and classification
systems for transitional and coastal waters. CIS Working Group 2.4
(COAST). Common Implementation Strategy of the Water Frame-
work Directive, European Commission.
von Brandt, A., 1964. Fish catching methods of the world. Fishing News
Books Ltd.
Wheeler, A.J., 1979. The tidal ThamesThe History of a River and its
Fishes. Routledge & Kegan Paul Ltd.
Whitfield, A.K., 1998. Biology and ecology of fishes in southern African
estuaries. Ichthyological Monographs of the J.L.B. Smith Institute of
Ichthyology 2. 223pp.
WFD CIS Working Group 2.4 (COAST), 2003. Guidance on typology,
reference conditions and classification systems for transitional and
coastal waters. Official Journal of the European Communities.
USEPA, 2000. Estuarine and coastal marine waters: bioassessment and
biocriteria technical guidance. US Environmental Protection Agency
Report, EPA-822-B-00-024. Washington, DC: Office of Water.
240 S. Coates et al. / Marine Pollution Bulletin 55 (2007) 225–240