
Recommended
More Related Content
What's hot
What's hot (20)
Viewers also liked
Similar to COAT3 Endterm SW1 Solns1
Similar to COAT3 Endterm SW1 Solns1 (20)
More from Mikee Bylss
More from Mikee Bylss (20)
Recently uploaded
Recently uploaded (20)
COAT3 Endterm SW1 Solns1
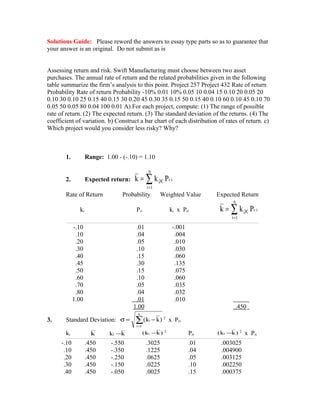
- 1. Solutions Guide: Please reword the answers to essay type parts so as to guarantee that your answer is an original. Do not submit as is Assessing return and risk. Swift Manufacturing must choose between two asset purchases. The annual rate of return and the related probabilities given in the following table summarize the firm’s analysis to this point. Project 257 Project 432 Rate of return Probability Rate of return Probability -10% 0.01 10% 0.05 10 0.04 15 0.10 20 0.05 20 0.10 30 0.10 25 0.15 40 0.15 30 0.20 45 0.30 35 0.15 50 0.15 40 0.10 60 0.10 45 0.10 70 0.05 50 0.05 80 0.04 100 0.01 A) For each project, compute: (1) The range of possible rate of return. (2) The expected return. (3) The standard deviation of the returns. (4) The coefficient of variation. b) Construct a bar chart of each distribution of rates of return. c) Which project would you consider less risky? Why? 1. Range: 1.00 - (-.10) = 1.10 2. Expected return: ir n 1i i Pkk ∑= ×= Rate of Return Probability Weighted Value Expected Return ki Pri ki x Pri ir n 1i i Pkk ∑= ×= -.10 .01 -.001 .10 .04 .004 .20 .05 .010 .30 .10 .030 .40 .15 .060 .45 .30 .135 .50 .15 .075 .60 .10 .060 .70 .05 .035 .80 .04 .032 1.00 .01 .010 1.00 .450 3. Standard Deviation: ∑= −=σ n 1i i )kk( 2 x Pri ki k kki − )kk( i − 2 Pri )kk( i − 2 x Pri -.10 .450 -.550 .3025 .01 .003025 .10 .450 -.350 .1225 .04 .004900 .20 .450 -.250 .0625 .05 .003125 .30 .450 -.150 .0225 .10 .002250 .40 .450 -.050 .0025 .15 .000375
- 2. .45 .450 .000 .0000 .30 .000000 .50 .450 .050 .0025 .15 .000375 .60 .450 .150 .0225 .10 .002250 .70 .450 .250 .0625 .05 .003125 .80 .450 .350 .1225 .04 .004900 1.00 .450 .550 .3025 .01 .003025. .027350 σProject 257 = .027350 = .165378 4. 3675. 450. 165378. CV == Project 432 1. Range: .50 - .10 = .40 2. Expected return: ir n 1i i Pkk ∑= ×= Rate of Return Probability Weighted Value Expected Return ki Pri ki x Pri ir n 1i i Pkk ∑= ×= .10 .05 .0050 .15 .10 .0150 .20 .10 .0200 .25 .15 .0375 .30 .20 .0600 .35 .15 .0525 .40 .10 .0400 .45 .10 .0450 .50 .05 .0250 1.00 .300 3. Standard Deviation: ∑= −=σ n 1i i )kk( 2 x Pri ki k kki − )kk( i − 2 Pri )kk( i − 2 x Pri .10 .300 -.20 .0400 .05 .002000 .15 .300 -.15 .0225 .10 .002250 .20 .300 -.10 .0100 .10 .001000 .25 .300 -.05 .0025 .15 .000375 .30 .300 .00 .0000 .20 .000000 .35 .300 .05 .0025 .15 .000375 .40 .300 .10 .0100 .10 .001000 .45 .300 .15 .0225 .10 .002250 .50 .300 .20 .0400 .05 .002000 .011250
- 3. σProject 432 = .011250 = .106066 4. 3536. 300. 106066. CV == b. Bar Charts Project 257 Probability 0 0.05 0.1 0.15 0.2 0.25 0.3 -10% 10% 20% 30% 40% 45% 50% 60% 70% 80% 100% Rate of Return Project 432 0 0.05 0.1 0.15 0.2 0.25 0.3 10% 15% 20% 25% 30% 35% 40% 45% 50% Probability Rate of Return
- 4. c. Summary Statistics Project 257 Project 432 Range 1.100 .400 Expected Return ( k ) 0.450 .300 Standard Deviation ( kσ ) 0.165 .106 Coefficient of Variation (CV) 0.3675 .3536 Since Projects 257 and 432 have differing expected values, the coefficient of variation should be the criterion by which the risk of the asset is judged. Since Project 432 has a smaller CV, it is the opportunity with lower risk.