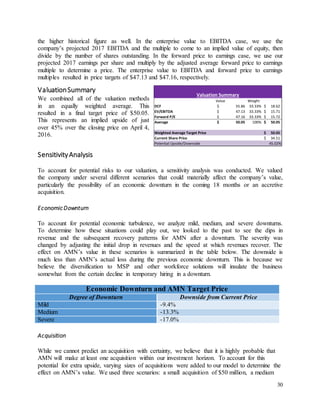
0
Prepared by:
Jay T Anderson Liyang Cai
Steven Goodwill Dana Huynh
Chase Lindsey Nirvon Mahdavi
Mark Storey Travis Warner
University of Utah Student Investment Fund
April 5, 2016
1
Table of Contents
Company Overview.........................................................................................................................................................................4
Historical Stock Performance...................................................................................................................................................4
Investment Thesis ...........................................................................................................................................................................5
Business Model................................................................................................................................................................................6
Customer Value Proposition.....................................................................................................................................................6
Reportable Segments .................................................................................................................................................................7
Products........................................................................................................................................................................................7
Staffing and Recruitment......................................................................................................................................................8
Workforce Solutions..............................................................................................................................................................9
Executive Leadership.............................................................................................................................................................9
Advisory Services....................................................................................................................................................................9
Revenue Model ...........................................................................................................................................................................9
Cost Model .................................................................................................................................................................................10
Market Segment........................................................................................................................................................................10
Competitive Strategy................................................................................................................................................................11
Industry and Competitive Positioning ......................................................................................................................................12
Industry Outlook.......................................................................................................................................................................12
Major Industry Players.............................................................................................................................................................12
Industry Trends .........................................................................................................................................................................13
Supply Shortages..................................................................................................................................................................13
Increased Healthcare Utilization.......................................................................................................................................13
Industry Competitive Structure..............................................................................................................................................14
Threat of New Entrants and Substitutes..........................................................................................................................14
Threat of Suppliers...............................................................................................................................................................14
Comparable Ratios....................................................................................................................................................................15
Return on Assets ..................................................................................................................................................................15
Current Ratio.........................................................................................................................................................................15
Total Liabilities to Total Assets ..........................................................................................................................................15
Executive Management and Corporate Governance ............................................................................................................16
Management Team ..................................................................................................................................................................16
Management Performance ................................................................................................................................................17
Insider Stock Holdings .........................................................................................................................................................17
Board of Directors.....................................................................................................................................................................18
ISS Governance Quickscore................................................................................................................................................19
General Employees .......................................................................................................................................................................20
Employee Value Proposition...................................................................................................................................................20
Competitive Pay ...................................................................................................................................................................20
Placement in Top Facilities.................................................................................................................................................20
Flexibility................................................................................................................................................................................20
2
Employee Satisfaction..............................................................................................................................................................20
Licensing Requirements...........................................................................................................................................................21
Financial Analysis ..........................................................................................................................................................................23
Income Statement ....................................................................................................................................................................23
Cash Flow...................................................................................................................................................................................24
Organic Growth Strategy .............................................................................................................................................................25
Further Develop Processes to Achieve Market-leading Efficiency ..................................................................................25
Continue to Invest in Infrastructure......................................................................................................................................25
Acquisitive Growth Strategy .......................................................................................................................................................26
Acquisitions................................................................................................................................................................................27
Valuation.........................................................................................................................................................................................29
Valuation Methods ...................................................................................................................................................................29
Hybrid DCF .................................................................................................................................................................................29
Peer Group Multiple Analysis .................................................................................................................................................29
Valuation Summary..................................................................................................................................................................30
Sensitivity Analysis....................................................................................................................................................................30
Economic Downturn ............................................................................................................................................................30
Acquisition.............................................................................................................................................................................30
Risks .................................................................................................................................................................................................32
Firm-Specific Risks ....................................................................................................................................................................32
Contracts................................................................................................................................................................................32
Acquisition Integration Failure ..........................................................................................................................................32
Medical Personnel Shortage Inhibits Recruiting.............................................................................................................32
Industry and Macro Risks ........................................................................................................................................................33
Healthcare Policy Changes .................................................................................................................................................33
Vulnerability to Market Downturns ..................................................................................................................................33
Recommendation..........................................................................................................................................................................33
Appendix I: Historical and Projected Income Statements ......................................................................................................34
Appendix II: Historical and Projected Balance Sheets .............................................................................................................35
Appendix III: Projected Statements of Cash Flows ..................................................................................................................36
Appendix IV: Model Assumptions...............................................................................................................................................38
Appendix V: Debt Schedule..........................................................................................................................................................39
Appendix VI: Market Share Projections.....................................................................................................................................40
Appendix VII: Depreciation Schedule.........................................................................................................................................41
Appendix VIII: WACC Calculation................................................................................................................................................42
Appendix IX: Discounted Cash Flow Valuation.........................................................................................................................43
Appendix X: AMN Healthcare Comp Set....................................................................................................................................44
Appendix XI: Selected Competitor Ratio Comparisons...........................................................................................................45
Appendix XII: Selected Competitor Stock Performance..........................................................................................................46
3
Executive Summary
AMN Healthcare is a healthcare staffing and workplace solutions company that operates
throughout the United States. The company primarily serves acute-care hospitals and is partnered
with some of the largest and most prestigious hospitals in the country, such as Kaiser Foundation
Hospitals, Johns Hopkins Health System, and Stanford Hospital and Clinics. AMN’s staffing
services include travel nurses, locum tenens physicians, and other allied professionals, which
includes non-physician health professionals such as chiropractors and dentists. In the workplace
solutions segment of the business, AMN offers recruitment outsourcing, medical executive
placement services, and various software products that optimize the staffing function.
AMN’s most important non-staffing products are its managed services program (MSP) and
vendor management software (VMS). MSP is a suite of workplace management services that
allows AMN to coordinate all staffing and workforce needs of its clients using predictive
analytics, allowing the clients to focus on caregiving. VMS is a SaaS-based program which
allows clients to search for and place orders for staffers on an as-needed basis. MSP has been an
especially important growth driver for the company, increasing from just 1% of company
revenues in 2008 to 35% in 2015. These services are the most comprehensive in the industry,
which we believe will assist the company as it seeks to gain market share. Hospitals will be able
to replace their current disparate workforce services vendor in favor of AMN as a single point of
contact.
AMN derives a competitive advantage from its wide geographic network and high quality
staffers. The company operates in all 50 states, allowing it to match the right staffers to the right
hospitals no matter where they are located. AMN’s staffers are widely recognized as the best in
the healthcare staffing industry, with the company winning several awards and getting
recognized for staffer credentials, efficiency, and education.
AMN grew very quickly over the last two years, fueled by a string of successful acquisitions.
AMN management has shown great ability to find high-value acquisition targets and integrate
them into a larger company effectively. As the healthcare staffing industry is highly fragmented
and AMN still appears to have an appetite for acquisition, we believe that this bolt-on strategy
could be a potential growth driver into the future and complement the firm’s healthy organic
growth rates.
These company characteristics combine with favorable trends in the healthcare industry to
further the attractiveness of the company. The implementation of the Affordable Care Act and
the subsequent increase in the number of individuals with health insurance has led to an increase
in demand for healthcare services. This has driven an increase in demand for both healthcare
staffers and workplace optimizing programs like AMN’s MSP.
Due to these factors, we recommend a BUY on AMN Healthcare with a target price of $50.05.
This represents an upside of 45% over the closing price on April 4, 2016.
4
Company Overview
AMN Healthcare (NYSE: AHS) began in 1985 as a travel nursing company, placing nurses
nationwide in medical facilities experiencing staffing shortages. The company, now
headquartered in San Diego, California, has grown to provide various healthcare workforce
solutions and staffing services through twenty brand names. The company provides clients with
access to the largest network of qualified clinicians in the country through temporary and
permanent staffing, workforce optimization services, recruitment outsourcing and consulting,
and vendor management systems (VMS), which allow clients to manage their staffing services
independently. The company held its initial public offering in November 2001, where it raised
$170 million.
AMN Healthcare operates in all 50 states, with over half of its professional assignments at acute-
care hospitals. The company’s clients include some of the largest healthcare companies in the
nation, including Kaiser Foundation Hospitals, MedStar Health, NYU Medical Center, and
Stanford Hospitals and Clinics.
As of December 31, 2015, AMN Healthcare had 2,550 corporate employees and an average of
8,091 healthcare professionals on contract, not including locum tenens—short-term, temporary
staffers—who are hired as independent contractors.
HistoricalStockPerformance
Figure 1: AHS Stock Chart since IPO
5
AMN went public in 2001 with an offering of 10,000,000 shares at a price of $17 per share.
Since then, the stock price has experienced fluctuations driven, at least in part, by supply and
demand trends for nurses and physicians.
Following the IPO, the stock did well as the temporary healthcare staffing industry grew at a
compounded annual growth rate of 21% from 2000 to 2002. The stock price declined steeply
from $35 a share to $9 a share by first quarter of 2003 as demand for temporary healthcare
professionals declined. During this period, hospitals increased nurse recruiting efforts and
healthcare clients were less likely to leave their positions which decreased demand for AMN’s
temporary healthcare professionals. The downward decline in demand and stock price continued
through 2004.
By 2004, demand began to increase each quarter and in 2005, AMN made an acquisition to
extend its services to temporary and permanent physician staffing to cater to a growing physician
shortage and take advantage of the immature temporary physician market. AMN’s stock price
trend improved through 2006 as the industry experienced strong demand in the nursing staffing
sector and the stock reached $28 per share.
Demand continued to exceed supply through 2007, but with lower hospital admission levels and
aggressive hiring of new graduates in key states such as California, AMN suffered again and the
stock price fell to $5 per share in 2008. This stemmed from a disastrous combination of the
demand issues as well as cost issues, Medicare reimbursement problems, and an overall slump in
the economy. The stock remained around $7 per share until the end of 2012 when demand for the
travel nurse business began to rebound.
By 2013, demand improved substantially and AHS reaped the benefits of new service extension
offerings it implemented in 2010, as well as more recurring revenue sources such as managed
services programs and recruitment process outsourcing. The healthcare environment continued to
pick up in 2014 and, by 2015, the stock price reached $34 a share with robust demand in service
offerings and high level of demand in workforce solutions programs.
Investment Thesis
Our investment thesis for AMN is crafted around three main pillars:
1. AMN’s nationwide network of high-quality healthcare professionals creates a
competitive advantage.
2. AMN has a strong management team which has correctly responded to the needs of the
market to create a compelling product mix.
3. AMN’s Managed Service Program has created numerous cross-selling opportunities for
the company as it builds strong relationships with clients.
These thesis points will be explored throughout this report to illustrate the strength of AMN as an
investment opportunity.
6
Business Model
CustomerValueProposition
The number one priority of healthcare industry personnel, both caregivers and executives, is the
quality of patient care.1 A successful patient interaction begins with having caregivers available
when they are needed. For a variety of reasons—mainly staff turnover, a long hiring process, and
seasonal surges in demand—hospitals may not have the requisite number of nurses or physicians
on staff to adequately handle the inflow of patients.2 In these situations, hospitals need extra
healthcare professionals to step in to help. The temporary healthcare staffing industry exists to
bridge this gap between supply and demand and prevent the quality of patient care from being
compromised.
Unfortunately, temporary staffing does not always meet this goal. The average U.S. hospital
utilizes three different staffing services with three different points of contact, which means that
coordination between the services is difficult and can lead to an improper scheduling of
temporary staff.3 As a result, quality of care suffers. AMN Healthcare provides a comprehensive
solution: quality temporary healthcare personnel provided in conjunction with a solution for
staffing logistics. AMN makes it simple for hospitals to maintain a high quality of care by
providing the highest quality medical professionals at any time.
It is impossible for hospitals to fill these temporary positions themselves as they do not have the
networks necessary to overcome the geographic inefficiencies of the healthcare labor market.
Healthcare providers would have to rely on nearby members of the labor supply and hope that
qualified staffers are available. Healthcare staffing companies have the distinct advantage of
drawing from a nationwide pool of qualified staffers immediately using their networks. AMN
has the largest geographic network in the industry with staffers in all 50 states.
In addition to meeting the need for continuity of care, the temporary healthcare staffing industry
assists healthcare providers in controlling costs. If temporary staffing were unavailable,
hospitals, if demand is to be met, would be forced to hire permanent staff. The problem here is
that demand for healthcare is variable due to seasonality, epidemics, and natural disasters, among
other things. If hospitals maintained the staff necessary to meet these demand peaks at all
times—not to mention specialists whose services are needed only occasionally—they would be
forced to pay excess staff during the ebbs in the demand cycle. For this reason, hospitals do not
mind paying a premium to an intermediary for temporary staffing because that premium is offset
by the savings of not hiring excess permanent staff. The service provided is a form of risk
pooling. Staffing agencies specialize in maintaining relationships with a large number of
professionals with a variety of specialties which lowers their cost of finding a professional to fill
a temporary vacancy.
1 KPMG U.S. Hospital NursingLabor Costs Study
2 KPMG U.S. Hospital NursingLabor Costs Study
3 AMN HealthcareQ4 2015 Earnings Call
7
(Source: February 2016Investor Presentation)
Reportable
Segments
AMN reports its
operations in three
segments: nurse and
allied solutions, locum
tenens solutions, and
other workforce
solutions.
The nurse and allied
solutions segment
provides nurses,
therapists, radiology
technicians and other
non-physician medical
staff to work temporary
assignments in medical
facilities and with
healthcare providers
nationwide. It also
includes MSP services.
In the fourth quarter of 2015, nurses and allied solutions accounted for 63% of AMN’s revenues,
with nearly half of that total coming from MSP services.
The locum tenens solutions segment specializes in placing “specialized and advanced practice”
physicians, clinicians and dentists on temporary assignments with all types of healthcare
providers nationwide. This segment accounted for 22% of AMN’s revenue during the most
recent quarter.
The other workforce solutions segment consists of healthcare executive search and advisory
services, vendor management systems (VMS), recruitment process outsourcing (RPO), and
workforce optimization services. This segment accounted for 15% of the firm’s revenues in the
most recent quarter.
It is difficult to determine the change in these segments’ performance and the resulting revenue
mix due to a change in reporting segments in the first quarter of 2016.
Products
AMN’s offerings can be broken up into four main categories: staffing and recruitment,
workforce solutions, executive leadership, and advisory services. AMN is able to offer an
integrated product suite to its clients by providing a diverse range of nurse and physician staffing
services as well as software offerings to manage staffing and other human resource functions.
8
Staffing and Recruitment
Within staffing and recruitment, AMN caters to acute-care hospitals, teaching institutions,
trauma centers, and other healthcare facilities by providing staffing and recruitment of nurses,
physicians, and allied health professionals. Nurse staffing encompasses travel staffing, rapid
response staffing, and per diem staffing. Physicians are staffed on a locum tenens basis as well as
permanent placement. Allied healthcare professionals such as physical therapists and
pharmacists are staffed on a full spectrum of permanent placement, travel, temporary and local
needs.
Travel nurse staffing places nurses on temporary assignments that typically last 13 weeks. With a
three to five week lead time, clients are able to fill vacancies with a cost effective and quick
solution. AMN’s brands include American Mobile, Onward Healthcare, Nurses Rx, and
O’Grady-Peyton, which focuses on recruiting nurses from other countries. The typical cost of an
AMN travel nurse is an all-in (payroll, taxes, insurance, meals, housing, etc.) hourly rate of $58
to $64 as compared to a national average of $59.67 hourly rate for a full-time staff on a hospital
staff.
AMN also addresses shorter-term staffing needs. Rapid response nurse staffing, with a shorter
lead time of one to two weeks, places nurses for shorter assignments that typically last four to
eight weeks. NurseChoice is the brand that facilitates this service which commands a 4%
premium over traditional travel nursing to compensate for its shorter lead times.
Per diem, or local, staffing places locally-based healthcare professionals on a daily shift on an as-
needed basis. Local staffing agencies can turnaround staffing requests in less than 24 hours.
NurseFinders provides local staffing for nurses in 30 local areas. Local staffing can command
substantial premiums above traditional travel nursing depending on the location, position, and
other supply and demand factors.
Staffing and
Recruiment
•Travel nursing
•Local staffing
•Locum tenens
•Allied staffing
•Physician placement
•Rapid response and
crisis staffing
•Mid- to senior level
leadership
placement
•EMR
implementation
•Labor disruption
Workforce
Solutions
•Managed services
programs (MSP)
•Recruitment process
outsorcing (RPO)
•Vendor
management
systems (VMS)
•Scheduling and
labor management
•Education services
•Float pool
management
•Telehealth -
Pharmacy
Executive
Leadership
•Interim leadership
•Executive search
•Physician leadership
search
•Nurse leadership
search
•Executive coaching
•Leadership training
and development
Advisory
Services
•Workforce analysis
and optimization
•Predictive modeling
and analytics
•Strategy consulting
•Financial and
operational
performance
improvement
•Regulatory
compliance
9
AMN places physicians on a locum tenens and permanent staffing basis. Locum tenens staffing
allows AMN to place independent contractor physicians on assignments that can last from a few
days up to one year. Contracts are made through the AMN brands Staff Care, Linde Healthcare,
and Locum Leaders. Permanent placement services to clients are done on a retained basis—
meaning fees are paid upfront—via Merritt Hawkins and MilicanSolutions and a contingent
basis—meaning fees are paid after placement—via Kendall & Davis.
Additionally, AMN also provides allied health professionals staffing on a travel, local, and
permanent basis. Through Med Travelers, Club Staffing, and Rx Pro Health, physical therapists,
occupational therapists, pharmacists, and other allied professionals are matched with a client’s
needs.
Workforce Solutions
Workforce Solutions encompasses various programs that allow clients to manage their staffing
needs. The Managed Services Program (MSP) is a service that manages all of a client’s staffing
needs by automatically assigning healthcare professionals from AMN to clients as the system’s
predictive analytics software determines a need exists. AMN offers Vendor Management
Systems (VMS) through its MSP as well as a vendor-neutral VMS that allows the client to
manage the procurement on its own. ShiftWise and Medefis are the two technologies that are
offered to control personnel tasks on a single system and consolidate reporting. AMN earns a 3-
4% fee, calculated from the total spent on staffing, from these programs. Recruitment Process
Outsourcing (RPO) replaces a client’s internal recruiting. Under an RPO contract, AMN
facilitates the entire recruiting and onboarding process for all temporary and permanent staff of
the client.
Executive Leadership
AMN also provides medical executive placement services. Through its recent acquisitions of
B.E. Smith and TFS, AMN can provide executive and clinical leadership interim staffing and
headhunting services for permanent placement of senior healthcare executives, physician
executives, and chief nursing officers. This allows for improved relationships with clients since
AMN employees will be decision makers, allowing for opportunities to cross-sell products such
as the workforce solutions and staffing and recruitment services outlined above.
Advisory Services
The advisory services segment provides workforce optimization software such as Smart Square
and Avantas. These scheduling software and predictive analytics programs create staffing plans
for a client which reduces a client’s overall clinical labor expenditures.
RevenueModel
AMN’s staffing and recruitment services primarily generate revenue on a per traveler per day
basis. The company bills the client for the number of hours its assigned staffers work at a client’s
10
facility each day. AMN generates profit though the difference in the amount it bills the client for
its services and the amount it pays out in salary to that staffer.
Additionally, through workforce solutions and advisory services, the company provides SaaS-
based solutions which allows healthcare providers to manage their own temporary workforce.
Called a Vendor Management System (VMS), revenue from this system is collected each time
the client uses the system to book its own clinician. AMN collects a 3-4% fee on each filled
posting.
The Managed Service Program (MSP) is a comprehensive suite of products and services that
allow a healthcare provider to completely outsource the management and analysis of its
temporary workforce to AMN. While billing under the MSP is still primarily based upon a per
traveler per day basis, these MSP contracts are generally exclusive contracts that last for three or
more years.
CostModel
AMN does not disclose its cost structure in detail for any of its segments. It is clear, however,
that the main expense for the company is staffer compensation. This is mainly wage expenses,
but there are a few other components, depending on the type of staffer. Those who are not
independent contractors—essentially any non-locum tenens staffer—receive benefits. In
addition, traveling nurses receive housing paid for by AMN. The staffing segments average a
gross margin of just over 30%.
The non-staffing segments are much less cost-intensive. In these segments, the primary cost is
sales expenditures. Beyond mentioning a sales team and an in-house research and development
team for its software products, AMN does not disclose what other expenses may be included in
this segment’s cost structure. We do, however, believe that these services have higher margins.
This is reaffirmed by management’s guidance that the company’s overall gross margin will grow
to 33% as this segment becomes a greater portion of the company’s business.
MarketSegment
AMN serves a diverse national client base of healthcare systems of all disciplines. Half of its
temporary healthcare professional assignments are for acute-care hospitals. Beyond this, the
company services sub-acute healthcare facilities, physician groups, rehab centers, pharmacies,
and surgery centers.
Some of the largest and most prestigious healthcare systems in the United States employ AMN
services, including Kaiser Foundation Hospitals (which makes up 11% of AHS’s 2015
consolidated revenue), New York Presbyterian Health System, NYU Medical Center, Stanford
Hospitals and Clinics, and Johns Hopkins Health System. Relationships with these clients
continue to strengthen as AMN successfully integrates its new software offerings to add further
value to the partnerships.
11
CompetitiveStrategy
AMN works to build lasting relationships by supplying what healthcare providers want most:
quality healthcare professionals as staffers. Through its permanent placement and headhunting
services, AMN also aims to cross-sell those same clients on other workforce management
services. This is distinctive within the industry as there are few companies that function in both
the staffing and workforce management segments. AMN’s comprehensive approach gives the
company a competitive advantage.
AMN is well-known within the industry for its quality staffers and is one of the few companies
in the healthcare staffing industry to be certified by the National Committee for Quality
Assurance, a non-profit group that evaluates and ranks healthcare facilities and suppliers based
on numerous quality metrics.4 AMN’s nurses are more educated than the general nurse
population, with 50% of AMN nurses holding a bachelor’s degree in nursing compared to just
34% for nurses at large.5 Additionally, AMN is the only medical staffing company with its own
competency testing procedures for its staffers.6 70% of AMN’s traveling staffers have been
specially requested to return to facilities to which they were previously assigned.7 AMN can, and
has, leveraged its strong network of staffers to gain a competitive advantage. The geographic
reach of this staff network across all 50 states greatly enhances this advantage. Other healthcare
staffing companies simply cannot match the quality nor the reach.
AMN’s cross-selling strategy has shown great potential for building lasting relationships with its
clients. The average AMN client purchases four different services from the company,
entrenching the company within its clients’ operations.8 This integration assists clients by
creating specialized product suites that meets their needs while also increasing switching costs
since more operations are tied to AMN’s products, thus making switching more disruptive.
4 National Committee for Quality Assurance
5 AMN Corporate Website
6 Ibid.
7 Ibid.
8 AMN Healthcare2015 Annual Report
12
Industry and Competitive Positioning
Industry Outlook
The healthcare staffing industry is expected to grow through the end of the decade, with a CAGR
of 4.2% through 2020. This is down slightly from the 5.4% growth CAGR between 2010 and
2015.9 Based on these projections, the healthcare staffing market should reach $18.3 billion by
2020, up from $14.9 billion today.10 Firms with service offerings beyond simple staffing, like
AMN, have grown more quickly than industry average in the last five years and are expected to
continue to do so throughout the decade.
MajorIndustryPlayers
CHG Healthcare Services is the second largest healthcare staffing
agency in the United States, with a market share of 6.0%. CHG is the
leading supplier of locum tenens and also provides temporary and
permanent placement services in Utah, Connecticut, Florida and
Michigan. CHG provides these services through the CompHealth,
Weatherby Healthcare, and RNnetwork brands. Since its recent
acquisition of Foundation Medical Staffing, CHG also offers temporary and permanent dialysis
staffing services nationwide.11
Cross Country Healthcare is a leading healthcare staffing agency
for acute care, with an overall market share of 4.4%. As of
December 31, 2015, Cross Country has more than 70 local office
and 7 operation centers in Florida, California, Georgia and
Missouri. These national and local resources allow the company to
offer alternative solutions including outpatient and ambulatory
care centers. The company offers temporary and permanent
placements, managed service programs, and other services including education, retained search,
and contingent search. Cross Country has more than 6,000 nurses and allied professionals and
1,500 independent physician contractors.12
RightSourcing, a privately held company, specializes in vendor
management services. The company only offers two different
products: managed services and locum tenens managed services.
The managed services segment connects clients with temporary
nursing and allied staffing agency services, while the locum tenens
9 IBISWorld Industry Report: US HealthcareStaff Recruitment Agencies
10 Ibid.
11 CHG Healthcare2015 Annual Report
12 Cross Country 2015 Annual Report
13
18%
11.9%
0%
5%
10%
15%
20%
2013 2015
% of Uninsured Americans Since
Affordable Care Act Implementation
managed services helps clients coordinate with locum tenens providers.13
Jackson Healthcare is a privately held medical staffing company
with more than 1,800 facilities in the United States. Jackson
Healthcare offers various staffing services in the traveling, locum
tenens, and permanent placement segments. Its subsidiary,
Jackson Surgical Assistants, is the first nationwide staffing
company exclusively focused on the surgical assistant professions.
In addition, Jackson Healthcare also provides advisory,
management service provider and education services.14
Industry Trends
Supply Shortages
Throughout the United States, there is a shortage of healthcare practitioners. A region is
designated a Health Professional Shortage Area (HPSA) by the federal government when it does
not meet a minimum level of one practitioner per 3,500 residents (or one per 3,000 residents in
particularly high-need areas). Nationally, an average of 60% of needs are met with only one
state, Delaware, reaching over 80%.15 California, New York, and Texas average only 45% of
need met and need the second-, third-, and fourth-most professionals, respectively, to shed their
HPSA designations.16 This makes sense given that they are three of the most populous states in
the nation. Future staffing demand will likely be centered in these states. AMN has a presence in
each of these states and is positioned to capitalize on the extreme need for nurses as it can
relocate nurses from less needy areas to these severe HPSAs.
Increased Healthcare Utilization
While the number of active physicians is
expected to fall dramatically, the number of
individuals regularly using healthcare services
has risen considerably over the past two years
as a result of changes in healthcare policy. For
example, since the implementation of the
Affordable Care Act, the number of uninsured
Americans fell from 18 percent in 2013 to 11.9
percent in 2015. As healthcare is made more
affordable, millions who previously did not
regularly visit hospitals, doctor offices or
nursing facilities will start to utilize these
services more frequently, stretching the limited
13 RightSourcingCompany Website
14 Jackson HealthcareCompany Website
15 Kaiser Family Foundation
16 Ibid.
14
supply of healthcare providers.
Furthermore, longer lifespans and an aging “baby boomer” generation are expected to double the
number of individuals in the US ages 65 or older within the next 25 years.17 More than two-
thirds of these individuals have multiple chronic conditions and treating these conditions
accounts for roughly 66 percent of healthcare spending in the US.18 This means that not only are
more individuals likely to regularly use the healthcare system in the next decade, but older, more
expensive patients are due to come into the system as well. From a physician and nursing
perspective, this means more patients that require more care. From an industry perspective, this
means fewer professionals relative to demand. Since demand for healthcare services is relatively
inelastic, healthcare staffing companies should be able to pass on increases in labor costs arising
from high demand and low supply to their clients. AMN will be able to capitalize in the form of
higher revenues.
Industry CompetitiveStructure
The medical staffing industry is highly fragmented, with an industry C4 of 21.6% and an HHI
score of just 126.74. Some rivalry exists, but competitors do not typically compete on pricing.
Instead, companies compete by leveraging quality and geography and by using MSP contracts to
create exclusivity and increase switching costs in an otherwise non-exclusive contract market.
Threat of New Entrants and Substitutes
The threat of new entrants in the industry is fairly low. While capital requirements would not be
intense, the threat is diminished by the need for a strong network of both associated professionals
and clients. It would be difficult for a new entrant to attract a critical mass of professionals given
the already stretched labor market. It would also be difficult for a new firm with little
reputational sway to convince clients to switch to its service. The market is characterized by a
focus on quality, so a strong brand is essential.
The threat of substitutes is marginal. The only real substitute is hiring a full-time medical
professional, which is not feasible for many of the purposes of temporary staffing, namely filling
vacancies during variable periods of high demand. It takes an average of 82 days to fill a
permanent nursing position, and clients of temporary staffing agencies cannot wait that long
when demand exists in the short-term.19
Threat of Suppliers
The supplier of the healthcare staffing industry is the labor market of medical professionals. In
terms of leverage by the professionals, the threat is relatively low since many are independent
contractors with little leverage. The greater threat is that there simply are not enough individuals
to fill demand, as outlined previously.
17 Centers for DiseaseControl and Prevention, 2013
18 Ibid.
19 KPMG U.S. Hospital NursingLabor Costs Study
15
ComparableRatios
Return on Assets
Return on Assets 2013 2014 2015
AMN Healthcare 7.3% 6.4% 10.7%
Cross Country 0.0% 1.8% 4.9%
On Assignment 6.1% 7.1% 6.9%
AMN significantly outperforms its industry peers in terms of return on assets. This is a testament
to management’s ability to run the company efficiently. AMN generates much more income
from its assets than its competitors, more than doubling what we view as its most similar
competitor, Cross Country Healthcare.
Current Ratio
Current Ratio 2013 2014 2015
AMN Healthcare 1.6x 1.6x 1.5x
Cross Country 1.9x 2.0x 1.8x
On Assignment 2.1x 2.2x 2.6x
AMN is healthy in terms of liquidity, maintaining a current ratio well above one over the past
three years. While it is outpaced by its peers, we do not believe this is a reason to be concerned
about AMN’s liquidity. The lower liquidity can be explained by the amount of debt required for
AMN’s recent acquisitions. As long as AMN maintains enough liquid assets to keep this ratio
above one, liquidity worries are minor.
Total Liabilities to Total Assets
Total Liabilities/Total
Assets 2013 2014 2015
AMN Healthcare 64.0% 62.3% 60.5%
Cross Country 35.3% 59.9% 61.4%
On Assignment 49.1% 49.3% 55.6%
Historically, AMN has a much higher level of total liabilities to total assets than its competitors.
This is not surprising when considering the company’s acquisitiveness, which is financed in
large part through debt. In recent years, however, AMN’s competitors have also begun to take on
debt. This has created an upward movement in competitors’ leverage ratios while AMN’s has
slowly declined. This trend of declining company leverage combined with increasing competitor
leverage has evened the playing field, bringing the industry together at an approximately 60%
leverage level.
16
Executive Managementand Corporate Governance
ManagementTeam
Susan Salka
Titles: Chief Executive Officer and President
Susan Salka began at AMN in 1990. She started in an
entry-level position and worked her way up through
such positions as Vice President of Business
Development, Chief Operating Officer, Secretary, and
Executive Vice President. She became the President
and CEO in May 2005. She was recently named the
2016 Most Admired CEO by the San Diego Business
Journal. Here is a quotation from the article about her
win that shows her character:
“It is quite an honor to for me to receive this award, but it's really a reflection of
our entire team and a testament to the fantastic talent and passion they bring to our
clients every day," Salka said. "We've had a truly incredible year, and I've never
been so proud of our company as I am today. But just wait -- our future is even
brighter."20
Brian Scott
Titles: Chief Financial Officer, Chief Accounting Officer, and Treasurer
Brian Scott started at AMN in 2003. He ascended to his current position as CFO, CAO, and
Treasurer in January 2011. He previously served as AMN’s Vice President of Finance. Before
joining the firm, Scott previously worked as a controller at a small biotech firm and in
accounting with KPMG.
Jeanette Sanchez
Title: Chief Information Officer
Jeanette Sanchez joined AMN as Senior Vice President of IT in 2013. She was subsequently
promoted to her current position, CIO, in July 2014. Prior to her time at AMN, Sanchez worked
at several other healthcare-related firms.
Ralph Henderson
Title: President of Healthcare Staffing
Ralph Henderson joined AMN in 2007 and ascended to his current position in February 2012.
Prior to joining AMN, he worked for Spherion, a premier staffing company. Henderson is a
20 PR News
17
three-time HRO Today Superstar and also a three-time honoree of the Staffing Industry
Analysts’ (SIA) Staffing 100 list of industry leaders.
Marcia Faller
Titles: Chief Clinical Officer and Senior Vice President, Operations
Marcia Faller began with AMN in 1989. She is widely credited with implementing rigorous
screening and quality control processes for AMN’s associated healthcare professionals. Dr.
Faller is also a faculty member at the University of San Diego.
Management Performance
AMN’s management team has performed admirably over the past several years. The company
has exceeded analysts’ earnings estimates for 19 of the previous 20 quarters.21 Management has
also met several key goals, such as expanding the company’s MSP spend, during its tenure as
well.22 Finally, management has made acquisitions that not only grow the company, but do so
intelligently. Overall, this is an effective management team that is well-equipped to continue
leading the company.
Insider Stock Holdings
Top Insider Holders
Insider % Shares Outstanding
Susan Salka 0.79
Jeffrey Harris 0.14
Brian Scott 0.14
Paul Weaver 0.13
Ralph Henderson 0.11
AMN insiders hold a fairly small amount of the company’s stock, owning approximately 1.6% of
the company’s equity. CEO Susan Salka is by far the largest insider holder of AMN stock at
0.79% of shares outstanding. While it would be encouraging to see management hold a greater
share of the firm’s equity, AMN management has tended to hold only a small position. No major
buys or sells have occurred in the recent past, giving no indication of management’s views on the
company’s future performance.
21 Bloomberg
22 AMN Healthcare2015 Annual Report
18
Board of Directors
Douglas Wheat
Chairman of the Board
Douglas Wheat has been AMN’s board chairman since 1999. He serves on the executive
committee. Wheat is experienced in healthcare staffing industry mergers and acquisitions as well
as corporate finance. He also serves on the boards of several other companies, including
Challenger Capital Group and Dex Media.
Susan Salka
Susan Salka has been a director since 2003. She serves on the executive committee. Salka held
numerous executive positions in the company prior to joining the board and, as outlined
previously, is currently the CEO.
Andrew Stern
Andrew Stern has served as a director since 2001. He is on the audit and corporate governance
committees. Stern is currently the CEO of Sunwest Communications Inc. He is also a director on
two other companies’ boards.
R. Jeffrey Harris
R. Jeffrey Harris has been a member of the AMN board since 2005. He is on the compensation
and corporate governance committees. He has experience with mergers and acquisitions and has
served on the board for several other healthcare and biotechnology companies.
Paul Weaver
Paul Weaver joined AMN’s board in 2006. He is the chair of the audit committee and is also on
the executive committee. He has extensive international audit and finance experience. Weaver
concurrently serves on the boards of several other companies and is the former vice chairman of
PwC.
Dr. Michael M.E. Johns
Michael Johns has been a director since 2008. He is the chair for the corporate governance
committee and is also on the compensation committee. He has extensive experience in the
healthcare industry. He is a professor at the School of Medicine at Emory University and is also
a member of the National Academy of Medicine of the National Academy of Science.
Additionally, Johns serves on the boards of several other companies. He previously served as the
Dean of the Johns Hopkins School of Medicine and Vice President of Medical Faculty at Johns
Hopkins University.
19
Martha H. Marsh
Martha Marsh became a member of the AMN board in 2010. She is the chair of the
compensation committee and is also on the corporate governance committee. She has served on
the boards of numerous healthcare companies. Marsh was the CEO of Stanford Hospital and
Clinics for 8 years and, prior to that, she was the CEO of UC Davis Health Systems for three
years.
Mark G. Foletta
Mark Foletta joined the board in 2012. He is on the audit committee. He has significant audit,
financial, and healthcare experience. He was previously the CFO of Biocept, Inc. and Senior VP
of Finance and CFO of Amylin Pharmaceuticals, Inc. He has served on the boards of numerous
healthcare companies. He is a CPA (inactive license).
Overall, the board of directors is very independent and experience. Below is a chart showing the
committees and who is on each committee.
Members Audit
Committee
Compensation
Committee
Corporate
Governance
Committee
Executive
Committee
Douglas Wheat X (Chair)
Susan Salka X
Andrew Stern X X
R. Jeffrey
Harris
X X
Paul Weaver X (Chair) X
Dr. Michael
Johns
X X (Chair)
Martha Marsh X (Chair) X
Mark Foletta X
ISS Governance Quickscore
AMN Healthcare Services has an ISS Quickscore of 1, on a ten-point scale where 1 is the best
score. Of the component pieces, AMN scores a 2 on Board Structure, 1 on Shareholder Rights, 1
on Compensation, and a 1 on Audit & Risk Oversight. This speaks to the company’s exceptional
corporate governance.
20
General Employees
As of December 31, 2015, AMN had 10,639 employees, split between 2,550 corporate
employees and an average of 8,091 contracted practitioners. This does not include the large
network of locum tenens physicians that AMN maintains as independent contractors. There are
no unionized employees.
EmployeeValueProposition
Competitive Pay
AMN compensates its temporary staffers very fairly in terms of industry norms. While traveling
staff are often paid slightly less than their permanently employed counterparts, the pay ends up
being equivalent or better in most cases because AMN also pays for staffers’ housing while they
are on-assignment.
Placement in Top Facilities
As a leader in the industry, AMN works with some of the top medical systems in the country,
such as the Johns Hopkins Health System and Stanford Hospitals and Clinics. This means that
AMN staffers are placed at these prestigious facilities, allowing the staffers to get a valuable,
internship-like experience. In some cases, an AMN assignment is the catalyst for an offer for a
permanent position.
Flexibility
Flexibility is a key consideration for traveling temporary staffers. Staffers are able to travel the
country very easily thanks to AMN’s wide geographic network. This is a helpful recruiting tool
as 38% of travel nurses say that traveling to many different places is their number one reason for
being a temporary staffer. Besides geographic flexibility, AMN also provides great flexibility in
terms of employee schedules. Unassigned staffers may sign up for a new assignment at any time,
with an assignment length of just a few weeks up to a year. This allows employees to work on-
and-off and customize their schedules without necessarily locking themselves in for significant
periods of time.
EmployeeSatisfaction
AMN earned a rating of 3.1 stars—on a five-star scale—on Glassdoor from 209 employee
reviews. The lowest ratings seem to come from traveling nurses. 84% approve of CEO and 51%
would recommend the company to a friend. The traveling nurses complained of being
21
overworked and underpaid.23 Despite this, AMN does outscore Cross Country Healthcare. Cross
Country’s rating is only 2.7 stars with 53% CEO approval and a 37% recommendation level.24
On Indeed.com, AMN has a higher rating of 3.6 stars. This site’s rating is broken up into several
categories, also on a five-star scale. Employees rated work/life balance at 3.7 stars, compensation
and benefits at 3.3 stars, and job security and advancement at 3.0 stars. In terms of more
subjective issues, management earns 3.0 stars and the company culture earns 3.7 stars.25 The
reviews on Indeed are much more positive than on Glassdoor. The sample size, however, is
smaller, with only 93 employee reviews. Cross Country has not been reviewed on this site, so
comparison is not possible.
LicensingRequirements
Since a great deal of AMN’s nurses and physicians travel from hospital to hospital, it is possible
that they will be asked to travel over state lines. This does, however, present some problems as
different states have different licensing requirements for medical professionals before they may
practice medicine.
Thanks to coordination between the states, nurses may practice across state lines relatively
easily. Every state has “nursing license reciprocity,” which allows registered nurses to apply for
licenses in other states without repeating qualifying examinations.26 Typically, nurses will
simply complete a background check and submit fingerprints to the non-home state to receive a
license. These licenses are valid for 90 days.27 In addition, 25 states, which are displayed in the
above map, are party to the Nursing Licensure Compact (NLC), which allows RNs and some
23 Glassdoor
24 Ibid
25 Indeed.com
26 RNLicensing.org
27 Ibid.
22
specialized nurses who are licensed in one of the member states to practice in any of the other 24
with no additional requirements.28 Unfortunately, two of AMN’s largest markets, California and
New York, have not yet joined the NLC.
Physicians face a more difficult path to practicing in states other than the one in which they were
originally licensed. The process is time-consuming as physicians may have to take additional
exams in addition to the incidental processes that nurses must go through. An expedited process
has been created through the Interstate Medical Licensure Compact (IMLC), but it is not yet in
effect. Once the IMLC is implemented, physicians will be able to apply for medical licenses in
other IMLC states without taking additional exams.29 There are currently 12 member states of
the IMLC and 12 more states with membership legislation pending, as seen in the above map.30
28 National Council of State Boards of Nursing
29 LicensePortability.org
30 Ibid.
23
FinancialAnalysis
IncomeStatement
After
experiencing a
modest 3.35%
CAGR in revenue
from 2012
through 2014,
AMN
Healthcare’s
revenue increased
41.2% in 2015.
This is the
company’s
highest year-over-
year revenue
growth since
2011 when it
experienced
32.5% growth. The company’s revenue growth in 2015 marks an industry-leading performance.
The company’s EBITDA was also up 81% in 2014 to an 11.3% margin, which beat
management’s expectations by 1.3%. Revenue was driven up by 26% organic growth and 74%
from acquisitions. The company successfully amassed benefits from its acquisitions, as it has
expanded and deepened the extent of its operations while also improving margins.
Revenue for the company’s largest segment, nurse and allied staffing, increased at 47.3% during
2015, over half of which was a result of organic revenue growth as the company continued to
add supply to the travel market and increase staff placement levels. 39% of the revenue growth
was attributable to the acquisitions of Onward Healthcare, First String Healthcare, and Avantas.
Locum tenens staffing and physician permanent placement services experienced 30% and 21%
revenue growth, respectively, in 2015, driven by increased demand for business through MSP
contracts and record-high physician search and placement levels. 37% of the increase in revenue
for the locum tenens staffing segment is traced to the Onward Healthcare acquisition.
After studying AMN’s past income statements, it is apparent that the company is trending in a
positive direction. The company has increased its gross margin every year since 2010, moving
from 27.1% in 2010 to 32.1%. This is attributable to both AMN’s relentless pursuit of
efficiencies in the staffing sector and the acquisition of higher-margin business intelligence and
SaaS companies like Medefis. Thanks to tight control over expenses, which have been stagnant
over the period, AMN has also increased its net margin consistently, from -7.8% in 2010 to
5.6%.
AMN has fared better in terms of income items than two of its closest public competitors, Cross
Country and On Assignment. Both companies reported deteriorating net margins over the same
24
period, with Cross Country moving from 28.1% to 25.8% and On Assignment decreasing
slightly from 34.1% to 32.9%. This shows that AMN has been more effective than its
competitors at gaining efficiencies in the marketplace, which is even more impressive
considering how many acquisitions AMN has made over the period. The company has done well
to integrate these new businesses while also increasing its margins.
AMN also compares favorably to its competitors in terms of net income margin and growth.
Cross Country’s 2015 net margin was only 0.6% and it has fluctuated wildly over the past five
years, sinking deeply into negative territory for three years, including a low of -12.4% in 2013.
On Assignment performed better, but did not exhibit growth. The firm’s net margin fluctuated in
a band of about 90 basis points, but ended the period exactly where it started at 4.7%. It appears
that these firms were unable to cut costs to cope with their decreasing gross margins, especially
in Cross Country’s case.
Cash Flow
Net cash provided by operating activities increased substantially from $27.7 million in 2014 to
$56.3 million in 2015. This stems from the company’s solid organic and inorganic revenue
growth and an increase in accounts payable and accrued expenses. AMN notes that an increase in
accounts receivable slightly offset these increases. This increase was attributed to slower
payments by a few large customers, MSP clients adjusting to new software, and extended billing
processes for clients utilizing third-party VMS technology.
AMN experienced a large increase in cash used by investing activities. Capital expenditures to
foster organic growth and cash used for acquisitions increased cash used for investing to $116.1
million in 2015 from $28.2 million in 2014. Capital expenditures were $27 million and $19.1
million for those years, respectively, to support business growth and improve front and back
office technology. The company utilized cash of $77.5 million, $4.5 million, and $3.1 million to
acquire Onward Healthcare (including Locum Leaders and Medefis), the First String Healthcare,
and Millican Solutions in 2015.
Cash flows of $56.2 million were provided by financing activities in 2015, driven by an increase
in borrowing from the company’s revolver and reduced by payments to its term loan. Overall,
the company has lost cash the last two years. This is reasonable, because of the company’s
aggressive acquisition strategy. Regardless, AMN still maintained growth in operational cash
flow.
25
Organic Growth Strategy
AMN Healthcare aims to strengthen its business by reducing staffing complexity, increasing
efficiency, and enhancing the patient experience. In 2015, the Company experienced organic
revenue growth of 26% compared to 2014. Revenue growth was driven by double digit growth
in each of the company’s business divisions. The demand for temporary healthcare professionals
increased significantly in 2015, resulting in larger billing rates for the Company to attract a
sufficient supply of healthcare professionals to meet the demand, contributing to the increase in
organic revenue.
FurtherDevelop Processesto AchieveMarket-leading Efficiency
The company plans to continue developing its systems to achieve market leading efficiency and
scalability beyond temporary staffing services. AMN believes by expanding its core capabilities
and complementary offerings (MSP, RPO, VMS, etc.), this will provide additional leverage for
clients to use its services instead of its competitors31. For 2016, the company is implementing its
interim leadership and executive search and crisis/labor disruption staffing offerings.
Continueto Investin Infrastructure
AMN Healthcare intends to continue investing in recruiting technology and infrastructure to
access and utilize effectively its network of qualified healthcare professionals. By increasing
efficiency in recruiting, the company can capitalize on the demand growth currently being
experienced. The company anticipates demand to rise due to the combined effects of the aging
population, healthcare reform, and the labor shortages within its operating regions. AMN
recently began a multi-year investment in strengthening its infrastructure domains32. The
company plans to launch more subsidiary domains that provide information resources and online
job network platforms.
31 AMN Healthcare2015 Annual Report
32 Ibid.
26
The needs of clients
Alignment with core
expertise of recruitment,
credentialing, and access
to healthcare
professionals
Strenghtheningand
broadening of client
relationships
Reduction in exposure to
economic cycles
Enhancement of long-
term sustainable
business model
Return on invested
capital
AcquisitiveGrowth Strategy
With increasing demand for healthcare services, a growing physician shortage, increasing
adoption of workforce services, and an aging population, AMN Healthcare’s growth strategy
aims to access these lucrative market drivers. The company strives to drive organic and inorganic
growth through broadening its offerings and investing. The firm has complimented its flagship
nursing staffing services with innovative workforce solutions such as RPO, VMS, and MSP
workforce optimization services. Through the diversification of offerings, the company operates
at higher margins, expands its relationships with clients, creates new recurring revenue sources,
and solidifies its position as a market-leading innovator. AMN Healthcare’s 35.1% 3-year
EBITDA CAGR is a remarkable product of the firm’s growth strategy.
When considering an investment or acquisition in a new service or product line, AMN
Healthcare considers the following factors33:
33 AMN Healthcare2015 Annual Report
27
Acquisitions
AMN Healthcare’s growth strategy in the recent past and near future is largely driven by
successful acquisitions, which increase industry leading market share for the firm and diversify
the portfolio of the business. AMN has an excellent track record of integrating acquisitions into
the company. Since going public in 2002, the company has acquired 12 firms, and all but one
have been successfully integrated. Below is a summary of acquisitions since 2013.
AMN Healthcare, Acquisitions 2013-2016
Company Date
Announced
Price/Funding Business Description
B.E.
Smith
January 2016 $160 million,
funded with term-loan
and credit facility
revolver
Interim leadership, advisory, and
executive search firm, serving
healthcare industry for over 25 years.
B.E. Smith has recently placed over
1,000 healthcare executives.
MillicanSolutions October 2015 $4 million,
funded with cash
Founded in 2001, the company provides
physical and executive leadership search
advisory for academic medical centers
across the nation. Only firm in industry
focused exclusively on initiatives for
children’s hospitals
The First String Healthcare September
2015
$6.5 million and
additional $4.0 million
(through 2017) based on
future performance,
funded with cash
Founded in 2002, the company has
served over 250 hospitals with a
personalized approach to interim
staffing, permanent placement, and
leadership development for nurse
leaders and executives.
Onward Healthcare, Locum
Leaders, Medefis
December
2014
$82.5 million, funded
with cash and credit
facility revolver
OGH, LLC owned Onward Healthcare
(leading nurse and allied healthcare
staffing), Locum Leaders (one of the
fastest growing locum tenens firms,
specializing in placing physicians), and
Medefis (leading provider of SaaS-
based vendor management services
(VMS) for healthcare facilities).
Avantas December
2014
$16.5 million and
additional $8.5 million
based on future
operating performance,
funded with cash and
credit facility revolver
Founded in 2002, company provides
clinical labor management services,
such as predictive modeling, SaaS-based
scheduling, data analytics, and
workforce consulting. Avantas received
the highest rating for a staff scheduling
company in its category by research
firm KLAS.
ShiftWise November
2013
$39.5 million,
funded with cash and
credit facility revolver
Founded in 2003, the company provides
SaaS for the management of temporary
and permanent contract labor for
healthcare facilities, which includes
vendor management services (VMS).
ShiftWise contracts with 1,800 facilities
for web-based applications and
professional services.
28
The firm’s Nurse and
Allied Solutions and
Local Tenens
Solutions have seen
positive effects from
acquisitions. The
Nurse and Allied
Solutions segment
experienced 47%
revenue growth from
2014 to 2015. 39% of
this growth is
attributable to the
Onward Healthcare,
First String
Healthcare, and
Avantas. $128.1 million in additional revenue was received from these firms. Considering the
company only paid cash of $96.5 million to acquire these companies, it is clear that AMN
Healthcare’s acquisitions are immediately accretive to the company’s growth. The acquisition of
Onward Healthcare also attributed $32.9 million in additional revenue to the Locum Tenens
Staffing segment, which accounts for 37% of the 30% increase in revenue for the division from
2014-2015.
Gross margin also received a bump from 30.5% to 32.1%, which was propelled the higher
margin of SaaS-companies Medefis and Avantas. The 2011 Pacific Crest Private SaaS Company
survey details that private SaaS generally maintain a gross margin around 70%. Hence, as the
company looks to continue to expand its offerings though innovative workforce solutions and
optimization services in the SaaS sphere, AMN Healthcare’s gross margin should continue to
rise.
29
Valuation
ValuationMethods
We determined our target price using two valuation methods: a hybrid discounted cash flow
analysis and a peer group multiple analysis, which itself involved two different methods. These
valuation methods provided target prices based on expected future cash flows and multiples
derived from operating results over a one-year time horizon. Finally, the resulting price targets
were weighted to give what we feel is a conservative, yet reliable, price target.
Hybrid DCF
The hybrid DCF analysis incorporates both the perpetual growth rate method and the exit
multiple method, weighted equally to arrive at a target price.
Both methods use the free cash flows from the projected
financial statements, which can be found in the appendices.
The perpetual growth rate method grows 2020 cash flows in
perpetuity using the company’s WACC less the discount
rate, 8.2% and 2.0%, respectively, for a final discounting
rate of 6.2%. This resulted in a terminal value of $3.78
billion. To contrast, the exit multiple method uses a mean
enterprise value to EBITDA multiple of the comp set in
conjunction with the 2020 EBITDA to determine a terminal
value of $3.48 billion. These terminal value figures were
averaged, discounted back to 2016 levels, and added to the
2016 present value of all free cash flows over the period to
determine an enterprise value of $3.01 billion. The enterprise
value is then stripped of cash and debt is added back to
determine the implied market value of AMN’s equity,
divided by the expected diluted number of shares
outstanding, 48.8 million, resulting in a target price of
$55.86.
Peer GroupMultipleAnalysis
For the purposes of this multiples analysis, we used enterprise
value to EBITDA and forward price to earnings ratios to
estimate the company’s value. We compared AMN
Healthcare’s current trading multiples to those of its publicly
traded peers in the healthcare and general staffing industries,
including Cross Country Healthcare, Team Health Holdings,
On Assignment, Inc., Robert Half International, and
ManpowerGroup. As a secondary benchmark, we also
compared the current average trading multiples for the comp
set to AMN Healthcare’s own 3-year historical trading
multiples. This revealed that the average forward price to
earnings multiple for the comp set was significantly below
AMN’s own historical average. We therefore calculated a new
average forward price to earnings multiple which factored in
30
Valuation Summary
Value Weight
DCF 55.86$ 33.33% 18.62$
EV/EBITDA 47.13$ 33.33% 15.71$
Forward P/E 47.16$ 33.33% 15.72$
Average 50.05$ 100% 50.05$
Weighted Average Target Price 50.05$
Current Share Price 34.51$
Potential Upside/Downside 45.02%
the higher historical figure as well. In the enterprise value to EBITDA case, we use the
company’s projected 2017 EBITDA and the multiple to come to an implied value of equity, then
divide by the number of shares outstanding. In the forward price to earnings case, we use our
projected 2017 earnings per share and multiply by the adjusted average forward price to earnings
multiple to determine a price. The enterprise value to EBITDA and forward price to earnings
multiples resulted in price targets of $47.13 and $47.16, respectively.
ValuationSummary
We combined all of the valuation methods
in an equally weighted average. This
resulted in a final target price of $50.05.
This represents an implied upside of just
over 45% over the closing price on April 4,
2016.
SensitivityAnalysis
To account for potential risks to our valuation, a sensitivity analysis was conducted. We valued
the company under several different scenarios that could materially affect the company’s value,
particularly the possibility of an economic downturn in the coming 18 months or an accretive
acquisition.
EconomicDownturn
To account for potential economic turbulence, we analyze mild, medium, and severe downturns.
To determine how these situations could play out, we looked to the past to see the dips in
revenue and the subsequent recovery patterns for AMN after a downturn. The severity was
changed by adjusting the initial drop in revenues and the speed at which revenues recover. The
effect on AMN’s value in these scenarios is summarized in the table below. The downside is
much less than AMN’s actual loss during the previous economic downturn. This is because we
believe the diversification to MSP and other workforce solutions will insulate the business
somewhat from the certain decline in temporary hiring in a downturn.
Economic Downturn and AMN Target Price
Degree of Downturn Downside from Current Price
Mild -9.4%
Medium -13.3%
Severe -17.0%
Acquisition
While we cannot predict an acquisition with certainty, we believe that it is highly probable that
AMN will make at least one acquisition within our investment horizon. To account for this
potential for extra upside, varying sizes of acquisitions were added to our model to determine the
effect on AMN’s value. We used three scenarios: a small acquisition of $50 million, a medium
31
acquisition of $100 million, and an aggressive acquisition of $200 million. The accretive effects
of these acquisitions on revenue was determined by using the average multiple of revenues to
purchase price for AMN acquisitions over the past two years. The results are summarized in the
table below. The results show a significant increase in upside for the investment compared to our
base case, which did not include inorganic growth in the interest of conservatism.
Acquisitions and AMN Target Price
Size of Acquisition Upside from Current Price
Small 50.3%
Medium 52.6%
Large 54.4%
32
Risks
Firm-Specific Risks
Contracts
AMN’s service offerings are typically sold to its clients via contracted sales agreements. While
this does lock clients in for a period of time, concerns arise with the terms of these contracts. For
certain services, such as travel nursing, clients are free to utilize other staffing agencies
concurrently, even if AMN could potentially meet their needs individually (MSP offerings are
exclusive contracts which typically last three years).
This risk, however, is not cause for alarm. There is nothing to suggest that clients have regularly
shifted to competitors to fill capacity when AMN has available practitioners and many of AMN’s
largest clients, such as Stanford Hospitals and Kaiser Permanente, do work exclusively with the
company. This is a major portion of AMN’s competitive advantage and largely mitigates the risk
of provider mixing through loose contracts.
Acquisition Integration Failure
AMN grew rapidly in the last two years, partly due to its successful acquisition strategy. While
these acquisitions were easily integrated into the existing structure of AMN, there is risk that
future acquisitions will not integrate so smoothly. Failed acquisitions would lead to major losses
for the firm as they would not realize growth from the significant acquisition expenditures.
After speaking with AMN CFO Brian Scott, we believe that the company has a strong evaluation
process for potential acquisitions. This appears to be attributable to the company’s failed
acquisition of Rx Pro Health in 2007. Management determined post-acquisition that, despite its
accretive potential, Rx Pro Health did not have the leadership necessary to make the acquisition a
success. Leadership and management have now become the cornerstone of AMN’s evaluation
process. Scott went as far as to say the company had turned down what it believed would be
profitable acquisitions due to the potential for a leadership vacuum. While it does not eliminate
the risk, the careful acquisition process reduces the risk significantly and reduces our concerns.
Medical Personnel Shortage Inhibits Recruiting
The aforementioned shortage in medical professionals could hurt AMN’s recruitment, thus
severely hampering its ability to maintain its high fill rates. This is a major portion of the firm’s
competitive advantage. Assuming AMN remains committed to its extensive recruitment efforts
and the differences it provides from traditional employment remain appealing to medical
professionals, this risk is low. Whether that remains the case is uncertain, so we are somewhat
concerned and would monitor this situation closely.
33
Industry andMacroRisks
Healthcare Policy Changes
The Affordable Care Act, while effectively reducing the uninsured rate and thus increasing
demand for healthcare services, has proven politically controversial. The law has been repeatedly
targeted for repeal by its opponents and these efforts would become much more likely to succeed
if a Republican candidate is elected president in 2016. Repeal of the ACA—the implementation
of any replacement policies not withstanding—would derail much of the momentum on AMN’s
side from industry trends. We believe this poses a serious risk to the company, but view the
prospect of a complete repeal as fairly low, considering how the presidential race looks today.
Vulnerability to Market Downturns
As outlined with the historical stock chart, the healthcare staffing industry is highly vulnerable to
economic downturns. Hospitals, much like other businesses who use temporary staffers, tend to
part ways their temporary staff as part of quick cost-cutting maneuvers during the onset of
recessions. AMN has dealt with this risk previously, seeing revenues fall dramatically in 2009 as
the most recent recession ravaged the economy.
Thanks to AMN’s diversification into non-staffing products, such as MSP and executive search
services, we believe that the potential impact from economic downturns has been significantly
reduced. While the company would still see a revenue dip, our research indicates that hospitals
would remain customers of AMN’s MSP during recessions since the benefits it provides for the
quality of patient care exceed the cost.
Recommendation
Based on our analysis of the company, we recommend a BUY on AMN Healthcare with a price
target of $50.05, representing an upside of 45% over the closing price on April 4, 2016. We
believe AMN is a company whose management understands the favorable industry it competes
in at a high level, allowing it exploit its superior product offerings and wide network to create
advantageous relationships with its clients. We believe that investors are underestimating the
company’s ability to leverage this competitive advantage into future growth, leading to its
undervaluation on the market.
34
HISTORICAL INCOME STATEMENT PROJECTED INCOME STATEMENT
Fiscal year 2011A 2012A 2013A 2014A 2015A 2016P 2017P 2018P 2019P 2020P
Fiscal year end date 12/31/2011 12/31/2012 12/31/2013 12/31/2014 12/31/2015 12/31/2016 12/31/2017 12/31/2018 12/31/2019 12/31/2020
Revenue 887,466 953,951 1,011,816 1,036,027 1,463,065 1,855,678 2,104,663 2,273,036 2,432,149 2,578,078
Cost of sales (enter as -) (638,147) (683,554) (714,536) (719,910) (993,702) (1,243,304) (1,410,124) (1,522,934) (1,629,540) (1,727,312)
Gross Profit 249,319 270,397 297,280 316,117 469,363 612,374 694,539 750,102 802,609 850,766
Selling, general & administrative (enter as -) (195,348) (202,904) (218,233) (232,221) (319,531) (397,115) (439,875) (463,699) (483,998) (505,303)
Depreciation & amortization (16,324) (14,151) (13,545) (15,993) (20,953) (37,402) (40,853) (44,317) (48,740) (42,479)
Total Operating Expense (211,672) (217,055) (231,778) (248,214) (340,484) (434,517) (480,728) (508,017) (532,737) (547,783)
Operating profit (EBIT) 37,647 53,342 65,502 67,903 128,879 177,857 213,811 242,085 269,872 302,983
Interest expense (enter as -) (23,727) (26,019) (9,665) (9,237) (7,790) (10,792) (11,068) (14,529) (13,560) (15,215)
Pretax profit 13,920 27,323 55,837 58,666 121,089 167,065 202,743 227,556 256,312 287,768
Taxes (enter expense as -) (8,904) (11,010) (22,904) (25,449) (39,198) (61,389) (76,211) (86,428) (107,651) (120,862)
Income from cont. operations 5,016 16,313 32,933 33,217 81,891 105,676 126,532 141,128 148,661 166,905
Income (loss) from discontiuning operations (31,281) 823 0 0 0 0 0 0 0 0
Net income (26,265) 17,136 32,933 33,217 81,891 105,676 126,532 141,128 148,661 166,905
Other Comprehensive Income 48 (70) (55) 42 173 0 0 0 0 0
Basic Shares Outstanding 39,913 41,632 45,963 46,504 47,525 47,525 47,525 47,525 47,525 47,525
Impact of dilutive securities 6,038 5,077 1,824 1,582 1,318 1,318 1,318 1,318 1,318 1,318
Diluted Shares Outstanding 45,951 46,709 47,787 48,086 48,843 48,843 48,843 48,843 48,843 48,843
Basic EPS (0.66)$ 0.41$ 0.72$ 0.71$ 1.72$ 2.22$ 2.66$ 2.97$ 3.13$ 3.51$
Diluted EPS (0.57)$ 0.37$ 0.69$ 0.69$ 1.68$ 2.16$ 2.59$ 2.89$ 3.04$ 3.42$
EBITDA 61,103 73,717 85,172 91,053 160,116 228,106 268,878 301,423 334,363 361,658
EBITDA Margin 6.89% 7.73% 8.42% 8.79% 10.94% 12.29% 12.78% 13.26% 13.75% 14.03%
AppendixI: Historical and Projected Income Statements
35
HISTORICAL BALANCE SHEET PROJECTED BALANCE SHEET
Fiscal year 2011A 2012A 2013A 2014A 2015A 2016P 2017P 2018P 2019P 2020P
Fiscal year end date 12/31/2011 12/31/2012 12/31/2013 12/31/2014 12/31/2015 12/31/2016 12/31/2017 12/31/2018 12/31/2019 12/31/2020
ASSETS
Cash & equivalents ST & LT market. securities 3,962 5,681 15,580 13,073 9,576 54,853 181,350 433,081 555,130 771,586
Accounts receivable 146,654 142,510 147,477 186,274 277,996 308,117 349,458 377,415 403,834 428,064
Accounts receivable subcontractor 22,497 18,467 18,271 28,443 50,807 46,372 52,594 56,801 60,778 64,424
Deferred income taxes, net 19,335 18,123 24,938 27,330 0 0 0 0 0 0
Prepaid Expenses 5,691 7,282 8,128 10,350 13,526 47,038 53,350 57,618 61,651 65,350
Other current assets (inc. non-trade receivables) 3,652 11,681 15,705 17,200 23,723 24,012 27,234 29,412 31,471 33,359
Total current assests 212,473 203,744 230,099 282,670 375,628 480,392 663,985 954,327 1,112,864 1,362,784
Restricted cash and cash equivalent 18,244 18,861 23,115 19,567 27,352 27,352 27,352 27,352 27,352 27,352
Fixed Assests 16,863 14,815 21,158 32,880 50,134 58,083 66,727 73,864 78,738 89,581
Other assets 19,329 19,732 23,023 38,710 47,569 107,569 107,569 107,569 107,569 107,569
Long-term deferred income taxes 1,823 0 0 0 0 0 0 0 0 0
Goodwill 123,324 123,324 144,642 154,387 204,779 304,779 304,779 304,779 304,779 304,779
Intangible Assests 143,575 136,910 150,197 152,517 174,970 163,022 151,409 140,869 131,034 124,117
Total assets 535,631 517,386 592,234 680,731 880,432 1,141,196 1,321,821 1,608,760 1,762,336 2,016,182
LIABILITIES
Accounts payable and accrued expenses 49,809 52,619 69,407 78,993 118,822 119,722 135,786 146,649 156,914 166,329
Accrued compensation and benefits 43,649 49,443 54,825 67,995 83,701 98,505 111,722 120,659 129,105 136,852
Current Revolver Due 0 0 0 0 0 0 0 0 0 0
Current portion of L-T Debt 31,125 0 10,000 25,500 37,500 41,250 41,250 192,240 3,750 60,000
Deferred Revenue 2,155 0 0 3,177 5,620 3,465 3,930 4,244 4,541 4,814
Other current liabilites 8,313 7,463 6,060 2,630 5,374 10,316 11,700 12,636 13,521 14,332
Bank Overdraft 3,515 0 0 0 0 0 0 0 0 0
Liabilites related to assets held for sale 1,486 0 0 0 0 0 0 0 0 0
Total current liabilites 140,052 109,525 140,292 178,295 251,017 273,258 304,388 476,429 307,832 382,327
Revolver 0 0 0 0 0 0 0 0 0 0
Long-Term Debt 174,198 158,178 148,672 135,690 180,990 300,990 309,740 268,490 426,250 422,500
Deferred income taxes, net 0 0 0 32,491 22,431 22,431 22,431 22,431 22,431 22,431
Other long term liabilites 61,646 67,572 85,528 77,674 78,134 78,134 78,134 78,134 78,134 78,134
Total liabilities 375,896 335,275 374,492 424,150 532,572 674,813 714,693 845,484 834,647 905,392
SHAREHOLDER'S EQUITY
Preferred stock 24,076 0 0 0 0 0 0 0 0 0
Common stock / additional paid in capital 395,363 424,749 429,515 434,995 444,210 457,057 471,271 486,291 502,042 518,238
Retained earnings / accumulated deficit (259,331) (242,195) (211,275) (178,058) (96,167) 9,509 136,041 277,169 425,830 592,735
Other comprehensive income / (loss) (373) (443) (498) (356) (183) (183) (183) (183) (183) (183)
Total equity 159,735 182,111 217,742 256,581 347,860 466,383 607,128 763,276 927,689 1,110,790
Total liabilites and equity 535,631 517,386 592,234 680,731 880,432 1,141,196 1,321,821 1,608,760 1,762,336 2,016,182
AppendixII: Historical and Projected Balance Sheets
36
PROJECTED STATEMENT OF CASH FLOWS
Fiscal year 2016P 2017P 2018P 2019P 2020P
Fiscal year end date 12/31/2016 12/31/2017 12/31/2018 12/31/2019 12/31/2020
Net income 105,676 126,532 141,128 148,661 166,905
Depreciation and amortization 37,402 40,853 44,317 48,740 42,479
Stock based compensation 12847 14213 15020 15751 16196
Accounts receivable (30,121) (41,342) (27,957) (26,419) (24,230)
Accounts receivable subcontractor 4,435 (6,222) (4,208) (3,976) (3,647)
Prepaid Expenses (33,512) (6,311) (4,268) (4,033) (3,699)
Other current assets (289) (3,222) (2,179) (2,059) (1,888)
Accounts Payable and Accrued Expense 900 16,064 10,863 10,265 9,415
Accrued compensation and benefits 14,804 13,217 8,938 8,446 7,746
Current Revolver Due 0 0 0 0 0
Current portion of L-T Debt 3,750 0 150,990 (188,490) 56,250
Deferred Revenue (2,155) 465 314 297 272
Other Current Liabilites 4,942 1,384 936 885 811
Cash from operating activities 118,679 155,631 333,896 8,068 266,611
Restricted Cash and Cash Equivilents 0 0 0 0 0
Capital expenditures (33,402) (37,884) (40,915) (43,779) (46,405)
Other Long term Assests (60,000) 0 0 0 0
Goodwill (100,000) 0 0 0 0
Cash from investing activities (193,402) (37,884) (40,915) (43,779) (46,405)
Notes Payable 120,000 8,750 (41,250) 157,760 (3,750)
Other long term liabilites 0 0 0 0 0
Other comprehensive income / (loss) 0 0 0 0 0
Revolver 0 0 0 0 0
Cash from financing activities 120,000 8,750 (41,250) 157,760 (3,750)
Net change in cash during period 45,277 126,497 251,731 122,049 216,456
AppendixIII: Projected Statements of Cash Flows
37
38
AppendixIV: Model Assumptions
Downside Base Upside
Income Statement Assumptions
Organic Revenue Growth
2016 21.83% 26.83% 31.83%
2017 10.42% 13.42% 16.42%
2018 5.00% 8.00% 9.00%
2019 4.00% 7.00% 8.00%
2020 3.00% 6.00% 7.00%
Margins
Gross profit as % of sales 31.00% 33.00% 34.00%
Selling exp margin 22.41% 21.82% 21.27%
Tax rate 46.00% 42.00% 38.00%
Balance Sheet Assumptions
Working Capital
Current Assets
Average A/R % of Sales 15.60% 16.60% 17.60%
Average A/R Sub. Of Sales 1.81% 2.50% 3.47%
Average Prepaid as % of SGA 2.91% 3.78% 4.46%
Average Curr. Assests as % of Sales 0.41% 1.29% 1.66%
Current Liabilities
Averge A/P and Acc. Exp as % of COGS 10.63% 9.63% 8.63%
Average Acc. Comp. and Beneftis as % of COGS 9.44% 7.92% 6.84%
Average Deferred Revenue as % of Sales 0.38% 0.19% 0.00%
Average Curr. Liabilities as a % of COGS 1.30% 0.83% 0.37%
Long-Term Assets
Average Dep. As % of CAPEX 78.00% 51.82% 33.00%
Average CAPEX as % of Revenue 1.85% 1.80% 0.52%
Average other assets as percent of sales 2.07% 2.70% 3.74%
Average goodwill as % of sales 12.93% 14.00% 16.42%
Average intangible assets as % of Sales 14.35% 14.41% 16.18%
39
AppendixV: Debt Schedule
2011 2012 2013 2014 2015 2016 2017 2018 2019 2020
Current portion of long-term debt
Beginning of period 37,500 41,250 41,250 192,240 3,750
Increases / (decreases) 3,750 0 150,990 (188,490) 56,250
End of period 31,125 0 10,000 25,500 37,500 41,250 41,250 192,240 3,750 60,000
Current portion of L-T debt as % of L-T debt 17.9% 0.0% 6.7% 18.8% 20.7% 13.7% 13.3% 71.6% 0.9% 14.2%
Long term debt
Beginning of period 180,990 300,990 309,740 268,490 426,250
Additional borrowing / (pay down), net 120,000 8,750 (41,250) 157,760 (3,750)
PIK accrual 0 0 0 0 0
End of period 174,198 158,178 148,672 135,690 180,990 300,990 309,740 268,490 426,250 422,500
Interest expense on long term debt (23,727) (16,204) (9,231) (6,124) (6,890) (10,792) (11,068) (14,529) (13,560) (15,215)
Weighted average interest rate (11.6%) (10.2%) (5.8%) (3.8%) (3.2%) (3.2%) (3.2%) (3.2%) (3.2%) (3.2%)
% of interest expense paid in cash 100.0% 100.0% 100.0% 100.0% 100.0%
% of interest expense accrues as PIK 0% 0% 0% 0% 0%
Total debt to total capital 50% 23% 18% 15% 13% 17% 17% 21% 20% 22%
Shares Outstanding 45951 46709 47787 48086 48843 48843 48843 48843 48843 48843
Share price on 12/31 4.43 11.55 14.7 19.6 31.05 34.51 34.51 34.51 34.51 34.51
Market Cap at end of year 203,563 539,489 702,469 942,486 1,516,575 1,685,572 1,685,572 1,685,572 1,685,572 1,685,572
40
2006 2007 2008 2009 2010 2011 2012 2013 2014 2015 2016 2017 2018 2019 2020
Market Revenues 15,946.50 16,799.60 16,445.80 12,385.00 11,444.10 12,450.20 13,040.30 13,378.20 13,895.50 14,854.10 15,620.50 16,096.80 16,735.80 17,494.70 18,224.30
Market Rev Growth YoY NA 5.3% -2.1% -24.7% -7.6% 8.8% 4.7% 2.6% 3.9% 6.9% 5.2% 3.0% 4.0% 4.5% 4.2%
AMN Revenues 1,081.70 1,164.02 1,217.20 759.79 669.91 887.47 953.95 1,011.82 1,036.03 1,463.07 1,855.68 2,104.66 2,273.04 2,432.15 2,578.08
AMN Rev Growth YoY 7.6% 4.6% -37.6% -11.8% 32.5% 7.5% 6.1% 2.4% 41.2% 26.8% 13.4% 8.0% 7.0% 6.0%
AMN Market Share 6.78% 6.93% 7.40% 6.13% 5.85% 7.13% 7.32% 7.56% 7.46% 9.85% 11.88% 13.08% 13.58% 13.90% 14.15%
AppendixVI: Market Share Projections
41
AppendixVII: DepreciationSchedule
Depreciation Schedule for AMN Healthcare
Dollars in thousands 2012 2013 2014 2015 2016 2017 2018 2019 2020
Sales $953,951.0 $1,011,816.0 $1,036,027.0 $1,463,065.0 $1,855,678.0 $2,104,663.3 $2,273,036.3 $2,432,148.9 $2,578,077.8
Capital expenditures 5,472.0 9,047.0 19,134.0 27,010.0 33,402.2 37,883.9 40,914.7 43,778.7 46,405.4
Capital expenditures, as % of sales 0.6% 0.9% 1.8% 1.8% 1.8% 1.8% 1.8% 1.8% 1.8%
Beginning net PP&E 32,880.0 50,134.0 58,082.7 66,726.7 73,863.8 78,738.0
Capital expenditures 27,010.0 33,402.2 37,883.9 40,914.7 43,778.7 46,405.4
(Asset sales and write-offs) 0.0 0.0 0.0 0.0 0.0 1.0
(Depreciation expense) (9,169.0) (25,453.6) (29,239.9) (33,777.5) (38,904.6) (35,562.3)
Ending net PP&E 32,880 50,134 58,082.7 66,726.7 73,863.8 78,738.0 89,582.1
Existing PP&E, net 32,880.0 50,134.0
Land 0.0 0.0
Depreciable PP&E, net 32,880.0 50,134.0
Depreciation of existing PP&E
Average useful life of existing net PP&E 5.0 $16,711.3 $13,369.1 $10,026.8 $6,684.5 $3,342.3
Average useful life of capital expenditures 5.0
Depreciation from capital expenditures Depreciation of future CapEx
Depreciation of 2016 capex ($2,701.0) ($5,402.0) ($5,402.0) ($5,402.0) ($5,402.0) ($5,402.0)
Depreciation of 2017 capex ($3,340.2) ($6,680.4) ($6,680.4) ($6,680.4) ($6,680.4)
Depreciation of 2018 capex ($3,788.4) ($7,576.8) ($7,576.8) ($7,576.8)
Depreciation of 2019 capex ($4,091.5) ($8,182.9) ($8,182.9)
Depreciation of 2020 capex ($4,377.9) ($4,377.9)
Total Depreciation Expense $8,354.0 $9,169.0 $25,453.6 $29,239.9 $33,777.5 $38,904.6 $35,562.3
Depreciation as % of PP&E, net 25.4% 18.3% 43.8% 43.8% 45.7% 49.4% 39.7%
Depreciation as % of capital expenditures (43.7%) (33.9%) (76.2%) (77.2%) (82.6%) (88.9%) (76.6%)
42
AppendixVIII: WACC Calculation
Cost of Debt
Interest Rate 3.2%
Tax Rate 42%
Weight of Debt 38.6%
Weighted Cost of Debt 0.7%
Cost of Equity
Risk Free Rate 1.94%
Expected Market Return 9.93%
Beta 1.28
Weight of Equity 61.4%
Weighted Cost of Equity 7.5%
Weight Average Cost of Capital 8.2%
WACC Calculation
43
AppendixIX: Discounted Cash Flow Valuation
Discounted Cash Flow 1 2 3 4 5
Dollars in thousands 2016 2017 2018 2019 2020
After tax EBIT 112,502.6 133,439.4 150,138.6 156,525.7 175,730.2
Depreciation and amortization 37,401.6 40,852.9 44,317.5 48,739.6 42,479.3
Change in working capital (37,245.7) (25,966.9) 133,430.2 (205,084.0) 41,030.9
Stock-Based Compensation 12,847.1 14,213.4 15,020.3 15,751.2 16,196.0
Capex (33,402.2) (37,883.9) (40,914.7) (43,778.7) (46,405.4)
Free cash flow 92,103.4 124,654.9 301,992.0 (27,846.2) 229,031.0
Discount Factor 0.9244 0.8545 0.7899 0.7302 0.6750
Discounted Free Cash Flow 85,140.0 106,518.5 238,544.5 (20,332.9) 154,591.0
Perpetual Growth Method Implied Stock Price
2020 free cash flow 229,031.0 PV of FCF 564,461.2
Perpetual growth rate 2.0% 2,451,403.8
WACC 8.2% 3,015,864.9
Terminal Value 3,780,879.6 Debt (342,240.0)
Cash 54,852.7
Exit Multiple Method 2,728,477.7
Expected EV/EBITDA 9.63x Shares Outstanding 48,843.0
2020 EBITDA 361,658.5 1 Year Target Price 55.86
Terminal Value 3,482,770.9
PV of Terminal Value
Implied Enterprise Value
Implied Market Value of Equity
44
AppendixX: AMN Healthcare Comp Set
45
AppendixXI: Selected CompetitorRatio Comparisons
46
AppendixXII: Selected Competitor Stock Performance
0

Equity Research Report: AMN Healthcare (NYSE: AMN)

  • 1.
    0 Prepared by: Jay TAnderson Liyang Cai Steven Goodwill Dana Huynh Chase Lindsey Nirvon Mahdavi Mark Storey Travis Warner University of Utah Student Investment Fund April 5, 2016
  • 2.
    1 Table of Contents CompanyOverview.........................................................................................................................................................................4 Historical Stock Performance...................................................................................................................................................4 Investment Thesis ...........................................................................................................................................................................5 Business Model................................................................................................................................................................................6 Customer Value Proposition.....................................................................................................................................................6 Reportable Segments .................................................................................................................................................................7 Products........................................................................................................................................................................................7 Staffing and Recruitment......................................................................................................................................................8 Workforce Solutions..............................................................................................................................................................9 Executive Leadership.............................................................................................................................................................9 Advisory Services....................................................................................................................................................................9 Revenue Model ...........................................................................................................................................................................9 Cost Model .................................................................................................................................................................................10 Market Segment........................................................................................................................................................................10 Competitive Strategy................................................................................................................................................................11 Industry and Competitive Positioning ......................................................................................................................................12 Industry Outlook.......................................................................................................................................................................12 Major Industry Players.............................................................................................................................................................12 Industry Trends .........................................................................................................................................................................13 Supply Shortages..................................................................................................................................................................13 Increased Healthcare Utilization.......................................................................................................................................13 Industry Competitive Structure..............................................................................................................................................14 Threat of New Entrants and Substitutes..........................................................................................................................14 Threat of Suppliers...............................................................................................................................................................14 Comparable Ratios....................................................................................................................................................................15 Return on Assets ..................................................................................................................................................................15 Current Ratio.........................................................................................................................................................................15 Total Liabilities to Total Assets ..........................................................................................................................................15 Executive Management and Corporate Governance ............................................................................................................16 Management Team ..................................................................................................................................................................16 Management Performance ................................................................................................................................................17 Insider Stock Holdings .........................................................................................................................................................17 Board of Directors.....................................................................................................................................................................18 ISS Governance Quickscore................................................................................................................................................19 General Employees .......................................................................................................................................................................20 Employee Value Proposition...................................................................................................................................................20 Competitive Pay ...................................................................................................................................................................20 Placement in Top Facilities.................................................................................................................................................20 Flexibility................................................................................................................................................................................20
  • 3.
    2 Employee Satisfaction..............................................................................................................................................................20 Licensing Requirements...........................................................................................................................................................21 FinancialAnalysis ..........................................................................................................................................................................23 Income Statement ....................................................................................................................................................................23 Cash Flow...................................................................................................................................................................................24 Organic Growth Strategy .............................................................................................................................................................25 Further Develop Processes to Achieve Market-leading Efficiency ..................................................................................25 Continue to Invest in Infrastructure......................................................................................................................................25 Acquisitive Growth Strategy .......................................................................................................................................................26 Acquisitions................................................................................................................................................................................27 Valuation.........................................................................................................................................................................................29 Valuation Methods ...................................................................................................................................................................29 Hybrid DCF .................................................................................................................................................................................29 Peer Group Multiple Analysis .................................................................................................................................................29 Valuation Summary..................................................................................................................................................................30 Sensitivity Analysis....................................................................................................................................................................30 Economic Downturn ............................................................................................................................................................30 Acquisition.............................................................................................................................................................................30 Risks .................................................................................................................................................................................................32 Firm-Specific Risks ....................................................................................................................................................................32 Contracts................................................................................................................................................................................32 Acquisition Integration Failure ..........................................................................................................................................32 Medical Personnel Shortage Inhibits Recruiting.............................................................................................................32 Industry and Macro Risks ........................................................................................................................................................33 Healthcare Policy Changes .................................................................................................................................................33 Vulnerability to Market Downturns ..................................................................................................................................33 Recommendation..........................................................................................................................................................................33 Appendix I: Historical and Projected Income Statements ......................................................................................................34 Appendix II: Historical and Projected Balance Sheets .............................................................................................................35 Appendix III: Projected Statements of Cash Flows ..................................................................................................................36 Appendix IV: Model Assumptions...............................................................................................................................................38 Appendix V: Debt Schedule..........................................................................................................................................................39 Appendix VI: Market Share Projections.....................................................................................................................................40 Appendix VII: Depreciation Schedule.........................................................................................................................................41 Appendix VIII: WACC Calculation................................................................................................................................................42 Appendix IX: Discounted Cash Flow Valuation.........................................................................................................................43 Appendix X: AMN Healthcare Comp Set....................................................................................................................................44 Appendix XI: Selected Competitor Ratio Comparisons...........................................................................................................45 Appendix XII: Selected Competitor Stock Performance..........................................................................................................46
  • 4.
    3 Executive Summary AMN Healthcareis a healthcare staffing and workplace solutions company that operates throughout the United States. The company primarily serves acute-care hospitals and is partnered with some of the largest and most prestigious hospitals in the country, such as Kaiser Foundation Hospitals, Johns Hopkins Health System, and Stanford Hospital and Clinics. AMN’s staffing services include travel nurses, locum tenens physicians, and other allied professionals, which includes non-physician health professionals such as chiropractors and dentists. In the workplace solutions segment of the business, AMN offers recruitment outsourcing, medical executive placement services, and various software products that optimize the staffing function. AMN’s most important non-staffing products are its managed services program (MSP) and vendor management software (VMS). MSP is a suite of workplace management services that allows AMN to coordinate all staffing and workforce needs of its clients using predictive analytics, allowing the clients to focus on caregiving. VMS is a SaaS-based program which allows clients to search for and place orders for staffers on an as-needed basis. MSP has been an especially important growth driver for the company, increasing from just 1% of company revenues in 2008 to 35% in 2015. These services are the most comprehensive in the industry, which we believe will assist the company as it seeks to gain market share. Hospitals will be able to replace their current disparate workforce services vendor in favor of AMN as a single point of contact. AMN derives a competitive advantage from its wide geographic network and high quality staffers. The company operates in all 50 states, allowing it to match the right staffers to the right hospitals no matter where they are located. AMN’s staffers are widely recognized as the best in the healthcare staffing industry, with the company winning several awards and getting recognized for staffer credentials, efficiency, and education. AMN grew very quickly over the last two years, fueled by a string of successful acquisitions. AMN management has shown great ability to find high-value acquisition targets and integrate them into a larger company effectively. As the healthcare staffing industry is highly fragmented and AMN still appears to have an appetite for acquisition, we believe that this bolt-on strategy could be a potential growth driver into the future and complement the firm’s healthy organic growth rates. These company characteristics combine with favorable trends in the healthcare industry to further the attractiveness of the company. The implementation of the Affordable Care Act and the subsequent increase in the number of individuals with health insurance has led to an increase in demand for healthcare services. This has driven an increase in demand for both healthcare staffers and workplace optimizing programs like AMN’s MSP. Due to these factors, we recommend a BUY on AMN Healthcare with a target price of $50.05. This represents an upside of 45% over the closing price on April 4, 2016.
  • 5.
    4 Company Overview AMN Healthcare(NYSE: AHS) began in 1985 as a travel nursing company, placing nurses nationwide in medical facilities experiencing staffing shortages. The company, now headquartered in San Diego, California, has grown to provide various healthcare workforce solutions and staffing services through twenty brand names. The company provides clients with access to the largest network of qualified clinicians in the country through temporary and permanent staffing, workforce optimization services, recruitment outsourcing and consulting, and vendor management systems (VMS), which allow clients to manage their staffing services independently. The company held its initial public offering in November 2001, where it raised $170 million. AMN Healthcare operates in all 50 states, with over half of its professional assignments at acute- care hospitals. The company’s clients include some of the largest healthcare companies in the nation, including Kaiser Foundation Hospitals, MedStar Health, NYU Medical Center, and Stanford Hospitals and Clinics. As of December 31, 2015, AMN Healthcare had 2,550 corporate employees and an average of 8,091 healthcare professionals on contract, not including locum tenens—short-term, temporary staffers—who are hired as independent contractors. HistoricalStockPerformance Figure 1: AHS Stock Chart since IPO
  • 6.
    5 AMN went publicin 2001 with an offering of 10,000,000 shares at a price of $17 per share. Since then, the stock price has experienced fluctuations driven, at least in part, by supply and demand trends for nurses and physicians. Following the IPO, the stock did well as the temporary healthcare staffing industry grew at a compounded annual growth rate of 21% from 2000 to 2002. The stock price declined steeply from $35 a share to $9 a share by first quarter of 2003 as demand for temporary healthcare professionals declined. During this period, hospitals increased nurse recruiting efforts and healthcare clients were less likely to leave their positions which decreased demand for AMN’s temporary healthcare professionals. The downward decline in demand and stock price continued through 2004. By 2004, demand began to increase each quarter and in 2005, AMN made an acquisition to extend its services to temporary and permanent physician staffing to cater to a growing physician shortage and take advantage of the immature temporary physician market. AMN’s stock price trend improved through 2006 as the industry experienced strong demand in the nursing staffing sector and the stock reached $28 per share. Demand continued to exceed supply through 2007, but with lower hospital admission levels and aggressive hiring of new graduates in key states such as California, AMN suffered again and the stock price fell to $5 per share in 2008. This stemmed from a disastrous combination of the demand issues as well as cost issues, Medicare reimbursement problems, and an overall slump in the economy. The stock remained around $7 per share until the end of 2012 when demand for the travel nurse business began to rebound. By 2013, demand improved substantially and AHS reaped the benefits of new service extension offerings it implemented in 2010, as well as more recurring revenue sources such as managed services programs and recruitment process outsourcing. The healthcare environment continued to pick up in 2014 and, by 2015, the stock price reached $34 a share with robust demand in service offerings and high level of demand in workforce solutions programs. Investment Thesis Our investment thesis for AMN is crafted around three main pillars: 1. AMN’s nationwide network of high-quality healthcare professionals creates a competitive advantage. 2. AMN has a strong management team which has correctly responded to the needs of the market to create a compelling product mix. 3. AMN’s Managed Service Program has created numerous cross-selling opportunities for the company as it builds strong relationships with clients. These thesis points will be explored throughout this report to illustrate the strength of AMN as an investment opportunity.
  • 7.
    6 Business Model CustomerValueProposition The numberone priority of healthcare industry personnel, both caregivers and executives, is the quality of patient care.1 A successful patient interaction begins with having caregivers available when they are needed. For a variety of reasons—mainly staff turnover, a long hiring process, and seasonal surges in demand—hospitals may not have the requisite number of nurses or physicians on staff to adequately handle the inflow of patients.2 In these situations, hospitals need extra healthcare professionals to step in to help. The temporary healthcare staffing industry exists to bridge this gap between supply and demand and prevent the quality of patient care from being compromised. Unfortunately, temporary staffing does not always meet this goal. The average U.S. hospital utilizes three different staffing services with three different points of contact, which means that coordination between the services is difficult and can lead to an improper scheduling of temporary staff.3 As a result, quality of care suffers. AMN Healthcare provides a comprehensive solution: quality temporary healthcare personnel provided in conjunction with a solution for staffing logistics. AMN makes it simple for hospitals to maintain a high quality of care by providing the highest quality medical professionals at any time. It is impossible for hospitals to fill these temporary positions themselves as they do not have the networks necessary to overcome the geographic inefficiencies of the healthcare labor market. Healthcare providers would have to rely on nearby members of the labor supply and hope that qualified staffers are available. Healthcare staffing companies have the distinct advantage of drawing from a nationwide pool of qualified staffers immediately using their networks. AMN has the largest geographic network in the industry with staffers in all 50 states. In addition to meeting the need for continuity of care, the temporary healthcare staffing industry assists healthcare providers in controlling costs. If temporary staffing were unavailable, hospitals, if demand is to be met, would be forced to hire permanent staff. The problem here is that demand for healthcare is variable due to seasonality, epidemics, and natural disasters, among other things. If hospitals maintained the staff necessary to meet these demand peaks at all times—not to mention specialists whose services are needed only occasionally—they would be forced to pay excess staff during the ebbs in the demand cycle. For this reason, hospitals do not mind paying a premium to an intermediary for temporary staffing because that premium is offset by the savings of not hiring excess permanent staff. The service provided is a form of risk pooling. Staffing agencies specialize in maintaining relationships with a large number of professionals with a variety of specialties which lowers their cost of finding a professional to fill a temporary vacancy. 1 KPMG U.S. Hospital NursingLabor Costs Study 2 KPMG U.S. Hospital NursingLabor Costs Study 3 AMN HealthcareQ4 2015 Earnings Call
  • 8.
    7 (Source: February 2016InvestorPresentation) Reportable Segments AMN reports its operations in three segments: nurse and allied solutions, locum tenens solutions, and other workforce solutions. The nurse and allied solutions segment provides nurses, therapists, radiology technicians and other non-physician medical staff to work temporary assignments in medical facilities and with healthcare providers nationwide. It also includes MSP services. In the fourth quarter of 2015, nurses and allied solutions accounted for 63% of AMN’s revenues, with nearly half of that total coming from MSP services. The locum tenens solutions segment specializes in placing “specialized and advanced practice” physicians, clinicians and dentists on temporary assignments with all types of healthcare providers nationwide. This segment accounted for 22% of AMN’s revenue during the most recent quarter. The other workforce solutions segment consists of healthcare executive search and advisory services, vendor management systems (VMS), recruitment process outsourcing (RPO), and workforce optimization services. This segment accounted for 15% of the firm’s revenues in the most recent quarter. It is difficult to determine the change in these segments’ performance and the resulting revenue mix due to a change in reporting segments in the first quarter of 2016. Products AMN’s offerings can be broken up into four main categories: staffing and recruitment, workforce solutions, executive leadership, and advisory services. AMN is able to offer an integrated product suite to its clients by providing a diverse range of nurse and physician staffing services as well as software offerings to manage staffing and other human resource functions.
  • 9.
    8 Staffing and Recruitment Withinstaffing and recruitment, AMN caters to acute-care hospitals, teaching institutions, trauma centers, and other healthcare facilities by providing staffing and recruitment of nurses, physicians, and allied health professionals. Nurse staffing encompasses travel staffing, rapid response staffing, and per diem staffing. Physicians are staffed on a locum tenens basis as well as permanent placement. Allied healthcare professionals such as physical therapists and pharmacists are staffed on a full spectrum of permanent placement, travel, temporary and local needs. Travel nurse staffing places nurses on temporary assignments that typically last 13 weeks. With a three to five week lead time, clients are able to fill vacancies with a cost effective and quick solution. AMN’s brands include American Mobile, Onward Healthcare, Nurses Rx, and O’Grady-Peyton, which focuses on recruiting nurses from other countries. The typical cost of an AMN travel nurse is an all-in (payroll, taxes, insurance, meals, housing, etc.) hourly rate of $58 to $64 as compared to a national average of $59.67 hourly rate for a full-time staff on a hospital staff. AMN also addresses shorter-term staffing needs. Rapid response nurse staffing, with a shorter lead time of one to two weeks, places nurses for shorter assignments that typically last four to eight weeks. NurseChoice is the brand that facilitates this service which commands a 4% premium over traditional travel nursing to compensate for its shorter lead times. Per diem, or local, staffing places locally-based healthcare professionals on a daily shift on an as- needed basis. Local staffing agencies can turnaround staffing requests in less than 24 hours. NurseFinders provides local staffing for nurses in 30 local areas. Local staffing can command substantial premiums above traditional travel nursing depending on the location, position, and other supply and demand factors. Staffing and Recruiment •Travel nursing •Local staffing •Locum tenens •Allied staffing •Physician placement •Rapid response and crisis staffing •Mid- to senior level leadership placement •EMR implementation •Labor disruption Workforce Solutions •Managed services programs (MSP) •Recruitment process outsorcing (RPO) •Vendor management systems (VMS) •Scheduling and labor management •Education services •Float pool management •Telehealth - Pharmacy Executive Leadership •Interim leadership •Executive search •Physician leadership search •Nurse leadership search •Executive coaching •Leadership training and development Advisory Services •Workforce analysis and optimization •Predictive modeling and analytics •Strategy consulting •Financial and operational performance improvement •Regulatory compliance
  • 10.
    9 AMN places physicianson a locum tenens and permanent staffing basis. Locum tenens staffing allows AMN to place independent contractor physicians on assignments that can last from a few days up to one year. Contracts are made through the AMN brands Staff Care, Linde Healthcare, and Locum Leaders. Permanent placement services to clients are done on a retained basis— meaning fees are paid upfront—via Merritt Hawkins and MilicanSolutions and a contingent basis—meaning fees are paid after placement—via Kendall & Davis. Additionally, AMN also provides allied health professionals staffing on a travel, local, and permanent basis. Through Med Travelers, Club Staffing, and Rx Pro Health, physical therapists, occupational therapists, pharmacists, and other allied professionals are matched with a client’s needs. Workforce Solutions Workforce Solutions encompasses various programs that allow clients to manage their staffing needs. The Managed Services Program (MSP) is a service that manages all of a client’s staffing needs by automatically assigning healthcare professionals from AMN to clients as the system’s predictive analytics software determines a need exists. AMN offers Vendor Management Systems (VMS) through its MSP as well as a vendor-neutral VMS that allows the client to manage the procurement on its own. ShiftWise and Medefis are the two technologies that are offered to control personnel tasks on a single system and consolidate reporting. AMN earns a 3- 4% fee, calculated from the total spent on staffing, from these programs. Recruitment Process Outsourcing (RPO) replaces a client’s internal recruiting. Under an RPO contract, AMN facilitates the entire recruiting and onboarding process for all temporary and permanent staff of the client. Executive Leadership AMN also provides medical executive placement services. Through its recent acquisitions of B.E. Smith and TFS, AMN can provide executive and clinical leadership interim staffing and headhunting services for permanent placement of senior healthcare executives, physician executives, and chief nursing officers. This allows for improved relationships with clients since AMN employees will be decision makers, allowing for opportunities to cross-sell products such as the workforce solutions and staffing and recruitment services outlined above. Advisory Services The advisory services segment provides workforce optimization software such as Smart Square and Avantas. These scheduling software and predictive analytics programs create staffing plans for a client which reduces a client’s overall clinical labor expenditures. RevenueModel AMN’s staffing and recruitment services primarily generate revenue on a per traveler per day basis. The company bills the client for the number of hours its assigned staffers work at a client’s
  • 11.
    10 facility each day.AMN generates profit though the difference in the amount it bills the client for its services and the amount it pays out in salary to that staffer. Additionally, through workforce solutions and advisory services, the company provides SaaS- based solutions which allows healthcare providers to manage their own temporary workforce. Called a Vendor Management System (VMS), revenue from this system is collected each time the client uses the system to book its own clinician. AMN collects a 3-4% fee on each filled posting. The Managed Service Program (MSP) is a comprehensive suite of products and services that allow a healthcare provider to completely outsource the management and analysis of its temporary workforce to AMN. While billing under the MSP is still primarily based upon a per traveler per day basis, these MSP contracts are generally exclusive contracts that last for three or more years. CostModel AMN does not disclose its cost structure in detail for any of its segments. It is clear, however, that the main expense for the company is staffer compensation. This is mainly wage expenses, but there are a few other components, depending on the type of staffer. Those who are not independent contractors—essentially any non-locum tenens staffer—receive benefits. In addition, traveling nurses receive housing paid for by AMN. The staffing segments average a gross margin of just over 30%. The non-staffing segments are much less cost-intensive. In these segments, the primary cost is sales expenditures. Beyond mentioning a sales team and an in-house research and development team for its software products, AMN does not disclose what other expenses may be included in this segment’s cost structure. We do, however, believe that these services have higher margins. This is reaffirmed by management’s guidance that the company’s overall gross margin will grow to 33% as this segment becomes a greater portion of the company’s business. MarketSegment AMN serves a diverse national client base of healthcare systems of all disciplines. Half of its temporary healthcare professional assignments are for acute-care hospitals. Beyond this, the company services sub-acute healthcare facilities, physician groups, rehab centers, pharmacies, and surgery centers. Some of the largest and most prestigious healthcare systems in the United States employ AMN services, including Kaiser Foundation Hospitals (which makes up 11% of AHS’s 2015 consolidated revenue), New York Presbyterian Health System, NYU Medical Center, Stanford Hospitals and Clinics, and Johns Hopkins Health System. Relationships with these clients continue to strengthen as AMN successfully integrates its new software offerings to add further value to the partnerships.
  • 12.
    11 CompetitiveStrategy AMN works tobuild lasting relationships by supplying what healthcare providers want most: quality healthcare professionals as staffers. Through its permanent placement and headhunting services, AMN also aims to cross-sell those same clients on other workforce management services. This is distinctive within the industry as there are few companies that function in both the staffing and workforce management segments. AMN’s comprehensive approach gives the company a competitive advantage. AMN is well-known within the industry for its quality staffers and is one of the few companies in the healthcare staffing industry to be certified by the National Committee for Quality Assurance, a non-profit group that evaluates and ranks healthcare facilities and suppliers based on numerous quality metrics.4 AMN’s nurses are more educated than the general nurse population, with 50% of AMN nurses holding a bachelor’s degree in nursing compared to just 34% for nurses at large.5 Additionally, AMN is the only medical staffing company with its own competency testing procedures for its staffers.6 70% of AMN’s traveling staffers have been specially requested to return to facilities to which they were previously assigned.7 AMN can, and has, leveraged its strong network of staffers to gain a competitive advantage. The geographic reach of this staff network across all 50 states greatly enhances this advantage. Other healthcare staffing companies simply cannot match the quality nor the reach. AMN’s cross-selling strategy has shown great potential for building lasting relationships with its clients. The average AMN client purchases four different services from the company, entrenching the company within its clients’ operations.8 This integration assists clients by creating specialized product suites that meets their needs while also increasing switching costs since more operations are tied to AMN’s products, thus making switching more disruptive. 4 National Committee for Quality Assurance 5 AMN Corporate Website 6 Ibid. 7 Ibid. 8 AMN Healthcare2015 Annual Report
  • 13.
    12 Industry and CompetitivePositioning Industry Outlook The healthcare staffing industry is expected to grow through the end of the decade, with a CAGR of 4.2% through 2020. This is down slightly from the 5.4% growth CAGR between 2010 and 2015.9 Based on these projections, the healthcare staffing market should reach $18.3 billion by 2020, up from $14.9 billion today.10 Firms with service offerings beyond simple staffing, like AMN, have grown more quickly than industry average in the last five years and are expected to continue to do so throughout the decade. MajorIndustryPlayers CHG Healthcare Services is the second largest healthcare staffing agency in the United States, with a market share of 6.0%. CHG is the leading supplier of locum tenens and also provides temporary and permanent placement services in Utah, Connecticut, Florida and Michigan. CHG provides these services through the CompHealth, Weatherby Healthcare, and RNnetwork brands. Since its recent acquisition of Foundation Medical Staffing, CHG also offers temporary and permanent dialysis staffing services nationwide.11 Cross Country Healthcare is a leading healthcare staffing agency for acute care, with an overall market share of 4.4%. As of December 31, 2015, Cross Country has more than 70 local office and 7 operation centers in Florida, California, Georgia and Missouri. These national and local resources allow the company to offer alternative solutions including outpatient and ambulatory care centers. The company offers temporary and permanent placements, managed service programs, and other services including education, retained search, and contingent search. Cross Country has more than 6,000 nurses and allied professionals and 1,500 independent physician contractors.12 RightSourcing, a privately held company, specializes in vendor management services. The company only offers two different products: managed services and locum tenens managed services. The managed services segment connects clients with temporary nursing and allied staffing agency services, while the locum tenens 9 IBISWorld Industry Report: US HealthcareStaff Recruitment Agencies 10 Ibid. 11 CHG Healthcare2015 Annual Report 12 Cross Country 2015 Annual Report
  • 14.
    13 18% 11.9% 0% 5% 10% 15% 20% 2013 2015 % ofUninsured Americans Since Affordable Care Act Implementation managed services helps clients coordinate with locum tenens providers.13 Jackson Healthcare is a privately held medical staffing company with more than 1,800 facilities in the United States. Jackson Healthcare offers various staffing services in the traveling, locum tenens, and permanent placement segments. Its subsidiary, Jackson Surgical Assistants, is the first nationwide staffing company exclusively focused on the surgical assistant professions. In addition, Jackson Healthcare also provides advisory, management service provider and education services.14 Industry Trends Supply Shortages Throughout the United States, there is a shortage of healthcare practitioners. A region is designated a Health Professional Shortage Area (HPSA) by the federal government when it does not meet a minimum level of one practitioner per 3,500 residents (or one per 3,000 residents in particularly high-need areas). Nationally, an average of 60% of needs are met with only one state, Delaware, reaching over 80%.15 California, New York, and Texas average only 45% of need met and need the second-, third-, and fourth-most professionals, respectively, to shed their HPSA designations.16 This makes sense given that they are three of the most populous states in the nation. Future staffing demand will likely be centered in these states. AMN has a presence in each of these states and is positioned to capitalize on the extreme need for nurses as it can relocate nurses from less needy areas to these severe HPSAs. Increased Healthcare Utilization While the number of active physicians is expected to fall dramatically, the number of individuals regularly using healthcare services has risen considerably over the past two years as a result of changes in healthcare policy. For example, since the implementation of the Affordable Care Act, the number of uninsured Americans fell from 18 percent in 2013 to 11.9 percent in 2015. As healthcare is made more affordable, millions who previously did not regularly visit hospitals, doctor offices or nursing facilities will start to utilize these services more frequently, stretching the limited 13 RightSourcingCompany Website 14 Jackson HealthcareCompany Website 15 Kaiser Family Foundation 16 Ibid.
  • 15.
    14 supply of healthcareproviders. Furthermore, longer lifespans and an aging “baby boomer” generation are expected to double the number of individuals in the US ages 65 or older within the next 25 years.17 More than two- thirds of these individuals have multiple chronic conditions and treating these conditions accounts for roughly 66 percent of healthcare spending in the US.18 This means that not only are more individuals likely to regularly use the healthcare system in the next decade, but older, more expensive patients are due to come into the system as well. From a physician and nursing perspective, this means more patients that require more care. From an industry perspective, this means fewer professionals relative to demand. Since demand for healthcare services is relatively inelastic, healthcare staffing companies should be able to pass on increases in labor costs arising from high demand and low supply to their clients. AMN will be able to capitalize in the form of higher revenues. Industry CompetitiveStructure The medical staffing industry is highly fragmented, with an industry C4 of 21.6% and an HHI score of just 126.74. Some rivalry exists, but competitors do not typically compete on pricing. Instead, companies compete by leveraging quality and geography and by using MSP contracts to create exclusivity and increase switching costs in an otherwise non-exclusive contract market. Threat of New Entrants and Substitutes The threat of new entrants in the industry is fairly low. While capital requirements would not be intense, the threat is diminished by the need for a strong network of both associated professionals and clients. It would be difficult for a new entrant to attract a critical mass of professionals given the already stretched labor market. It would also be difficult for a new firm with little reputational sway to convince clients to switch to its service. The market is characterized by a focus on quality, so a strong brand is essential. The threat of substitutes is marginal. The only real substitute is hiring a full-time medical professional, which is not feasible for many of the purposes of temporary staffing, namely filling vacancies during variable periods of high demand. It takes an average of 82 days to fill a permanent nursing position, and clients of temporary staffing agencies cannot wait that long when demand exists in the short-term.19 Threat of Suppliers The supplier of the healthcare staffing industry is the labor market of medical professionals. In terms of leverage by the professionals, the threat is relatively low since many are independent contractors with little leverage. The greater threat is that there simply are not enough individuals to fill demand, as outlined previously. 17 Centers for DiseaseControl and Prevention, 2013 18 Ibid. 19 KPMG U.S. Hospital NursingLabor Costs Study
  • 16.
    15 ComparableRatios Return on Assets Returnon Assets 2013 2014 2015 AMN Healthcare 7.3% 6.4% 10.7% Cross Country 0.0% 1.8% 4.9% On Assignment 6.1% 7.1% 6.9% AMN significantly outperforms its industry peers in terms of return on assets. This is a testament to management’s ability to run the company efficiently. AMN generates much more income from its assets than its competitors, more than doubling what we view as its most similar competitor, Cross Country Healthcare. Current Ratio Current Ratio 2013 2014 2015 AMN Healthcare 1.6x 1.6x 1.5x Cross Country 1.9x 2.0x 1.8x On Assignment 2.1x 2.2x 2.6x AMN is healthy in terms of liquidity, maintaining a current ratio well above one over the past three years. While it is outpaced by its peers, we do not believe this is a reason to be concerned about AMN’s liquidity. The lower liquidity can be explained by the amount of debt required for AMN’s recent acquisitions. As long as AMN maintains enough liquid assets to keep this ratio above one, liquidity worries are minor. Total Liabilities to Total Assets Total Liabilities/Total Assets 2013 2014 2015 AMN Healthcare 64.0% 62.3% 60.5% Cross Country 35.3% 59.9% 61.4% On Assignment 49.1% 49.3% 55.6% Historically, AMN has a much higher level of total liabilities to total assets than its competitors. This is not surprising when considering the company’s acquisitiveness, which is financed in large part through debt. In recent years, however, AMN’s competitors have also begun to take on debt. This has created an upward movement in competitors’ leverage ratios while AMN’s has slowly declined. This trend of declining company leverage combined with increasing competitor leverage has evened the playing field, bringing the industry together at an approximately 60% leverage level.
  • 17.
    16 Executive Managementand CorporateGovernance ManagementTeam Susan Salka Titles: Chief Executive Officer and President Susan Salka began at AMN in 1990. She started in an entry-level position and worked her way up through such positions as Vice President of Business Development, Chief Operating Officer, Secretary, and Executive Vice President. She became the President and CEO in May 2005. She was recently named the 2016 Most Admired CEO by the San Diego Business Journal. Here is a quotation from the article about her win that shows her character: “It is quite an honor to for me to receive this award, but it's really a reflection of our entire team and a testament to the fantastic talent and passion they bring to our clients every day," Salka said. "We've had a truly incredible year, and I've never been so proud of our company as I am today. But just wait -- our future is even brighter."20 Brian Scott Titles: Chief Financial Officer, Chief Accounting Officer, and Treasurer Brian Scott started at AMN in 2003. He ascended to his current position as CFO, CAO, and Treasurer in January 2011. He previously served as AMN’s Vice President of Finance. Before joining the firm, Scott previously worked as a controller at a small biotech firm and in accounting with KPMG. Jeanette Sanchez Title: Chief Information Officer Jeanette Sanchez joined AMN as Senior Vice President of IT in 2013. She was subsequently promoted to her current position, CIO, in July 2014. Prior to her time at AMN, Sanchez worked at several other healthcare-related firms. Ralph Henderson Title: President of Healthcare Staffing Ralph Henderson joined AMN in 2007 and ascended to his current position in February 2012. Prior to joining AMN, he worked for Spherion, a premier staffing company. Henderson is a 20 PR News
  • 18.
    17 three-time HRO TodaySuperstar and also a three-time honoree of the Staffing Industry Analysts’ (SIA) Staffing 100 list of industry leaders. Marcia Faller Titles: Chief Clinical Officer and Senior Vice President, Operations Marcia Faller began with AMN in 1989. She is widely credited with implementing rigorous screening and quality control processes for AMN’s associated healthcare professionals. Dr. Faller is also a faculty member at the University of San Diego. Management Performance AMN’s management team has performed admirably over the past several years. The company has exceeded analysts’ earnings estimates for 19 of the previous 20 quarters.21 Management has also met several key goals, such as expanding the company’s MSP spend, during its tenure as well.22 Finally, management has made acquisitions that not only grow the company, but do so intelligently. Overall, this is an effective management team that is well-equipped to continue leading the company. Insider Stock Holdings Top Insider Holders Insider % Shares Outstanding Susan Salka 0.79 Jeffrey Harris 0.14 Brian Scott 0.14 Paul Weaver 0.13 Ralph Henderson 0.11 AMN insiders hold a fairly small amount of the company’s stock, owning approximately 1.6% of the company’s equity. CEO Susan Salka is by far the largest insider holder of AMN stock at 0.79% of shares outstanding. While it would be encouraging to see management hold a greater share of the firm’s equity, AMN management has tended to hold only a small position. No major buys or sells have occurred in the recent past, giving no indication of management’s views on the company’s future performance. 21 Bloomberg 22 AMN Healthcare2015 Annual Report
  • 19.
    18 Board of Directors DouglasWheat Chairman of the Board Douglas Wheat has been AMN’s board chairman since 1999. He serves on the executive committee. Wheat is experienced in healthcare staffing industry mergers and acquisitions as well as corporate finance. He also serves on the boards of several other companies, including Challenger Capital Group and Dex Media. Susan Salka Susan Salka has been a director since 2003. She serves on the executive committee. Salka held numerous executive positions in the company prior to joining the board and, as outlined previously, is currently the CEO. Andrew Stern Andrew Stern has served as a director since 2001. He is on the audit and corporate governance committees. Stern is currently the CEO of Sunwest Communications Inc. He is also a director on two other companies’ boards. R. Jeffrey Harris R. Jeffrey Harris has been a member of the AMN board since 2005. He is on the compensation and corporate governance committees. He has experience with mergers and acquisitions and has served on the board for several other healthcare and biotechnology companies. Paul Weaver Paul Weaver joined AMN’s board in 2006. He is the chair of the audit committee and is also on the executive committee. He has extensive international audit and finance experience. Weaver concurrently serves on the boards of several other companies and is the former vice chairman of PwC. Dr. Michael M.E. Johns Michael Johns has been a director since 2008. He is the chair for the corporate governance committee and is also on the compensation committee. He has extensive experience in the healthcare industry. He is a professor at the School of Medicine at Emory University and is also a member of the National Academy of Medicine of the National Academy of Science. Additionally, Johns serves on the boards of several other companies. He previously served as the Dean of the Johns Hopkins School of Medicine and Vice President of Medical Faculty at Johns Hopkins University.
  • 20.
    19 Martha H. Marsh MarthaMarsh became a member of the AMN board in 2010. She is the chair of the compensation committee and is also on the corporate governance committee. She has served on the boards of numerous healthcare companies. Marsh was the CEO of Stanford Hospital and Clinics for 8 years and, prior to that, she was the CEO of UC Davis Health Systems for three years. Mark G. Foletta Mark Foletta joined the board in 2012. He is on the audit committee. He has significant audit, financial, and healthcare experience. He was previously the CFO of Biocept, Inc. and Senior VP of Finance and CFO of Amylin Pharmaceuticals, Inc. He has served on the boards of numerous healthcare companies. He is a CPA (inactive license). Overall, the board of directors is very independent and experience. Below is a chart showing the committees and who is on each committee. Members Audit Committee Compensation Committee Corporate Governance Committee Executive Committee Douglas Wheat X (Chair) Susan Salka X Andrew Stern X X R. Jeffrey Harris X X Paul Weaver X (Chair) X Dr. Michael Johns X X (Chair) Martha Marsh X (Chair) X Mark Foletta X ISS Governance Quickscore AMN Healthcare Services has an ISS Quickscore of 1, on a ten-point scale where 1 is the best score. Of the component pieces, AMN scores a 2 on Board Structure, 1 on Shareholder Rights, 1 on Compensation, and a 1 on Audit & Risk Oversight. This speaks to the company’s exceptional corporate governance.
  • 21.
    20 General Employees As ofDecember 31, 2015, AMN had 10,639 employees, split between 2,550 corporate employees and an average of 8,091 contracted practitioners. This does not include the large network of locum tenens physicians that AMN maintains as independent contractors. There are no unionized employees. EmployeeValueProposition Competitive Pay AMN compensates its temporary staffers very fairly in terms of industry norms. While traveling staff are often paid slightly less than their permanently employed counterparts, the pay ends up being equivalent or better in most cases because AMN also pays for staffers’ housing while they are on-assignment. Placement in Top Facilities As a leader in the industry, AMN works with some of the top medical systems in the country, such as the Johns Hopkins Health System and Stanford Hospitals and Clinics. This means that AMN staffers are placed at these prestigious facilities, allowing the staffers to get a valuable, internship-like experience. In some cases, an AMN assignment is the catalyst for an offer for a permanent position. Flexibility Flexibility is a key consideration for traveling temporary staffers. Staffers are able to travel the country very easily thanks to AMN’s wide geographic network. This is a helpful recruiting tool as 38% of travel nurses say that traveling to many different places is their number one reason for being a temporary staffer. Besides geographic flexibility, AMN also provides great flexibility in terms of employee schedules. Unassigned staffers may sign up for a new assignment at any time, with an assignment length of just a few weeks up to a year. This allows employees to work on- and-off and customize their schedules without necessarily locking themselves in for significant periods of time. EmployeeSatisfaction AMN earned a rating of 3.1 stars—on a five-star scale—on Glassdoor from 209 employee reviews. The lowest ratings seem to come from traveling nurses. 84% approve of CEO and 51% would recommend the company to a friend. The traveling nurses complained of being
  • 22.
    21 overworked and underpaid.23Despite this, AMN does outscore Cross Country Healthcare. Cross Country’s rating is only 2.7 stars with 53% CEO approval and a 37% recommendation level.24 On Indeed.com, AMN has a higher rating of 3.6 stars. This site’s rating is broken up into several categories, also on a five-star scale. Employees rated work/life balance at 3.7 stars, compensation and benefits at 3.3 stars, and job security and advancement at 3.0 stars. In terms of more subjective issues, management earns 3.0 stars and the company culture earns 3.7 stars.25 The reviews on Indeed are much more positive than on Glassdoor. The sample size, however, is smaller, with only 93 employee reviews. Cross Country has not been reviewed on this site, so comparison is not possible. LicensingRequirements Since a great deal of AMN’s nurses and physicians travel from hospital to hospital, it is possible that they will be asked to travel over state lines. This does, however, present some problems as different states have different licensing requirements for medical professionals before they may practice medicine. Thanks to coordination between the states, nurses may practice across state lines relatively easily. Every state has “nursing license reciprocity,” which allows registered nurses to apply for licenses in other states without repeating qualifying examinations.26 Typically, nurses will simply complete a background check and submit fingerprints to the non-home state to receive a license. These licenses are valid for 90 days.27 In addition, 25 states, which are displayed in the above map, are party to the Nursing Licensure Compact (NLC), which allows RNs and some 23 Glassdoor 24 Ibid 25 Indeed.com 26 RNLicensing.org 27 Ibid.
  • 23.
    22 specialized nurses whoare licensed in one of the member states to practice in any of the other 24 with no additional requirements.28 Unfortunately, two of AMN’s largest markets, California and New York, have not yet joined the NLC. Physicians face a more difficult path to practicing in states other than the one in which they were originally licensed. The process is time-consuming as physicians may have to take additional exams in addition to the incidental processes that nurses must go through. An expedited process has been created through the Interstate Medical Licensure Compact (IMLC), but it is not yet in effect. Once the IMLC is implemented, physicians will be able to apply for medical licenses in other IMLC states without taking additional exams.29 There are currently 12 member states of the IMLC and 12 more states with membership legislation pending, as seen in the above map.30 28 National Council of State Boards of Nursing 29 LicensePortability.org 30 Ibid.
  • 24.
    23 FinancialAnalysis IncomeStatement After experiencing a modest 3.35% CAGRin revenue from 2012 through 2014, AMN Healthcare’s revenue increased 41.2% in 2015. This is the company’s highest year-over- year revenue growth since 2011 when it experienced 32.5% growth. The company’s revenue growth in 2015 marks an industry-leading performance. The company’s EBITDA was also up 81% in 2014 to an 11.3% margin, which beat management’s expectations by 1.3%. Revenue was driven up by 26% organic growth and 74% from acquisitions. The company successfully amassed benefits from its acquisitions, as it has expanded and deepened the extent of its operations while also improving margins. Revenue for the company’s largest segment, nurse and allied staffing, increased at 47.3% during 2015, over half of which was a result of organic revenue growth as the company continued to add supply to the travel market and increase staff placement levels. 39% of the revenue growth was attributable to the acquisitions of Onward Healthcare, First String Healthcare, and Avantas. Locum tenens staffing and physician permanent placement services experienced 30% and 21% revenue growth, respectively, in 2015, driven by increased demand for business through MSP contracts and record-high physician search and placement levels. 37% of the increase in revenue for the locum tenens staffing segment is traced to the Onward Healthcare acquisition. After studying AMN’s past income statements, it is apparent that the company is trending in a positive direction. The company has increased its gross margin every year since 2010, moving from 27.1% in 2010 to 32.1%. This is attributable to both AMN’s relentless pursuit of efficiencies in the staffing sector and the acquisition of higher-margin business intelligence and SaaS companies like Medefis. Thanks to tight control over expenses, which have been stagnant over the period, AMN has also increased its net margin consistently, from -7.8% in 2010 to 5.6%. AMN has fared better in terms of income items than two of its closest public competitors, Cross Country and On Assignment. Both companies reported deteriorating net margins over the same
  • 25.
    24 period, with CrossCountry moving from 28.1% to 25.8% and On Assignment decreasing slightly from 34.1% to 32.9%. This shows that AMN has been more effective than its competitors at gaining efficiencies in the marketplace, which is even more impressive considering how many acquisitions AMN has made over the period. The company has done well to integrate these new businesses while also increasing its margins. AMN also compares favorably to its competitors in terms of net income margin and growth. Cross Country’s 2015 net margin was only 0.6% and it has fluctuated wildly over the past five years, sinking deeply into negative territory for three years, including a low of -12.4% in 2013. On Assignment performed better, but did not exhibit growth. The firm’s net margin fluctuated in a band of about 90 basis points, but ended the period exactly where it started at 4.7%. It appears that these firms were unable to cut costs to cope with their decreasing gross margins, especially in Cross Country’s case. Cash Flow Net cash provided by operating activities increased substantially from $27.7 million in 2014 to $56.3 million in 2015. This stems from the company’s solid organic and inorganic revenue growth and an increase in accounts payable and accrued expenses. AMN notes that an increase in accounts receivable slightly offset these increases. This increase was attributed to slower payments by a few large customers, MSP clients adjusting to new software, and extended billing processes for clients utilizing third-party VMS technology. AMN experienced a large increase in cash used by investing activities. Capital expenditures to foster organic growth and cash used for acquisitions increased cash used for investing to $116.1 million in 2015 from $28.2 million in 2014. Capital expenditures were $27 million and $19.1 million for those years, respectively, to support business growth and improve front and back office technology. The company utilized cash of $77.5 million, $4.5 million, and $3.1 million to acquire Onward Healthcare (including Locum Leaders and Medefis), the First String Healthcare, and Millican Solutions in 2015. Cash flows of $56.2 million were provided by financing activities in 2015, driven by an increase in borrowing from the company’s revolver and reduced by payments to its term loan. Overall, the company has lost cash the last two years. This is reasonable, because of the company’s aggressive acquisition strategy. Regardless, AMN still maintained growth in operational cash flow.
  • 26.
    25 Organic Growth Strategy AMNHealthcare aims to strengthen its business by reducing staffing complexity, increasing efficiency, and enhancing the patient experience. In 2015, the Company experienced organic revenue growth of 26% compared to 2014. Revenue growth was driven by double digit growth in each of the company’s business divisions. The demand for temporary healthcare professionals increased significantly in 2015, resulting in larger billing rates for the Company to attract a sufficient supply of healthcare professionals to meet the demand, contributing to the increase in organic revenue. FurtherDevelop Processesto AchieveMarket-leading Efficiency The company plans to continue developing its systems to achieve market leading efficiency and scalability beyond temporary staffing services. AMN believes by expanding its core capabilities and complementary offerings (MSP, RPO, VMS, etc.), this will provide additional leverage for clients to use its services instead of its competitors31. For 2016, the company is implementing its interim leadership and executive search and crisis/labor disruption staffing offerings. Continueto Investin Infrastructure AMN Healthcare intends to continue investing in recruiting technology and infrastructure to access and utilize effectively its network of qualified healthcare professionals. By increasing efficiency in recruiting, the company can capitalize on the demand growth currently being experienced. The company anticipates demand to rise due to the combined effects of the aging population, healthcare reform, and the labor shortages within its operating regions. AMN recently began a multi-year investment in strengthening its infrastructure domains32. The company plans to launch more subsidiary domains that provide information resources and online job network platforms. 31 AMN Healthcare2015 Annual Report 32 Ibid.
  • 27.
    26 The needs ofclients Alignment with core expertise of recruitment, credentialing, and access to healthcare professionals Strenghtheningand broadening of client relationships Reduction in exposure to economic cycles Enhancement of long- term sustainable business model Return on invested capital AcquisitiveGrowth Strategy With increasing demand for healthcare services, a growing physician shortage, increasing adoption of workforce services, and an aging population, AMN Healthcare’s growth strategy aims to access these lucrative market drivers. The company strives to drive organic and inorganic growth through broadening its offerings and investing. The firm has complimented its flagship nursing staffing services with innovative workforce solutions such as RPO, VMS, and MSP workforce optimization services. Through the diversification of offerings, the company operates at higher margins, expands its relationships with clients, creates new recurring revenue sources, and solidifies its position as a market-leading innovator. AMN Healthcare’s 35.1% 3-year EBITDA CAGR is a remarkable product of the firm’s growth strategy. When considering an investment or acquisition in a new service or product line, AMN Healthcare considers the following factors33: 33 AMN Healthcare2015 Annual Report
  • 28.
    27 Acquisitions AMN Healthcare’s growthstrategy in the recent past and near future is largely driven by successful acquisitions, which increase industry leading market share for the firm and diversify the portfolio of the business. AMN has an excellent track record of integrating acquisitions into the company. Since going public in 2002, the company has acquired 12 firms, and all but one have been successfully integrated. Below is a summary of acquisitions since 2013. AMN Healthcare, Acquisitions 2013-2016 Company Date Announced Price/Funding Business Description B.E. Smith January 2016 $160 million, funded with term-loan and credit facility revolver Interim leadership, advisory, and executive search firm, serving healthcare industry for over 25 years. B.E. Smith has recently placed over 1,000 healthcare executives. MillicanSolutions October 2015 $4 million, funded with cash Founded in 2001, the company provides physical and executive leadership search advisory for academic medical centers across the nation. Only firm in industry focused exclusively on initiatives for children’s hospitals The First String Healthcare September 2015 $6.5 million and additional $4.0 million (through 2017) based on future performance, funded with cash Founded in 2002, the company has served over 250 hospitals with a personalized approach to interim staffing, permanent placement, and leadership development for nurse leaders and executives. Onward Healthcare, Locum Leaders, Medefis December 2014 $82.5 million, funded with cash and credit facility revolver OGH, LLC owned Onward Healthcare (leading nurse and allied healthcare staffing), Locum Leaders (one of the fastest growing locum tenens firms, specializing in placing physicians), and Medefis (leading provider of SaaS- based vendor management services (VMS) for healthcare facilities). Avantas December 2014 $16.5 million and additional $8.5 million based on future operating performance, funded with cash and credit facility revolver Founded in 2002, company provides clinical labor management services, such as predictive modeling, SaaS-based scheduling, data analytics, and workforce consulting. Avantas received the highest rating for a staff scheduling company in its category by research firm KLAS. ShiftWise November 2013 $39.5 million, funded with cash and credit facility revolver Founded in 2003, the company provides SaaS for the management of temporary and permanent contract labor for healthcare facilities, which includes vendor management services (VMS). ShiftWise contracts with 1,800 facilities for web-based applications and professional services.
  • 29.
    28 The firm’s Nurseand Allied Solutions and Local Tenens Solutions have seen positive effects from acquisitions. The Nurse and Allied Solutions segment experienced 47% revenue growth from 2014 to 2015. 39% of this growth is attributable to the Onward Healthcare, First String Healthcare, and Avantas. $128.1 million in additional revenue was received from these firms. Considering the company only paid cash of $96.5 million to acquire these companies, it is clear that AMN Healthcare’s acquisitions are immediately accretive to the company’s growth. The acquisition of Onward Healthcare also attributed $32.9 million in additional revenue to the Locum Tenens Staffing segment, which accounts for 37% of the 30% increase in revenue for the division from 2014-2015. Gross margin also received a bump from 30.5% to 32.1%, which was propelled the higher margin of SaaS-companies Medefis and Avantas. The 2011 Pacific Crest Private SaaS Company survey details that private SaaS generally maintain a gross margin around 70%. Hence, as the company looks to continue to expand its offerings though innovative workforce solutions and optimization services in the SaaS sphere, AMN Healthcare’s gross margin should continue to rise.
  • 30.
    29 Valuation ValuationMethods We determined ourtarget price using two valuation methods: a hybrid discounted cash flow analysis and a peer group multiple analysis, which itself involved two different methods. These valuation methods provided target prices based on expected future cash flows and multiples derived from operating results over a one-year time horizon. Finally, the resulting price targets were weighted to give what we feel is a conservative, yet reliable, price target. Hybrid DCF The hybrid DCF analysis incorporates both the perpetual growth rate method and the exit multiple method, weighted equally to arrive at a target price. Both methods use the free cash flows from the projected financial statements, which can be found in the appendices. The perpetual growth rate method grows 2020 cash flows in perpetuity using the company’s WACC less the discount rate, 8.2% and 2.0%, respectively, for a final discounting rate of 6.2%. This resulted in a terminal value of $3.78 billion. To contrast, the exit multiple method uses a mean enterprise value to EBITDA multiple of the comp set in conjunction with the 2020 EBITDA to determine a terminal value of $3.48 billion. These terminal value figures were averaged, discounted back to 2016 levels, and added to the 2016 present value of all free cash flows over the period to determine an enterprise value of $3.01 billion. The enterprise value is then stripped of cash and debt is added back to determine the implied market value of AMN’s equity, divided by the expected diluted number of shares outstanding, 48.8 million, resulting in a target price of $55.86. Peer GroupMultipleAnalysis For the purposes of this multiples analysis, we used enterprise value to EBITDA and forward price to earnings ratios to estimate the company’s value. We compared AMN Healthcare’s current trading multiples to those of its publicly traded peers in the healthcare and general staffing industries, including Cross Country Healthcare, Team Health Holdings, On Assignment, Inc., Robert Half International, and ManpowerGroup. As a secondary benchmark, we also compared the current average trading multiples for the comp set to AMN Healthcare’s own 3-year historical trading multiples. This revealed that the average forward price to earnings multiple for the comp set was significantly below AMN’s own historical average. We therefore calculated a new average forward price to earnings multiple which factored in
  • 31.
    30 Valuation Summary Value Weight DCF55.86$ 33.33% 18.62$ EV/EBITDA 47.13$ 33.33% 15.71$ Forward P/E 47.16$ 33.33% 15.72$ Average 50.05$ 100% 50.05$ Weighted Average Target Price 50.05$ Current Share Price 34.51$ Potential Upside/Downside 45.02% the higher historical figure as well. In the enterprise value to EBITDA case, we use the company’s projected 2017 EBITDA and the multiple to come to an implied value of equity, then divide by the number of shares outstanding. In the forward price to earnings case, we use our projected 2017 earnings per share and multiply by the adjusted average forward price to earnings multiple to determine a price. The enterprise value to EBITDA and forward price to earnings multiples resulted in price targets of $47.13 and $47.16, respectively. ValuationSummary We combined all of the valuation methods in an equally weighted average. This resulted in a final target price of $50.05. This represents an implied upside of just over 45% over the closing price on April 4, 2016. SensitivityAnalysis To account for potential risks to our valuation, a sensitivity analysis was conducted. We valued the company under several different scenarios that could materially affect the company’s value, particularly the possibility of an economic downturn in the coming 18 months or an accretive acquisition. EconomicDownturn To account for potential economic turbulence, we analyze mild, medium, and severe downturns. To determine how these situations could play out, we looked to the past to see the dips in revenue and the subsequent recovery patterns for AMN after a downturn. The severity was changed by adjusting the initial drop in revenues and the speed at which revenues recover. The effect on AMN’s value in these scenarios is summarized in the table below. The downside is much less than AMN’s actual loss during the previous economic downturn. This is because we believe the diversification to MSP and other workforce solutions will insulate the business somewhat from the certain decline in temporary hiring in a downturn. Economic Downturn and AMN Target Price Degree of Downturn Downside from Current Price Mild -9.4% Medium -13.3% Severe -17.0% Acquisition While we cannot predict an acquisition with certainty, we believe that it is highly probable that AMN will make at least one acquisition within our investment horizon. To account for this potential for extra upside, varying sizes of acquisitions were added to our model to determine the effect on AMN’s value. We used three scenarios: a small acquisition of $50 million, a medium
  • 32.
    31 acquisition of $100million, and an aggressive acquisition of $200 million. The accretive effects of these acquisitions on revenue was determined by using the average multiple of revenues to purchase price for AMN acquisitions over the past two years. The results are summarized in the table below. The results show a significant increase in upside for the investment compared to our base case, which did not include inorganic growth in the interest of conservatism. Acquisitions and AMN Target Price Size of Acquisition Upside from Current Price Small 50.3% Medium 52.6% Large 54.4%
  • 33.
    32 Risks Firm-Specific Risks Contracts AMN’s serviceofferings are typically sold to its clients via contracted sales agreements. While this does lock clients in for a period of time, concerns arise with the terms of these contracts. For certain services, such as travel nursing, clients are free to utilize other staffing agencies concurrently, even if AMN could potentially meet their needs individually (MSP offerings are exclusive contracts which typically last three years). This risk, however, is not cause for alarm. There is nothing to suggest that clients have regularly shifted to competitors to fill capacity when AMN has available practitioners and many of AMN’s largest clients, such as Stanford Hospitals and Kaiser Permanente, do work exclusively with the company. This is a major portion of AMN’s competitive advantage and largely mitigates the risk of provider mixing through loose contracts. Acquisition Integration Failure AMN grew rapidly in the last two years, partly due to its successful acquisition strategy. While these acquisitions were easily integrated into the existing structure of AMN, there is risk that future acquisitions will not integrate so smoothly. Failed acquisitions would lead to major losses for the firm as they would not realize growth from the significant acquisition expenditures. After speaking with AMN CFO Brian Scott, we believe that the company has a strong evaluation process for potential acquisitions. This appears to be attributable to the company’s failed acquisition of Rx Pro Health in 2007. Management determined post-acquisition that, despite its accretive potential, Rx Pro Health did not have the leadership necessary to make the acquisition a success. Leadership and management have now become the cornerstone of AMN’s evaluation process. Scott went as far as to say the company had turned down what it believed would be profitable acquisitions due to the potential for a leadership vacuum. While it does not eliminate the risk, the careful acquisition process reduces the risk significantly and reduces our concerns. Medical Personnel Shortage Inhibits Recruiting The aforementioned shortage in medical professionals could hurt AMN’s recruitment, thus severely hampering its ability to maintain its high fill rates. This is a major portion of the firm’s competitive advantage. Assuming AMN remains committed to its extensive recruitment efforts and the differences it provides from traditional employment remain appealing to medical professionals, this risk is low. Whether that remains the case is uncertain, so we are somewhat concerned and would monitor this situation closely.
  • 34.
    33 Industry andMacroRisks Healthcare PolicyChanges The Affordable Care Act, while effectively reducing the uninsured rate and thus increasing demand for healthcare services, has proven politically controversial. The law has been repeatedly targeted for repeal by its opponents and these efforts would become much more likely to succeed if a Republican candidate is elected president in 2016. Repeal of the ACA—the implementation of any replacement policies not withstanding—would derail much of the momentum on AMN’s side from industry trends. We believe this poses a serious risk to the company, but view the prospect of a complete repeal as fairly low, considering how the presidential race looks today. Vulnerability to Market Downturns As outlined with the historical stock chart, the healthcare staffing industry is highly vulnerable to economic downturns. Hospitals, much like other businesses who use temporary staffers, tend to part ways their temporary staff as part of quick cost-cutting maneuvers during the onset of recessions. AMN has dealt with this risk previously, seeing revenues fall dramatically in 2009 as the most recent recession ravaged the economy. Thanks to AMN’s diversification into non-staffing products, such as MSP and executive search services, we believe that the potential impact from economic downturns has been significantly reduced. While the company would still see a revenue dip, our research indicates that hospitals would remain customers of AMN’s MSP during recessions since the benefits it provides for the quality of patient care exceed the cost. Recommendation Based on our analysis of the company, we recommend a BUY on AMN Healthcare with a price target of $50.05, representing an upside of 45% over the closing price on April 4, 2016. We believe AMN is a company whose management understands the favorable industry it competes in at a high level, allowing it exploit its superior product offerings and wide network to create advantageous relationships with its clients. We believe that investors are underestimating the company’s ability to leverage this competitive advantage into future growth, leading to its undervaluation on the market.
  • 35.
    34 HISTORICAL INCOME STATEMENTPROJECTED INCOME STATEMENT Fiscal year 2011A 2012A 2013A 2014A 2015A 2016P 2017P 2018P 2019P 2020P Fiscal year end date 12/31/2011 12/31/2012 12/31/2013 12/31/2014 12/31/2015 12/31/2016 12/31/2017 12/31/2018 12/31/2019 12/31/2020 Revenue 887,466 953,951 1,011,816 1,036,027 1,463,065 1,855,678 2,104,663 2,273,036 2,432,149 2,578,078 Cost of sales (enter as -) (638,147) (683,554) (714,536) (719,910) (993,702) (1,243,304) (1,410,124) (1,522,934) (1,629,540) (1,727,312) Gross Profit 249,319 270,397 297,280 316,117 469,363 612,374 694,539 750,102 802,609 850,766 Selling, general & administrative (enter as -) (195,348) (202,904) (218,233) (232,221) (319,531) (397,115) (439,875) (463,699) (483,998) (505,303) Depreciation & amortization (16,324) (14,151) (13,545) (15,993) (20,953) (37,402) (40,853) (44,317) (48,740) (42,479) Total Operating Expense (211,672) (217,055) (231,778) (248,214) (340,484) (434,517) (480,728) (508,017) (532,737) (547,783) Operating profit (EBIT) 37,647 53,342 65,502 67,903 128,879 177,857 213,811 242,085 269,872 302,983 Interest expense (enter as -) (23,727) (26,019) (9,665) (9,237) (7,790) (10,792) (11,068) (14,529) (13,560) (15,215) Pretax profit 13,920 27,323 55,837 58,666 121,089 167,065 202,743 227,556 256,312 287,768 Taxes (enter expense as -) (8,904) (11,010) (22,904) (25,449) (39,198) (61,389) (76,211) (86,428) (107,651) (120,862) Income from cont. operations 5,016 16,313 32,933 33,217 81,891 105,676 126,532 141,128 148,661 166,905 Income (loss) from discontiuning operations (31,281) 823 0 0 0 0 0 0 0 0 Net income (26,265) 17,136 32,933 33,217 81,891 105,676 126,532 141,128 148,661 166,905 Other Comprehensive Income 48 (70) (55) 42 173 0 0 0 0 0 Basic Shares Outstanding 39,913 41,632 45,963 46,504 47,525 47,525 47,525 47,525 47,525 47,525 Impact of dilutive securities 6,038 5,077 1,824 1,582 1,318 1,318 1,318 1,318 1,318 1,318 Diluted Shares Outstanding 45,951 46,709 47,787 48,086 48,843 48,843 48,843 48,843 48,843 48,843 Basic EPS (0.66)$ 0.41$ 0.72$ 0.71$ 1.72$ 2.22$ 2.66$ 2.97$ 3.13$ 3.51$ Diluted EPS (0.57)$ 0.37$ 0.69$ 0.69$ 1.68$ 2.16$ 2.59$ 2.89$ 3.04$ 3.42$ EBITDA 61,103 73,717 85,172 91,053 160,116 228,106 268,878 301,423 334,363 361,658 EBITDA Margin 6.89% 7.73% 8.42% 8.79% 10.94% 12.29% 12.78% 13.26% 13.75% 14.03% AppendixI: Historical and Projected Income Statements
  • 36.
    35 HISTORICAL BALANCE SHEETPROJECTED BALANCE SHEET Fiscal year 2011A 2012A 2013A 2014A 2015A 2016P 2017P 2018P 2019P 2020P Fiscal year end date 12/31/2011 12/31/2012 12/31/2013 12/31/2014 12/31/2015 12/31/2016 12/31/2017 12/31/2018 12/31/2019 12/31/2020 ASSETS Cash & equivalents ST & LT market. securities 3,962 5,681 15,580 13,073 9,576 54,853 181,350 433,081 555,130 771,586 Accounts receivable 146,654 142,510 147,477 186,274 277,996 308,117 349,458 377,415 403,834 428,064 Accounts receivable subcontractor 22,497 18,467 18,271 28,443 50,807 46,372 52,594 56,801 60,778 64,424 Deferred income taxes, net 19,335 18,123 24,938 27,330 0 0 0 0 0 0 Prepaid Expenses 5,691 7,282 8,128 10,350 13,526 47,038 53,350 57,618 61,651 65,350 Other current assets (inc. non-trade receivables) 3,652 11,681 15,705 17,200 23,723 24,012 27,234 29,412 31,471 33,359 Total current assests 212,473 203,744 230,099 282,670 375,628 480,392 663,985 954,327 1,112,864 1,362,784 Restricted cash and cash equivalent 18,244 18,861 23,115 19,567 27,352 27,352 27,352 27,352 27,352 27,352 Fixed Assests 16,863 14,815 21,158 32,880 50,134 58,083 66,727 73,864 78,738 89,581 Other assets 19,329 19,732 23,023 38,710 47,569 107,569 107,569 107,569 107,569 107,569 Long-term deferred income taxes 1,823 0 0 0 0 0 0 0 0 0 Goodwill 123,324 123,324 144,642 154,387 204,779 304,779 304,779 304,779 304,779 304,779 Intangible Assests 143,575 136,910 150,197 152,517 174,970 163,022 151,409 140,869 131,034 124,117 Total assets 535,631 517,386 592,234 680,731 880,432 1,141,196 1,321,821 1,608,760 1,762,336 2,016,182 LIABILITIES Accounts payable and accrued expenses 49,809 52,619 69,407 78,993 118,822 119,722 135,786 146,649 156,914 166,329 Accrued compensation and benefits 43,649 49,443 54,825 67,995 83,701 98,505 111,722 120,659 129,105 136,852 Current Revolver Due 0 0 0 0 0 0 0 0 0 0 Current portion of L-T Debt 31,125 0 10,000 25,500 37,500 41,250 41,250 192,240 3,750 60,000 Deferred Revenue 2,155 0 0 3,177 5,620 3,465 3,930 4,244 4,541 4,814 Other current liabilites 8,313 7,463 6,060 2,630 5,374 10,316 11,700 12,636 13,521 14,332 Bank Overdraft 3,515 0 0 0 0 0 0 0 0 0 Liabilites related to assets held for sale 1,486 0 0 0 0 0 0 0 0 0 Total current liabilites 140,052 109,525 140,292 178,295 251,017 273,258 304,388 476,429 307,832 382,327 Revolver 0 0 0 0 0 0 0 0 0 0 Long-Term Debt 174,198 158,178 148,672 135,690 180,990 300,990 309,740 268,490 426,250 422,500 Deferred income taxes, net 0 0 0 32,491 22,431 22,431 22,431 22,431 22,431 22,431 Other long term liabilites 61,646 67,572 85,528 77,674 78,134 78,134 78,134 78,134 78,134 78,134 Total liabilities 375,896 335,275 374,492 424,150 532,572 674,813 714,693 845,484 834,647 905,392 SHAREHOLDER'S EQUITY Preferred stock 24,076 0 0 0 0 0 0 0 0 0 Common stock / additional paid in capital 395,363 424,749 429,515 434,995 444,210 457,057 471,271 486,291 502,042 518,238 Retained earnings / accumulated deficit (259,331) (242,195) (211,275) (178,058) (96,167) 9,509 136,041 277,169 425,830 592,735 Other comprehensive income / (loss) (373) (443) (498) (356) (183) (183) (183) (183) (183) (183) Total equity 159,735 182,111 217,742 256,581 347,860 466,383 607,128 763,276 927,689 1,110,790 Total liabilites and equity 535,631 517,386 592,234 680,731 880,432 1,141,196 1,321,821 1,608,760 1,762,336 2,016,182 AppendixII: Historical and Projected Balance Sheets
  • 37.
    36 PROJECTED STATEMENT OFCASH FLOWS Fiscal year 2016P 2017P 2018P 2019P 2020P Fiscal year end date 12/31/2016 12/31/2017 12/31/2018 12/31/2019 12/31/2020 Net income 105,676 126,532 141,128 148,661 166,905 Depreciation and amortization 37,402 40,853 44,317 48,740 42,479 Stock based compensation 12847 14213 15020 15751 16196 Accounts receivable (30,121) (41,342) (27,957) (26,419) (24,230) Accounts receivable subcontractor 4,435 (6,222) (4,208) (3,976) (3,647) Prepaid Expenses (33,512) (6,311) (4,268) (4,033) (3,699) Other current assets (289) (3,222) (2,179) (2,059) (1,888) Accounts Payable and Accrued Expense 900 16,064 10,863 10,265 9,415 Accrued compensation and benefits 14,804 13,217 8,938 8,446 7,746 Current Revolver Due 0 0 0 0 0 Current portion of L-T Debt 3,750 0 150,990 (188,490) 56,250 Deferred Revenue (2,155) 465 314 297 272 Other Current Liabilites 4,942 1,384 936 885 811 Cash from operating activities 118,679 155,631 333,896 8,068 266,611 Restricted Cash and Cash Equivilents 0 0 0 0 0 Capital expenditures (33,402) (37,884) (40,915) (43,779) (46,405) Other Long term Assests (60,000) 0 0 0 0 Goodwill (100,000) 0 0 0 0 Cash from investing activities (193,402) (37,884) (40,915) (43,779) (46,405) Notes Payable 120,000 8,750 (41,250) 157,760 (3,750) Other long term liabilites 0 0 0 0 0 Other comprehensive income / (loss) 0 0 0 0 0 Revolver 0 0 0 0 0 Cash from financing activities 120,000 8,750 (41,250) 157,760 (3,750) Net change in cash during period 45,277 126,497 251,731 122,049 216,456 AppendixIII: Projected Statements of Cash Flows
  • 38.
  • 39.
    38 AppendixIV: Model Assumptions DownsideBase Upside Income Statement Assumptions Organic Revenue Growth 2016 21.83% 26.83% 31.83% 2017 10.42% 13.42% 16.42% 2018 5.00% 8.00% 9.00% 2019 4.00% 7.00% 8.00% 2020 3.00% 6.00% 7.00% Margins Gross profit as % of sales 31.00% 33.00% 34.00% Selling exp margin 22.41% 21.82% 21.27% Tax rate 46.00% 42.00% 38.00% Balance Sheet Assumptions Working Capital Current Assets Average A/R % of Sales 15.60% 16.60% 17.60% Average A/R Sub. Of Sales 1.81% 2.50% 3.47% Average Prepaid as % of SGA 2.91% 3.78% 4.46% Average Curr. Assests as % of Sales 0.41% 1.29% 1.66% Current Liabilities Averge A/P and Acc. Exp as % of COGS 10.63% 9.63% 8.63% Average Acc. Comp. and Beneftis as % of COGS 9.44% 7.92% 6.84% Average Deferred Revenue as % of Sales 0.38% 0.19% 0.00% Average Curr. Liabilities as a % of COGS 1.30% 0.83% 0.37% Long-Term Assets Average Dep. As % of CAPEX 78.00% 51.82% 33.00% Average CAPEX as % of Revenue 1.85% 1.80% 0.52% Average other assets as percent of sales 2.07% 2.70% 3.74% Average goodwill as % of sales 12.93% 14.00% 16.42% Average intangible assets as % of Sales 14.35% 14.41% 16.18%
  • 40.
    39 AppendixV: Debt Schedule 20112012 2013 2014 2015 2016 2017 2018 2019 2020 Current portion of long-term debt Beginning of period 37,500 41,250 41,250 192,240 3,750 Increases / (decreases) 3,750 0 150,990 (188,490) 56,250 End of period 31,125 0 10,000 25,500 37,500 41,250 41,250 192,240 3,750 60,000 Current portion of L-T debt as % of L-T debt 17.9% 0.0% 6.7% 18.8% 20.7% 13.7% 13.3% 71.6% 0.9% 14.2% Long term debt Beginning of period 180,990 300,990 309,740 268,490 426,250 Additional borrowing / (pay down), net 120,000 8,750 (41,250) 157,760 (3,750) PIK accrual 0 0 0 0 0 End of period 174,198 158,178 148,672 135,690 180,990 300,990 309,740 268,490 426,250 422,500 Interest expense on long term debt (23,727) (16,204) (9,231) (6,124) (6,890) (10,792) (11,068) (14,529) (13,560) (15,215) Weighted average interest rate (11.6%) (10.2%) (5.8%) (3.8%) (3.2%) (3.2%) (3.2%) (3.2%) (3.2%) (3.2%) % of interest expense paid in cash 100.0% 100.0% 100.0% 100.0% 100.0% % of interest expense accrues as PIK 0% 0% 0% 0% 0% Total debt to total capital 50% 23% 18% 15% 13% 17% 17% 21% 20% 22% Shares Outstanding 45951 46709 47787 48086 48843 48843 48843 48843 48843 48843 Share price on 12/31 4.43 11.55 14.7 19.6 31.05 34.51 34.51 34.51 34.51 34.51 Market Cap at end of year 203,563 539,489 702,469 942,486 1,516,575 1,685,572 1,685,572 1,685,572 1,685,572 1,685,572
  • 41.
    40 2006 2007 20082009 2010 2011 2012 2013 2014 2015 2016 2017 2018 2019 2020 Market Revenues 15,946.50 16,799.60 16,445.80 12,385.00 11,444.10 12,450.20 13,040.30 13,378.20 13,895.50 14,854.10 15,620.50 16,096.80 16,735.80 17,494.70 18,224.30 Market Rev Growth YoY NA 5.3% -2.1% -24.7% -7.6% 8.8% 4.7% 2.6% 3.9% 6.9% 5.2% 3.0% 4.0% 4.5% 4.2% AMN Revenues 1,081.70 1,164.02 1,217.20 759.79 669.91 887.47 953.95 1,011.82 1,036.03 1,463.07 1,855.68 2,104.66 2,273.04 2,432.15 2,578.08 AMN Rev Growth YoY 7.6% 4.6% -37.6% -11.8% 32.5% 7.5% 6.1% 2.4% 41.2% 26.8% 13.4% 8.0% 7.0% 6.0% AMN Market Share 6.78% 6.93% 7.40% 6.13% 5.85% 7.13% 7.32% 7.56% 7.46% 9.85% 11.88% 13.08% 13.58% 13.90% 14.15% AppendixVI: Market Share Projections
  • 42.
    41 AppendixVII: DepreciationSchedule Depreciation Schedulefor AMN Healthcare Dollars in thousands 2012 2013 2014 2015 2016 2017 2018 2019 2020 Sales $953,951.0 $1,011,816.0 $1,036,027.0 $1,463,065.0 $1,855,678.0 $2,104,663.3 $2,273,036.3 $2,432,148.9 $2,578,077.8 Capital expenditures 5,472.0 9,047.0 19,134.0 27,010.0 33,402.2 37,883.9 40,914.7 43,778.7 46,405.4 Capital expenditures, as % of sales 0.6% 0.9% 1.8% 1.8% 1.8% 1.8% 1.8% 1.8% 1.8% Beginning net PP&E 32,880.0 50,134.0 58,082.7 66,726.7 73,863.8 78,738.0 Capital expenditures 27,010.0 33,402.2 37,883.9 40,914.7 43,778.7 46,405.4 (Asset sales and write-offs) 0.0 0.0 0.0 0.0 0.0 1.0 (Depreciation expense) (9,169.0) (25,453.6) (29,239.9) (33,777.5) (38,904.6) (35,562.3) Ending net PP&E 32,880 50,134 58,082.7 66,726.7 73,863.8 78,738.0 89,582.1 Existing PP&E, net 32,880.0 50,134.0 Land 0.0 0.0 Depreciable PP&E, net 32,880.0 50,134.0 Depreciation of existing PP&E Average useful life of existing net PP&E 5.0 $16,711.3 $13,369.1 $10,026.8 $6,684.5 $3,342.3 Average useful life of capital expenditures 5.0 Depreciation from capital expenditures Depreciation of future CapEx Depreciation of 2016 capex ($2,701.0) ($5,402.0) ($5,402.0) ($5,402.0) ($5,402.0) ($5,402.0) Depreciation of 2017 capex ($3,340.2) ($6,680.4) ($6,680.4) ($6,680.4) ($6,680.4) Depreciation of 2018 capex ($3,788.4) ($7,576.8) ($7,576.8) ($7,576.8) Depreciation of 2019 capex ($4,091.5) ($8,182.9) ($8,182.9) Depreciation of 2020 capex ($4,377.9) ($4,377.9) Total Depreciation Expense $8,354.0 $9,169.0 $25,453.6 $29,239.9 $33,777.5 $38,904.6 $35,562.3 Depreciation as % of PP&E, net 25.4% 18.3% 43.8% 43.8% 45.7% 49.4% 39.7% Depreciation as % of capital expenditures (43.7%) (33.9%) (76.2%) (77.2%) (82.6%) (88.9%) (76.6%)
  • 43.
    42 AppendixVIII: WACC Calculation Costof Debt Interest Rate 3.2% Tax Rate 42% Weight of Debt 38.6% Weighted Cost of Debt 0.7% Cost of Equity Risk Free Rate 1.94% Expected Market Return 9.93% Beta 1.28 Weight of Equity 61.4% Weighted Cost of Equity 7.5% Weight Average Cost of Capital 8.2% WACC Calculation
  • 44.
    43 AppendixIX: Discounted CashFlow Valuation Discounted Cash Flow 1 2 3 4 5 Dollars in thousands 2016 2017 2018 2019 2020 After tax EBIT 112,502.6 133,439.4 150,138.6 156,525.7 175,730.2 Depreciation and amortization 37,401.6 40,852.9 44,317.5 48,739.6 42,479.3 Change in working capital (37,245.7) (25,966.9) 133,430.2 (205,084.0) 41,030.9 Stock-Based Compensation 12,847.1 14,213.4 15,020.3 15,751.2 16,196.0 Capex (33,402.2) (37,883.9) (40,914.7) (43,778.7) (46,405.4) Free cash flow 92,103.4 124,654.9 301,992.0 (27,846.2) 229,031.0 Discount Factor 0.9244 0.8545 0.7899 0.7302 0.6750 Discounted Free Cash Flow 85,140.0 106,518.5 238,544.5 (20,332.9) 154,591.0 Perpetual Growth Method Implied Stock Price 2020 free cash flow 229,031.0 PV of FCF 564,461.2 Perpetual growth rate 2.0% 2,451,403.8 WACC 8.2% 3,015,864.9 Terminal Value 3,780,879.6 Debt (342,240.0) Cash 54,852.7 Exit Multiple Method 2,728,477.7 Expected EV/EBITDA 9.63x Shares Outstanding 48,843.0 2020 EBITDA 361,658.5 1 Year Target Price 55.86 Terminal Value 3,482,770.9 PV of Terminal Value Implied Enterprise Value Implied Market Value of Equity
  • 45.
  • 46.
  • 47.
  • 48.