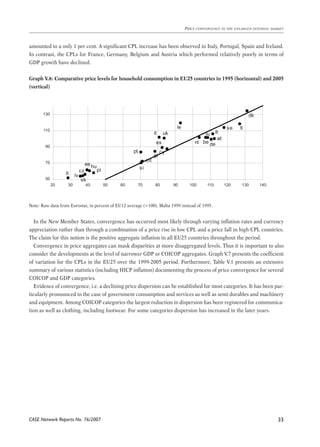
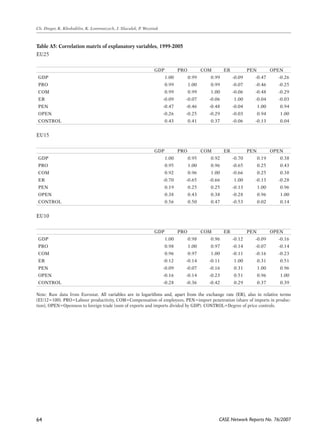
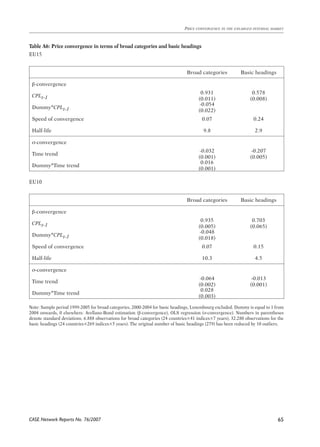
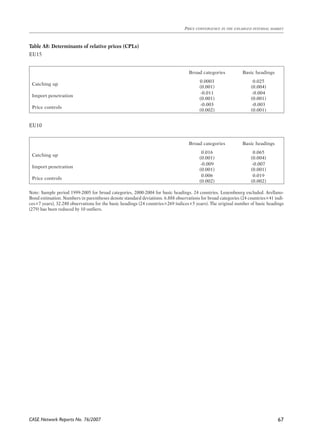
CASE Network Reports No. 76/2007 
Ch. Dreger, K. Kholodilin, K. Lommatzsch, J. Slacalek, P. Wozniak 
The views and opinions expressed here reflect the authors’ point of view and not necessarily those of CASE 
Network. 
This report was prepared within the project on price convergence in the enlarged Internal Market (ECFIN-E/ 
2005/002) carried out by researchers from DIW Berlin and CASE – Center for Social and Economic Research. 
The publication was financed by Rabobank Polska S.A. 
We would like to thank Jakub Kowalski from the University of Lodz for excellent research assistance. 
Keywords: EU enlargement, price convergence, catching up and competition 
JEL codes: E31, F15, C33 
© CASE – Center for Social and Economic Research, Warsaw, 2007 
Graphic Design: Agnieszka Natalia Bury 
ISBN 978-83-7178-446-0 EAN 9788371784460 
Publisher: 
CASE-Center for Social and Economic Research on behalf of CASE Network 
12 Sienkiewicza, 00-010 Warsaw, Poland 
tel.: (48 22) 622 66 27, 828 61 33, fax: (48 22) 828 60 69 
e-mail: case@case-research.eu 
http://www.case-research.eu
CASE Network Reports No. 76/2007 
Price convergence in the enlarged internal market 
This report is part of the CASE Network Report series. 
The CASE Network is a group of economic and social research centers in Poland, Kyrgyzstan, Ukraine, Georgia, Mol-dova, 
and Belarus. Organizations in the network regularly conduct joint research and advisory projects. The research 
covers a wide spectrum of economic and social issues, including economic effects of the European integration process, 
economic relations between the EU and CIS, monetary policy and euro-accession, innovation and competitiveness, 
and labour markets and social policy. The network aims to increase the range and quality of economic research and 
information available to policy-makers and civil society, and takes an active role in on-going debates on how to meet the 
economic challenges facing the EU, post-transition countries and the global economy. 
The CASE network consists of: 
• CASE – Center for Social and Economic Research, Warsaw, est. 1991, 
www.case-reserch.eu 
• CASE – Center for Social and Economic Research – Kyrgyzstan, est. 1998, 
www.case.elcat.kg 
• Center for Social and Economic Research - CASE Ukraine, est. 1999, 
www.case-ukraine.kiev.ua 
• CASE –Transcaucasus Center for Social and Economic Research, est. 2000, 
www.case-transcaucasus.org.ge 
• Foundation for Social and Economic Research CASE Moldova, est. 2003, 
www.case.com.md 
• CASE Belarus - Center for Social and Economic Research Belarus, est. 2007.
CASE Network Reports No. 76/2007 
Ch. Dreger, K. Kholodilin, K. Lommatzsch, J. Slacalek, P. Wozniak 
Table of contents 
Executive Summary ........................................................................................................................................................ 4 
Part I. Introduction and objectives ................................................................................................................................ 10 
Part II. Competition and price convergence ................................................................................................................. 11 
II.1 The Law of One Price ......................................................................................................................................... 16 
II.2 Price setting models in segmented markets ...................................................................................................... 18 
II.2 Empirical evidence on the competition effect ................................................................................................... 21 
Part III. Catching up and price convergence ................................................................................................................ 28 
III.1 The Balassa Samuelson hypothesis ................................................................................................................... 29 
III.2 Empirical evidence on the catching up effect ................................................................................................... 32 
Part IV. Measuring price convergence by comparative price levels ............................................................................. 35 
IV.1 Deflators, consumer and producer price indices .............................................................................................. 36 
IV.2 Comparative price levels .................................................................................................................................... 38 
IV.3 Drawbacks of comparative price levels ............................................................................................................. 40 
Part V. Price trends in the enlarged European Union ...................................................................................................... 43 
V.1 Comparative price levels across countries ........................................................................................................ 44 
V.2 Changes in comparative price levels over time ................................................................................................. 48 
V.3 Changes in HICP subcategories over time ........................................................................................................ 52 
Part VI. Empirical analysis of price convergence .............................................................................................................. 54 
VI.1 Description of variables ..................................................................................................................................... 56 
VI.2 Catching up and competition factors ................................................................................................................ 60 
VI.3 Beta and sigma convergence ............................................................................................................................. 61 
VI.4 Determinants of price convergence ................................................................................................................... 66 
Part VII. Conclusions ........................................................................................................................................................... 70 
References ....................................................................................................................................................................... 75 
Appendix ......................................................................................................................................................................... 81
CASE Network Reports No. 76/2007 
Price convergence in the enlarged internal market 
The Authors 
Christian Dreger received his doctoral degree (1995) and his habilitation degree (2005) in economics from the 
University of Kassel, Germany. He works as an economist at the German Institute for Economic Research (DIW 
Berlin). He has built macroeconometric models for the euro area and the German Economy. His research interests 
include the impact of institutions on the labour market performance, business cycle forecasting methods, dynamic 
factor models, panel econometrics, and spatial econometrics. 
Konstantin Kholodilin graduated from the St. Petersburg State University (1995, Diploma) and obtained his doc-toral 
degree at the Universitat Autònoma de Barcelona (2003). He specialises in econometric analysis and forecast-ing. 
In 2001-2004 he was doing research in the IRES (Université catholique de Louvain, Belgium). Since 2005 he 
is a research associate at the DIW Berlin. His mother tongue is Russian, in addition, he speaks English, French, 
German, and Spanish fluently. 
Kirsten Lommatzsch studied at Freie Universität in Berlin. �From 1999 to 2007 she worked at the DIW Berlin on 
business cycles and European integration. Currently associated with the Deutsche Bundesbank. Main research 
interests include real exchange rates, real and nominal convergence, European integration. 
Jirka Slacalek received his PhD from Johns Hopkins University in 2004. He has worked as an economist at the 
German Institute for Economic Research (DIW Berlin), and moved to the European Central Bank in September. 
His research interests include the role of wealth effects in explaining private consumption, the predictive power of 
consumer sentiment, monetary economics and the relationship between productivity growth trend and the natural 
rate of unemployment. 
Przemysław Woźniak received his PhD from Warsaw University (2002). He has been working at the Center for 
Social and Economic Research (CASE) as research economist since 1996. His area of expertise includes inflation, 
exchange rates and macroeconomic policies. Recently has worked as macroeconomic expert in numerous coun-tries 
of ex-Yugoslavia.
CASE Network Reports No. 76/2007 
Ch. Dreger, K. Kholodilin, K. Lommatzsch, J. Slacalek, P. Wozniak 
Abstract 
In this paper we investigate the effects of EU enlargement on price convergence. The internal market is expected 
to boost integration and increase efficiency and welfare through a convergence of prices in product markets. Two 
principal drivers are crucial to explain price developments. On the one hand, higher competition exerts a down-ward 
pressure on prices because of lower mark ups. On the other hand, the catching up process of low income 
countries leads to a rise in the price levels and higher inflation over a transition period. Using comparative price 
levels for individual product categories price convergence can be established. However, the speed of convergence 
is rather slow, with half lives around 10 years. The enlargement has slightly stimulated the convergence process, 
and this impact is robust across different groups of countries. Moreover, the driving forces of convergence are 
explored. In line with theoretical predictions, the rise in competition exerts a downward pressure on prices, while 
catching up of low income countries leads to a rise in price levels
CASE Network Reports No. 76/2007 
Price convergence in the enlarged internal market 
Executive Summary 
This is the final report of the project on price convergence in the enlarged Internal Market (ECFIN-E/2005/002) 
carried out by researchers from DIW Berlin and CASE – Center for Social and Economic Research. The main aim 
of the study is to investigate the effects of EU enlargement on price convergence. The Internal Market is expected 
to foster market integration and increase efficiency and welfare through a convergence of prices in product mar-kets. 
Although a high degree of market integration is already achieved, price dispersion in the EU has considerably 
increased with the enlargement in 2004. Price levels in the New Member States are substantially lower than in 
the Old Member States, most likely because of their lower income levels. In addition, inflation rates in the New 
Member States exceed the average of the EU15. 
In fact, two principal forces are crucial to explain the process of price convergence. On the one hand, the rise 
in competition in the Internal Market exerts a downward pressure on prices due to lower mark ups of prices over 
marginal costs. Domestic factors become less important in particular for tradable products. On the other hand, the 
catching up process of low income countries leads to a rise in the price levels and higher inflation over a transi-tion 
period. The overall price level tends to increase and affects the consumption and production pattern of the 
economies. This tendency is based on market reforms and deregulation, a different composition of value added 
and a rise in the variety and quality of products. It is the main task of this study to disentangle these two forces on 
price developments and to assess their relative importance. The main contribution is on the empirical side. Models 
incorporating both catching up and competition effects are estimated using a huge amount of data for different 
product categories. In addition, the study assesses the consequences of price convergence in the New Member 
States on the entire EU25, i.e. whether the price adjustment will occur through upward price trends in the New 
Member States or downward trends in (some of) the Old Member States. 
Following the introduction in section I, the impact of competition on price convergence is discussed in section 
II. The Law of One Price (LOP) is taken as the natural point of departure, as it constitutes the basic mechanism 
for price convergence in a perfect competitive market. The LOP predicts that in the absence of barriers to trade, 
arbitrage will force prices of identical products to converge, i.e. the domestic price is equal to the foreign price, 
both expressed in the same currency. Hence domestic prices are fully determined by foreign conditions, implying 
that prices in small open economies are completely exogeneous. However, deviations can persist due to transpor-tation 
costs. Arbitrage will not occur if price differences are not sufficient to cover the related costs. Furthermore, 
other factors like market segmentation, different preferences of consumers at home and abroad and non tradable 
components might cause a rejection of the LOP. In fact, the empirical relevance of the LOP is quite limited even in 
integrated markets such as the EU12 or the US. Therefore, price setting behaviour of firms is traced to domestic 
factors. It can be explained in terms of mark up of prices over marginal costs of production. This approach includes 
the LOP as a special case: if markets are fully competitive, prices and marginal costs will coincide, implying that 
a mark up will vanish. But, if competition is imperfect, prices are not entirely determined by international condi-
CASE Network Reports No. 76/2007 
Ch. Dreger, K. Kholodilin, K. Lommatzsch, J. Slacalek, P. Wozniak 
tions. In monopolistic competitive markets, the mark up is not equal to zero, and can depend on local conditions, 
such as the price elasticity of demand in the respective markets or the business cycle situation. Nevertheless, con-sistent 
evidence is available that an increase in openness (market integration) has put a downward pressure on 
prices via the reduction of mark ups. 
Because countries in the Internal Market differ with respect to their per capita income, catching up processes 
need to be taken into account. The implications of catching up on price convergence are discussed in section III. 
In particular, the Balassa Samuelson effect and the non tradable component of products provide a rationale for the 
presence of a trend in relative prices not related to the functioning of the Internal Market. Specifically, prices of 
non tradables should be substantially lower in the New Member States, as long as they are in a catching up phase. 
The magnitude of the effect appears to be rather small, partly because of empirical shortcomings. Therefore, catch-ing 
up is important, but it is likely related to a broader concept than the pure Balassa-Samuelson model. Specifi-cally, 
the quality of products, regulated prices and reputation problems need to be taken into account. 
In the empirical model the impacts of competition and catching up have to be disentangled. Both effects should 
be studied simultaneously in order to get unbiased estimates. The methodological aspects of appropriate indica-tors 
to study the process of price convergence are explored in section IV. �Due to the absence of a sufficient amount 
of absolute price data, �research has often focused on certain areas or products, where prices are relatively easy 
available, such as in the food sector. Unfortunately, these prices are less representative for the functioning of the In-ternal 
Market. On the other hand, studies based on relative price aggregates cannot distinguish whether the effect 
of lower price dispersion is caused by the convergence of prices of individual goods or services or a change in the 
weighting system. Furthermore, consumer and producer price indexes are less informative regarding advances in 
competition, as they reflect cumulated inflation rates rather than absolute prices. T�heir focus on the representativ-ity 
of products for the individual country makes them less useful for international comparisons. 
Therefore�, the empirical analysis is carried out on the base of comparative price levels (CPLs). These measures 
have been constructed by Eurostat and the OECD as part of the European Comparison Programme and are calcu-lated 
as the ratio between purchasing power parities (PPPs) and nominal exchange rates. The PPPs are based on 
price levels of a comparable and representative sample of products covering the various aggregates of GDP in the 
EU25 member states. At the most disaggregated level, PPPs rely on relative price ratios for 279 categories of goods 
and services labelled as basic headings. The chapter also clarifies the construction principles of PPPs and CPLs, 
and gives insights into their limitations of these measures. 
Recent price trends are explored in section V. Due to lower levels in per capita income and productivity the 
New Member States have lower prices than in the EU12 and EU15 countries. The backlog is most pronounced in 
services, which are often non tradable. However, price levels of goods are also lower and might indicate lacks in 
tradability and in the quality and reputation of goods and services produced in the New Member States. �As trad-ability 
increases with the durability of the goods, price convergence is more prominent for durables. However, 
while price convergence has been observed for nearly all of the broad expenditure categories, it has decreased 
for durable goods in the recent period. C�onvergence in the New Member states has occurred most likely through 
varying inflation rates and currency appreciation rather than through a combination of a price increase in low 
price and a price fall in the high price countries. The claim for this notion is the positive inflation rate in all EU25 
countries throughout the period. 
The econometric approach is presented in section VI. As the analysis has to distinguish between catching up and 
competition forces, distinct factors are identified to obtain insights into the impact of these forces on the path of 
price convergence. A factor analysis is conducted where the factors are extracted by means of principal component 
analysis. Specifically, a catching up factor is derived from a dataset comprising real GDP, real productivity, and 
real compensation of employees. These measures are in relative terms, i.e., they refer to the individual country
CASE Network Reports No. 76/2007 
Price convergence in the enlarged internal market 
variables divided by the EU12 benchmark. The first principal component is interpreted as the catching up factor. 
It represents almost all of the variation of its ingredients. 
Competition is more difficult to measure. It is partly, albeit not perfectly, manifested in the openness of countries 
to foreign trade and import penetration, which are both related to market integration, and the degree of business 
deregulation, the latter proxied by the Fraser index. This index comprises information about price controls, the 
burden of regulation, time with government bureaucracy, the ease of starting a new business and irregular pay-ments. 
For the purpose of this study, price controls are the most important variable. Removing of price controls 
during a catching up period should lead to price increases in the EU10. For the EU15, prices are already liberalized 
to a higher extent. A further reduction of controls will mainly introduce more competition, which is particularly 
relevant in network industries, such as telecommunications. Therefore a downward pressure on prices should be 
observed for the EU15. 
Openness and import penetration are strongly correlated. Import penetration might be more informative because 
it reflects the exposure of the domestic market to international competition. The correlation of import penetration 
(openness) with either price controls or the overall Fraser index is rather weak. As a consequence the estimation 
of a competition factor would be rather imprecise, since a substantial part of information would be classified as 
idiosyncratic and dropped from the analysis. Therefore, it is more reasonable to include the original competition 
variables in the regression of the determinants on price convergence. 
After determining the variables of interest, the empirical analysis proceeds in two steps. First, β convergence is 
explored for CPLs relying both on 41 broad categories of products and on 279 basic headings. Overall, a negative 
relation between the initial price level and subsequent price increases is confirmed. Thus countries with lower initial 
price levels tend to have higher inflation rates thereafter. Due to higher inflation, convergence of price levels will 
gradually occur. The convergence is stronger in case for basic headings, probably because they are related to more 
homogeneous products. In addition, the speed of convergence rises with the tradability of the product considered. 
Shocks are expected to be removed by 50 percent after 2.1 years in case of durables, compared to 3.7 years for non 
durables. The impact of shocks is even longer for non tradables, such as services and buildings. Furthermore, the 
analysis examines price dispersion over time, i.e. σ convergence. A decline in the standard deviation can be detected, 
where the slope coefficient in a trend regression is significant for the broad categories and the basic headings. 
Second, insights into the main drivers of price convergence are provided. In particular, CPLs for broad catego-ries 
and basic headings are regressed on a number of explanatory variables, like the catching up factor, and com-petition 
measures, such as import penetration and the degree of price controls. The competition variables reflect 
different facets of market integration. 
Catching up and competition seems to be important factors to explain the path of price convergence, most nota-bly 
for the New Member States. The closer per capita incomes are to the EU12 level, the closer their price levels. 
While catching up has a positive effect, competition enters with a negative sign. Therefore competition exerts a 
downward pressure on prices, most notably in the New Member States. For the Old Member States competition 
seems to have increased especially during the 1990s, which are not part of the analysis. Because the New Mem-ber 
States account only for 5 percent of real GDP in the Internal Market, their impact on competition in the Old 
Member States could be hardly visible. In fact, competition is insignificant in the EU15 subsample in most cases. 
Finally, price controls are not significant for the EU25. However, this reflects the opposite impacts of this variable 
in the EU15 and EU10 regressions: removing of price controls has a negative effect for the Old Member States, 
but a positive one for the New Member States, due to a different degree of price regulations. Over the catching up 
period, regulations will be gradually reduced in the EU10, and this will reinforce price convergence. 
To sum up, there is evidence that price convergence takes place in the Internal Market. Due to the enlargement, 
the speed of convergence has increased. Both catching up and competition factors are relevant to explain the proc-
ess of convergence, especially for the New Member States. Nevertheless, it should be noted that the time series 
dimension of the analysis is too short to arrive at definitive conclusions. This is particularly true in the case of basic 
headings, and might explain some inconclusive results of the analysis. 
CASE Network Reports No. 76/2007 
Ch. Dreger, K. Kholodilin, K. Lommatzsch, J. Slacalek, P. Wozniak 
10
CASE Network Reports No. 76/2007 
Price convergence in the enlarged internal market 
11 
Part I: 
Introduction and objectives 
The implementation of the Internal Market Programme and the introduction of a common currency in a number 
of key EU Member States have led to an unprecedented degree of economic integration. The introduction of the 
euro has improved price transparency and has removed costs of currency conversion and exchange rate risk 
premia for a number of countries. Because of the increase in trade, the level of competition in the European Mon-etary 
Union (EMU) and between EMU member states and third countries has risen. Advances in the integration of 
labour, product and financial markets have reduced the costs for economic agents, private households and firms to 
undertake price arbitrage. It may also give rise to industrial restructuring, mergers and acquisitions and a change 
in the market strategy of enterprises. 
The EU enlargement with the accession of eight Eastern European economies, Cyprus and Malta has marked 
another cornerstone in the completion of the Internal Market. The New Member States are small open economies, 
i.e. they have a small market size, implying that they have only little impact on EU25 quantities. For example, these 
economies account for 15 percent of total population, but only for 5 percent of real GDP in the Internal Market. 
Moreover, the New Member States are in the process of catching up growth, i.e. they have lower per capita income 
and lower price levels than the average of the Old Member States. During the process of transition and accession, 
trade has expanded rapidly. In addition, the New Member States have received large foreign direct investments in 
manufacturing industries, financial, distribution and communication sectors. In a number of cases, firms in the 
New Member States have been included in international production chains. Multinational firms have utilized the 
comparative cost advantages of these countries through shifting labour intensive work into this region. 
The rapidity of the transition process can be seen, among others, by the development of inflation. At the begin-ning 
of the transition all countries faced high inflation rates. Liberalization by the removal of controls and quantity 
allocations, which repressed demand formerly, led to rapid adjustments to free market prices. In addition, fiscal 
and financial crises resulted in periods of rapid monetary expansion since governments relied on seignorage to 
support public budgets as well as state owned enterprises. Especially the Baltic countries experienced annual infla-tion 
in excess of 1000 per cent. But, as stabilization took place in most accession countries, inflation was reduced 
very quickly to moderate rates. Central banks in most of the New Member States have been rather successful in 
stabilizing inflation after initial shocks. This in turn led to a substantial build up of reputation. The majority of ac-cession 
countries experienced annual inflation rates around 30 percent in 1995, while the rates were even below 10 
percent in some countries. Further disinflation occured after the onset of the Russian crisis in 1998. This has been 
caused by a combination of negative demand shocks, i.e. lower foreign demand by Russia and the EU, and positive 
supply shocks due to a decrease in oil prices and market integration in the eve of the EU accession. The evolution
was overlapped by positive demand shocks due to higher economic growth in major trading partners and negative 
supply shocks due to rising oil prices at the end of the 1990s. Currently all New Member States realize single-digit 
inflation rates. In some countries, inflation exceeds only slightly the euro area average. 
Market integration is an ongoing process, which has not been completed yet. The need for further integration, 
covering also the markets for services, is stated in the Lisbon agenda (EU Commission 2000) and has been also 
emphasised in the Kok report (EU Commission 2004b). An important indicator measuring market integration is 
price convergence. In general, an increase in integration leads to a rise in competition, which puts pressures on 
the mark ups of prices over marginal costs and may lead to the convergence of prices towards the price of the most 
efficient supplier. The theoretical foundation of this proposition is the Law of One Price (LOP), which is supposed 
to hold in perfectly competitive markets. The LOP postulates that in the absence of natural or regulatory barriers, 
arbitrage forces prices of identical goods to converge. Apart from transitional frictions, which may impede price 
convergence in the short and medium run, commodities are expected to sell for the same price in each geographi-cal 
CASE Network Reports No. 76/2007 
Ch. Dreger, K. Kholodilin, K. Lommatzsch, J. Slacalek, P. Wozniak 
12 
region of the Internal Market (Obstfeld and Rogoff, 1996). From the perspective of consumers, an identical 
amount of money should buy the same bundle of goods and services in each location. 
Despite advances in the integration of markets, however, there is strong evidence that the pace of price conver-gence 
has slowed down in recent years, see several reports conducted by the EU Commission (2004a, 2005) and 
Eurostat (2003). Hence, other forces might be important to explain the development. Nevertheless, price level 
dispersion is higher for non tradables than for tradables, where the latter are clearly more affected by the process 
of integration. The dispersion of overall price levels has decreased after the inception of the Internal Market in the 
EU12, but stayed rather unchanged after the introduction of the EMU. Nevertheless, the dispersion of prices for 
tradables has been on a stable declining trend over the entire period.� In this study, the EU12 benchmark is pre-ferred 
over EU15 as it allows eliminating the effect of exchange rate fluctutations in the euro area countries. But, 
even with EU12 as a benchmark these fluctuations are inherent in the remaining EU member states. 
For the EU25 countries, a steep decline in price dispersion is observed until 2000, implying that the price levels 
in the New Member States have rapidly converged to those in the EU12 in the course of their preparation for acces-sion. 
Because inflation rates have been higher on average in the former transition economies, price convergence 
has likely proceeded through rising prices in the New Member States towards the higher EU12 level. Due to the 
lower per capita incomes in the New Member States, the dispersion in the EU25 is much higher than in the EU12, 
which in turn exceeds that of the EU6 comprising the founding members of the EU. In sum, the evidence indicates 
that price convergence in the Internal Market takes place at least to some extent and that the duration of partici-pation 
of countries in the Internal market may have an impact on the results. However, dispersion of consumer 
prices turns out to be significantly lower in the US and therefore, a further potential of prices to converge seems to 
exist, given that obstacles for arbitrage can be removed (Rogers, 2001, Faber and Stokman, 2005). For the founding 
members of the euro area, price dispersion is relatively low and closely to the US figures. 
Price level convergence is often explored by means of aggregate price measures. However, preferences of agents 
at home and abroad need to be identical to obtain any robust insights from such an analysis. This condition is re-jected 
in the sample considered here. Different weights of individual products can introduce a serious bias in the 
analysis. Weighting schemes are affected by the income level, which is substantially different between the New and 
Old Member States. Hence, persistent deviations in aggregate price levels may not necessarily imply that conver-gence 
has failed so far. Furthermore, the effects from higher competition could be overlapped by the catching up 
in per capita income of the New Member States. 
There are several reasons why competition might be still imperfect in the Internal Market. The Balassa-Samuel-son 
effect is the most popular explanation for the presence of a trend in the development of relative prices and real 
exchange rates. Prices of non tradable goods like services are predicted to be lower for the New Member States,
Price convergence in the enlarged internal market 
as they are in the catching up process. Several papers have also emphasized the role of regulated prices, taxes and 
reputation problems of firms in the former communist economies. Different qualities and varieties of goods and 
services might also contribute to higher price dispersion. 
The main objective of the present study is to gather information about differences in individual prices and price 
levels based on suitable data sources. This will allow an analysis of the sources of price dispersion, the past pace 
of and the future scope for price convergence in the enlarged EU with a particular emphasis on the functioning of 
the Internal Market and the role of the New Member States therein. 
The report is organized in different chapters. The next part (section II) provides a survey of the literature cover-ing 
theoretical and empirical aspects of the competition effect in an integrated market, while section III focuses 
on the catching up aspect. In the empirical model price reactions stemming from catching up and competition 
need to be disentangled. Both effects should be studied simultaneously in order to get unbiased estimates. Due to 
the absence of a sufficient amount of absolute price data, the analysis refers to comparative price levels and basic 
headings (section IV). They have been constructed by Eurostat and OECD as part of the European Comparison 
Programme. Stylised facts on recent price trends in the enlarged EU are presented in section V of the report. Sec-tion 
VI holds the empirical analysis. The econometric approach is built upon principal component analysis that is 
particularly suited to extract catching up and competition factors in the evolution of comparative price levels. The 
results are the basis for predictions of the future development of price convergence. Section VII summarizes the 
main conclusions. 
CASE Network Reports No. 76/2007 13
In perfectly competitive markets, prices in the domestic country are fully determined by international conditions. 
Therefore, price setting does not involve any local factors, such as cost or market structures. From the perspective 
of consumers an equal amount of money could buy the same bundle of goods and services at home and abroad. 
Individual prices have necessarily converged in equilibrium, implying that the Law of One Price (LOP) should 
hold. However, several imperfections have to be taken into account, implying that the LOP is unlikely to hold 
over reasonable time spans. Prices differ as the preconditions for perfect competition are not met. For example, 
product differentiation of firms and the presence of transaction costs might lead to a lack of competition. In addi-tion, 
The currency conversion is done by the nominal exchange rate S which is defined as the number of units of 
domestic currency for a unit of foreign currency. Deviations from the LOP would signal unexploited profit oppor-tunities. 
In the absence of transportation and other transaction costs perfect competition will equalize the price 
CASE Network Reports No. 76/2007 
Ch. Dreger, K. Kholodilin, K. Lommatzsch, J. Slacalek, P. Wozniak 
Part II: 
Competition 
and price convergence 
14 
some goods and services are not tradable. As arbitrage does not occur for these products, their prices are not 
determined by foreign conditions, but by local factors such as preferences and cost structures. In addition, price 
levels of poorer countries are expected to be lower than those of countries with higher income. While the implica-tions 
of a catching up process to the richer countries are discussed in the next section, this chapter focuses on the 
competition aspect. 
II.1 The Law of One Price 
The starting point for assessing price convergence in an integrated market is the Law of One Price (LOP). It states 
that a product must sell for the same price in all locations of the integrated market. Note that the LOP is different 
from the purchasing power parity (PPP) condition. The latter states that the LOP should hold on the average, i.e. 
equal baskets of goods and services should cost the same. For example, PPP can be fulfilled, even if the LOP does 
not hold in any individual product market. According to the LOP, the domestic price P is equal to the foreign price 
P*, after both price levels have been expressed in the same currency: 
(1) P SP∗ = 
MC 
, 1 1/ | | y p 
P 
ε 
= 
− 
, 
C / 
L 
∂ ∂ 
( / )(1 1/ | |) y p 
P 
Y L ε 
= 
∂ ∂ − 
P = (1+η)MC , η = f (ε, gap, ptm)
instantaneously by arbitrage in the product markets. For example, if the domestic exceed foreign prices, it would be 
profitable to buy products abroad and sell them at home. In consequence there is a flow of products from cheaper 
to more expensive countries. The additional supply puts a downward pressure on the domestic price until the 
equilibrium is restored. Then there is no longer motivation for arbitrage transactions. Under these circumstances, 
prices are fully determined by international forces. This implies that domestic factors do not play any role in the 
price setting behaviour of firms, unless the region considered is large compared to the size of the entire market. 
The LOP is based on a number of idealizing assumptions. In particular, all firms are faced by the same horizontal 
demand curve and choose optimal quantities supplied. In equilibrium, marginal costs are equal to marginal rev-enues, 
i.e. product prices. Each firm might have a different cost function but this does not affect the price, just the 
quantity produced. The price of an individual product is exogenous for all firms and consumers, and determined 
by demand and supply decisions in the integrated market. This means that there are a large number of producers 
and consumers, none of them has the power to influence the price, agents are not able to collude, and firms can 
freely enter and exit the market without significant costs. 
In the real world, several caveats need to be taken into account. Impediments to perfect competition might in-clude 
cross country differences in the phase of the business cycle (demand pressure), market segmentation, regu-lations 
on product and labour markets, different consumer preferences at home and abroad, and transportation. 
Moreover, not all products and factors can be classified as tradable in international markets. Competitive pressures 
are less important in these cases. 
In the presence of transportation costs, barriers to trade, and other transaction costs, arbitrage might not oc-cur. 
Profits resulting from arbitrage are not large enough to cover the costs. These costs generates a neutral band 
around the equilibrium price where local prices can fluctuate independently from any competition pressures (Obst-feld 
and Taylor, 1997). Prices adjust only outside the band. Although barriers such as tariffs and similar regulations 
are not relevant for the Internal Market, non tariff barriers could be still important. Special inspection require-ments 
on food imports and different national standards such as warranties can foster market differentiation and 
monopolistic competition, where firms have some pricing power (Rogoff 1996). 
International trade is not limited to final products, but also to the inputs needed for production (Engel and Rog-ers, 
1996, Crucini, Telmer and Zachariadis, 2005). Deviations from the LOP can occur due to cross country differ-ences 
in non traded and traded factor input costs, and to the differences in the production shares of these inputs. 
While the costs of tradable inputs are determined in an integrated market, the costs of the non tradable inputs 
are specific for the country considered. The final price can be decomposed into different stages of the production 
process. At each stage potential elements can affect price dispersion. For example, Corsetti and Dedola (2005) have 
emphasized the role of the distribution sector. Due to non tradable retail services, the intensity of competition need 
not be always reflected in prices. Different local costs can account for price differentials that do not open any profit 
opportunities arising from arbitrage, see also Wolf (2003). 
A bias towards goods and services produced in a country may also cause a segmentation of markets. It can oc-cur 
due to differences in quality or because of reputation problems, see Obstfeld and Rogoff (1996) and Benigno 
and Thoenissen (2003). Furthermore, a preference in favour of local products might exist because of traditions, 
climate, culture or different languages. As arbitrage does not take place, prices are also not forced to converge in 
these cases. Instead, they are determined by local factors. A border effect has been suggested by Engel (1993). It 
might be traced, to sticky prices, a home goods bias, and also the fact that prices of non tradable inputs are more 
similar within a country than across states. For instance, labour mobility is more pronounced within an economy 
than internationally. 
CASE Network Reports No. 76/2007 
Price convergence in the enlarged internal market 
15
II.2 Price setting models in segmented markets 
Often firms are able to segment markets and reduce competition with strategies of product differentiation, local 
variants, product bundling, and special additional services. Differentiation implies that products are not homog-enous 
where MC is marginal costs and εy,p is the elasticity of demand with respect to prices, i.e. the negative slope of 
the demand curve at some price level. Note that this approach includes the LOP as a special case: if markets are 
fully competitive, the elasticity would tend to infinity in absolute value, and prices and marginal costs coincide. 
The lower the elasticity in absolute value is, however, the smaller is the reaction of demand to price changes, and 
the higher the mark up firms can exploit. Provided that labour input L is the variable input factor to production at 
least over short time intervals, the price setting formula can be rewritten as 
is specified, with gap as the output gap, i.e. a measure of excess demand over the business cycle, and a pricing 
to market variable, measured as the degree of the exchange rate pass through (Romer, 2001, Smets and Wouters, 
2002). Country price levels will depend on these arguments. 
The lower the demand elasticity is in its absolute value, the lower the pressure from competition and the higher the 
mark up. An increase in the output gap could also raise the mark up, as firms might adjust prices easier in periods of 
economic upturns. But, the interpretation is controversial on this point. Recent work has stressed that the mark up 
may be nonstationary (Banerjee and Russell, 2004, 2005). Thus only its short run part is related to the business cycle, 
as it exhibits stationary fluctuations. While the mark up seems to be negatively related to inflation in the long run, it 
behaves countercyclical in the short run. In an environment of uncertainty and asymmetric loss functions, imperfect 
competitive firms might set their mark ups below profit maximizing values, in particular in higher inflation periods. 
The costs in terms of lost profits exceed those arising from the lower level of the mark up. 
Mark up pricing behaviour is also the basis of approaches to explain the stickiness of prices. A key feature of 
these models initially advocated by Taylor (1982) and Calvo (1983) is that forward looking firms fully understand 
the necessity to reoptimize prices in a periodic way. Therefore, they are able to front load future expected mar-ginal 
costs into their current price. Firms behave in this manner as they might not be able to raise prices when the 
higher marginal costs materialize. Similarly, to avoid a relative decline in their own prices, firms transmit expected 
CASE Network Reports No. 76/2007 
Ch. Dreger, K. Kholodilin, K. Lommatzsch, J. Slacalek, P. Wozniak 
16 
in different locations of the market. In monopolistic competitive markets, firms have some power to charge 
a premium over marginal production costs, thereby raising their profits. Thus, prices include a mark up over 
marginal costs, i.e. 
(2) 
P SP∗ = 
MC 
, 1 1/ | | y p 
P 
ε 
= 
− 
, 
C / 
L 
∂ ∂ 
( / )(1 1/ | |) y p 
P 
Y L ε 
= 
∂ ∂ − 
MC 
P = (1+η)MC , η = f (ε, gap, ptm) 
1 
T N P Pα P −α = 
* 
T T P = SP 
C L 
∂ ∂ 
C L 
∂ ∂ 
* * 
MC 
W Y W Y 
P L P L 
∂ ∂ 
= = 
∂ ∂ 
* * T T , T T 
T T T T 
= ⎜ ⎟ ⎜ ⎟ = ⎜ ⎜ ⎟ ⎜ ⎟ ⎟ , 
1 W Y / 
L 
S W Y L 
∂ ∂ 
= 
∂ ∂ 
T T T 
* * * 
/ 
T T T 
W Y W Y 
P L P L 
∂ ∂ 
= = 
∂ ∂ 
, * * T N T N W =W =W W =W =W 
* * 
W Y W Y 
P L P L 
∂ ∂ 
= = 
∂ ∂ 
1 W Y / 
L 
S W Y L 
∂ ∂ 
= 
∂ ∂ 
W Y W Y 
P L P L 
∂ ∂ 
= = 
∂ ∂ 
N T N T , T 
N N 
* * N N N N 
1 1 * * * * / * * / * 
α −α −α ⎛ ⎞ ⎛ ⎞ ⎛ ⎛ ∂ ∂ ⎞ ⎛ ∂ ∂ ⎞ ⎞ 
P P P Y L Y L 
S S 
P P P Y L Y L 
1 W Y / 
L 
S W Y L 
∂ ∂ 
= 
∂ ∂ 
T N T T N N 
= T ⎜ T ⎟ ⎜ T 
⎟ = ⎜ ⎜ ⎟ ⎝ ⎠ ⎝ ⎠ ⎝ ⎝ ∂ / ∂ ⎟ ⎜ ∂ / 
∂ ⎟ T N T T ⎠ ⎝ N N 
⎠ ⎠ 
W Y W Y 
P L P L 
∂ ∂ 
= = 
∂ ∂ 
t t t X = ΛF + u 
i ,t i i ,t j i ,t CPL α βCPL u − Δ = − + 
α −α −α ⎛ ⎞ ⎛ ⎞ ⎛ ⎛ ∂ ∂ ⎞ ⎛ ∂ ∂ ⎞ ⎞ 
W Y W Y 
P L P L 
∂ ∂ 
= = 
∂ ∂ 
P P P Y L Y L 
S S 
P P P Y L Y L 
T N T T N N 
= ⎜ ⎟ ⎜ ⎟ = ⎜ ⎜ ⎟ ⎜ ⎟ ⎟ ⎝ ⎠ ⎝ ⎠ ⎝ ⎝ ∂ ∂ ⎠ ⎝ ∂ ∂ ⎠ ⎠ 
, , 1 , (1 ) i t i i t i t CPL α β CPL u − = + − + 
α −α −α ⎛ ⎞ ⎛ ⎞ ⎛ ⎛ ∂ ∂ ⎞ ⎛ ∂ ∂ ⎞ ⎞ 
P P P Y L Y L 
S S 
λ = −ln(1− β ) , t* = −ln0.5 λ 
(3) 
P SP∗ = 
, 1 1/ | | y p 
P 
ε 
= 
− 
, 
/ 
( / )(1 1/ | |) y p 
P 
Y L ε 
= 
∂ ∂ − 
P = (1+η)MC , η = f (ε, gap, ptm) 
1 
T N P Pα P −α = 
* 
T T P = SP 
* * 
* * T T , T T 
T T T T 
* * * 
/ 
T T T 
, * * T N T N W =W =W W =W =W 
* * 
* * N N , N N 
N N N N 
1 1 * * * * / * * / * 
/ / 
T N T T N N 
t t t X = ΛF + u 
where ∂C/∂L and ∂Y/∂L denote the partial derivatives of costs C and output Y with respect to labour input (Var-ian, 
2006). Apart from a particular market structure, i.e. competitive or monopolistic markets, the optimal price 
depends positively on nominal wages, and negatively on real productivity, as these two components constitute the 
marginal costs. Often, a more general model 
(4) 
P SP∗ = 
, 1 1/ | | y p 
P 
ε 
= 
− 
, 
/ 
( / )(1 1/ | |) y p 
P 
Y L ε 
= 
∂ ∂ − 
P = (1+η)MC , η = f (ε, gap, ptm) 
1 
T N P Pα P −α = 
* 
T T P = SP 
* * 
* * T T , T T 
T T T T 
* * * 
/ 
T T T 
, * * T N T N W =W =W W =W =W 
* * 
* * N N , N N 
N N N N 
1 1 * * * * / * * / * 
T N T T N N
Price convergence in the enlarged internal market 
overall inflation into the prices they control. The number of firms that change prices in a given period is specified 
exogenously, but can be also determined endogenously. Eichenbaum and Fisher (2004) have provided a recent 
review of these approaches. Standard model versions are strongly rejected by the data, as point estimates on the 
frequency of price adjustments are too high and inconsistent with the existing microeconomic evidence (Bills and 
Klenow, 2002). Nevertheless, extended settings that allow for delays in the implementation of the new prices seem 
to be more in line with the experience. 
The key message from the mark up model is that prices in imperfect markets depend on country individual fac-tors, 
such as demand and cost conditions, the state of the business cycle and pricing to market effects. To examine 
price convergence, price differentials across economies have to be explored. Therefore, appropriate models are 
built upon the respective variables of the home and foreign country. 
In addition to the impact of country specific determinants, trade openness plays a vital role. Recent studies have 
stressed the increasing role of global drivers to explain price and inflation dynamics, in particular in industrialized 
countries, see Pain, Koske and Sollie (2006), Borio and Filardo (2006) and Mumtaz and Surico (2006). Almost 70 
percent of the inflation variance in the OECD countries can be explained by their first common component, see 
Ciccarelli and Mojon (2006). Competitive pressures and openness to foreign trade are closely related. Trade open-ness 
has raised both in industrial and emerging market economies over the past 35 years. The increase has been 
even stronger in the emerging economies, including the New Member States. While openness, measured as a ratio 
of the sum of exports and imports to GDP has risen from 70 to 90 percent of GDP in the Old Member States, many 
of the New Member States exhibit shares from 90 to 180 percent. Eventually these economies have become more 
competitive due to market reforms and deregulation. Internalization of markets should lead to higher competition 
between firms, improve the allocation of capital, and increase efficiency. For example, domestic firms in the New 
Member States had to face competition from the Old Member States. They had to lower their prices and cut mark 
ups to stay in the market. 
II.3 Empirical evidence on the competition effect 
The LOP provides the basic mechanism on why prices should converge in the Internal Market. The pressure of 
competition will lead to a convergence of prices towards the price of the most efficient supplier. As stated above, 
several imperfections have to be acknowledged in the real world, especially in the short and medium run. Not 
surprisinggly, the evidence in favour of the LOP is very limited, and if support could be established, it is mostly 
related to the long run. In this section, results on the LOP are reviewed. The presentation is focused on the LOP 
and does not cover the PPP condition, which restates the LOP in terms of a basket of products. In the PPP analy-sis, 
additional problems occur due to different weighting schemes of goods and services within the domestic and 
foreign basket. 
Furthermore, the discussion is focused on papers that refer to price convergence in large markets sharing the same 
currency such as the US and the euro area. In these markets, the effect of exchange rate fluctuations cannot bias 
the evidence. However, for the euro area this is only the case since the launch of the EMU in 1999. In addition, the 
empirical performance of the LOP for identical goods in less integrated markets is considered. Overall, the evidence 
suggests that convergence tends to be faster in integrated markets and for tradable goods. National borders and 
geographical distances between countries exert an adverse effect on integration. Nevertheless, a competition effect 
appears to be significant and robust, but its impact on the path of price convergence does not seem to be very strong. 
The Law of One Price for identical goods in less integrated markets 
Haskel and Wolf (2001) have examined the LOP in 25 industrial countries using prices of 100 products sold in 
IKEA stores. The results indicate that price disparities exist and are substantial across countries. Deviations in a 
CASE Network Reports No. 76/2007 17
range between 20 and 50 percent can be detected. This might be due to strategic pricing, local distribution costs, 
taxes and non traded components. The evidence points to strategic pricing, which would lead to different mark 
ups: although relative prices between individual products vary significantly, no clear cut pattern emerged in their 
ordering. Pricing is affected by the behaviour of local competitors, but the relationship could be nonlinear, i.e. 
convergence is faster if price differences are more pronounced. 
Parsley and Wei (2003) looked at the importance of tradable and non tradable ingredients in a Big Mac using 
data from 34 countries. The non tradable component is estimated to exceed 50 percent and can be as large as 60 
percent. The convergence of prices in the tradable components turns out to be relatively fast. Therefore, the slow 
convergence of the price for the entire product is likely due to slow adjustment in the non tradable part. 
The Law of One Price in the US 
Parsley and Wei (1996) have analysed price convergence based on raw prices of 51 products in 48 cities in the 
US during the 1975-92 period. The products are divided into tradables (26), perishables (15) and non tradables 
(10), most of them services. While perishables show the highest dispersion across cities, services exhibit the largest 
price differential on average. Price convergence is investigated by unit root tests to the price differentials for each 
product. It should be noted, however, that a unit root analysis is not completly suited to study the convergence 
phenomenon. Even if price differentials are stationary, price dispersion might increase. 
Given this remark, the null hypothesis of a random walk is rejected for tradables and for most perishables and 
services. Hence, price differentials do not contain stochastic trends, and prices should move together in the long 
run. Convergence appears to be slower for services than for perishables and tradables. But the result is hardly ro-bust, 
CASE Network Reports No. 76/2007 
Ch. Dreger, K. Kholodilin, K. Lommatzsch, J. Slacalek, P. Wozniak 
18 
as the inclusion of city dummies weakens the path of convergence. The analysis reveals that price differentials 
are higher the larger the distances. Therefore, distance exerts an adverse effect on the integration of markets (Engle 
and Rogers, 2001). By exploiting the same dataset, O’Connell and Wei (1997) studied adjustment towards parity by 
linear and nonlinear models. The existence of transaction costs could introduce nonlinearities in the convergence 
process, i.e. a neutral band around the LOP, where arbitrage does not occur. The evidence is broadly in line with 
this prediction. In the linear model, the random walk is rejected only for 7 out of 23 tradables. This would cast seri-ous 
doubts on the validity of the LOP even as a long run condition. However, if nonlinear adjustment are allowed 
for, the evidence against nonstationarity is quite strong. Similar results are found for perishables and services. In 
these cases, adjustment takes more time and is detectable only in some cases. 
Cecchetti, Mark and Sonora (2000) have tested CPI convergence for 19 cities over a longer period (1918-1995) 
using panel unit root tests. Relative CPIs are stationary, and this result seems to be robust across sub periods. 
Anyway, the test statistics might be biased in favour of this conclusion, as they neglect the issue of cross section 
correlation. Furthermore, deviations are long lasting with estimated half lives as large as 9 years. The half life indi-cates 
how long it takes for the impact of a shock to diminish by 50 percent. The distance between locations cannot 
fully rationalize the long lasting adjustment periods: convergence across cities that are closer to each other is a bit 
faster, but this result is not very strong in the data. A faster convergence in the tradables sector is only confirmed 
by some of the tests. 
Engel and Rogers (2001) looked at the dispersion of inflation between US cities using information from 43 
product categories. A volatility ratio is defined, i.e. the numerator refers to deviations in inflation of the same good 
at different locations, i.e. the deviations from the LOP, while the denominator measures the deviations between 
inflation rates in different product in one place. The lower the volatility ratio, the more integrated the market. The 
findings indicate higher volatility ratios in tradables, again questioning the presence of price convergence.
Price convergence in the enlarged internal market 
The Law of One Price in the EU Member States 
Based on a sample of EU cities and individual items data, Rogers (2002) have tested how price dispersion evolved 
between 1990 and 2001, in particular when compared to the US. Price dispersion has declined in the first half of 
the 1990s, mainly for tradables. But no further convergence could be determined after the introduction of the euro 
in 1999. The results of Wolszczak-Derlacz (2006) demonstrate that convergence can even occur due to aggregation, 
since the magnitude of price dispersion is larger on the micro than on the macro level. 
Lutz (2002) has studied a wide array of individual prices to see whether the introduction of the euro has led to 
higher convergence. Price dispersion is compared between euro and non euro area countries before and after the 
introduction of the common currency. Only for the minority of products, a euro effect can be detected. Allington, 
Kattuman and Waldmann (2004) and Engel and Rogers (2004) did not find an additional downward shift in price 
level dispersion in response to the euro introduction. While dispersion declined between 1995 and 1997, it re-mained 
unchanged thereafter. Goldberg and Verboven (2004, 2005) have investigated the EU car market over the 
last three decades. Here, transport costs are relatively low compared to the price of the product. The LOP holds 
quite well in terms of price changes, but there is a lack of price level convergence. Price dispersion has only slightly 
decreased after the euro was introduced. The euro did not speed up convergence after 2002. 
In principle, the introduction of the euro has reduced currency costs and exchange risk, while price transparency 
has been improved. This should lead to higher price convergence. However, the empirical evidence on this claim 
seems to be quite inconclusive. Nevertheless, it should be noted that most research has focused on the impact of the 
common currency on the path of consumer price convergence and therefore relied on a cost of living concept. In 
contrast, Andrén and Oxelheim (2006) have looked at the development of producer prices in the transition from a 
national exchange rate regime to the currency union. Convergence of producer prices is equally significant before 
and after the introduction of the euro. To the extent that developments in producer prices are passed through to 
consumer prices, a further potential for convergence seems to exist in the euro area over the years to come. 
Mathä (2005) has explored price differentials between Luxembourg and its neighbouring economies. Many com-muters 
cross borders every day and are able to compare prices. The study is based on store prices in Luxembourg 
and near distant towns in Germany (Trier), France (Metz) and Belgium (Arlon). Six stores of a similar size are 
included, and prices of branded goods available in all countries are compared. Transaction costs are proxied by 
the distance between stores, and national borders. Also a dummy is included to control for habit persistence be-cause 
of the former currency union between Belgium and Luxembourg. On average, differences between a pair of 
prices amount to 13 percent, with a standard deviation of 12 percentage points. Distance and border variables are 
important to explain the dispersion. In addition, the currency union exerts a significant impact. For example, price 
differentials between Luxembourg and Belgium are lower by 2.2 percentage points. 
Due to lower costs of arbitrage, among others, exchange rate stability seems to promote price convergence. This 
claim can be restated for the former currency union between Luxembourg and Belgium (Mathä, 2005), but also 
for the founding members of the euro area. In fact, price dispersion is relatively low and closely to the US figures 
(Rogers, 2002). However, these effects might occur as long term benefits, and can hardly be detected in short time 
intervals. 
The impact of the liberalisation of the network industries and internet trade on price convergence has been ex-amined 
by the EU Commission (2001). Although liberalisation of markets led to a decline in prices especially in tel-ecommunications, 
price dispersion between EU members has not decreased. For example, prices are substantially 
lower in gas producing countries. 
Crucini, Telmer and Zachariadis (2005) have employed cross sectional variances to determine whether the vari-ability 
in price differentials is related to tradable or non tradable inputs. While deviations from the LOP are quite 
large the mean of the distribution is often close to 0. Price dispersion did not show a trend pattern over time. 
CASE Network Reports No. 76/2007 19
However, non traded goods have higher price dispersion compared to tradables. A similar conclusion holds for 
products with a substantial share of non traded inputs. 
A few studies have modelled the impact of the euro on real exchange rate developments in the euro area. For 
example, Koedijk, Tims and van Dijk (2004) reported some evidence in favour of stationarity of real exchange rates 
for euro area countries. This result is obtained if cross country heterogeneities like different rates of mean rever-sion 
CASE Network Reports No. 76/2007 
Ch. Dreger, K. Kholodilin, K. Lommatzsch, J. Slacalek, P. Wozniak 
20 
within the euro area are acknowledged. The evidence for stationary real exchange rates is quite stronger than 
outside the euro area. Thus, the process of European integration seems to accelerate convergence. 
Openness to trade and competition 
The substantial increase in openness has likely put a downward pressure on prices. Domestic factors become 
less important in particular for tradables. Insights can be revealed from sectoral studies which relate the increase 
in sectoral prices to the extent that these industries are subject to international competition. Chen, Imbs and Scott 
(2006) have reported estimates for the competition effect for manufacturing sectors in some EU countries, i.e. the 
size by which prices and mark ups fall and productivity is enhanced due to intensified competition. Explanatory 
variables are domestic and foreign openness (import penetration), the number of firms in domestic and foreign 
markets and aggregate prices. Competition exerts a positive, albeit small, but significant effect in the short run. In 
the long run, however, the analysis suggests that the effect diminishes and can even reverse. As domestic firms face 
tougher competition they might relocate production abroad into more the protected and less competitive regions. 
Additional evidence has been reported by the IMF (2006) for industrialized countries. In sectors that are exposed 
to intensified competition, such as manufacturing and business services, producer prices has increased less than 
headline inflation especially after 1995. A possible explanation of this finding could be the extent of deregulation 
in important business services such as telecommunications. In addition, the IMF (2006) has found that prices in 
high tech sectors declined less than in low tech sectors. This might reflect a tendency to outsource larger parts of 
the production of low tech products in low wage countries. 
Moreover, prices have grown more slowly in sectors which are exposed to international competition, such as 
textiles, telecommunications and electrical equipment. A 1 percent increase in the import share (imports divided 
by output of the respective sector) reduces relative producer price inflation by less than 0.2 percent on the average 
of the products considered. Similar effects are found for an increase in labour productivity. The impact of com-petitiveness 
on price dynamics seems to have accelerated as integration has intensified due to the globalization of 
markets. Although significant and robust to alternative specifications, the impact of the competition variable does 
not seem to be very strong, and other variables are important as well. For example, the effect of a rise in the import 
share on producer price inflation is slightly lower than the effect of a change in import prices in absolute value.
Price convergence in the enlarged internal market 
Part III: 
Catching up and 
price convergence 
As the empirical support in favour of the LOP is rather limited, prices are not entirely determined by competi-tive 
pressures in the Internal Market, and domestic factors need to be taken into account. For developments in the 
New Member States additional forces come into play. While initial price levels were lower, these countries have 
experienced an upward trend in price aggregates and a real appreciation of their currencies thereafter. This evo-lution 
is not related to the functioning of the Internal Market. According to the Balassa Samuelson hypothesis, it 
might reflect the catching up process of productivity and per capita income that imply differences in the patterns 
of consumption and production. If convergence towards the EU15 level of per capita income proceeds, prices will 
rise, implying that price differentials will gradually diminish. Hence, price convergence is related both to market 
integration and convergence in per capita income. The two effects overlap each other and have to be disentangled 
on empirical grounds. 
A lower price level is due to the fact, that the differential between productivity in the tradables and non trada-bles 
sector is lower for the poorer countries, as long as they catch up to the richer ones. This point is especially 
relevant for the New Member States but also for southern regions within the euro area. To the extent that inflation 
differentials are caused by catching up behaviour, they will not affect competitiveness and disappear when real 
convergence is achieved. Thus a part of the divergent inflation experience in the euro area might be transitory, as 
the countries move towards a common price level (Rogers, Hufbauer and Wada, 2001). If the euro area widens to 
include low price countries in Eastern and Central Europe, inflation in the New Member States can substantially 
increase if price convergence is fastened. 
III.1 The Balassa-Samuelson hypothesis 
According to the Balassa-Samuelson model (Balassa 1964, Samuelson 1964) the existence of non tradables can 
imply differences in aggregate price levels and the presence of trends in the evolution of relative prices, i.e. real 
exchange rates. The model is also able to demonstrate why price levels of poorer countries are lower than those of 
countries with higher income. Specifically, the economy is divided into a sector producing internationally traded 
goods and a sector with non traded goods. The overall price index is a (geometrically) weighted average of the 
prices for tradable (T) and non tradable (N) goods, i.e. 
CASE Network Reports No. 76/2007 21
1 1/ | | y p 
MC 
MC 
C L 
∂ ∂ 
C L 
∂ ∂ 
C L 
∂ ∂ 
where 0<α <1 denotes the share of tradables in the price index. A similar decomposition holds for the foreign 
MC 
country, where α is assumed to be equal for simplicity. A different weight for the foreign country does not affect the 
major conclusions. Due to goods arbitrage the price of tradables is determined by the price of foreign tradables, 
both denoted in the same currency. The LOP is assumed to hold, but only in the tradables sector: 
C L 
∂ ∂ 
MC 
As competition is perfect, the real wage in the tradables sector is equal to the marginal product of labour 
C L 
∂ ∂ 
MC 
W Y W Y 
P L P L 
∂ ∂ 
= ∂ ∂ C ∂ 
L 
= 
∂ 
where W denotes the nominal wage and an asterisk refers to the foreign country. Because of equation (6) the 
relationship 
W Y W Y 
P L P L 
∂ ∂ 
= = 
∂ ∂ 
is implied. If the nominal exchange rate is constant, relative wages in the tradables sector are expected to move 
in line with relative productivity in this sector. Countries with higher productivity in the tradables sector are able 
to pay higher W ∂ Y W ∂ 
Y 
= wages, while countries = 
with lower productivity have a lower wage level. As labour mobility is perfect 
across the P sectors ∂ L within a P country, ∂ 
L 
nominal wages in the tradables and non tradables sector are expected to equal-ize: 
1 W Y / 
L 
S W Y L 
Y W Y 
∂ ∂ 
= 
∂ ∂ 
= T ∂ T T 
∂ 
= 
∂ ∂ 
Again, this assumption can be easily weakened without affecting the main findings. As the nominal wage is set in 
line with the productivity in the tradables sector, this condition implies that services in the less productive country 
are cheaper. Given that competition for non tradables is perfect, but only within each country, wages are equal to 
their marginal products: 
1 W Y / 
L 
S W Y L 
∂ ∂ 
= 
∂ ∂ 
T T T 
The perfect competition assumption for non tradables within a country simplifies the presentation and does 
not affect the principal argument. The Balassa-Samuelson point can be also made by the mark-up model. Putting 
things together, an expression for the equilibrium real exchange rate can be derived. Using (5), (7), (8), (9) and (10) 
in (1), the condition 
CASE Network Reports No. 76/2007 
C L 
∂ ∂ 
Ch. Dreger, K. Kholodilin, K. Lommatzsch, J. Slacalek, P. Wozniak 
(5) 
2 
, 
/ 
( / )(1 1/ | |) y p 
P 
Y L ε 
= 
∂ ∂ − 
P = (1+η)MC , η = f (ε, gap, ptm) 
1 
T N P Pα P −α = 
* 
T T P = SP 
* * 
, 
W Y W Y 
P L P L 
∂ ∂ 
= = 
∂ ∂ 
* * T T , T T 
T T T T 
1 W Y / 
L 
S W Y L 
∂ ∂ 
= 
∂ ∂ 
T T T 
* * * 
/ 
W Y W Y 
P L P L 
T ∂ T T 
∂ 
= = 
∂ ∂ 
W Y W Y 
P L P L 
∂ ∂ 
= = 
∂ ∂ 
, * * T N T N W =W =W W =W =W 
* * 
1 W Y / 
L 
S W Y L 
∂ ∂ 
= 
∂ ∂ 
T T T 
1 W Y / 
L 
S W Y L 
∂ ∂ 
= 
∂ ∂ 
W Y W Y 
P L P L 
T ∂ T T 
∂ 
= = 
∂ ∂ 
* * N N , N N 
N N N N 
1 W Y / 
L 
S W Y L 
∂ ∂ 
= 
∂ ∂ 
T T T 
1 1 * * * * / * * / * 
α −α −α ⎛ ⎞ ⎛ ⎞ ⎛ ⎛ ∂ ∂ ⎞ ⎛ ∂ ∂ ⎞ ⎞ 
P P P Y L Y L 
S S 
P P P Y L Y L 
T N T T N N 
= ⎜ ⎟ ⎜ ⎟ = ⎜ ⎜ ⎟ ⎜ ⎟ ⎟ ⎝ ⎠ ⎝ ⎠ ⎝ ⎝ ∂ / ∂ ⎠ ⎝ ∂ / 
∂ ⎠ ⎠ 
W Y W Y 
P L P L 
∂ ∂ 
= = 
∂ ∂ 
T N T T N N 
1 W Y / 
L 
S W Y L 
∂ ∂ 
= 
∂ ∂ 
T T T 
W Y W Y 
P L P L 
∂ ∂ 
= = 
∂ ∂ 
t t t X = ΛF + u 
W Y W Y 
P L P L 
∂ ∂ 
= = 
∂ ∂ 
α −α −α ⎛ ⎞ ⎛ ⎞ ⎛ ⎛ ∂ ∂ ⎞ ⎛ ∂ ∂ ⎞ ⎞ 
P P P Y L Y L 
S S 
P P P Y L Y L 
T N T T N N 
= ⎜ ⎟ ⎜ ⎟ = ⎜ ⎜ ⎟ ⎜ ⎟ ⎟ ⎝ ⎠ ⎝ ⎠ ⎝ ⎝ ∂ ∂ ⎠ ⎝ ∂ ∂ ⎠ ⎠ 
α −α −α ⎛ ⎞ ⎛ ⎞ ⎛ ⎛ ∂ ∂ ⎞ ⎛ ∂ ∂ ⎞ ⎞ 
i ,t i i ,t j i ,t CPL α βCPL u − Δ = − + 
P P P Y L Y L 
S S 
P P P Y L Y L 
T N T T N N 
= ⎜ ⎟ ⎜ ⎟ = ⎜ ⎜ ⎟ ⎜ ⎟ ⎟ ⎝ ⎠ ⎝ ⎠ ⎝ ⎝ ∂ ∂ ⎠ ⎝ ∂ ∂ ⎠ ⎠ 
α −α −α ⎛ ⎞ ⎛ ⎞ ⎛ ⎛ ∂ ∂ ⎞ ⎛ ∂ ∂ ⎞ ⎞ 
P P P Y L Y L 
S S 
P P P Y L Y L 
W Y W Y 
P L P L 
∂ ∂ 
= = 
∂ ∂ 
T N T T N N 
= ⎜ ⎟ ⎜ ⎟ = ⎜ ⎜ ⎟ ⎜ ⎟ ⎟ ⎝ ⎠ ⎝ ⎠ ⎝ ⎝ ∂ ∂ ⎠ ⎝ ∂ ∂ ⎠ ⎠ 
, , 1 , (1 ) i t i i t i t CPL α β CPL u − = + − + 
λ = −ln(1− β ) , t* = −ln0.5 λ 
(6) 
, MC 
P 
ε 
= 
− 
, 
/ 
( / )(1 1/ | |) y p 
P 
Y L ε 
= 
∂ ∂ − 
P = (1+η)MC , η = f (ε, gap, ptm) 
1 
T N P Pα P −α = 
* 
T T P = SP 
* * 
* * T T , T T 
T T T T 
* * * 
/ 
T T T 
, * * T N T N W =W =W W =W =W 
* * 
* * N N , N N 
N N N N 
1 1 * * * * / * * / * 
/ / 
T N T T N N 
t t t X = ΛF + u 
i ,t i i ,t j i ,t CPL α βCPL u Δ = − + 
W Y W Y 
P L P L 
α − α −α ⎛ ⎞ ⎛ ⎞ ⎛ ⎛ ∂ ∂ ⎞ ⎛ ∂ ∂ ⎞ ⎞ 
∂ ∂ 
= = 
∂ ∂ 
P P P Y L Y L 
S S 
P P P Y L Y L 
T N T T N N 
= ⎜ ⎟ ⎜ ⎟ = ⎜ ⎜ ⎟ ⎜ ⎟ ⎟ ⎝ ⎠ ⎝ ⎠ ⎝ ⎝ ∂ ∂ ⎠ ⎝ ∂ ∂ ⎠ ⎠ 
, , 1 , (1 ) i t i i t i t CPL α β CPL u − = + − + 
α −α −α ⎛ ⎞ ⎛ ⎞ ⎛ ⎛ ∂ ∂ ⎞ ⎛ ∂ ∂ ⎞ ⎞ 
W Y W Y 
P L P L 
∂ ∂ 
= = 
∂ ∂ 
P P P Y L Y L 
S S 
P P P Y L Y L 
T N T T N N 
= ⎜ ⎟ ⎜ ⎟ = ⎜ ⎜ ⎟ ⎜ ⎟ ⎟ ⎝ ⎠ ⎝ ⎠ ⎝ ⎝ ∂ ∂ ⎠ ⎝ ∂ ∂ ⎠ ⎠ 
λ = −ln(1− β ) , t* = −ln0.5 λ 
(7) 
P SP∗ = 
, 1 1/ | | y p 
P 
ε 
= 
− 
, 
/ 
( / )(1 1/ | |) y p 
P 
Y L ε 
= 
∂ ∂ − 
P = (1+η)MC , η = f (ε, gap, ptm) 
1 
T N P Pα P −α = 
* 
T T P = SP 
* * 
* * T T , T T 
T T T T 
* * * 
/ 
T T T 
, * * T N T N W =W =W W =W =W 
* * 
* * N N , N N 
N N N N 
1 1 * * * * / * * / * 
/ / 
T N T T N N 
t t t X = ΛF + u 
i ,t i i ,t j i ,t CPL α βCPL u − Δ = − + 
, , 1 , (1 ) i t i i t i t CPL α β CPL u − = + − + 
λ = −ln(1− β ) , t* = −ln0.5 λ 
(8) 
P SP∗ = 
, 1 1/ | | y p 
P 
ε 
= 
− 
, 
/ 
( / )(1 1/ | |) y p 
P 
Y L ε 
= 
∂ ∂ − 
P = (1+η)MC , η = f (ε, gap, ptm) 
1 
T N P Pα P −α = 
* 
T T P SP 
* * 
* * T T , T T 
T T T T 
* * * 
/ 
T T T 
, * * T N T N W =W =W W =W =W 
* * 
* * N N , N N 
N N N N 
1 1 * * * * / * * / * 
/ / 
T N T T N N 
t t t X = ΛF + u 
i ,t i i ,t j i ,t CPL α βCPL u − Δ = − + 
, , 1 , (1 ) i t i i t i t CPL α β CPL u − = + − + 
λ = −ln(1− β ) , t* = −ln0.5 λ 
(9) 
P SP∗ = 
, 1 1/ | | y p 
P 
ε 
= 
− 
, 
/ 
( / )(1 1/ | |) y p 
P 
Y L ε 
= 
∂ ∂ − 
P = (1+η)MC , η = f (ε, gap, ptm) 
1 
T N P Pα P −α = 
* 
T T P = SP 
* * 
* * T T , T T 
T T T T 
* * * 
/ 
T T T 
, * T N T N W =W =W W =W =W 
* * 
* * N N , N N 
N N N N 
1 1 * * * * / * * / * 
/ / 
T N T T N N 
t t t X = ΛF + u 
i ,t i i ,t j i ,t CPL α βCPL u − Δ = − + 
α −α −α ⎛ ⎞ ⎛ ⎞ ⎛ ⎛ ∂ ∂ ⎞ ⎛ ∂ ∂ ⎞ ⎞ 
P P P Y L Y L 
S S 
P P P Y L Y L 
T N T T N N 
= ⎜ ⎟ ⎜ ⎟ = ⎜ ⎜ ⎟ ⎜ ⎟ ⎟ ⎝ ⎠ ⎝ ⎠ ⎝ ⎝ ∂ ∂ ⎠ ⎝ ∂ ∂ ⎠ ⎠ 
, , 1 , (1 ) i t i i t i t CPL α β CPL u − = + − + 
λ = −ln(1− β ) , t* = −ln0.5 λ 
(10) 
P SP∗ = 
, 1 1/ | | y p 
P 
ε 
= 
− 
, 
/ 
( / )(1 1/ | |) y p 
P 
Y L ε 
= 
∂ ∂ − 
P = (1+η)MC , η = f (ε, gap, ptm) 
1 
T N P Pα P −α = 
* 
T T P = SP 
* * 
* * T T , T T 
T T T T 
* * * 
/ 
T T T 
, * * T N T N W W =W W =W =W 
* * 
* * N N , N N 
N N N N 
1 1 * * * * / * * / * 
/ / 
T N T T N N 
t t t X = ΛF + u 
i ,t i i ,t j i ,t CPL α βCPL u − Δ = − + 
, , 1 , (1 ) i t i i t i t CPL α β CPL u − = + − + 
λ = −ln(1− β ) , t* = −ln0.5 λ 
(11) 
P SP∗ = 
, 1 1/ | | y p 
P 
ε 
= 
− 
, 
/ 
( / )(1 1/ | |) y p 
P 
Y L ε 
= 
∂ ∂ − 
P = (1+η)MC , η = f (ε, gap, ptm) 
1 
T N P Pα P −α = 
* 
T T P = SP 
* * 
* * T T , T T 
T T T T 
P L P L 
* * * 
/ 
T T T 
, * * T N T N W =W =W W =W =W 
* * 
* * N N , N N 
N N N N 
1 1 * * * * / * * / * 
/ / 
T N T T N N 
t t t X = ΛF + u 
i ,t i i ,t j i ,t CPL α βCPL u − Δ = − +
is implied. The real exchange rate depends on marginal productivity levels in the tradables and non trada-bles 
sectors. Given that productivity in the non tradables sector differs not too much across countries, the 
denumerator is roughly equal to 1. Then, domestic prices will fall below foreign prices as long as productivity 
in the international sector is lower. More generally, the productivity differential between the tradables and 
non tradables sector is smaller in the low price country. In case of a Cobb-Douglas production technology, 
marginal and average productivity coincide. Hence, the conclusion can also be stated in terms of average 
productivity levels. 
As long as price levels are lower in less productive countries, for example in the New Member States when com-pared 
to the Old Member States, the Balassa Samuelson effect is at work. In a dynamic perspective, catching up 
countries will experience faster productivity growth in the tradable than in the non tradable sector. Higher produc-tivity 
in the tradable sector allows wages to be bid up in that sector without increasing the price of the tradables 
being produced. The non tradable sector must raise wages in response. However, since productivity is lower, firms 
in this sector must fund the higher wages by raising the price of non tradables. Thus the effect predicts higher infla-tion 
rates in non tradables compared to tradables, implying an increase in the relative price of non tradables. Wage 
growth in the non tradables sector would be somewhat lower provided that labour is not perfectly mobile across 
the sectors. The process results in a real exchange rate appreciation (Δ(SP*/P)<0) and a higher overall inflation 
rate in the domestic economy when the nominal exchange rate is fixed, or through some combination of nominal 
appreciation and inflation if the exchange rate is flexible. 
The productivity gap to the Old Member States is still substantial and allows for massive productivity growth in the 
transition countries. If these economies become more advanced, the Balassa Samuelson effect will gradually disap-pear. 
In the long run, convergence in productivity levels in the traded goods sector would imply convergence of the 
CASE Network Reports No. 76/2007 
Price convergence in the enlarged internal market 
23 
overall price levels. Due to wage spillovers prices of non tradables are also expected to converge in this process. 
III.2 Empirical evidence on the catching up effect 
In general, the presence of the Balassa-Samuelson effect is confirmed, but its magnitude appears to be rather 
small, see Égert (2003) for a review. This finding is partially caused by empirical shortcomings. Instead of the 
ordinary tradables and non tradables distinction, goods and services are produced with a different composition 
of tradable and non tradable inputs. For example, a share of non tradable inputs is required to produce tradable 
products (Lee and Tang, 2003, MacDonald and Ricci, 2001). In addition, the impact of inflation in the services sec-tor 
on price convergence is rather limited because of a low weight of services in representative consumer baskets 
(Blaszkiewicz, Kowalski, Rawdanowicz and Wozniak, 2004). With rising income levels, the relevance of services 
will gradually increase. 
Many contributors have explained the relative price of non traded to traded goods by productivity indicators in 
both sectors or tested for cointegration, i.e. equilibrium relationships between relative prices and productivities. 
Prices in the traded and non traded sectors are often proxied by producer and consumer price indices, respectively, 
where different weighting schemes are neglected. By using a set of control variables, Arratibel, Rodriguez-Palen-zuela 
and Thimann (2002) have concluded that the Balassa Samuelson effect is almost insignificant in explaining 
inflation developments in accession countries. In particular in the early years of transition, market reforms appear 
to be more important in explaining relative price movements. Mihaljek and Klau (2003) has explained inflation 
differentials between six transition economies and the euro area using the spread of productivity growth across 
tradables and non tradables sectors. The contribution of the Balassa Samuelson effect to the annual inflation dif-ferential 
is less than one percentage point except of Slovenia. By employing a very detailed dataset, Égert (2003) 
has estimated the size of the effect between 2 and 3 percentage points for Estonia over the 1993-2002 period. At 
the end of the period the contribution to inflation is found to be less than one percentage point. In fact, Estonia has
converged rather rapidly towards the EU level, both in terms of per capita income and productivity. Similar effects 
have been reported by Kovács (2002) using a sample of five Central and Eastern European countries. 
Other studies have focused on the implications for real exchange rates. De Broeck and Sløk (2001) have inves-tigated 
CASE Network Reports No. 76/2007 
Ch. Dreger, K. Kholodilin, K. Lommatzsch, J. Slacalek, P. Wozniak 
24 
the effect of sectoral productivity growth on real exchange rate developments in a sample of 26 transition 
countries. They find that differential productivity growth between the tradables and non tradables sector exerts a 
different impact on the real exchange rate in the EU accession countries compared to the other economies. Accord-ing 
to Lojschová (2003), the Balassa-Samuelson effect can account for an average annual rate of real appreciation 
of around 2.5 percent. In principle, a constant nominal exchange rate could justify an inflation rate 2.5 percent-age 
points above the rate in the euro area. The size of the effect, however, is smaller, if the assumption of the LOP 
is relaxed for the tradables sector. Wagner (2005) has detected larger BalassaSamuelson effects between the Old 
Member States, see also Hlouskova and Wagner (2004). 
The essential point to be taken from these studies is that catching up is important, but it is likely related to a 
broader concept than the pure Balassa-Samuelson model (Cihak and Holub, 2001, Wagner, 2005, Égert, Halpern 
and MacDonald, 2006). For example, Cihak and Holub (2003) have reported a strong positive relationship between 
GDP per capita and the price level, suggesting that relative per capita income is a powerful variable to proxy a 
catching up effect. As an extension to the pure Balassa Samuelson model, the quality of products, regulated prices 
and reputation problems have to be taken into account. 
Indeed, price behaviour in the New Member States might be influenced by several forces linked to the period of 
transition. Catching up countries could have lower reputation and need to underprice their products to stay in the 
market, see Égert and Lommatzsch (2005) and Lommatzsch and Tober (2005). This effect will gradually diminish 
over the catching up period, as reputation will improve, thereby promoting price convergence. Price levels are not 
uniformly lower in the New Member States, but can differ depending on the product category considered. 
Furthemore, regulated prices constitute an obstacle to price convergence. Although most of the prices have been 
liberalised rather quickly, sensitive prices have been deregulated only gradually, and some of them are still in the 
liberalisation process (Backé, Fidrmuc, Schardax and Reininger, 2002 and MacDonald and Wojcik, 2004). The 
transition countries started from a distorted system of relative prices. While the weight of regulated prices in price 
aggregates does not deviate much from the Old Member States, the size of adjustment differs. Over the catching up 
period, regulations will be reduced, and this will reinforce convergence. In addition, a number of public services 
requiring networks and capital have been of poor quality in the former planned period. The improvement in the 
quality and variety of services from network industries like telecommunications, transport or energy will lead to 
faster price convergence. The prices of these services have an impact on other markets, as they are inputs to other 
products. This may foster the convergence of prices towards the EU12 level.
Price convergence in the enlarged internal market 
Part IV: 
Measuring price convergence 
by comparative price levels 
In this section, the methodological aspects of empirical indicators available for investigating the process of price 
convergence are discussed. �Due to the lack of data on absolute prices, data on relative prices are considered�. In the 
analysis, cross country comparisons are carried out by using comparative price levels (CPLs). They are calculated 
as ratios between purchasing power parities (PPPs) and nominal exchange rates (to the euro). This chapter clarifies 
the construction principles of CPLs, and gives also insights into their limitations. Other aggregates like deflators, 
consumer and producer price indices are also reviewed. 
IV.1 Deflators, consumer and producer price indices 
A serious problem to assess price convergence is the fact that the required data are not easily available. Under the 
LOP, prices of identical goods should equalize in all regions of the Internal Market. But data on prices of individual 
goods are scarce and only a few studies are based on them. Likewise, baskets of identical goods are considered, 
such as the Big Mac Index reported by the Economist or prices in IKEA stores, see Haskel and Wolf (1999, 2001). 
The number of items is often rather small and the selection might not be representative for the entire economy. In 
addition, even the products of the same producer and brand can sell in different sizes at different locations, are 
bundled together with different products or are modified according to local tastes. Therefore, these measures can 
provide only anecdotical evidence on the impact of market integration on the path of price convergence. 
Because of the lack of individual data, aggregate price measures like the GDP deflator, consumer, producer or 
wholesale price indexes are often used instead. Indexes also exist for specific components of the major price indexes. 
The indicators are harmonised across countries and are available over long time spans. They contain a large bundle 
of representative goods and services and reveal more information on overall price developments than a arbitrary 
choice of a few items. The main objective of the indicators is, however, to determine the change in price level. 
Specifically, the GDP deflator is useful to determine real growth in the entire economy. It is applied to nominal 
GDP to derive the real GDP series. Hence, it compares prices of the output aggregate over different periods of time. 
Subindicators include deflators for particular expenditure components, such as private and government consump-tion, 
fixed business and government investment, construction, and exports and imports of goods and services. 
The consumer price index (CPI) monitors the average change in the prices consumers pay for a certain basket 
of products, i.e. it measures the changes in the purchasing power of households. In this sense, the CPI can be 
CASE Network Reports No. 76/2007 25
seen as a proxy for the change in the cost of living over time. The representative basket is derived from budget 
surveys and includes goods and services actually purchased by private households regardless on whether they 
are produced at home or abroad. In addition, special indexes focus on some of the major components, for in-stance 
CASE Network Reports No. 76/2007 
Ch. Dreger, K. Kholodilin, K. Lommatzsch, J. Slacalek, P. Wozniak 
26 
the CPI of all items less food and energy. The producer price index (PPI) reflects average changes of prices 
that producers receive for a basket of goods and services at all stages of the manufacturing process, from crude 
materials to finished products. Subindicators of the PPI include the PPI for chemicals and manufactured goods, 
among others. 
Since the deflators, CPIs and PPIs are intended to calculate the changes in prices in the economy, they reflect in-flation 
rates but not absolute prices. The indexes may be used to investigate price comovements across countries. In 
particular, inflation rates are expected to move together in the long run provided that a relative version of the LOP 
is fulfilled. If arbitrage works sufficiently well, inflation differentials are stationary and will cancel out gradually 
over time. In shorter time intervals, however, national inflation rates may differ substantially. It should be noted 
that inflation divergence across countries can also reflect adjustment towards the same price level, i.e. it is caused 
by different initial conditions. 
The relative version of the LOP does not require that the weighting schemes of goods and services in price ag-gregates 
are the same at home and abroad. However, if differences exist, they need to be rather stable over time. 
This assumption does not hold in a sample of EU25 countries: the weights are affected by income levels, which are 
quite different between the New and Old Member States. Therefore, structural factors put a serious bias on tests 
of the relative variant of the LOP. 
Regarding price convergence, aggregates like the CPI are informative for the catching up process in the New 
Member States, as they inform about the evolution of the cost of living. But they contain less information about 
advances in competition, as they reflect cumulated inflation rates and not absolute price levels. The latter remains 
unknown in an analysis based on CPI and PPI measures. Moreover, �the extreme focus on the representativity of 
goods and services for the country considered makes them less useful for cross country comparisons. 
IV.2 Comparative price levels 
To enable the comparison of price levels across countries, Eurostat and the OECD have undertaken the European 
Comparison Programme which produces PPPs and comparative price levels for a number of product categories. 
At the most detailed level, PPPs are labelled as basic headings (Eurostat, 2005). The basic headings are related to 
expenditure categories that are not disaggregated further. For example, cheese is a basic heading, and cheddar, 
camembert, roquefort, feta, gorgonzola, and gouda are specific individual products that share the same basic head-ing. 
Expenditures of cheese are reported by countries, but expenditures of cheese varities remain unpublished. 
Different basic headings include a different number of goods and services, depending on the complexity and the 
heterogeneity of the product group considered. 
The basic headings are calculated as unweighted (geometric) averages of the price ratios of goods and services 
within the same heading, see the Eurostat (2005) manual for the details. Because these ratios are not weighted 
cross country differences in the structure goods and services within the same basic heading are ignored. Countries 
have to price not only the items which are representative for their own market, but also at least one item repre-sentative 
in the other countries. Some missing country pairs can be calculated through a bridging procedure. The 
basic headings are robust against any differences in the preference structure at home and abroad. If country A 
consumes more high quality and expensive products than country B, this has no consequence for the basic head-ings, 
as all products enter the calculation with equal weights. Likewise, a move to higher quality products in B does 
not show up in the basic headings unless individual prices adjust. Eurostat does not publish the basic headings on 
a regular basis, but they can be found in specialized publications.
Price convergence in the enlarged internal market 
Purchasing power parities (PPPs) are defined for different GDP aggregates from very detailed (basic headings) to 
highly aggregated levels (final consumption expenditures of households and GDP). PPPs are the rates of currency 
conversion that equalise the purchasing power of different currencies by eliminating differences in price levels. 
PPPs are obtained as relative prices, i.e. they show the ratio of prices expressed in national currencies for the same 
good or service in different countries. It is important to note that country specific weighting schemes are not ap-plied 
if PPPs are expressed for basic headings (Eurostat, 2005). 
PPPs for basic headings are combined with those from other basic headings to provide a PPP for each stage of 
the aggregation process. For example, the PPP of the entire consumer basket aggregate is based on data for 147, 
and final household consumption expenditures comprise 226 basic headings. Aggregated PPPs are calculated as 
Fisher-type PPPs, i.e. as the geometric mean of the Laspeyres and Paasche type indices. In the combination of PPPs, 
the technique proposed by Esteto, Koves and Szulc (EKS) is applied, which computes the nth root of the product 
of all Fisher indices, where n denotes the numbers of countries in the analysis. The EKS method is selected as it is 
invariant with respect to the choice of the base country and fulfills the transitivity condition. In sum, PPPs above 
the basic heading level can change not only because of a change in the underlying relative prices, but also due to a 
change in the weighting system in the domestic or foreign country. 
Comparative Price Levels (CPLs) are used for cross country comparisons of price levels. CPLs are defined as the 
PPPs divided by the nominal exchange rate, i.e. they relate market exchange rates to purchasing power parities. 
Stated another way, the CPL level for a certain bundle of goods and services is its cost in one country as a per cent 
of the cost of the same bundle in another country, when prices in both countries are expressed in the common 
currency. CPLs are conventionally expressed in terms of indices such that a base country is set equal to 100. A 
comparative price level of 100 means that, at the given exchange rate, price levels are the same in the country un-der 
examination and in the reference country. Figures below 100 indicate that the price level in the country under 
examination is lower than its counterpart in the reference country. Therefore, the market exchange rate assigns 
a lower value (in currency units of the reference country) to one local currency unit than the purchasing power 
parity. Starting from such a position, price level convergence is a process of real appreciation of the local currency 
relative to the currency of the reference country. 
The CPLs show the extent of price level dispersion and inform which countries have higher prices. As a guide-line, 
Eurostat (2005) recommends the use of these measures for monitoring price convergence for higher levels of 
aggregation rather than for very detailed groups. In particular, the selection of monitored products changes every 
year to ensure that items are both comparable and representative for consumption patterns. This could introduce 
volatility especially in highly disaggregated CPLs. 
IV.3 Drawbacks of comparative price levels 
Price convergence implies that the dispersion of CPLs will decline over time. However, it is quite important to 
recognize that convergence of price aggregates differ from convergence of individual prices in several respects. 
These issues need to be acknowledged for a proper interpretation of the outcome of convergence tests. 
First, provided that all individual prices exhibit convergence, the aggregates will also exhibit convergence. But, 
when convergence and divergence occur at the same time for individual prices, the behaviour of the aggregates 
may be hard to explain and interpret. In particular, convergence may occur just because of the aggregation. CPLs 
might converge even if individual prices are far from being in parities. 
Second, CPL convergence may reflect not only the dynamics of CPLs in certain subaggregates, but also a change 
in the weights in the home and the benchmark country. This is a serious problem whenever aggregates above the 
basic heading level are considered. It might be argued, however, that weights could be rather stable over relatively 
short periods. However, this is hardly the case for the New Member States, as their expenditure structure will 
CASE Network Reports No. 76/2007 27
change during the catching up period. Due to the complex process of calculating CPLs, it is rather difficult to carry 
out sensitivity analysis for these measures in response to changes in weights and relative prices. Nevertheless, it 
should be kept in mind that CPL convergence or divergence can be a joint outcome of a change in prices and the 
weighting system. 
Third, it could be more appropriate to study convergence in terms of PPPs or CPLs for basic headings. For the 
latter, the PPPs calculated at the basic headings level are divided by the market exchange rate. As stated above, the 
basic headings are robust against any change in the weighting structure. Thus only price changes can affect the 
corresponding PPPs and CPLs. However, shifts in the expenditures for products sharing the same basic heading 
are masked in the aggregate. Overall, the analysis of basic headings can provide additional insights in the process 
of price convergence. A switch to basic headings provides also a way to get insights into the relative importance of 
catching up and competition for price level convergence. A look at individual markets is required to address the 
impacts of higher competition on price convergence, and the basic headings are more related to them. 
Fourth, shifts towards a higher quality of products can result in higher CPLs because of inaccuracies in the selec-tion 
CASE Network Reports No. 76/2007 
Ch. Dreger, K. Kholodilin, K. Lommatzsch, J. Slacalek, P. Wozniak 
28 
of goods and services to monitor (Eurostat, 2005). The listing for each basic heading contains products that 
are comparable and representative across countries. If the condition of comparability is strictly adhered to, no 
potential for a quality shift is left. But the strict rules may not always be easy to fulfil and some room for flexibility 
is left to the national statistical offices. Goods and services monitored in the New Member States may be of a lower 
quality compared to the Old Member States. The selection of differing products might be also motivated by the fact 
that national statistical offices need to monitor representative goods because at least one good for each basic head-ing 
is necessary for the PPP calculations (Eurostat, 2005). Whenever the generic product specification leaves some 
room for interpretation they can choose a leading product sold in the country which may turn out very di fferent 
from the selections in other countries. 
In practice this problem can be relevant to a sizeable group of products. There is a high likelihood that price lev-els 
in poorer countries will be underestimated as the price quotations of these countries refer to goods and services 
of an inferior quality. When per capita income increases in those countries, households will shift their consumption 
expenditures towards more expensive, higher quality products, implying that the potential for pricing different 
goods is reduced.
Price convergence in the enlarged internal market 
Part V: 
Price trends in the enlarged 
European Union 
In this chapter recent price trends are explored. The New Member States have lower price levels than the Old 
Member States, most probably related to the lower level of per capita income. The backlog is most notable in serv-ices, 
which are often non tradable. Price levels for goods are also lower. This might indicate either insufficient mar-ket 
integration, deficiencies in tradability or in the reputation of goods and services produced by the New Member 
States. �Price convergence is most visible for durables, i.e. the most easily traded goods. During the past decade, 
price levels have been rising towards the euro area average in almost all product categories. The adjustment takes 
place through higher inflation rates and currency appreciation on part of the New Member States. Inflation dif-ferentials 
have been reduced since 2000, and in a number of categories, prices have even declined when converted 
into euros. This suggests that increased competition in the run up to the EU enlargement has also affected price 
trends in the New Member States. H�igher competition has led to declining prices for many goods, while services 
have recorded constantly higher inflation rates. 
V.1 Comparative price levels across countries 
Aggregate GDP price levels are rather close to one another for the founding members of the EU, but substantially 
lower in the New Member States, see Graph V.1. Taken the year 2005 as an example, France had a price level of 
105% of the euro area and Italy of 100%. Some countries at the periphery (Ireland, Finland) and Luxembourg have 
experienced higher levels. In the Southern part of the euro area, prices in Spain, Portugal and Greece fall below 
90% of the average. However, the price levels in the New Member States are lower. Only Cyprus (84%) exceeds the 
price level of the lowest price EU15 countries, i.e. Greece (81%) and Portugal (82%). Prices in the other accession 
countries are much lower; they range from from 70% in Slovenia and 66% in Malta down to 48% in Lithuania and 
Latvia. 
The New Member States have significantly recorded lower per capita income and productivity levels compared to 
the EU12 countries. According to the Balassa-Samuelson effect, this implies a lower aggregate price level because 
of the lower nontradable costs and hence lower prices of non tradable and (partly also) tradable goods. Graph V.2 
confirms that the link between per capita income and the price level is indeed rather strong. Nevertheless, signifi-cant 
deviations can be observed for some countries. Although the Czech Republic and Portugal had similar per 
capita incomes in 2005, their price levels differ by roughly 30 points. On the other hand, Sweden and Ireland had 
CASE Network Reports No. 76/2007 29
a similar CPL of 120 in 2005, but the per capita incomes differed by 20 points. Consequently, income alone does 
not explain the cross-country differences in CPL and some other factors are also important. 
Graph V.2: Comparative price levels of GDP (vertical) and relative per capita income (horizontal), 2005 
gr 
Note: Raw data from Eurostat, in percent of EU12 average (=100). Per capita income is real GDP per capita in PPP. Luxembourg not 
included due to outlier problems (GDP per capita 233% of EU12, CPL is 109%). 
Relative wages in 2005 were considerably more dispersed than relative income (Graph V.3). There appears to 
be also a clearer division between the New Member States (most scattered around 15-35 per cent) and core old 
members (90-120 per cent). Even within these groups substantial heterogeneities exist. Poland and Slovakia have 
the same CPL, but differ by 29 per cent in terms of relative wages. Denmark and Belgium have similar wages but 
show a difference of 32 per cent in the CPL. 
CASE Network Reports No. 76/2007 
Ch. Dreger, K. Kholodilin, K. Lommatzsch, J. Slacalek, P. Wozniak 
Graph V.1: Comparative price levels for GDP across EU countries, 2005 
Note: Raw data from Eurostat, CPLs in terms of the EU12 average (=100). 
30 
dk ie se fi lu uk fr de nl at be it es cy pt gr si mt hu ee cz pl sk lv lt 
dk 
fi 
be at 
cy 
cz 
de 
ee 
es 
fr 
hu 
it 
lt 
lv 
mt 
nl 
pl 
pt 
se 
si 
sk 
uk 
ie 
140 
120 
100 
80 
60 
40 
140 
120 
100 
80 
60 
40 
40 50 60 70 80 90 100 110 120 130
Price convergence in the enlarged internal market 
Graph V.3: Comparative price level of GDP (vertical) and nominal relative wages (horizontal), 2005 
dk 
fi 
ie 
uk 
de 
es 
se 
fr 
cy at be gr 
si 
ee 
cz 
hu 
it 
lv lt 
mt 
nl lu 
pl 
pt 
sk 
140 
120 
100 
80 
60 
40 
10 20 30 40 50 60 70 80 90 100 110 120 130 140 
Note: Raw data from Eurostat and AMECO (nominal wages), in percent of EU12 average (=100). Wages are nominal compensation 
per employee in the total economy. 
If the LOP holds, prices of (tradable) goods are set by the international market, whereas prices of (non tradable) 
services are determined by local conditions. The evidence is broadly in line with this prediction: while the CPLs 
of goods in New Member States range between 60 and 70 per cent of the EU12 in most cases, those of services 
are significantly lower and range between 30 and 45 per cent (see Graph V.4). The divergence is most notable for 
government services, where prices in the Eastern countries are even below 30 per cent of the euro area. 
While the difference between the EU15 and New Member States is much smaller for goods, convergence in 
their prices is far from complete. Only Cyprus exceeds 80 per cent of the euro area average. The sources of this 
divergence could be better understood when goods are broken down into aggregates according to their durability. 
Indeed, Tables A1 and A2 in the appendix suggest that the more tradable goods are the closer their prices converge 
to the euro area level and the less is the dispersion within the New Member States. This finding is in line with the 
LOP. The fact that convergence is not full even for durables (CPLs in Eastern accession countries range between 80 
and 90 per cent) may point to significant nontradable components in the prices of all goods, such as wages, rents 
and transportation, but can also reflect reputation problems of goods produced in the New Member States. 
Graph V.4: Comparative price levels of goods (bright) and services (dark), 2005 
dk ie se fi uk nl at fr de be it lu cy es gr pt mt si hu ee cz sk lt pl lv 
150 
130 
110 
90 
70 
50 
30 
Note: Raw data from Eurostat, in percent of EU12 average (=100). 
CASE Network Reports No. 76/2007 31
Most of the previous findings can be confirmed for COICOP categories, see Table A3 in the appendix. Products 
that are tradable or contain a large share of traded goods, such as clothing and footwear or personal transport 
equipment have a relative high price level in the New Member States. On the other hand, housing, which includes 
rents and public utilities, and labour intensive services such as restaurants and hotels or education and health 
have relative low price levels. Large price disparities can be observed for alcohol and tobacco. They are mainly 
caused by EU differences in taxation. The EU directive has imposed a harmonized minimum rate. But many Old 
Member States have chosen higher rates on both alcohol and tobacco, while most New Member States negotiated 
prolonged adjustment periods and still charge rates below the minimum. The sources of large disparities in hous-ing, 
dk 
fi 
fr 
se 
be at 
lu 
de 
140 
120 
100 
80 
60 
40 
20 30 40 50 60 70 80 90 100 110 120 130 140 
CASE Network Reports No. 76/2007 
Ch. Dreger, K. Kholodilin, K. Lommatzsch, J. Slacalek, P. Wozniak 
32 
water and electricity� are also administrative. These products are regulated at the municipal or national level 
and large cross country deviations may stem from different policies of local authorities or regulatory agencies. In 
the New Member States, these prices have been substantially increased as they were set well below costs under 
communism. 
It should be noted that prices of network industries, particularly in the telecommunications sector are higher 
than in the EU12 for some transition economies. This may indicate that either the liberalisation of these industries 
has proceeded at a lower pace or that investments to upgrade the quality of services have been passed over to 
prices in the New Member States to a higher extent. 
V.2 Changes in comparative price levels over time 
On the aggregate level, prices for GDP and household consumption expenditures have converged over the past 
decade. Graphs V.5 and V.6 present scatter plots of related CPLs in 1995 and 2005 for all 25 EU countries. Any 
point above the 45˚ line reflects an increase in CPL in 2005 relative to the base period. Countries with high price 
levels in 1995 have seen their prices decline relative to the EU12 average, while those with lower CPLs have in-creased. 
The dispersion of GDP and household consumption CPLs has been reduced in the course of this process. 
Graph V.5: Comparative price levels of GDP in EU25 countries in 1995 (horizontal) and 2005 (vertical) 
it 
gr cy 
cz 
ee 
es 
hu 
lt 
lv 
mt 
nl 
pl 
pt 
si 
sk 
ie 
uk 
Note: Raw data from Eurostat and AMECO, in percent of EU12 average (=100), Malta 1999 instead of 1995. 
Regarding the individual country developments, the rise in CPLs has been sizeable for the New Member States 
(more than 15 per cent in Czech Republic, Estonia, Latvia and Lithuania) with the exception of Slovenia, where it 
COICOP refers to the Classification of Individual Consumption According to Purpose (United Nations statistical meth-odology).
amounted to a only 1 per cent. A significant CPL increase has been observed in Italy, Portugal, Spain and Ireland. 
In contrast, the CPLs for France, Germany, Belgium and Austria which performed relatively poorly in terms of 
GDP growth have declined. 
Graph V.6: Comparative price levels for household consumption in EU25 countries in 1995 (horizontal) and 2005 
(vertical) 
cz 
ee 
hu 
lt lv 
pl 
sk 
20 30 40 50 60 70 80 90 100 110 120 130 140 
130 
110 
90 
70 
50 
CASE Network Reports No. 76/2007 
Price convergence in the enlarged internal market 
33 
lu 
be 
it 
es 
uk 
cy 
gr 
fr 
de 
mt 
nl 
pt 
si 
ie 
Note: Raw data from Eurostat, in percent of EU12 average (=100), Malta 1999 instead of 1995. 
dk 
fi 
at 
se 
In the New Member States, convergence has occurred most likely through varying inflation rates and currency 
appreciation rather than through a combination of a price rise in low CPL and a price fall in high CPL countries. 
The claim for this notion is the positive aggregate inflation in all EU25 countries throughout the period. 
Convergence in price aggregates can mask disparities at more disaggregated levels. Thus it is important to also 
consider the developments at the level of narrower GDP or COICOP aggregates. Graph V.7 presents the coefficient 
of variation for the CPLs in the EU25 over the 1999-2005 period. Furthermore, Table V.1 presents an extensive 
summary of various statistics (including HICP inflation) documenting the process of price convergence for several 
COICOP and GDP categories. 
Evidence of convergence, i.e. a declining price dispersion can be established for most categories. It has been par-ticularly 
pronounced in the case of government consumption and services as well as semi durables and machinery 
and equipment. Among COICOP categories the largest reduction in dispersion has been registered for communica-tion 
as well as clothing, including footwear. For some categories dispersion has increased in the later years.
Construction 
Household consumption 
Government consumption 
Capital goods 
Consumer services 
Government services 
Clothing 
Housing, energy 
Education 
Restaurants, hostels 
Note: Raw data from Eurostat. Coefficient of variation of country CPLs. From left to right: First column 1999, second 2001, third 
2003, fourth 2005. 
An analysis of inflation rates (Table V.1) can shed more light on the dynamics of the price convergence process. 
The moderate decline in dispersion of durables has been a result of deflation in both the Old and the New Member 
States. Clothing and footwear as well as communications have seen deflation in the EU15 and positive inflation in 
the New Member States. 
CASE Network Reports No. 76/2007 
Ch. Dreger, K. Kholodilin, K. Lommatzsch, J. Slacalek, P. Wozniak 
Graph V.7: EU25 price convergence in COICOP categories, 1999-2005 
34 
GDP 
Individual consumption 
Collective consumption 
Machinery, equipment 
Non durable goods 
Semi durable goods 
Durable goods 
Food 
Alcohol, tobacco 
Tobacco 
Health 
Transport 
Communication 
Recreation, culture 
60 
50 
40 
30 
20 
10 
0
CASE Network Reports No. 76/2007 
Price convergence in the enlarged internal market 
35 
Table V.1 Price convergence in consumer goods and services 
Expenditure aggregate year 
CPL Coefficient of variation Average annual HICP 
inflation 1999-2005 (%) 
EU15 NMS EU25 EU15 NMS EU15 NMS 
Household final consumption expenditure 
1995 98.0 44.5 39.3 17.8 37.1 
1999 102.7 50.8 32.2 13.9 26.7 1.9 4.5 
2002 102.7 58.7 28.8 14.9 20.1 
2005 100.9 59.3 26.3 12.6 16.7 
Food and non-alcoholic beverages 
1995 
1999 101.4 55.0 26.4 11.0 24.6 1.7 2.9 
2002 101.7 61.7 23.5 12.2 20.2 
2005 100.7 64.2 23.2 11.9 19.1 
Alcoholic beverages, 
tobacco and narcotics 
1995 
1999 113.6 65.2 39.2 30.6 27.7 3.9 4.9 
2002 114.8 77.8 37.9 32.8 27.6 
2005 110.8 67.9 33.9 26.6 31.9 
Clothing and footwear 
1995 
1999 101.2 68.2 20.6 10.6 17.5 -0.1 0.7 
2002 96.8 76.1 17.0 11.1 9.2 
2005 97.3 83.1 10.6 8.5 8.5 
Housing, water, electricity, 
gas and other fuels 
1995 
1999 96.8 32.1 50.1 24.5 42.2 2.8 7.9 
2002 97.6 37.5 47.0 25.6 31.0 
2005 95.5 39.6 42.0 18.1 22.7 
Household furnishings, 
equipment and maintenance 
1995 
1999 102.9 63.1 22.4 12.1 17.1 0.9 2.2 
2002 104.1 69.4 21.2 11.6 13.8 
2005 101.8 71.6 18.5 8.4 15.6 
Heath 
1995 
1999 101.3 32.0 47.5 18.7 53.3 2.9 7.1 
2002 101.7 41.2 42.0 18.2 44.3 
2005 102.7 43.8 39.6 17.3 35.7 
Transport 
1995 
1999 105.2 64.7 25.9 15.0 14.0 2.8 6.2 
2002 105.1 73.4 23.5 16.5 12.8 
2005 104.3 77.2 22.0 16.1 12.6 
Communication 
1995 
1999 108.3 95.4 30.3 27.3 25.7 -2.9 3.1 
2002 100.8 111.1 20.3 12.6 27.8 
2005 96.5 89.1 17.5 12.3 21.8 
Recreation and culture 
1995 
1999 102.9 55.2 30.2 12.0 30.9 0.3 3.8 
2002 103.3 64.6 25.7 12.0 22.9 
2005 101.4 60.4 26.4 10.6 21.0 
Education 
1995 
1999 103.4 27.2 55.4 23.9 65.4 3.9 6.8 
2002 104.9 33.6 52.3 24.5 56.7 
2005 103.5 34.7 49.4 21.2 47.5 
Restaurants and hotels 
1995 
1999 107.1 59.4 30.1 12.8 29.1 3.2 5.4 
2002 107.2 67.0 30.0 17.1 28.7 
2005 104.9 63.2 30.2 16.9 22.5 
Miscellaneous goods and Services 
1995 
1999 102.8 42.7 37.3 14.3 30.2 2.5 4.7 
2002 103.7 51.1 35.3 16.2 25.8 
2005 103.1 52.6 32.7 15.0 23.3 
Consumer goods 
1995 
1999 103.1 62.8 23.3 10.9 18.8 1.5 3.6 
2002 102.7 71.6 20.1 11.8 14.5 
2005 101.2 73.3 18.0 10.2 13.6 
Non-durables 
1995 
1999 102.9 56.8 27.3 12.7 20.4 1.6 4.8 
2002 103.6 67.1 24.0 14.9 16.0 
2005 101.9 68.4 21.9 12.5 15.9 
Semi-durables 
1995 
1999 102.3 71.4 18.2 9.0 15.1 0.0 1.2 
2002 99.4 79.3 14.9 9.0 8.5 
2005 98.7 82.4 10.7 7.3 7.8 
Durables 
1995 
1999 104.4 84.7 15.6 12.1 16.4 -0.6 -0.5 
2002 103.5 88.5 13.8 11.1 13.5 
2005 101.6 88.4 13.7 10.9 12.2 
Consumer services 
1995 
1999 102.1 39.9 42.2 18.1 37.1 2.5 5.8 
2002 102.4 47.0 38.0 18.1 27.8 
2005 100.6 47.4 36.2 15.5 21.7 
Note: Raw data from Eurostat. CPL in % of the EU12 (=100) level. HICP inflation is refers to the annual average over the 1999-2004 
period. For the �New Member States shares in total final consumption expenditures are used as weights.
Finally, there is clear evidence that convergence in consumer prices occurred through both high inflation in the 
New Member States and exchange rates appreciations. However, despite a positive relation between changes in 
CPLs and HICP inflation rates, the correlation is far from perfect. Increasing price levels have been observed in 
all New Member States, except of Slovenia. By contrast, HICP inflation rates were often lower or even negative 
(Latvia). �Despite the substantial similarities in the data included in the CPL and HICP calculation, there is no un-equivocal 
NE nondurable goods 
NE durable goods 
NE semidurable goods 
Energy 
Services 
CASE Network Reports No. 76/2007 
Ch. Dreger, K. Kholodilin, K. Lommatzsch, J. Slacalek, P. Wozniak 
36 
relationship between the two price measures. 
V.3 Changes in HICP subcategories over time 
Changes in relative price levels can also be studied by exchange rate adjusted Harmonized Indices of Consumer 
Prices (HICPs). As noted in chapter IV, however, one needs to be aware of limitations of such analysis. Inflation 
measured by the HICP provides a useful insight into the developments of purchasing power of local currencies 
over time. The methodology of HICP puts special emphasis on the representativity of monitored items for local 
markets and does not attach high importance to international comparability. The harmonization refers to statistical 
procedures used for choosing items and monitoring their prices rather than to the selection of goods and services 
to be monitored. Whenever consumption patterns differ between EU countries, inflation figures for any specific 
subaggregate will refer to a heterogeneous basket of goods reflecting locally representative items. 
Graph V.8.: Annual HICP inflation in the euro area (bright) and the New Member States (dark), adjusted by the 
exchange rate, average 2001-2005 
6 
5 
4 
3 
2 
1 
0 
-1 
-2 
All items 
Food, beverages 
Alcohol, tabacco 
Clothing 
Housing, energy 
Education 
Restaurants, hostels 
Health 
Transport 
Communications 
Recreation, culture 
Furnishings 
Goods 
Industrial goods 
NE industrial goods 
Miscellaneous 
Note: Raw data from Eurostat. Eastern European transition countries (Czech Republic, Estonia, Hungary, Latvia, Lithuania, Poland, 
Slovakia and Slovenia) and euro area (dark). NE=Non energy. 
The New Member States have registered a higher inflation rate over the period, albeit the difference is not very 
significant for the aggregate: 2.5% in the New Member States vs. 2.2% in the euro area. But there are sizeable dif-ferences 
within the COICOP categories. Service dominated aggregates such as housing, water, electricity and other 
fuels as well as communications are characterised by considerably higher inflation in the New Member States. In 
line with the Balassa Samuelson effect, this is caused by faster price increases in services enhanced by price hikes 
in public utilities and network industries. Energy and various communication and transportation services have 
been underinvested in the former communist period. The technological catching up process requires costly invest-ments 
which inevitably leads to higher price dynamics in New Member States. This is particularly striking in the
case of communication services which are subject to a sizeable deflation in euro area, but exhibit positive (albeit 
low) inflation in the New Member States. 
COICOP categories such as health, education, recreation and culture and restaurants and hotels are dominated 
by market services and have exhibited higher price dynamics in the catching up countries. Prices for goods domi-nated 
categories such as food, clothing including footwear as well as furnishings including household equipment 
have risen slower in the New Member States when compared to the euro area. In contrast� to durables and semi 
durables, prices of non durables tend to grow faster in the New Member States than in the euro area. �In line with 
the Balassa-Samuelson effect inflation rates in services have been higher than in the euro area. This evolution 
could be related to housing services, education and catering. 
CASE Network Reports No. 76/2007 
Price convergence in the enlarged internal market 
37
The empirical analysis determines whether price convergence has occurred and provides insights into the driv-ing 
forces and impediments of this process. As already argued in previous chapters, the empirical support of the 
LOP is rather limited, as the assumption of perfectly competitive markets is not met. In an environment of monopo-listic 
CASE Network Reports No. 76/2007 
Ch. Dreger, K. Kholodilin, K. Lommatzsch, J. Slacalek, P. Wozniak 
Part VI: 
Empirical analysis 
of price convergence 
38 
competitive markets firms are able to charge prices that include a mark up over marginal costs. Therefore, 
cross country deviations in price levels may be traced to cross country differences in marginal costs or in mark ups. 
These determinants can be distinguished to investigate the impact of recent developments in the Internal Market 
on the process of price level convergence: increased competition due to the EU enlargement and the catching up 
of the New Member States. 
Higher market integration is expected to boost competition and puts a downward pressure on prices via the 
reduction of mark ups. However, this development is overlapped by the catching up process of the New Member 
States. As far as convergence of income per capita is not achieved, prices in the transition economies are expected 
to be on an upward trend. The analysis has to separate these two forces. Proxies for catching up and competition 
reveal insights into the impact of these components on the path of price convergence. Because of the transition 
period, the time span of data available for the New Member States is rather short. As a consequence, simple time 
series models are not appropriate. Instead, the analysis is conducted in a panel framework, where the cross section 
dimension is taken into account. Hence, the estimated effects display the average across countries and markets. To 
save regressors, circumvent multicollinearity problems and strengthen the interpretation of the empirical results, 
a factor analysis is performed. Specifically, a catching up factor is extracted by principal component analysis. This 
common component is employed in regression models together with alternative competition measures, as a com-mon 
factor for the competition phenomenon is not suitable. A competition factor would relegate a substantial part 
of the variation to the idiosyncratic elements. 
After determining the factors of interest, β convergence is investigated in the first step. Here a negative relation-ship 
between the initial price level and subsequent changes in the price level is expected to hold. The empirical 
results indicate the presence of β price convergence: countries with lower initial price levels have experienced 
higher inflation thereafter and vice versa. This finding is especially confirmed for tradables that are subject to in-ternational 
competition. Second, the analysis switches to the study of price dispersion over time, i.e. σ convergence. 
A decline in standard deviations can be detected, and the trend parameter is significant. Third, catching up and
competition measures are employed as regressors when relative prices are explained for particular markets, such 
as non durables, semi durables, durables, services, and investment in equipment and buildings. CPLs for broad cat-egories 
and basic headings are endogeneous. For broad categories, the analysis is done for the 1999-2005 period. 
For the basic headings the sample period is even shorter (2000-2004). 
Catching up and competition seems to be important factors to explain the path of price convergence, most nota-bly 
for the New Member States. The closer per capita incomes are to the EU12 level, the closer their price levels. 
Catching up implies price increases especially in the non tradables sector, such as services. The evidence is broadly 
consistent with this prediction. Competition variables are often significant with the correct sign. In particular, 
higher competition exerts a downward pressure on prices. Furthermore, the removal of price controls will lead to 
a decrease in CPLs in the Old, but to an increase in the New Member States. Again, the latter reaction is due to 
catching up behaviour. Throughout the analysis, the EU12 are used as the benchmark, as euro area prices are not 
subject to exchange rate fluctuations. 
VI.1 Description of variables 
Possible determinants to explain the path of price convergence are grouped into competition and catching up 
regressors. Competition is proxied by several indicators. At the sectoral level openness to foreign trade and import 
penetration have been constructed using the ProdCom (Production Communautaire) database from Eurostat. On 
the nationwide level, the business deregulation index and its ingredients are taken from the Fraser Institute data-base, 
see Gwartney and Lawson with Gartzke (2005). Catching up is expressed in terms of national variables, like 
per capita income, labour productivity and compensation of employees. The main characteristics of the series are 
given in the appendix (Table A4). 
Differences in per capita income constitute the major reason for divergences in price levels across countries. 
One explanation is provided by the Balassa-Samuelson effect. The catching up process is almost always associated 
with higher productivity gains in tradables and higher relative productivity growth than in richer, less dynamic 
economies. Therefore, prices of non tradables are expected to grow faster in the New Member States. Price levels 
in the New Member States and poorer EU15 countries are expected to follow an upward trend correlated with per 
capita income, wage and productivity convergence. Note that prices of tradables are also affected in this process, 
as they include non tradable inputs. 
ee 
pl 
lv lt 
sk 
140 
120 
100 
80 
60 
40 
40 50 60 70 80 90 100 110 120 130 
CASE Network Reports No. 76/2007 
Price convergence in the enlarged internal market 
39 
Graph VI.1: Relative GDP per capita (horizontal) and CPL of GDP, 2005 
dk 
fi 
uk ie 
nl 
se 
be at 
gr 
cy 
pt 
mt 
cz 
de 
es 
fr 
hu 
it 
si 
Note: Raw data from Eurostat, in percent of EU12 average (=100). Luxembourg is not included due to an outlier (GDP 233% of euro 
area average, CPL 109%). 
Eurostat has recently calculated basic headings for 2005, but the classification has changed. Under the new system, data 
are available only for 2003-2005. For the analysis, the older classification is preferred because of the longer time span.
Measures for the overall state of the economy are per capita income (in PPP), compensation of employees and 
labour productivity, all of them obtained at constant market prices (2000=100). The series are taken from the 
AMECO database of the EU Commission and are defined in relative terms, i.e. they show the country specific in-formation 
uk nl 
ie 
at be 
ee 
mt 
sk 
40 60 80 100 120 140 160 180 
CASE Network Reports No. 76/2007 
Ch. Dreger, K. Kholodilin, K. Lommatzsch, J. Slacalek, P. Wozniak 
40 
divided by the EU12 benchmark. As argued in section III, these variables should be positively related 
to the CPLs. Graph VI.1 confirms this relationship between relative GDP per capita and the CPL of GDP, with a 
highly significant slope coefficient of 0.92. Although the link is quite strong, it is far from perfect. For example, the 
Czech Republic and Portugal as well as Netherlands and Denmark realize similar levels of per capita GDP (67% 
and 117%). But their CPLs differ by 27 and 25 percentage points, respectively. 
Main competition measures refer to the integration of the countries in international markets. Trade openness is 
proxied by the sum of exports and imports divided by GDP. An alternative measure is import penetration which is 
obtained as the ratio between imports and output. In order to measure the competition effect, openness and pen-etration 
have to be measured on a sectoral scale. For this reason, the ProdCom classification has been used. The 
raw data refer to 4500 headings related to certain products. They are condensed to 212 categories and aggregated 
further to match the sectoral division used in this study: non durables (36), semi durables (39), durables (35), equip-ment 
(38), investment buildings (18) and services (0). If no sectoral information can be revealed, the competition 
indicators are measured by national variables which have been taken from the AMECO database. 
Graph VI.2: Trade openness (horizontal) and CPL of GDP, 2005 
dk 
fi 
se 
cy 
fr 
gr 
cz 
de 
es 
hu 
it 
si 
lv lt 
pt 
pl 
140 
120 
100 
80 
60 
40 
Note: Raw data from Eurostat, in percent of EU12 average (=100). Luxembourg not included due to an outlier (trade is 294% of euro 
area average, CPL 109%). 
On the nationwide level, Graph VI.2 shows that openness might have a negative impact, i.e. higher trade is 
associated with a lower price level. The slope coefficient of a regression is -0.23, and significant at the 0.1 level. 
The New Member States are concentrated in the lower right part of the graph: the countries are generally more 
open, and have lower price levels than the EU12 average. Compared to relative GDP, the relationship appears to 
be somewhat weaker. Higher openness to foreign trade implies that the domestic producers are confronted with 
stronger competition from abroad, thereby reducing their mark ups. Therefore an increase in openness should 
exert a dampening effect on the price evolution. 
Another option to proxy the competition effect is the business deregulation index reported by the Fraser Insti-tute; 
see Gwartney and Lawson with Gartzke (2005). It comprises information about price controls, the burden of 
regulation (administrative conditions and entry of new businesses), time with government bureaucracy, the ease of 
starting a new business and irregular payments, for example payments for special business licences. The indicator 
is ranged between 1 to 10, with 1 indicating the lowest and 10 the highest level of deregulation. Because of the rank
MC 
C L 
∂ ∂ 
scale only the sign, but not the size of the impact is interpretable. Data are provided on an annual base from 2000 
to 2005 at the nationwide level. Before 2000, the indicator is available at the 5 year frequency. Therefore, the value 
for 1999 has been interpolated on the base of the 1995 information. 
The overall measure can be broken down into its subcomponents. This is important because the Fraser index is a 
too broad concept. For example, time with government bureaucracy may not have an obvious impact on price devel-opments. 
A stronger deregulation in this area would lead to a rise in the Fraser index, although the fundamental price 
determinants might not have changed. Therefore, for the purpose of this study, price controls seems to be the most 
relevant variable (Égert, 2006). A removal of price controls during a catching up period is expected to lead to price in-creases 
in the EU10. In the EU15, the situation is different, as prices have been already liberalized to a higher extent. 
A further reduction of controls will introduce more competition, which is especially relevant in network industries, 
such as telecommunications. Thus a downward pressure on prices should be observed for the EU15. 
Finally, W CPLs ∂ for Y 41 broad W categories ∂ 
Y 
and basic headings for 279 product groups have been taken from Eurostat. 
Nominal P bilateral = ∂ L exchange = 
P rates ∂ 
L 
to the euro are from the ECB Monthly Bulletin. Exchange rates are needed to 
convert the PPP type expression of basic headings into a CPL comparable series. 
VI.2 Catching 1 W up ∂ and Y / 
competition ∂ 
L 
factors 
T = 
T T 
S W ∂ Y ∂ 
L 
The first step is to derive suitable factors describing catching up behaviour and competition as the main deter-minants 
of price convergence. Catching up is relatively easy to quantify as it is directly captured by relative per 
capita income, productivitiy and wages. These measures are closely correlated among each other. The inclusion 
of all them in the same regression would inevitably create a collinearity problem, see Table A5 in the appendix for 
the correlation matrix of the original variables. Therefore a common component is extracted instead. It could be 
interpreted as a catching up factor and can be used as a substitute for the individual variables in a regression of the 
W ∂ Y W ∂ 
Y 
determinants = on price convergence. = 
This approach is also a convenient way to extenuate data problems caused by 
P L P L 
a short time series ∂ dimension. 
∂ 
The catching up factor is extracted by means of principal component analysis (PCA). The idea behind the PCA 
is that the variability of all α observed −α variables can be reduced to a limited −α number of sources, or common factors. 
P P P ⎛ The remaining variability ⎛ ⎞ ⎛ is attributed ⎞ to ⎛ S S 
T N ∂ the Y idiosyncratic ∂ L ⎞ ⎛ ∂ Y ∂ L 
⎞ ⎞ 
= ⎜ = T T P P ⎟ ⎜ ⎟ ⎜ ⎜ ⎟ ⎜ component, N N 
⎟ ⎟ i.e. an individual factor for each variable 
observed. Formally, ⎝ the ⎠ decomposition 
⎝ P ⎠ ⎝ ⎝ ∂ Y ∂ L ⎠ ⎝ ∂ Y ∂ L 
⎠ ⎠ 
is applied, where Xt is the n×1 vector of observed variables; Λ is the n×k matrix of factor loadings; Ft is the 
k×1 vector of common factors (k substantially lower than n); and ut is the n×1 vector of idiosyncratic shocks. The 
extraction of the common factors from the series observed is done by PCA. The factors are organized in descend-ing 
order according to the proportion of the total variability they explain. Therefore, the first principal component 
contributes more than any other principal component to the variance of the original variables. 
CASE Network Reports No. 76/2007 
Price convergence in the enlarged internal market 
41 
(12) 
P SP∗ = 
, 1 1/ | | y p 
P 
ε 
= 
− 
, 
/ 
( / )(1 1/ | |) y p 
P 
Y L ε 
= 
∂ ∂ − 
P = (1+η)MC , η = f (ε, gap, ptm) 
1 
T N P Pα P −α = 
* 
T T P = SP 
* * 
* * T T , T T 
T T T T 
* * * 
/ 
T T T 
, * * T N T N W =W =W W =W =W 
* * 
* * N N , N N 
N N N N 
1 1 * * * * / * * / * 
/ / 
T N T T N N 
t t t X = ΛF + u 
i ,t i i ,t j i ,t CPL α βCPL u − Δ = − + 
, , 1 , (1 ) i t i i t i t CPL α β CPL u − = + − + 
λ = −ln(1− β ) , t* = −ln0.5 λ
Proportion to overall variance Correlation (Catching up factor, variables) 
PC_1 99.32 GDP 0.996 
PC_2 99.78 Productivity 0.996 
PC_3 100.00 Compensation 0.998 
Note: Sample period 1999-2005, Luxembourg excluded. Apart from the deregulation index, all series are measured in relative terms 
(EU12=100). Principal components are calculated across countries, i.e. each of the underlying series comprises 168 observations (24 
countries x 7 periods). PC_x denotes the xth principal component, the other variables are defined in the text. The catching up factor 
refers to the first principal component. 
The PCA is based on the correlation matrix of the variables. To derive the catching up factor, it is applied to GDP, 
labour productivity, and compensation of employees, all of them at constant (2000) prices. The first principal com-ponent 
CASE Network Reports No. 76/2007 
Ch. Dreger, K. Kholodilin, K. Lommatzsch, J. Slacalek, P. Wozniak 
Table VI.1: Principal component analysis 
42 
amounts to 99 percent of the total variation of the underlying variables, see the left half of Table VI.1. As 
shown in the right part of the table, it is strongly correlated with the original variables. Hence, the interpretation 
as catching up factor is straightforward. 
Competition is more difficult to address. It is partially, albeit not perfectly, manifested in the openness to for-eign 
trade or the degree of import penetration, and the strength of business regulation. Openness and import 
penetration are strongly correlated and both are related to market integration. Import penetration might be more 
informative because it reflects the exposure of the domestic market to international competition. Therefore, it is 
preferred in the subsequent analysis. The results obtained with openness are almost identical. The correlation of 
import penetration and openness with either price controls or the Fraser index is rather weak, see Table A5 in the 
appendix. Hence the estimation of a common factor would be rather imprecise, since a substantial part of informa-tion 
is classified as idiosyncratic and dropped from the analysis. Due to the low correlation, it is more reasonable 
to directly include the original variables in the regression of the determinants on price convergence. 
VI.2 Beta and sigma convergence 
Two general concepts to measure convergence of certain variables are distinguished in the literature: β- and 
σ-convergence. They have been used extensively in the literature of economic growth to assess regional or cross 
country per capita income and productivity convergence (Barro and Sala-i-Martin, 1995). β-convergence in its 
absolute form postulates that poor countries (low income or productivity) will experience faster income or pro-ductivity 
growth thereafter. This implication is usually tested by regressing the growth rate, taken as average over 
some period of time on initial levels for a cross section of countries. The conditional form predicts β-convergence 
only after other factors have been taken into account. The latter control for a different steady state position across 
countries. On the other hand, σ-convergence implies a decrease in the dispersion of per capita income or produc-tivity 
levels across countries. �It can be shown that β-convergence is necessary, but not sufficient for the existence of 
σ-convergence, see Barro and Sala-i-Martin (1995). Evidence for both concepts would reveal support of the LOP 
as a long run condition. 
In the analysis of prices, absolute β-convergence �is built upon a negative relationship between the initial price 
level and subsequent price increases. Countries with low prices at the beginning of the period have had higher in-flation 
on average, implying convergence to the mean of the distribution. In terms of CPLs, an initial CPL level (the 
national price compared to a numeraire price) is used to explain subsequent changes in the CPL measure, i.e.
= = 
∂ ∂ 
⎛ ⎞ ⎛ ⎞ ⎛ ⎛ ∂ ∂ ⎞ ⎛ ∂ ∂ ⎞ ⎞ 
P P P Y L Y L 
S S 
P P P Y L Y L 
= ⎜ ⎟ ⎜ ⎟ = ⎜ ⎜ ⎟ ⎜ ⎟ ⎟ ⎝ ⎠ ⎝ ⎠ ⎝ ⎝ ∂ ∂ ⎠ ⎝ ∂ ∂ ⎠ ⎠ 
W Y W Y 
P L P L 
∂ ∂ 
= = 
∂ ∂ 
α −α −α ⎛ ⎞ ⎛ ⎞ ⎛ ⎛ ∂ ∂ ⎞ ⎛ ∂ ∂ ⎞ ⎞ 
P P P Y L Y L 
S S 
P P P Y L Y L 
T N T T N N 
= ⎜ ⎟ ⎜ ⎟ = ⎜ ⎜ ⎟ ⎜ ⎟ ⎟ ⎝ ⎠ ⎝ ⎠ ⎝ ⎝ ∂ ∂ ⎠ ⎝ ∂ ∂ ⎠ ⎠ 
α −α −α ⎛ ⎞ ⎛ ⎞ ⎛ ⎛ ∂ ∂ ⎞ ⎛ ∂ ∂ ⎞ ⎞ 
P P P Y L Y L 
S S 
P P P Y L Y L 
T N T T N N 
= ⎜ ⎟ ⎜ ⎟ = ⎜ ⎜ ⎟ ⎜ ⎟ ⎟ ⎝ ⎠ ⎝ ⎠ ⎝ ⎝ ∂ ∂ ⎠ ⎝ ∂ ∂ ⎠ ⎠ 
where i is a country index, αi a country specific fixed effect, ui the error term and t denotes time. The initial CPL 
is the CPL level lagged j periods. The one period lag (j=1) is usually employed in empirical studies, see Dobado and 
Marrero (2005) and Wolszczak-Derlacz (2006). Then, the equation 
relating subsequent CPLs is equivalent. The estimated coefficient of the lagged CPL is an indicator of β-conver-gence. 
CASE Network Reports No. 76/2007 
Price convergence in the enlarged internal market 
43 
(14) 
/ / / / 
T N T T N N 
T N T T N N 
t t t X = ΛF + u 
i ,t i i ,t j i ,t CPL α βCPL u − Δ = − + 
, , 1 , (1 ) i t i i t i t CPL α β CPL u − = + − + 
λ = −ln(1− β ) , t* = −ln0.5 λ 
(15) 
* * N N N N 
P L P L 
1 1 * * * * / * * / * 
/ / 
T N T T N N 
t t t X = ΛF + u 
i ,t i i ,t j i ,t CPL α βCPL u − Δ = − + 
, , 1 , (1 ) i t i i t i t CPL α β CPL u − = + − + 
λ = −ln(1− β ) , t* = −ln0.5 λ 
In particular, two parameters of interest can be immediately revealed from the regression results. The speed 
of convergence and the half lives of shocks are calculated as 
(16) 
* * 
* * N N , N N 
N N N N 
1 1 * * * * / * * / * 
/ / 
T N T T N N 
t t t X = ΛF + u 
i ,t i i ,t j i ,t CPL α βCPL u − Δ = − + 
, , 1 , (1 ) i t i i t i t CPL α β CPL u − = + − + 
λ = −ln(1− β ) , t* = −ln0.5 λ 
where λ is convergence per period. �The half life t* measured in years indicates how long it takes for the impact 
of a unit shock to diminish by 50 percent. In case of higher autoregressive orders in the convergence model, the 
absolute value of the first order coefficient is a suitable approximation to obtain measures for the speed of conver-gence 
and half lives. Due to the dynamic structure of the panel regression (15), the Arellano and Bond (1991) GLS 
method is appropriate. 
As mentioned earlier, β-convergence is a necessary, but not a sufficient condition for price convergence. Here, 
β-convergence must also hold, which is related to a decrease of the standard deviation of prices over time. In prin-ciple, 
β-convergence is perfectly compatible with a shift in the ranking of prices across countries, without affecting 
price dispersion. In the analysis, the presence of σ-convergence is investigated by the sign and significance of the 
slope coefficient in a regression of the CPL dispersion on a linear time trend. 
In particular, a panel regression is performed for 41 CPLs for broad categories and 279 basic headings, which are 
observed for 24 countries. Luxembourg is excluded from the EU25 because of outlier problems. The cross section di-mension 
is 984 (41x24) in case of broad categories and 6696 (279x24) for basic headings. Broad categories are available 
at the annual frequency from 1999 to 2005, while basic headings are observed over the 2000 to 2004 period. The basic 
headings have been converted into the same currency, i.e. divided by the nominal exchange rate to the euro. Thus they 
are measured in a CPL fashion, but related to specific markets. Overall, the cross section dimension is rather large, but 
the time series dimension is very short in any case. As the results refer to time series phenomena they should be taken 
with some caution. But at least, they are useful to provide a first indication of the path of convergence. 
The results are shown in Table VI.2. The speed of convergence and half lives are calculated according to the for-mula 
(16). The convergence regressions include a multiplicative dummy to control for a possible different speed of 
convergence due to the EU enlargement in 2004. This is done only for the broad categories, as the basic headings 
data end in 2004. Due of the short time span, multicollinearity might occur. However the correlation between the 
price and the price times the dummy is below 0.1. Thus the dummy regressor can be included directly. Its coef-ficient 
indicates the change of the impact of the lagged price after 2004. 
It should be noted that some well known statistics are not informative in this case. For example, the familiar R-squared 
statistic is an OLS concept that is useful because of the unique way it breaks down the total sum of squares into the sum 
of the model sum of squares and the residual sum of squares. When the parameters are estimated using GLS techniques, 
the total sum of squares cannot be broken down in the the same way. Specifically, an R-squared statistic computed from 
GLS sums of squares need not be bounded between zero and one and does not represent the percentage of total varia-tion 
in the dependent variable that is accounted for by the model. Also, eliminating or adding variables does not always 
increase or decrease the computed value.
CASE Network Reports No. 76/2007 
Ch. Dreger, K. Kholodilin, K. Lommatzsch, J. Slacalek, P. Wozniak 
Table VI.2: Price convergence in terms of broad categories and basic headings 
-EU25 countries 
4 
Broad categories Basic headings 
β-convergence 
CPLt-1 0.941 
(0.003) 
0.795 
(0.030) 
Dummy*CPLt-1 -0.024 
(0.009) 
Speed of convergence 
Entire period 0.100 
Before enlargement 0.061 
After enlargement 0.087 
Half-life 
Entire period 6.9 
Before enlargement 11.4 
After enlargement 8.0 
σ-convergence 
Time trend -0.027 
(0.006) 
-0.009 
(0.001) 
Dummy*Time trend 0.008 
(0.001) 
Note: Sample period 1999-2005 for broad categories, 2000-2004 for basic headings, Luxembourg excluded. Dummy is equal to 1 from 
2004 onwards, 0 elsewhere. Arellano-Bond estimation for β-convergence, OLS regression for σ-convergence. Numbers in parantheses 
denote robust standard deviations. 5.096 observations for broad categories (24 countries×41 indices×6 years), 32.280 observations for 
the basic headings (24 countries×269 indices×5 years). The original number of basic headings (279) has been reduced by 10 outliers. 
Overall, the evidence points to the presence of beta convergence: countries with low relative prices in the initial 
period have experienced higher changes in the price level thereafter. According to the speed of convergence, only 
6 percent of the price differential are removed each period, if the analysis focuses on CPLs for broad categories. 
The speed of convergence seems to have increased due to the EU enlargement. Given the change in the regression 
coefficient, the half life drops to 8 years after 2003. In case of basic headings, 10 percent of the price differential 
diminish in each period. Convergence is expected to take a long period of time, but tends to be faster in the case 
of basic headings. This might be explained by a higher level of competition for more homogeneous products. Simi-larly, 
�t�he ECB (2003) has concluded that β-convergence does play an important role in explaining different rates of 
inflation. However, the ECB study is limited to the euro area. 
Beta convergence can be also confirmed if more homogeneous groups of countries are considered, such as 
the EU15 and the EU10. The speed of convergence seems to be a little bit faster in the EU15, see Table A6 in the 
appendix. Thus the Old Member States converge to their steady state at a faster pace. Note that the steady state 
positions of the EU15 and the EU10 are not restricted to be the same, as the analysis is done for both groups in an 
independent way. Specifically, the anchor for the price convergence process, i.e. the steady state of the Old Member 
States is excluded from the EU10 regressions The steady state positions for the EU15 and EU10 could be different, 
but they can also coincide.
In addition, the standard deviations are declining over time. Thus sigma convergence is confirmed, where the 
reduction in the price dispersion seems to be more pronounced for the broad categories. After the EU enlarge-ment, 
the trend parameter decreased in absolute value. Hence, sigma convergence has been slightly weaker after 
2004. Again, these results are broadly confirmed in case of the EU15 and EU10 countries. 
As a rule, convergence should be faster for tradables. It might be also expected for non tradables, albeit at a 
slower pace, as non tradables may include sizeable shares of tradable inputs. Hence, disaggregation could provide 
additional conclusions. Therefore, the basic headings for consumer products are split into non durables, semi 
durables, durables and services. On the investment side, basic headings for equipment and buildings are distin-guished. 
CASE Network Reports No. 76/2007 
Price convergence in the enlarged internal market 
45 
The convergence tests are carried out for these groups, see Table IV.3 for the EU25 results. 
Table VI.3: Price convergence in terms of groups of basic headings 
-EU25 countries 
β-convergence 
Non durables Semi durables Durables Services Equipment Buildings 
Pt-1 
0.830 
(0.063) 
0.663 
(0.088) 
0.720 
(0.056) 
0.960 
(0.020) 
0.827 
(0.065) 
0.894 
(0.039) 
Speed 0.186 0.411 0.329 0.041 0.189 0.112 
Half-life 3.7 1.7 2.1 NA 3.7 6.2 
σ-convergence 
Time trend -0.007 
(0.002) 
-0.012 
(0.003) 
-0.025 
(0.011) 
-0.011 
(0.002) 
-0.019 
(0.003) 
0.005 
(0.001) 
Note: Sample period 2000-2004, 24 countries, Luxembourg excluded. Arellano-Bond estimation for β-convergence, OLS regression 
for σ-convergence. Numbers in parantheses denote robust standard deviations. Basic headings are split into 69 non durables, 26 semi 
durables, 29 durables, 75 services, 20 for investment in equipment and 15 for buildings. 45 basic headings could not be classified. 
NA=A reasonable estimate cannot be reported, as the speed of convergence is close to 0. 
According to the empirical evidence, the speed of convergence rises with the tradability of the product. As a 
consequence, shocks are expected to be removed by 50 percent after 2.1 years in case of durables, compared to 
3.7 years for non durables. For investment, convergence turns out to be faster for equipments. although equipment 
and buildings converge at a similar speed to (probably different) steady states in more homogeneous EU15 and 
EU10 samples (see Table A7 in the appendix). The impact of shocks appears to be longer for non tradables, such as 
services. Sigma convergence can be established for most categories. 
VI.3 Determinants of price convergence 
After establishing the presence of price convergence, insights into their determinants are provided. In particular, 
CPLs for broad categories and basic headings are regressed on a number of explanatory variables, i.e. the catching 
up factor and competition variables. As in the analysis of β- and σ-convergence, the number of cross sections is 
equal to the product of countries times the number of prices. The panel regressions are estimated both for broad 
categories and basic headings using OLS with fixed effects. The results are displayed in Table VI.4. 
Sigma convergence can be detected also in terms of the coefficient of variation, but only for broad categories. In the 
case of basic headings, the results are affected by some very low means in the original data.
All variables are estimated with the expected signs. While catching up has a positive impact, competition exerts a neg-ative 
CASE Network Reports No. 76/2007 
Ch. Dreger, K. Kholodilin, K. Lommatzsch, J. Slacalek, P. Wozniak 
46 
effect on relative prices. Price controls do not appear to be significant. However, this reflects the opposite effects of 
this variable in the EU15 and EU10 subsamples, see Table A8 in the appendix. In fact, the abolishment of price controls 
has a negative impact for the Old Member States, but a positive one for the New Member States. Over the catching up 
period, regulations will be reduced in the EU10, and this will reinforce convergence. The subsamples also indicate that 
catching up is a phenomenon especially linked to the price evolution in the New Member States. More or less, the basic 
headings analysis confirms the results obtained at the level of broad categories, see Table VI.4. 
Table VI.4: Determinants of relative prices (CPLs) 
-EU25 
Broad categories Basic headings 
Catching up 0.109 
(0.004) 
0.111 
(0.004) 
Import penetration -0.040 
(0.003) 
-0.001 
(0.0003) 
Price controls 0.012 
(0.006) 
-0.001 
(0.001) 
Note: Sample period 1999-2005 for broad categories, 2000-2004 for basic headings. 24 countries, Luxembourg excluded. OLS fixed 
effects estimation. Numbers in parantheses denote robust standard deviations. 6,888 observations for broad categories (24 coun-tries×41 
indices×7 years), 32,280 observations for the basic headings (24 countries×269 indices×5 years). The original number of 
basic headings (279) has been reduced by 10 outliers. 
Finally, Table VI.5 reports evidence at the more disaggregated level. As in the convergence analysis, the basic 
headings for consumption are splitted into non durables, semi durables, durables and services. On the investment 
side, basic headings for equipment and buildings are distinguished. 
All variables are estimated with the correct signs. Again, catching up appears to be the most important regres-sor, 
especially for the New Member States (see Table A9 in the appendix). The catching up coefficient is high in 
case of services, and particularly low for durables. This finding is in line with the Balassa-Samuelson prediction. 
According to this hypothesis, catching up should be more visible for non-tradables. However, the evidence is not 
entirely consistent on this point: for example, the catching up coefficient for non-durables falls below the one for 
semi durables, which are tradable to a higher extent. Eventually, this finding is caused by conceptual difficulties 
with assigning products to the groups considered here: the classification schemes for foreign trade data and basic 
headings do not perfectly coincide, and some arbitrariness might have biased the results. For some groups like 
services, trade data is not available at all, and has been replaced by the national series. 
To avoid possible simultaneity bias due to endogeneous regressors, all models have been estimated using instruments 
(first and two period lags) instead of the contemporaneous values of the catching up factor.
CASE Network Reports No. 76/2007 
Price convergence in the enlarged internal market 
47 
Table VI.5: Determinants of relative prices (CPLs) for groups of basic headings 
-EU25 
Non durables Semi durables Durables Services Equipment Buildings 
Catching up 0.080 
(0.009) 
0.116 
(0.012) 
-0.004 
(0.010) 
0.159 
(0.009) 
0.087 
(0.016) 
0.027 
(0.014) 
Import pen-etration 
-0.002 
(0.001) 
-0.002 
(0.002) 
-0.002 
(0.001) 
-0.001 
(0.001) 
-0.002 
(0.001) 
-0.002 
(0.001) 
Price controls 0.002 
(0.001) 
0.001 
(0.002) 
-0.001 
(0.002) 
-0.003 
(0.001) 
0.001 
(0.003) 
0.002 
(0.002) 
Note: Sample period 2000-2004, 24 countries, Luxembourg excluded. Panel models estimated with two way fixed effects. Numbers 
in parantheses denote robust standard deviations. Basic headings are split into 69 non durables, 26 semi durables, 29 durables, 75 
services, 20 for investment in equipment and 15 for buildings. 45 basic headings could not be classified. 
Competition proxied by import penetration enters with a negative sign and is significant with the exception of 
semi durables and services. On average, competition exerts a dampening effect on prices. Price controls do not 
show a clear pattern, since they work differently for the Old and the New Member States, see Table A9 in the ap-pendix. 
Removing price controls will lead to a decrease in relative prices in the Old, but to an increase in the New 
Member States. In the overall sample (Table VI.5), these opposite effects cancel out. 
Catching up and competition are relevant especially for the New Member States, where significant effects can be 
detected in most cases. For the Old Member States, a significant contribution of competition can be detected only 
for non durables. In fact, competition seems to have increased especially during the 1990s, which are excluded 
from the period under study. Furthermore, as the New Member States account only for 5 percent of real GDP in the 
Internal Market, their additional impact on competition in the Old Member States might be hardly visible. 
Overall, there is some evidence that price convergence takes place in the Internal Market. Due to the enlarge-ment, 
the speed of convergence has increased. Both catching up and competition factors are relevant to explain 
the process of price convergence, especially for the New Member States. However, it should be noted that the time 
series dimension of the regressions is too short to arrive at definitive conclusions. This is particularly true in the 
case of basic headings, and might explain some inconclusive results of the analysis.
The main aim of the study is to investigate the effects of EU enlargement on price convergence. The Internal Mar-ket 
is expected to foster market integration and increase efficiency and welfare through a convergence of prices. 
Although a high degree of market integration is achieved, price dispersion in the EU has considerably increased 
with the enlargement in 2004. Price levels in the New Member States are substantially lower than in the Old 
Member States, most likely due to their lower level in per capita income. Moreover, lacks in tradability and in the 
reputation of goods and services produced in the New Member States may play a role. In addition, inflation rates 
in the New Member States exceed the average of the EU15. 
Two principal forces are crucial to explain the process of price convergence in the Internal Market. On the one 
hand, the catching up process of low income countries leads to a rise in the price levels and higher inflation over a 
transition period. The increase in overall price level affects consumption and production patterns. This tendency is 
based on market reforms, the composition of value added and an increase in the variety and quality of goods. On 
the other hand, the rise in competition exerts a downward pressure on prices because of lower mark ups. 
The Law of One Price (LOP) is taken as the point of departure, as it constitutes the fundamental mechanism for 
price convergence to hold in a perfectly competitive market. It postulates that in the absence of barriers to trade, 
arbitrage will necessarily force prices of identical products to converge, i.e. the domestic price is equal to the for-eign 
CASE Network Reports No. 76/2007 
Ch. Dreger, K. Kholodilin, K. Lommatzsch, J. Slacalek, P. Wozniak 
Part VII: 
Conclusions 
48 
price, when both are expressed in the same currency. Domestic prices are determined by foreign conditions, 
implying that prices are exogeneous from the perspective of small open economies. But deviations can persist due 
to transportation costs. Arbitrage will not occur if price differences are not sufficient to cover the related costs. In 
addition, not all products are tradable in the Internal Market. Even tradable products contain non tradable compo-nents. 
Prices of non tradables are lower in the New Member States, as long as they are in the a catching up phase. 
The literature clearly indicates substantial deviations from the LOP even over longer periods of time. However, the 
LOP might be interpreted as an equilibrium relationship for the long run. Over long time horizons, the impedi-ments 
of the LOP will gradually lose their significance, i.e. price differentials cannot exist forever. 
Because the LOP is not an attractor in the short and medium run, the price setting behaviour of firms has to be 
linked to domestic factors. It can be explained in terms of the mark up of prices over marginal costs of production. 
If markets are fully competitive, prices and marginal costs will coincide, implying that any mark up should van-ish. 
In an environment of monopolistic competition firms are able to charge prices that include a mark up over 
marginal costs. Therefore, cross country deviations in price levels may be traced to cross country differences in 
marginal costs or in mark ups. For the purpose of this study these determinants have been grouped into catching 
up and competition variables.
Due to the absence of a sufficient amount of absolute price data, �research has been often focused on certain areas 
or products, where prices are relatively easy available, such as in the food sector. However, these prices are less repre-sentative 
for the functioning of the Internal Market. On the other hand, studies based on relative price aggregates can-not 
distinguish whether the effect of lower price dispersion is caused by the convergence of prices of individual goods 
or services or a change in the weighting system. Moreover, consumer and producer price indexes are less informative 
regarding advances in competition, as they reflect cumulated inflation rates rather than absolute prices. T�he focus on 
the representativity of products for the country considered makes them less useful for international comparisons. 
To overcome the disadvantages of price indices�, the analysis refers to comparative price levels (CPLs). These 
measures are calculated as the ratio between purchasing power parities (PPPs) and nominal exchange rates. PPPs 
are based on price levels of a comparable and representative sample of goods and services covering the various 
aggregates of GDP in the EU25 member states. At the most disaggregated level, PPPs rely on relative price ratios 
for 279 basic headings. 
Distinct factors are identified to obtain insights into the impact of catching up and competition on the path of 
price convergence. A factor analysis is conducted, where a catching up factor is extracted by means of principal 
component analysis. It is derived from a dataset comprising real GDP, real productivity of labour, and real com-pensation 
of employees. The first principal component is interpreted as the catching up factor, since it represents 
almost all of the variation of its ingredients. 
Competition is more difficult to address. It is partially, albeit not perfectly, manifested in the openness to foreign 
trade or the degree of import penetration, and the strength of business regulation, the latter proxied by the Fraser 
index. This measure can be broken down into its ingredients, such as price controls, the burden of regulation, time 
with government bureaucracy, the ease of starting a new business and irregular payments. For the purpose of this 
study, price controls are chosen as the most important subindicator. Openness and import penetration are strongly 
correlated and both are related to market integration. Import penetration might be more informative because it 
reflects the exposure of the domestic market to international competition and is therefore preferred in the analysis. 
As the correlation of import penetration and openness to foreign trade with either price controls or the Fraser 
index is rather weak, the estimation of a competition factor would be rather imprecise: a substantial part of infor-mation 
would be classified as idiosyncratic and dropped from the analysis. Therefore, it seems more reasonable to 
directly include the original variables in the regression equation of the determinants on price convergence. 
The empirical analysis shows a negative relation between the initial price level and subsequent price increases. 
Countries with lower initial price levels tend to have higher inflation rates thereafter. Convergence of price levels 
will gradually occur. Convergence appears to be stronger in case for basic headings, probably as they are related 
to more homogeneous products. In addition, the speed of convergence seems to rise with the tradability of the 
product considered. Shocks are expected to be removed by 50 percent after 2.1 years in case of durables, com-pared 
to 3.7 years for non durables. The impact of shocks is even longer for services and buildings. In addition, a 
decline in the price dispersion over time can be observed, as the slope coefficient in a trend regression appears to 
be significant in all cases. 
Catching up and competition seems to be important drivers to explain the path of price convergence. Catching 
up appears to be the most important regressor, especially for the New Member States. The catching up coefficient 
is high in the case of services, and low for durables. This finding seems to be in line with the Balassa-Samuelson 
prediction, as catching up should be more visible for non-tradables. Probably due to classification problems, the 
evidence is not entirely consistent on this point: for example, the catching up coefficient for non-durables falls be-low 
the one for semi durables, where the latter products are tradable to a higher extent. 
Competition exerts a downward pressure on prices, most notably in the New Member States. For the Old Mem-ber 
States competition may have increased especially during the 1990s, which are not part of the analysis. In ad- 
CASE Network Reports No. 76/2007 
Price convergence in the enlarged internal market 
49
dition, the New Member States account only for 5 percent of real GDP in the Internal Market. Thus, their impact 
on competition in the Old Member States could be hardly visible. In fact, competition is insignificant in the EU15 
subsample in most cases. Finally, the removal of price controls will lead to a decrease in relative prices in the Old, 
but to an increase in the New Member States. The opposite effects can be explained by the different degrees of price 
regulation in the Old and New Member States. 
To sum up, there is some evidence that price convergence takes place in the Internal Market. Due to the enlarge-ment, 
CASE Network Reports No. 76/2007 
Ch. Dreger, K. Kholodilin, K. Lommatzsch, J. Slacalek, P. Wozniak 
50 
the speed of convergence has increased. Both catching up and competition factors are relevant to explain 
the process of price convergence, especially for the New Member States. However, it should be noted that the time 
series dimension of the regressions is too short for definitive conclusions. This is particularly true in the case of 
basic headings, and might explain some inconclusive results of the analysis.
References 
Allington, Nigel F. B., Kattuman, P., Waldmann, F.A. (2005): One Market, one money, one price?, International 
Journal of Central Banking 1, 73-115. 
Andrén, N., Oxelheim, L. (2006): Producer prices in the transition to a common currency, Research Institute for 
Industrial Economics, Stockholm, Working paper 668. 
Arratibel, O., Rodriguez-Palenzuela, D., Thimann, C. (2002): Inflation dynamics and dual inflation in accession 
countries: a ‘New Keynesian’ perspective, ECB Working Paper 132, 2002. 
Arellano, M., Bond, S. (1991): Some tests of specification for panel data. Monte Carlo evidence and an application 
to employment equations, Review of Economic Studies 58, 277-297. 
Backé, P., Fidrmuc, J., Schardax, F., Reininger, T. (2002): Price dynamics in Central and Eastern European EU ac-cession 
CASE Network Reports No. 76/2007 
Price convergence in the enlarged internal market 
51 
countries, Oesterreichische Nationalbank Working Paper 61. 
Balassa, B. (1964): The purchasing-power parity doctrine: a reappraisal, Journal of Political Economy 72, 584-596. 
Banerjee, A., Russell, B. (2004): A reinvestigation of the mark up and the business cycle, Economic Modelling 21, 
267-284. 
Banerjee, A., Russell, B. (2005): Inflation and measures of the mark up, Journal of Macroeconomics 27, 289-306. 
Barro, R., Sala-i-Martin, X. (1995): Economic Growth, MIT Press, New York. 
Benigno, G., Thoenissen, C. (2003): Equilibrium exchange rates and capital and supply side performance, Eco-nomic 
Journal 113, 103-124. 
Bills, M., Klenow, P. (2002): Some evidence on the importance of price stickiness, NBER Working Paper 9069. 
Blaszkiewicz, M., Kowalski, P., Rawdanowicz, L., Wozniak, P. (2004): The Harrod-Balassa-Samuelson effect in select-ed 
countries of Central and Eastern Europe, CASE Report 57, Center for Social and Economic Research, Warzaw. 
Bloom N., Bond S., van Reen J. (2007): Uncertainty and investment dynamics, Review of Economic Studies 74, 
391–415. 
Borio, C., Filardo, A. (2006): Globalisation and inflation: New cross country evidence on the global determinants 
of domestic inflation, Bank for International Settlements, mimeo. 
Calvo, G. (1983): Staggered price setting in a utility maximising framework, Journal of Monetary Economics 12, 
383-398. 
Cecchetti, S.G., Mark, N.C., Sonora, R.J. (2000): Price level convergence among United States cities: Lessons for 
the European Central Bank, NBER Working paper 7681. 
Chen, N., Imbs, J., Scott, A. (2006): The Dynamics of trade and competition, Working Paper 96, National Bank of 
Belgium. 
Ciccarelli, M. Mojon, B. (2005): Global inflation, Working Paper 537, European Central Bank. 
Cihak, M., Holub, T. (2001): Convergence of relative prices and inflation in Central and Eastern Europe, Interna-tional 
Monetary Fund Working Paper WP01/124. 
Cihak, M., Holub, T. (2003): Price convergence: What can the Balassa-Samuelson model tell us?, Czech National 
Bank Working Paper 8/2003. 
Corsetti, G., Dedola, L. (2005): A macroeconomic model of international price discrimination, Journal of Interna-tional 
Economics 67, 129-155. 
Crucini, M.J., Telmer, C.I., Zachariadis, M. (2005): Understanding European real exchange rates, American Eco-nomic 
Review 95. 
Dierx, A., Ilzkovitz, F., Sekkat, K. (2002): European integration and the functioning of product markets: selected 
issues, EU Commission: Special Report on the European economy 2. 
De Broeck, M., Sløk, T. (2001): Interpreting real exchange rate movements in transition countries, Bank of Finland 
Institute for Economies in Transition Discussion paper.
DG Internal Market (1996): Price competition and price convergence, Single Market Review Series, http://europa. 
eu.int/comm/internal_market/studies/stud28.htm. 
Dobado, R., Marrero, G. (2005): Corn market integration in Porfirian Mexico, Journal of Economic History 65, 
103-128. 
Égert, B. (2003): Nominal and real convergence in Estonia: The Balassa-Samuelson (dis)connection, Bank of Es-tonia 
CASE Network Reports No. 76/2007 
Ch. Dreger, K. Kholodilin, K. Lommatzsch, J. Slacalek, P. Wozniak 
52 
Working paper. 
Égert, B. (2006): Price level convergence and inflation rates in Europe: East-West Divide?, mimeo. 
Égert, B., Halpern, L., MacDonald, R. (2006), Equilibrium exchange rates in transition economies: Taking stock of 
the issues, �Journal of Economic Surveys 20, 257-324. 
Égert, B., Lommatzsch, K. (2005): The tradable based real exchange rate and estimation uncertainty, In: Welfens, 
P. J.J., Wziatek-Kubiak, A. (eds.): Structural change and exchange rate dynamics, Springer Berlin Heidelberg 
NewYork. 
Eichenbaum, M., Fisher, J.D. (2004): Evaluating the Calvo model of sticky prices, NBER Working Paper 10617. 
Engel, C. (1993): Real exchange rates and relative prices: An empirical investigation, Journal of Monetary Eco-nomics 
32, 35-50. 
Engel, C., Rogers, J.H. (1996): How wide is the border?, American Economic Review 86, 1112-25. 
Engel, C., Rogers, J.H. (2001): Violating the Law of One Price: Should we make a federal case out of it? Journal of 
Money, Credit and Banking 33, 1-15. 
Engel, C., Rogers, J. (2004): European Product Market Integration after the Euro, Economic Policy, 39, 347-384. 
European Central Bank (2003), Inflation differentials in the euro area: potential causes and policy implications, 
Frankfurt. 
European Commission (2000): The Lisbon European Council – An agenda of economic and social renewal for 
Europe. 
European Commission (2001): Price levels and price dispersion in the EU, European economy, Supplement A. 
European Commission (2004a): Preliminary analysis of price data, DG Internal Market. 
European Commission (2004b): Facing the challenge. The Lisbon strategy for growth and employment. Report 
from the high level group chaired by Wim Kok. 
European Commission (2005): Internal market scoreboard 14. 
Eurostat (2003), Purchasing power parities and related economic indicators for the euro area, accession countries, 
candidate countries and EFTA, Statistics in Focus 64. 
Faber, R.P., Stokman, C.J. (2005): Price convergence in Europe from a macro perspective: Product categories and 
reliability, De Nederlandsche Bank, Working paper 34/05. 
Goldberg, P.K., Verboven, F. (2004): Cross-country price dispersion in the European car market, Economic Policy 
19, 483-521. 
Goldberg, P.K., Verboven, F. (2005): Market integration and convergence to the law of one price: Evidence from the 
European car market, Journal of International Economics 65, 49-73. 
Gwartney, J., Lawson, R., with Gartzke, E. (2005): Economic Freedom of the World: 2005 annual report of the 
Fraser Institute, http://www.freetheworld.com. 
Haskel, J., Wolf, H. (2001): The Law of One Price - A case study, NBER Working Papers 8112. 
Hlouskova, J., Wagner, M. (2004): What’s really the story with this Balassa Samuelson effect in the CEECs, Univer-sity 
of Bern, Discussion Paper 04-16. 
International Monetary Fund (2006): How has globalization affected inflation?, World Economic Outlook, Chapter 3. 
Koedijk, K., Tims, B., van Dijk, M. (2004): Purchasing power parity and the euro area, Journal of International 
Money and Finance 23, 1081-1107.
Kovács, M.A. (2002): On the estimated size of the Balassa-Samuelson effect in five Central and Eastern European 
countries, National Bank of Hungary, Working Paper 2002/5. 
Lee, J., Tang, M.K. (2003): Does productivity growth lead to appreciation of the real exchange rate?, IMF Working 
Paper WP/03/154. 
Lojschová, A. (2003): Estimating the impact of the Balassa-Samuelson effect in transition economies, Institute for 
Advanced Studies, Vienna, Economic Series 140. 
Lommatzsch, K., Tober, S. (2004), What is behind the real appreciation of the accession countries’ currencies? An 
investigation of the PPI-based real exchange rates, Economic Systems 28, 383-403. 
Lutz, M (2004): Price convergence under EMU? First estimates, in Deardorff, A. (ed.): Past, present, and future of 
the European Union. Proceedings of the 13th World Congress of the International Economic Association, Macmil-lan 
CASE Network Reports No. 76/2007 
Price convergence in the enlarged internal market 
53 
Press. 
Mathä, T. Y. (2003): What to expect of the euro? Analysing price differences of individual products in Luxembourg 
and its surrounding regions, Working paper 8, Central Bank of Luxembourg. 
MacDonald, R., Ricci, L. (2001): PPP and the Balassa Samuelson effect: The role of the distribution sector, IMF 
Working Paper WP/01/38. 
MacDonald, R., Wójcik, C. (2004): Catching up: The role of demand, supply and regulated price effects on the real 
exchange rates of four accession countries, Economics of Transition 12, 153-179. 
Mihaljek, D., Klau, M. (2003): The Balassa-Samuelson effect in Central Europe: A disaggregated analysis, Bank of 
International Settements Working Paper 143. 
Mumtaz, H., Surico, P. (2006): Evolving international inflation dynamics: World and country specific factors, Bank 
of England. 
O’Connell, P.G.J., Wei, S.-J. (1997): The bigger they are, the harder they fall: How price differences across US cities 
are arbitraged, NBER Working Papers 6089. 
Obstfeld, M., Rogoff, K. (1996): Foundations of international macroeconomics, Cambridge (Mass.), MIT Press. 
Obstfeld, M, Taylor, A. (1997): Nonlinear aspects of goods-market arbitrage and adjustment: Heckscher’s commod-ity 
points revisited, Journal of the Japanese and International Economies 11, 441-479. 
Pain, N., Koske, I., Sollie, M. (2006): Globalisation and inflation in the OECD economies, OECD Economics De-partment 
Working Paper 524. 
Parsley, D.C., Wei, S.-J. (1996): Convergence to the Law of One Price without trade barriers and currency fluctua-tions, 
Quarterly Journal of Economics 111, 1211-36. 
Parsley, D.C., Wei, S.-J. (2003): A prism into the PPP Puzzles: The microfoundations of Big Mac real exchange 
rates, NBER Working Paper 10074. 
Romer, D. (2001): Advanced Macroeconomics, 2nd edition, Boston. 
Rogers, J., Hufbauer, G.C., Wada, E. (2001): Price level convergence and inflation in Europe, Institute for Interna-tional 
Economics Working Paper 01-01. 
Rogers, J.H. (2002): Monetary union, price level convergence, and inflation: How close is Europe to the United States?, 
International Finance Discussion Papers 740. Washington: Board of Governors of the Federal Reserve System. 
Rogoff, K. (1996): The purchasing power parity puzzle, Journal of Economic Literature 34, 647-668. 
Roodman D. (2006): How to do xtabond2: An introduction to “difference” and “system” GMM in Stata. mimeo. 
Samuelson, P.A. (1964): Theoretical notes on trade problems. Review of Economics and Statistics 46, 145-154. 
Smets, F., Wouters, R. (2002): An estimated stochastic dynamic general equilibrium model of the euro area, ECB 
Working paper 171. 
Taylor, J. (1982): Aggregate dynamics and staggered contracts, Journal of Political Economy 88, 1-24. 
Varian, H.R. (2006): Intermediate microeconomics. A modern approach, W.W. Norton & Co Ltd., London.
Wagner, M. (2005): The Balassa-Samuelson effect in ‘East and West’. Differences and similarities, Institute for 
Advanced Studies, Vienna, Economics Series 180. 
Wolf, H. (2003): International relative prices: Facts and interpretation, Annex D, Prices and EMU, HM Treasury, 
London. 
Wolszczak-Derlacz, J. (2006): One Europe, one product, two prices. The price disparity in the EU, Katholieke Uni-versiteit 
CASE Network Reports No. 76/2007 
Ch. Dreger, K. Kholodilin, K. Lommatzsch, J. Slacalek, P. Wozniak 
54 
Leuven, Center for Economic Studies, Discussion Paper 06.14.
CASE Network Reports No. 76/2007 
Price convergence in the enlarged internal market 
5 
Appendix
CASE Network Reports No. 76/2007 
Ch. Dreger, K. Kholodilin, K. Lommatzsch, J. Slacalek, P. Wozniak 
Table A1: Relative price levels of selected product categories 
56 
BL GE FR LU NL AT FN GR SP IR IT PT DK 
GDP 
1995a00 107 119 107 116 105 110 113 72 80 87 78 69 130 
1999a00 105 112 104 110 103 104 110 80 82 103 90 73 126 
2004a00 100 103 106 106 103 100 112 80 87 115 99 81 130 
2005a00 100 103 105 106 103 101 113 81 89 116 100 82 131 
Total goods 
1995a00 105 114 108 109 105 109 107 83 84 88 80 82 133 
1999a00 103 108 106 102 105 105 103 90 85 103 92 83 131 
2004a00 99 103 105 98 107 103 109 86 91 119 97 86 128 
2005a00 100 103 103 99 105 103 109 87 91 120 99 86 128 
Consumer goods 
1995a00 106 106 108 104 100 111 126 88 88 97 87 90 133 
1999a00 105 102 105 96 101 104 117 93 86 106 98 90 132 
2004a00 101 102 101 97 101 102 113 87 87 116 105 92 131 
2005a00 102 102 100 98 100 102 112 88 88 115 105 92 131 
Non-durable goods 
1995a00 104 107 106 100 97 111 124 80 85 96 91 85 136 
1999a00 103 101 107 93 95 103 118 89 84 109 102 88 135 
2004a00 101 104 103 96 104 102 113 82 81 121 104 89 133 
2005a00 102 105 102 97 103 102 112 82 82 121 104 88 132 
Semi-durable goods 
1995a00 113 107 112 117 101 107 124 103 90 91 82 88 115 
1999a00 114 105 103 109 106 106 109 101 91 89 94 84 113 
2004a00 103 102 96 104 91 105 109 95 98 99 106 90 116 
2005a00 104 101 96 104 88 104 108 99 99 95 107 90 115 
Durable goods 
1995a00 106 103 108 106 110 116 135 102 96 109 81 114 146 
1999a00 102 102 101 95 113 107 122 100 90 117 94 100 142 
2004a00 101 95 100 97 103 101 117 101 98 117 105 111 142 
2005a00 102 95 99 97 103 100 115 102 99 116 106 112 143 
Capital goods 
1995a00 104 126 108 116 111 106 85 76 78 76 70 69 132 
1999a00 101 117 107 112 111 105 88 85 83 100 83 75 131 
2004a00 96 104 112 99 115 105 104 84 95 121 88 77 123 
2005a00 99 104 108 100 112 106 104 85 95 126 90 77 125 
Total services 
1995a00 109 126 106 128 106 111 120 63 77 85 75 59 129 
1999a00 108 118 102 121 102 104 119 72 80 103 89 64 124 
2004a00 102 105 106 120 102 98 119 75 83 119 101 78 137 
2005a00 102 104 106 120 102 98 119 76 85 119 102 78 138 
Consumer services 
1995a00 109 121 116 114 109 110 128 70 79 89 75 52 129 
1999a00 109 113 111 110 106 102 129 79 82 107 88 59 121 
2004a00 104 101 113 106 104 96 126 81 87 125 98 75 139 
2005a00 103 100 113 105 103 96 125 81 90 124 99 76 138 
Government services 
1995a00 110 132 97 145 104 112 113 54 75 81 76 67 131 
1999a00 107 126 94 137 98 107 109 62 77 100 92 73 129 
2004a00 100 110 100 135 100 101 112 68 79 112 106 81 135 
2005a00 101 110 99 136 100 102 113 69 80 114 107 82 138
CASE Network Reports No. 76/2007 
Price convergence in the enlarged internal market 
57 
SW UK CZ ES CY LA LI HU MT PO SV SL 
GDP 
1995a00 112 83 36 36 80 31 24 41 41 69 38 
1999a00 119 109 43 51 85 44 40 44 64 46 72 40 
2004a00 116 105 51 55 84 47 46 57 65 47 70 50 
2005a00 115 105 55 57 84 48 48 58 67 53 70 51 
Total goods 
1995a00 110 88 
1999a00 116 114 59 74 87 67 62 63 78 62 81 59 
2004a00 117 107 68 74 92 66 66 74 80 60 78 70 
2005a00 118 107 73 74 92 67 68 76 82 68 77 72 
Consumer goods 
1995a00 113 89 
1999a00 116 114 59 68 94 65 60 61 85 60 85 53 
2004a00 116 104 71 71 100 65 65 74 87 62 83 71 
2005a00 112 103 75 72 101 65 66 75 88 70 83 72 
Non-durable goods 
1995a00 118 92 
1999a00 119 113 52 62 83 59 54 55 79 55 83 47 
2004a00 119 107 64 65 98 59 59 68 80 58 79 65 
2005a00 115 107 68 67 100 60 60 70 81 66 79 67 
Semi-durable goods 
1995a00 105 83 
1999a00 114 111 70 76 101 72 69 66 83 70 91 63 
2004a00 114 95 89 84 98 80 81 84 89 70 93 82 
2005a00 111 93 92 86 97 77 80 86 89 76 94 85 
Durable goods 
1995a00 103 89 
1999a00 112 120 86 88 130 95 82 87 109 81 87 78 
2004a00 108 105 87 84 109 83 83 89 115 79 89 86 
2005a00 104 104 90 81 109 82 80 89 115 87 87 87 
Capital goods 
1995a00 105 87 
1999a00 115 114 59 85 77 72 67 68 68 64 75 67 
2004a00 119 113 64 78 80 67 69 74 69 57 71 70 
2005a00 125 114 70 77 80 68 74 78 72 65 70 72 
Total services 
1995a00 115 79 
1999a00 123 106 30 35 81 28 26 30 54 34 63 25 
2004a00 118 102 37 41 76 35 31 43 55 36 64 34 
2005a00 116 103 40 43 76 35 32 44 55 41 64 36 
Consumer services 
1995a00 124 79 
1999a00 132 107 32 47 82 36 31 34 58 40 63 27 
2004a00 119 99 38 52 74 43 37 46 55 42 63 38 
2005a00 116 99 41 54 75 44 39 48 56 48 64 40 
Government services 
1995a00 108 79 
1999a00 116 105 29 26 82 22 22 26 50 28 63 24 
2004a00 116 106 36 33 78 28 26 40 55 31 65 30 
2005a00 115 107 40 34 79 28 27 42 55 36 65 32 
Note: Raw data from Eurostat, in percent of EU12 average (=100). BL=Belgium, GE=Germany, FR=France, LU=Luxembourg, 
NL=Netherlands, AT= Austria, FN=Finland, GR=Greece, SP=Spain, IR=Ireland, IT=Italy, PT=Portugal, DK=Denmark, 
SW=Sweden, UK=United Kingdom, CZ=Czech Republic, ES=Estonia, CY=Cyprus, LA=Latvia, LI=Lithuania, HU=Hungary, MT= 
Malta, PO=Poland, SV=Slovenia, SK=Slovakia.
CASE Network Reports No. 76/2007 
Ch. Dreger, K. Kholodilin, K. Lommatzsch, J. Slacalek, P. Wozniak 
Table A2: Relative price levels of main GDP expenditure categories 
58 
BL GE FR LU NL AT FN GR SP IR IT PT DK 
GDP 
1995a00 107 119 107 116 105 110 113 72 80 87 78 69 130 
1999a00 105 112 104 110 103 104 110 80 82 103 90 73 126 
2004a00 100 103 106 106 103 100 112 80 87 115 99 81 130 
2005a00 100 103 105 106 103 101 113 81 89 116 100 82 131 
Individual consumption 
1995a00 108 116 107 116 104 112 124 74 81 90 80 70 131 
1999a00 107 110 104 107 101 104 119 81 82 105 93 74 127 
2004a00 101 103 104 110 102 100 118 80 85 119 103 84 136 
2005a00 101 102 104 110 101 100 118 81 87 119 103 84 136 
Gross fixed capital formation 
1995a00 104 126 108 116 111 106 85 76 78 76 70 69 132 
1999a00 101 117 107 112 111 105 88 85 83 100 83 75 131 
2004a00 96 104 112 99 115 105 104 84 95 121 88 77 123 
2005a00 99 104 108 100 112 106 104 85 95 126 90 77 125 
Machinery and equipment 
1995a00 99 116 116 102 108 95 103 106 83 95 74 93 129 
1999a00 95 110 109 98 104 93 103 110 87 102 86 99 117 
2004a00 97 102 103 95 100 99 104 106 96 110 96 108 115 
2005a00 99 101 104 94 98 98 102 107 97 107 98 105 113 
Construction 
1995a00 107 131 102 126 118 111 73 61 75 66 66 56 132 
1999a00 104 122 106 125 125 112 78 69 81 100 78 59 143 
2004a00 99 108 116 98 127 111 103 71 92 124 81 59 135 
2005a00 101 109 109 100 127 114 106 72 93 135 83 61 138 
Final consumption expenditure 
1995a00 108 117 107 118 104 111 122 72 80 89 79 69 131 
1999a00 107 112 103 110 102 104 118 79 82 104 93 73 127 
2004a00 101 103 104 112 102 100 117 79 85 118 103 83 135 
2005a00 101 103 104 112 101 100 117 80 86 118 103 83 136 
Household final consumption expenditure 
1995a00 107 112 111 109 104 111 127 78 82 93 81 70 131 
1999a00 107 107 108 101 103 103 122 86 83 106 93 73 126 
2004a00 102 101 106 101 102 99 119 84 88 121 101 84 134 
2005a00 102 100 106 102 102 99 118 85 89 120 102 84 135 
Government final consumption expenditure 
1995a00 110 132 97 145 104 112 113 54 75 81 76 67 131 
1999a00 107 126 94 137 98 107 109 62 77 100 92 73 129 
2004a00 100 110 100 135 100 101 112 68 79 112 106 81 135 
2005a00 101 110 99 136 100 102 113 69 80 114 107 82 138
GDP 
1995a00 112 83 41 36 31 24 38 41 36 69 80 
1999a00 119 109 46 51 44 40 40 44 43 72 85 64 
2004a00 116 105 47 55 47 46 50 57 51 70 84 65 
2005a00 115 105 53 57 48 48 51 58 55 70 84 67 
Individual consumption 
1995a00 115 83 
1999a00 121 110 44 47 42 38 36 40 40 71 87 66 
2004a00 118 103 46 52 46 44 47 54 48 71 86 67 
2005a00 115 103 52 54 47 45 49 55 52 71 86 68 
Gross fixed capital formation 
1995a00 105 87 
1999a00 115 114 64 85 72 67 67 68 59 75 77 68 
2004a00 119 113 57 78 67 69 70 74 64 71 80 69 
2005a00 125 114 65 77 68 74 72 78 70 70 80 72 
Machinery and equipment 
1995a00 94 93 
1999a00 98 106 80 87 79 83 89 80 80 94 91 89 
2004a00 97 99 85 94 86 86 96 91 87 92 107 97 
2005a00 98 98 93 91 87 85 97 93 93 91 103 99 
Construction 
1995a00 117 84 
1999a00 134 122 49 80 63 53 49 58 43 59 64 51 
2004a00 148 126 43 67 55 57 53 63 49 57 66 54 
2005a00 161 128 49 67 57 65 55 68 55 56 68 58 
Final consumption expenditure 
1995a00 114 82 
1999a00 121 109 43 45 39 36 34 39 39 70 87 64 
2004a00 118 103 44 50 44 42 45 53 47 70 84 65 
2005a00 115 103 50 52 45 43 47 54 51 70 85 66 
Household final consumption expenditure 
1995a00 118 84 43 39 36 29 37 41 38 71 
1999a00 123 110 50 56 50 45 40 46 45 74 89 70 
2004a00 117 101 51 61 53 51 53 59 53 73 87 70 
2005a00 114 101 58 62 54 52 55 61 56 72 88 71 
Government final consumption expenditure 
1995a00 108 79 
1999a00 116 105 28 26 22 22 24 26 29 63 82 50 
2004a00 116 106 31 33 28 26 30 40 36 65 78 55 
2005a00 115 107 36 34 28 27 32 42 40 65 79 55 
Note: Raw data from Eurostat, in percent of EU12 average (=100). BL=Belgium, GE=Germany, FR=France, LU=Luxembourg, 
NL=Netherlands, AT= Austria, FN=Finland, GR=Greece, SP=Spain, IR=Ireland, IT=Italy, PT=Portugal, DK=Denmark, SW= 
Sweden, UK=United Kingdom, CZ=Czech Republic, ES=Estonia, CY=Cyprus, LA=Latvia, LI=Lithuania, HU=Hungary, MT= Mal-ta, 
CASE Network Reports No. 76/2007 
Price convergence in the enlarged internal market 
SW UK PO ES LA LI SK HU CZ SL CY MT 
59 
PO=Poland, SV=Slovenia, SK=Slovakia.
CASE Network Reports No. 76/2007 
Ch. Dreger, K. Kholodilin, K. Lommatzsch, J. Slacalek, P. Wozniak 
Table A3: Relative price levels of main COICOP categories 
60 
BL GE FR LU NL AT FN GR SP IR IT PT DK 
Individual consumption 
1995a00 108 116 107 116 104 112 124 74 81 90 80 70 131 
1999a00 107 110 104 107 101 104 119 81 82 105 93 74 127 
2004a00 101 103 104 110 102 100 118 80 85 119 103 84 136 
2005a00 101 102 104 110 101 100 118 81 87 119 103 84 136 
Alcoholic beverages, tobacco and narcotics 
1995a00 112 106 105 97 109 116 189 77 69 161 89 75 159 
1999a00 107 99 115 84 102 104 164 85 71 163 104 76 146 
2004a00 100 100 114 88 104 98 137 83 78 185 100 83 124 
2005a00 99 103 110 89 102 98 130 82 78 179 101 83 123 
Alcoholic beverages 
1995a00 115 95 107 105 117 116 229 94 76 194 82 81 154 
1999a00 105 92 111 94 107 107 192 99 76 179 101 80 136 
2004a00 93 95 94 91 103 100 169 100 84 198 111 112 132 
2005a00 96 95 94 93 103 99 162 104 84 199 113 111 130 
Tobacco 
1995a00 112 120 105 91 104 117 153 70 64 141 93 71 170 
1999a00 110 108 119 79 99 103 138 79 69 154 105 73 157 
2004a00 114 109 147 84 107 97 115 73 73 185 92 68 124 
2005a00 109 116 138 85 105 99 109 69 72 174 94 68 122 
Clothing and footwear 
1995a00 117 107 117 130 96 106 124 107 90 92 83 95 110 
1999a00 118 108 100 120 103 109 104 102 91 81 95 82 101 
2004a00 104 102 92 106 86 105 110 96 98 94 109 90 108 
2005a00 104 101 92 107 84 104 110 101 100 91 111 90 108 
Housing, water, electricity, gas and other fuels 
1995a00 109 131 115 120 103 100 122 73 69 79 66 40 130 
1999a00 103 120 112 125 106 93 119 77 72 110 80 39 126 
2004a00 105 104 110 111 109 84 116 74 85 128 92 70 134 
2005a00 103 102 110 111 110 86 116 74 89 125 93 70 133 
Household furnishings, equipment and maintenance 
1995a00 107 112 112 113 102 114 119 82 89 88 82 73 117 
1999a00 104 105 110 99 114 104 102 87 86 102 93 75 121 
2004a00 103 96 105 104 95 100 110 93 98 114 105 88 123 
2005a00 104 96 105 105 94 99 111 94 99 111 105 88 123 
Health 
1995a00 113 128 95 130 111 117 120 50 74 80 81 65 137 
1999a00 108 122 90 116 93 108 111 60 79 104 101 69 131 
2004a00 97 99 98 115 100 99 126 75 84 116 122 84 144 
2005a00 97 99 97 116 99 101 128 77 84 119 122 85 147
Individual consumption 
1995a00 115 83 
1999a00 121 110 44 47 42 38 36 40 40 71 87 66 
2004a00 118 103 46 52 46 44 47 54 48 71 86 67 
2005a00 115 103 52 54 47 45 49 55 52 71 86 68 
Alcoholic beverages, tobacco and narcotics 
1995a00 165 138 
1999a00 165 189 71 68 63 63 49 49 53 70 104 106 
2004a00 137 180 58 64 55 60 66 70 64 68 136 116 
2005a00 131 175 65 65 53 58 65 70 67 67 131 112 
Alcoholic beverages 
1995a00 192 142 
1999a00 166 164 103 105 99 95 56 61 61 88 141 146 
2004a00 163 163 92 95 98 87 79 86 85 85 165 132 
2005a00 159 160 103 97 95 87 81 88 91 83 163 131 
Tobacco 
1995a00 144 134 
1999a00 167 211 47 44 35 31 44 41 48 58 78 82 
2004a00 123 207 35 40 29 33 58 60 50 58 118 107 
2005a00 115 200 39 40 27 31 56 60 52 58 112 101 
Clothing and footwear 
1995a00 103 81 
1999a00 108 107 67 73 65 65 57 59 68 88 101 77 
2004a00 110 89 70 90 80 85 83 86 96 92 100 88 
2005a00 107 86 74 92 77 84 85 88 98 91 98 87 
Housing, water, electricity, gas and other fuels 
1995a00 121 62 
1999a00 121 78 30 41 25 24 19 29 28 62 67 40 
2004a00 108 75 34 47 36 30 34 37 37 57 59 34 
2005a00 105 75 39 48 37 31 36 38 39 58 60 35 
Household furnishings, equipment and maintenance 
1995a00 107 90 
1999a00 113 119 58 67 69 61 59 64 67 70 99 85 
2004a00 119 109 62 70 64 65 68 68 71 79 94 97 
2005a00 115 108 70 70 64 64 68 69 76 82 95 99 
Health 
1995a00 111 81 
1999a00 112 104 29 28 24 23 26 25 28 60 88 55 
2004a00 126 108 36 41 33 31 33 44 35 67 95 63 
2005a00 125 109 41 43 35 35 36 46 39 67 93 64 
Transport 
1995a00 103 101 109 97 115 116 129 73 90 101 86 103 142 
1999a00 104 100 104 89 110 109 130 78 92 112 95 98 141 
2004a00 100 103 100 92 118 110 124 80 90 113 97 91 154 
2005a00 101 103 100 93 118 109 123 80 91 111 98 93 154 
Personal transport equipment 
1995a00 101 95 104 99 118 116 151 118 105 129 87 137 186 
1999a00 100 97 101 90 120 107 140 114 96 133 93 123 183 
2004a00 99 97 97 93 116 105 126 98 98 128 101 123 187 
2005a00 99 96 97 93 117 106 125 97 99 128 102 124 188 
Communication 
1995a00 158 111 100 76 98 145 147 64 84 156 84 82 104 
1999a00 156 111 73 74 154 134 154 74 92 109 104 93 115 
2004a00 104 101 104 81 98 100 84 103 96 110 97 97 80 
2005a00 106 102 105 79 95 94 76 104 97 111 98 98 79 
Recreation and culture 
1995a00 104 103 108 103 94 110 121 86 92 80 90 75 120 
1999a00 109 102 106 104 98 106 125 88 89 99 95 84 124 
2004a00 98 102 104 107 97 100 118 87 91 110 101 87 131 
2005a00 99 102 103 108 97 99 117 88 92 110 101 88 130 
Education 
1995a00 112 150 95 171 101 122 115 56 78 81 73 85 130 
1999a00 110 145 92 167 98 116 112 61 79 95 85 91 129 
2004a00 103 128 96 163 96 105 106 62 73 112 103 95 131 
2005a00 103 128 96 164 97 107 108 63 75 115 102 96 133 
Restaurants and hotels 
1995a00 101 107 118 114 111 111 132 92 90 113 91 60 131 
1999a00 110 97 110 105 90 100 125 107 92 120 103 83 117 
2004a00 108 98 114 99 104 101 129 92 92 129 103 79 155 
2005a00 109 97 113 100 104 101 129 92 94 131 103 78 155 
Miscellaneous goods and services 
1995a00 103 117 106 117 106 116 120 68 76 84 71 69 133 
1999a00 102 108 106 102 98 103 115 81 81 93 90 70 123 
2004a00 100 101 106 104 101 105 122 77 81 118 101 88 141 
2005a00 101 101 105 105 100 106 122 78 83 118 102 88 142 
CASE Network Reports No. 76/2007 
Price convergence in the enlarged internal market 
SW UK PO ES LA LI SK HU CZ SL CY MT 
BL GE FR LU NL AT FN GR SP IR IT PT DK 
61
CASE Network Reports No. 76/2007 
Ch. Dreger, K. Kholodilin, K. Lommatzsch, J. Slacalek, P. Wozniak 
62 
SW UK PO ES LA LI SK HU CZ SV CY MT 
Transport 
1995a00 114 92 
1999a00 115 127 64 63 66 59 55 70 59 75 88 77 
2004a00 125 118 70 68 63 65 71 83 67 82 95 89 
2005a00 122 118 78 70 65 66 72 84 71 80 95 91 
Personal transport equipment 
1995a00 102 94 
1999a00 107 127 86 92 105 93 79 91 89 93 152 129 
2004a00 102 103 84 91 88 87 89 97 92 91 115 124 
2005a00 98 103 90 84 89 81 93 97 95 86 113 122 
Communication 
1995a00 123 122 
1999a00 160 161 115 77 120 89 70 81 68 58 77 127 
2004a00 78 90 81 80 104 59 92 86 86 69 47 85 
2005a00 73 87 92 78 97 59 96 88 100 69 44 91 
Recreation and culture 
1995a00 112 84 
1999a00 126 108 56 58 50 47 43 47 45 85 101 76 
2004a00 119 103 54 57 51 50 50 58 48 78 90 73 
2005a00 116 102 61 59 51 51 52 60 52 79 91 74 
Education 
1995a00 106 89 
1999a00 117 116 23 21 17 18 20 22 24 63 86 51 
2004a00 111 115 27 25 22 20 23 35 32 64 76 52 
2005a00 110 116 31 27 22 22 23 36 36 66 78 53 
Restaurants and hotels 
1995a00 116 92 
1999a00 122 135 64 62 69 46 42 48 45 72 105 76 
2004a00 127 120 59 63 58 56 48 61 46 67 102 71 
2005a00 125 121 67 63 60 56 51 63 49 68 104 70 
Miscellaneous goods and services 
1995a00 108 85 
1999a00 121 107 42 42 40 37 35 35 38 69 73 65 
2004a00 125 107 45 50 42 43 46 53 46 73 85 66 
2005a00 123 108 51 52 42 45 49 54 49 73 86 67 
Note: Raw data from Eurostat, in percent of EU12 average (=100). BL=Belgium, GE=Germany, FR=France, LU=Luxembourg, 
NL=Netherlands, AT= Austria, FN=Finland, GR=Greece, SP=Spain, IR=Ireland, IT=Italy, PT=Portugal, DK=Denmark, 
SW=Sweden, UK=United Kingdom, CZ=Czech Republic, ES=Estonia, CY=Cyprus, LA=Latvia, LI=Lithuania, HU=Hungary, MT= 
Malta, PO=Poland, SV=Slovenia, SK=Slovakia.
CASE Network Reports No. 76/2007 
Price convergence in the enlarged internal market 
63 
Table A4: Mean and standard deviation of variables, 1999-2005 
EU25 EU15 EU10 
Mean Std Dev Mean Std Dev Mean Std Dev 
CPL 1.488 0.087 1.536 0.039 1.420 0.091 
GDP -0.507 0.723 0.021 0.301 -1.246 0.437 
PRO -0.555 0.696 -0.041 0.280 -1.275 0.407 
COM -0.607 0.761 -0.047 0.273 -1.391 0.482 
ER 2.520 2.317 2.771 2.321 2.170 2.266 
PEN 3.807 1.605 3.043 1.367 4.878 1.264 
OPEN 3.657 1.633 3.153 1.605 4.362 1.395 
CONTROL 0.917 0.268 1.021 0.210 0.771 0.273 
Note: Raw data from Eurostat. All variables are in logarithms and, apart from the exchange rate (ER), also in relative terms 
(EU12=100). PRO=Labour productivity, COM=Compensation of employees, PEN=import penetration (share of imports in produc-tion), 
OPEN=Openness to foreign trade (sum of exports and imports divided by GDP). CONTROL=Degree of price controls.
CASE Network Reports No. 76/2007 
Ch. Dreger, K. Kholodilin, K. Lommatzsch, J. Slacalek, P. Wozniak 
Table A5: Correlation matrix of explanatory variables, 1999-2005 
EU25 
64 
GDP PRO COM ER PEN OPEN 
GDP 1.00 0.99 0.99 -0.09 -0.47 -0.26 
PRO 0.99 1.00 0.99 -0.07 -0.46 -0.25 
COM 0.99 0.99 1.00 -0.06 -0.48 -0.29 
ER -0.09 -0.07 -0.06 1.00 -0.04 -0.03 
PEN -0.47 -0.46 -0.48 -0.04 1.00 0.94 
OPEN -0.26 -0.25 -0.29 -0.03 0.94 1.00 
CONTROL 0.43 0.41 0.37 -0.06 -0.13 0.04 
EU15 
GDP PRO COM ER PEN OPEN 
GDP 1.00 0.95 0.92 -0.70 0.19 0.38 
PRO 0.95 1.00 0.96 -0.65 0.25 0.43 
COM 0.92 0.96 1.00 -0.66 0.25 0.38 
ER -0.70 -0.65 -0.66 1.00 -0.13 -0.28 
PEN 0.19 0.25 0.25 -0.13 1.00 0.96 
OPEN 0.38 0.43 0.38 -0.28 0.96 1.00 
CONTROL 0.56 0.50 0.47 -0.53 0.02 0.14 
EU10 
GDP PRO COM ER PEN OPEN 
GDP 1.00 0.98 0.96 -0.12 -0.09 -0.16 
PRO 0.98 1.00 0.97 -0.14 -0.07 -0.14 
COM 0.96 0.97 1.00 -0.11 -0.16 -0.23 
ER -0.12 -0.14 -0.11 1.00 0.31 0.51 
PEN -0.09 -0.07 -0.16 0.31 1.00 0.96 
OPEN -0.16 -0.14 -0.23 0.51 0.96 1.00 
CONTROL -0.28 -0.36 -0.42 0.29 0.37 0.39 
Note: Raw data from Eurostat. �All variables are in logarithms and, apart from the exchange rate (ER), also in relative terms 
(EU12=100). PRO=Labour productivity, COM=Compensation of employees, PEN=import penetration (share of imports in produc-tion), 
OPEN=Openness to foreign trade (sum of exports and imports divided by GDP). CONTROL=Degree of price controls.
CASE Network Reports No. 76/2007 
Price convergence in the enlarged internal market 
65 
Table A6: Price convergence in terms of broad categories and basic headings 
EU15 
Broad categories Basic headings 
β-convergence 
CPLt-1 
0.931 
(0.011) 
0.578 
(0.008) 
Dummy*CPLt-1 
-0.054 
(0.022) 
Speed of convergence 0.07 0.24 
Half-life 9.8 2.9 
σ-convergence 
Time trend -0.032 
(0.001) 
-0.207 
(0.005) 
Dummy*Time trend 0.016 
(0.001) 
EU10 
Broad categories Basic headings 
β-convergence 
CPLt-1 
0.935 
(0.005) 
0.703 
(0.065) 
Dummy*CPLt-1 
-0.048 
(0.018) 
Speed of convergence 0.07 0.15 
Half-life 10.3 4.5 
σ-convergence 
Time trend -0.064 
(0.002) 
-0.013 
(0.001) 
Dummy*Time trend 0.028 
(0.003) 
Note: Sample period 1999-2005 for broad categories, 2000-2004 for basic headings, Luxembourg excluded. Dummy is equal to 1 from 
2004 onwards, 0 elsewhere. Arellano-Bond estimation (β-convergence), OLS regression (σ-convergence). Numbers in parentheses 
denote standard deviations. 6.888 observations for broad categories (24 countries×41 indices×7 years), 32.280 observations for the 
basic headings (24 countries×269 indices×5 years). The original number of basic headings (279) has been reduced by 10 outliers.
CASE Network Reports No. 76/2007 
Ch. Dreger, K. Kholodilin, K. Lommatzsch, J. Slacalek, P. Wozniak 
Table A7: Price convergence in terms of groups of basic headings 
EU15 
β-convergence 
6 
Non durables Semi durables Durables Services Equipment Buildings 
Pt-1 
0.585 
(0.016) 
0.344 
(0.009) 
0.343 
(0.008) 
0.832 
(0.008) 
0.727 
(0.012) 
0.739 
(0.008) 
Speed 0.54 1.07 1.07 0.18 0.32 0.30 
Half-life 1.3 0.7 0.6 3.8 2.2 2.3 
σ-convergence 
Time trend -0.211 
(0.002) 
-0.208 
(0.003) 
-0.210 
(0.002) 
-0.199 
(0.003) 
-0.221 
(0.004) 
0.179 
(0.005) 
EU10 
β-convergence 
Non durables Semi durables Durables Services Equipment Buildings 
Pt-1 
0.725 
(0.091) 
0.243 
(0.111) 
0.714 
(0.074) 
0.997 
(0.010) 
0.764 
(0.188) 
0.794 
(0.055) 
Speed 0.32 1.42 0.34 NA 0.27 0.23 
Half-life 2.2 0.5 2.1 NA 2.6 3.0 
σ-convergence 
Time trend -0.015 
(0.003) 
-0.012 
(0.004) 
-0.022 
(0.002) 
-0.008 
(0.002) 
-0.025 
(0.003) 
-0.016 
(0.002) 
Note: Sample period 2000-2004, 24 countries, Luxembourg excluded. Arellano-Bond estimation (β-convergence), OLS regression 
(σ-convergence). Numbers in parentheses denote standard deviations. Basic headings are split into 69 non durables, 26 semi durables, 
29 durables, 75 services, 20 for investment in equipment and 15 for buildings. 45 basic headings could not be classified. NA=A reason-able 
estimate cannot be reported, as the speed of convergence is close to 0.
CASE Network Reports No. 76/2007 
Price convergence in the enlarged internal market 
67 
Table A8: Determinants of relative prices (CPLs) 
EU15 
Broad categories Basic headings 
Catching up 0.0003 
(0.001) 
0.025 
(0.004) 
Import penetration -0.011 
(0.001) 
-0.004 
(0.001) 
Price controls -0.003 
(0.002) 
-0.003 
(0.001) 
EU10 
Broad categories Basic headings 
Catching up 0.016 
(0.001) 
0.065 
(0.004) 
Import penetration -0.009 
(0.001) 
-0.007 
(0.001) 
Price controls 0.006 
(0.002) 
0.019 
(0.002) 
Note: Sample period 1999-2005 for broad categories, 2000-2004 for basic headings. 24 countries, Luxembourg excluded. Arellano- 
Bond estimation. Numbers in parentheses denote standard deviations. 6.888 observations for broad categories (24 countries×41 indi-ces×7 
years), 32.280 observations for the basic headings (24 countries×269 indices×5 years). The original number of basic headings 
(279) has been reduced by 10 outliers.
CASE Network Reports No. 76/2007 
Ch. Dreger, K. Kholodilin, K. Lommatzsch, J. Slacalek, P. Wozniak 
Table A9: Determinants of relative prices (CPLs) for groups of basic headings 
-EU15 
68 
Non 
durables 
Semi 
durables Durables Services Equipment Buildings 
Catching up 0.023 
(0.011) 
0.002 
(0.017) 
0.010 
(0.014) 
0.041 
(0.007) 
-0.111 
(0.037) 
0.080 
(0.045) 
Import penetration -0.004 
(0.002) 
-0.002 
(0.002) 
-0.001 
(0.001) 
-0.002 
(0.002) 
-0.005 
(0.003) 
-0.005 
(0.003) 
Price controls -0.005 
(0.002) 
-0.013 
(0.004) 
-0.009 
(0.003) 
-0.001 
(0.002) 
-0.010 
(0.004) 
-0.000 
(0.006) 
EU10 
Non 
durables 
Semi 
durables Durables Services Equip-ment 
Buildings 
Catching up 0.067 
(0.010) 
0.119 
(0.011) 
0.043 
(0.008) 
0.063 
(0.005) 
0.112 
(0.011) 
0.023 
(0.013) 
Import penetration -0.004 
(0.003) 
-0.007 
(0.002) 
-0.007 
(0.001) 
-0.003 
(0.002) 
-0.002 
(0.001) 
-0.000 
(0.001) 
Price controls 0.007 
(0.006) 
-0.002 
(0.003) 
0.004 
(0.003) 
0.017 
(0.003) 
0.011 
(0.004) 
-0.010 
(0.007) 
Note: Sample period 2000-2004, 24 countries, Luxembourg excluded. Panel models estimated with two way fixed effects. Numbers in 
parentheses denote standard deviations. Basic headings are split into 69 non durables, 26 semi durables, 29 durables, 75 services, 20 
for investment in equipment and 15 for buildings. 45 basic headings could not be classified.

CASE Network Report 76 - Price Convergence in the Enlarged Internal Market

  • 2.
    CASE Network ReportsNo. 76/2007 Ch. Dreger, K. Kholodilin, K. Lommatzsch, J. Slacalek, P. Wozniak The views and opinions expressed here reflect the authors’ point of view and not necessarily those of CASE Network. This report was prepared within the project on price convergence in the enlarged Internal Market (ECFIN-E/ 2005/002) carried out by researchers from DIW Berlin and CASE – Center for Social and Economic Research. The publication was financed by Rabobank Polska S.A. We would like to thank Jakub Kowalski from the University of Lodz for excellent research assistance. Keywords: EU enlargement, price convergence, catching up and competition JEL codes: E31, F15, C33 © CASE – Center for Social and Economic Research, Warsaw, 2007 Graphic Design: Agnieszka Natalia Bury ISBN 978-83-7178-446-0 EAN 9788371784460 Publisher: CASE-Center for Social and Economic Research on behalf of CASE Network 12 Sienkiewicza, 00-010 Warsaw, Poland tel.: (48 22) 622 66 27, 828 61 33, fax: (48 22) 828 60 69 e-mail: case@case-research.eu http://www.case-research.eu
  • 3.
    CASE Network ReportsNo. 76/2007 Price convergence in the enlarged internal market This report is part of the CASE Network Report series. The CASE Network is a group of economic and social research centers in Poland, Kyrgyzstan, Ukraine, Georgia, Mol-dova, and Belarus. Organizations in the network regularly conduct joint research and advisory projects. The research covers a wide spectrum of economic and social issues, including economic effects of the European integration process, economic relations between the EU and CIS, monetary policy and euro-accession, innovation and competitiveness, and labour markets and social policy. The network aims to increase the range and quality of economic research and information available to policy-makers and civil society, and takes an active role in on-going debates on how to meet the economic challenges facing the EU, post-transition countries and the global economy. The CASE network consists of: • CASE – Center for Social and Economic Research, Warsaw, est. 1991, www.case-reserch.eu • CASE – Center for Social and Economic Research – Kyrgyzstan, est. 1998, www.case.elcat.kg • Center for Social and Economic Research - CASE Ukraine, est. 1999, www.case-ukraine.kiev.ua • CASE –Transcaucasus Center for Social and Economic Research, est. 2000, www.case-transcaucasus.org.ge • Foundation for Social and Economic Research CASE Moldova, est. 2003, www.case.com.md • CASE Belarus - Center for Social and Economic Research Belarus, est. 2007.
  • 4.
    CASE Network ReportsNo. 76/2007 Ch. Dreger, K. Kholodilin, K. Lommatzsch, J. Slacalek, P. Wozniak Table of contents Executive Summary ........................................................................................................................................................ 4 Part I. Introduction and objectives ................................................................................................................................ 10 Part II. Competition and price convergence ................................................................................................................. 11 II.1 The Law of One Price ......................................................................................................................................... 16 II.2 Price setting models in segmented markets ...................................................................................................... 18 II.2 Empirical evidence on the competition effect ................................................................................................... 21 Part III. Catching up and price convergence ................................................................................................................ 28 III.1 The Balassa Samuelson hypothesis ................................................................................................................... 29 III.2 Empirical evidence on the catching up effect ................................................................................................... 32 Part IV. Measuring price convergence by comparative price levels ............................................................................. 35 IV.1 Deflators, consumer and producer price indices .............................................................................................. 36 IV.2 Comparative price levels .................................................................................................................................... 38 IV.3 Drawbacks of comparative price levels ............................................................................................................. 40 Part V. Price trends in the enlarged European Union ...................................................................................................... 43 V.1 Comparative price levels across countries ........................................................................................................ 44 V.2 Changes in comparative price levels over time ................................................................................................. 48 V.3 Changes in HICP subcategories over time ........................................................................................................ 52 Part VI. Empirical analysis of price convergence .............................................................................................................. 54 VI.1 Description of variables ..................................................................................................................................... 56 VI.2 Catching up and competition factors ................................................................................................................ 60 VI.3 Beta and sigma convergence ............................................................................................................................. 61 VI.4 Determinants of price convergence ................................................................................................................... 66 Part VII. Conclusions ........................................................................................................................................................... 70 References ....................................................................................................................................................................... 75 Appendix ......................................................................................................................................................................... 81
  • 5.
    CASE Network ReportsNo. 76/2007 Price convergence in the enlarged internal market The Authors Christian Dreger received his doctoral degree (1995) and his habilitation degree (2005) in economics from the University of Kassel, Germany. He works as an economist at the German Institute for Economic Research (DIW Berlin). He has built macroeconometric models for the euro area and the German Economy. His research interests include the impact of institutions on the labour market performance, business cycle forecasting methods, dynamic factor models, panel econometrics, and spatial econometrics. Konstantin Kholodilin graduated from the St. Petersburg State University (1995, Diploma) and obtained his doc-toral degree at the Universitat Autònoma de Barcelona (2003). He specialises in econometric analysis and forecast-ing. In 2001-2004 he was doing research in the IRES (Université catholique de Louvain, Belgium). Since 2005 he is a research associate at the DIW Berlin. His mother tongue is Russian, in addition, he speaks English, French, German, and Spanish fluently. Kirsten Lommatzsch studied at Freie Universität in Berlin. �From 1999 to 2007 she worked at the DIW Berlin on business cycles and European integration. Currently associated with the Deutsche Bundesbank. Main research interests include real exchange rates, real and nominal convergence, European integration. Jirka Slacalek received his PhD from Johns Hopkins University in 2004. He has worked as an economist at the German Institute for Economic Research (DIW Berlin), and moved to the European Central Bank in September. His research interests include the role of wealth effects in explaining private consumption, the predictive power of consumer sentiment, monetary economics and the relationship between productivity growth trend and the natural rate of unemployment. Przemysław Woźniak received his PhD from Warsaw University (2002). He has been working at the Center for Social and Economic Research (CASE) as research economist since 1996. His area of expertise includes inflation, exchange rates and macroeconomic policies. Recently has worked as macroeconomic expert in numerous coun-tries of ex-Yugoslavia.
  • 6.
    CASE Network ReportsNo. 76/2007 Ch. Dreger, K. Kholodilin, K. Lommatzsch, J. Slacalek, P. Wozniak Abstract In this paper we investigate the effects of EU enlargement on price convergence. The internal market is expected to boost integration and increase efficiency and welfare through a convergence of prices in product markets. Two principal drivers are crucial to explain price developments. On the one hand, higher competition exerts a down-ward pressure on prices because of lower mark ups. On the other hand, the catching up process of low income countries leads to a rise in the price levels and higher inflation over a transition period. Using comparative price levels for individual product categories price convergence can be established. However, the speed of convergence is rather slow, with half lives around 10 years. The enlargement has slightly stimulated the convergence process, and this impact is robust across different groups of countries. Moreover, the driving forces of convergence are explored. In line with theoretical predictions, the rise in competition exerts a downward pressure on prices, while catching up of low income countries leads to a rise in price levels
  • 7.
    CASE Network ReportsNo. 76/2007 Price convergence in the enlarged internal market Executive Summary This is the final report of the project on price convergence in the enlarged Internal Market (ECFIN-E/2005/002) carried out by researchers from DIW Berlin and CASE – Center for Social and Economic Research. The main aim of the study is to investigate the effects of EU enlargement on price convergence. The Internal Market is expected to foster market integration and increase efficiency and welfare through a convergence of prices in product mar-kets. Although a high degree of market integration is already achieved, price dispersion in the EU has considerably increased with the enlargement in 2004. Price levels in the New Member States are substantially lower than in the Old Member States, most likely because of their lower income levels. In addition, inflation rates in the New Member States exceed the average of the EU15. In fact, two principal forces are crucial to explain the process of price convergence. On the one hand, the rise in competition in the Internal Market exerts a downward pressure on prices due to lower mark ups of prices over marginal costs. Domestic factors become less important in particular for tradable products. On the other hand, the catching up process of low income countries leads to a rise in the price levels and higher inflation over a transi-tion period. The overall price level tends to increase and affects the consumption and production pattern of the economies. This tendency is based on market reforms and deregulation, a different composition of value added and a rise in the variety and quality of products. It is the main task of this study to disentangle these two forces on price developments and to assess their relative importance. The main contribution is on the empirical side. Models incorporating both catching up and competition effects are estimated using a huge amount of data for different product categories. In addition, the study assesses the consequences of price convergence in the New Member States on the entire EU25, i.e. whether the price adjustment will occur through upward price trends in the New Member States or downward trends in (some of) the Old Member States. Following the introduction in section I, the impact of competition on price convergence is discussed in section II. The Law of One Price (LOP) is taken as the natural point of departure, as it constitutes the basic mechanism for price convergence in a perfect competitive market. The LOP predicts that in the absence of barriers to trade, arbitrage will force prices of identical products to converge, i.e. the domestic price is equal to the foreign price, both expressed in the same currency. Hence domestic prices are fully determined by foreign conditions, implying that prices in small open economies are completely exogeneous. However, deviations can persist due to transpor-tation costs. Arbitrage will not occur if price differences are not sufficient to cover the related costs. Furthermore, other factors like market segmentation, different preferences of consumers at home and abroad and non tradable components might cause a rejection of the LOP. In fact, the empirical relevance of the LOP is quite limited even in integrated markets such as the EU12 or the US. Therefore, price setting behaviour of firms is traced to domestic factors. It can be explained in terms of mark up of prices over marginal costs of production. This approach includes the LOP as a special case: if markets are fully competitive, prices and marginal costs will coincide, implying that a mark up will vanish. But, if competition is imperfect, prices are not entirely determined by international condi-
  • 8.
    CASE Network ReportsNo. 76/2007 Ch. Dreger, K. Kholodilin, K. Lommatzsch, J. Slacalek, P. Wozniak tions. In monopolistic competitive markets, the mark up is not equal to zero, and can depend on local conditions, such as the price elasticity of demand in the respective markets or the business cycle situation. Nevertheless, con-sistent evidence is available that an increase in openness (market integration) has put a downward pressure on prices via the reduction of mark ups. Because countries in the Internal Market differ with respect to their per capita income, catching up processes need to be taken into account. The implications of catching up on price convergence are discussed in section III. In particular, the Balassa Samuelson effect and the non tradable component of products provide a rationale for the presence of a trend in relative prices not related to the functioning of the Internal Market. Specifically, prices of non tradables should be substantially lower in the New Member States, as long as they are in a catching up phase. The magnitude of the effect appears to be rather small, partly because of empirical shortcomings. Therefore, catch-ing up is important, but it is likely related to a broader concept than the pure Balassa-Samuelson model. Specifi-cally, the quality of products, regulated prices and reputation problems need to be taken into account. In the empirical model the impacts of competition and catching up have to be disentangled. Both effects should be studied simultaneously in order to get unbiased estimates. The methodological aspects of appropriate indica-tors to study the process of price convergence are explored in section IV. �Due to the absence of a sufficient amount of absolute price data, �research has often focused on certain areas or products, where prices are relatively easy available, such as in the food sector. Unfortunately, these prices are less representative for the functioning of the In-ternal Market. On the other hand, studies based on relative price aggregates cannot distinguish whether the effect of lower price dispersion is caused by the convergence of prices of individual goods or services or a change in the weighting system. Furthermore, consumer and producer price indexes are less informative regarding advances in competition, as they reflect cumulated inflation rates rather than absolute prices. T�heir focus on the representativ-ity of products for the individual country makes them less useful for international comparisons. Therefore�, the empirical analysis is carried out on the base of comparative price levels (CPLs). These measures have been constructed by Eurostat and the OECD as part of the European Comparison Programme and are calcu-lated as the ratio between purchasing power parities (PPPs) and nominal exchange rates. The PPPs are based on price levels of a comparable and representative sample of products covering the various aggregates of GDP in the EU25 member states. At the most disaggregated level, PPPs rely on relative price ratios for 279 categories of goods and services labelled as basic headings. The chapter also clarifies the construction principles of PPPs and CPLs, and gives insights into their limitations of these measures. Recent price trends are explored in section V. Due to lower levels in per capita income and productivity the New Member States have lower prices than in the EU12 and EU15 countries. The backlog is most pronounced in services, which are often non tradable. However, price levels of goods are also lower and might indicate lacks in tradability and in the quality and reputation of goods and services produced in the New Member States. �As trad-ability increases with the durability of the goods, price convergence is more prominent for durables. However, while price convergence has been observed for nearly all of the broad expenditure categories, it has decreased for durable goods in the recent period. C�onvergence in the New Member states has occurred most likely through varying inflation rates and currency appreciation rather than through a combination of a price increase in low price and a price fall in the high price countries. The claim for this notion is the positive inflation rate in all EU25 countries throughout the period. The econometric approach is presented in section VI. As the analysis has to distinguish between catching up and competition forces, distinct factors are identified to obtain insights into the impact of these forces on the path of price convergence. A factor analysis is conducted where the factors are extracted by means of principal component analysis. Specifically, a catching up factor is derived from a dataset comprising real GDP, real productivity, and real compensation of employees. These measures are in relative terms, i.e., they refer to the individual country
  • 9.
    CASE Network ReportsNo. 76/2007 Price convergence in the enlarged internal market variables divided by the EU12 benchmark. The first principal component is interpreted as the catching up factor. It represents almost all of the variation of its ingredients. Competition is more difficult to measure. It is partly, albeit not perfectly, manifested in the openness of countries to foreign trade and import penetration, which are both related to market integration, and the degree of business deregulation, the latter proxied by the Fraser index. This index comprises information about price controls, the burden of regulation, time with government bureaucracy, the ease of starting a new business and irregular pay-ments. For the purpose of this study, price controls are the most important variable. Removing of price controls during a catching up period should lead to price increases in the EU10. For the EU15, prices are already liberalized to a higher extent. A further reduction of controls will mainly introduce more competition, which is particularly relevant in network industries, such as telecommunications. Therefore a downward pressure on prices should be observed for the EU15. Openness and import penetration are strongly correlated. Import penetration might be more informative because it reflects the exposure of the domestic market to international competition. The correlation of import penetration (openness) with either price controls or the overall Fraser index is rather weak. As a consequence the estimation of a competition factor would be rather imprecise, since a substantial part of information would be classified as idiosyncratic and dropped from the analysis. Therefore, it is more reasonable to include the original competition variables in the regression of the determinants on price convergence. After determining the variables of interest, the empirical analysis proceeds in two steps. First, β convergence is explored for CPLs relying both on 41 broad categories of products and on 279 basic headings. Overall, a negative relation between the initial price level and subsequent price increases is confirmed. Thus countries with lower initial price levels tend to have higher inflation rates thereafter. Due to higher inflation, convergence of price levels will gradually occur. The convergence is stronger in case for basic headings, probably because they are related to more homogeneous products. In addition, the speed of convergence rises with the tradability of the product considered. Shocks are expected to be removed by 50 percent after 2.1 years in case of durables, compared to 3.7 years for non durables. The impact of shocks is even longer for non tradables, such as services and buildings. Furthermore, the analysis examines price dispersion over time, i.e. σ convergence. A decline in the standard deviation can be detected, where the slope coefficient in a trend regression is significant for the broad categories and the basic headings. Second, insights into the main drivers of price convergence are provided. In particular, CPLs for broad catego-ries and basic headings are regressed on a number of explanatory variables, like the catching up factor, and com-petition measures, such as import penetration and the degree of price controls. The competition variables reflect different facets of market integration. Catching up and competition seems to be important factors to explain the path of price convergence, most nota-bly for the New Member States. The closer per capita incomes are to the EU12 level, the closer their price levels. While catching up has a positive effect, competition enters with a negative sign. Therefore competition exerts a downward pressure on prices, most notably in the New Member States. For the Old Member States competition seems to have increased especially during the 1990s, which are not part of the analysis. Because the New Mem-ber States account only for 5 percent of real GDP in the Internal Market, their impact on competition in the Old Member States could be hardly visible. In fact, competition is insignificant in the EU15 subsample in most cases. Finally, price controls are not significant for the EU25. However, this reflects the opposite impacts of this variable in the EU15 and EU10 regressions: removing of price controls has a negative effect for the Old Member States, but a positive one for the New Member States, due to a different degree of price regulations. Over the catching up period, regulations will be gradually reduced in the EU10, and this will reinforce price convergence. To sum up, there is evidence that price convergence takes place in the Internal Market. Due to the enlargement, the speed of convergence has increased. Both catching up and competition factors are relevant to explain the proc-
  • 10.
    ess of convergence,especially for the New Member States. Nevertheless, it should be noted that the time series dimension of the analysis is too short to arrive at definitive conclusions. This is particularly true in the case of basic headings, and might explain some inconclusive results of the analysis. CASE Network Reports No. 76/2007 Ch. Dreger, K. Kholodilin, K. Lommatzsch, J. Slacalek, P. Wozniak 10
  • 11.
    CASE Network ReportsNo. 76/2007 Price convergence in the enlarged internal market 11 Part I: Introduction and objectives The implementation of the Internal Market Programme and the introduction of a common currency in a number of key EU Member States have led to an unprecedented degree of economic integration. The introduction of the euro has improved price transparency and has removed costs of currency conversion and exchange rate risk premia for a number of countries. Because of the increase in trade, the level of competition in the European Mon-etary Union (EMU) and between EMU member states and third countries has risen. Advances in the integration of labour, product and financial markets have reduced the costs for economic agents, private households and firms to undertake price arbitrage. It may also give rise to industrial restructuring, mergers and acquisitions and a change in the market strategy of enterprises. The EU enlargement with the accession of eight Eastern European economies, Cyprus and Malta has marked another cornerstone in the completion of the Internal Market. The New Member States are small open economies, i.e. they have a small market size, implying that they have only little impact on EU25 quantities. For example, these economies account for 15 percent of total population, but only for 5 percent of real GDP in the Internal Market. Moreover, the New Member States are in the process of catching up growth, i.e. they have lower per capita income and lower price levels than the average of the Old Member States. During the process of transition and accession, trade has expanded rapidly. In addition, the New Member States have received large foreign direct investments in manufacturing industries, financial, distribution and communication sectors. In a number of cases, firms in the New Member States have been included in international production chains. Multinational firms have utilized the comparative cost advantages of these countries through shifting labour intensive work into this region. The rapidity of the transition process can be seen, among others, by the development of inflation. At the begin-ning of the transition all countries faced high inflation rates. Liberalization by the removal of controls and quantity allocations, which repressed demand formerly, led to rapid adjustments to free market prices. In addition, fiscal and financial crises resulted in periods of rapid monetary expansion since governments relied on seignorage to support public budgets as well as state owned enterprises. Especially the Baltic countries experienced annual infla-tion in excess of 1000 per cent. But, as stabilization took place in most accession countries, inflation was reduced very quickly to moderate rates. Central banks in most of the New Member States have been rather successful in stabilizing inflation after initial shocks. This in turn led to a substantial build up of reputation. The majority of ac-cession countries experienced annual inflation rates around 30 percent in 1995, while the rates were even below 10 percent in some countries. Further disinflation occured after the onset of the Russian crisis in 1998. This has been caused by a combination of negative demand shocks, i.e. lower foreign demand by Russia and the EU, and positive supply shocks due to a decrease in oil prices and market integration in the eve of the EU accession. The evolution
  • 12.
    was overlapped bypositive demand shocks due to higher economic growth in major trading partners and negative supply shocks due to rising oil prices at the end of the 1990s. Currently all New Member States realize single-digit inflation rates. In some countries, inflation exceeds only slightly the euro area average. Market integration is an ongoing process, which has not been completed yet. The need for further integration, covering also the markets for services, is stated in the Lisbon agenda (EU Commission 2000) and has been also emphasised in the Kok report (EU Commission 2004b). An important indicator measuring market integration is price convergence. In general, an increase in integration leads to a rise in competition, which puts pressures on the mark ups of prices over marginal costs and may lead to the convergence of prices towards the price of the most efficient supplier. The theoretical foundation of this proposition is the Law of One Price (LOP), which is supposed to hold in perfectly competitive markets. The LOP postulates that in the absence of natural or regulatory barriers, arbitrage forces prices of identical goods to converge. Apart from transitional frictions, which may impede price convergence in the short and medium run, commodities are expected to sell for the same price in each geographi-cal CASE Network Reports No. 76/2007 Ch. Dreger, K. Kholodilin, K. Lommatzsch, J. Slacalek, P. Wozniak 12 region of the Internal Market (Obstfeld and Rogoff, 1996). From the perspective of consumers, an identical amount of money should buy the same bundle of goods and services in each location. Despite advances in the integration of markets, however, there is strong evidence that the pace of price conver-gence has slowed down in recent years, see several reports conducted by the EU Commission (2004a, 2005) and Eurostat (2003). Hence, other forces might be important to explain the development. Nevertheless, price level dispersion is higher for non tradables than for tradables, where the latter are clearly more affected by the process of integration. The dispersion of overall price levels has decreased after the inception of the Internal Market in the EU12, but stayed rather unchanged after the introduction of the EMU. Nevertheless, the dispersion of prices for tradables has been on a stable declining trend over the entire period.� In this study, the EU12 benchmark is pre-ferred over EU15 as it allows eliminating the effect of exchange rate fluctutations in the euro area countries. But, even with EU12 as a benchmark these fluctuations are inherent in the remaining EU member states. For the EU25 countries, a steep decline in price dispersion is observed until 2000, implying that the price levels in the New Member States have rapidly converged to those in the EU12 in the course of their preparation for acces-sion. Because inflation rates have been higher on average in the former transition economies, price convergence has likely proceeded through rising prices in the New Member States towards the higher EU12 level. Due to the lower per capita incomes in the New Member States, the dispersion in the EU25 is much higher than in the EU12, which in turn exceeds that of the EU6 comprising the founding members of the EU. In sum, the evidence indicates that price convergence in the Internal Market takes place at least to some extent and that the duration of partici-pation of countries in the Internal market may have an impact on the results. However, dispersion of consumer prices turns out to be significantly lower in the US and therefore, a further potential of prices to converge seems to exist, given that obstacles for arbitrage can be removed (Rogers, 2001, Faber and Stokman, 2005). For the founding members of the euro area, price dispersion is relatively low and closely to the US figures. Price level convergence is often explored by means of aggregate price measures. However, preferences of agents at home and abroad need to be identical to obtain any robust insights from such an analysis. This condition is re-jected in the sample considered here. Different weights of individual products can introduce a serious bias in the analysis. Weighting schemes are affected by the income level, which is substantially different between the New and Old Member States. Hence, persistent deviations in aggregate price levels may not necessarily imply that conver-gence has failed so far. Furthermore, the effects from higher competition could be overlapped by the catching up in per capita income of the New Member States. There are several reasons why competition might be still imperfect in the Internal Market. The Balassa-Samuel-son effect is the most popular explanation for the presence of a trend in the development of relative prices and real exchange rates. Prices of non tradable goods like services are predicted to be lower for the New Member States,
  • 13.
    Price convergence inthe enlarged internal market as they are in the catching up process. Several papers have also emphasized the role of regulated prices, taxes and reputation problems of firms in the former communist economies. Different qualities and varieties of goods and services might also contribute to higher price dispersion. The main objective of the present study is to gather information about differences in individual prices and price levels based on suitable data sources. This will allow an analysis of the sources of price dispersion, the past pace of and the future scope for price convergence in the enlarged EU with a particular emphasis on the functioning of the Internal Market and the role of the New Member States therein. The report is organized in different chapters. The next part (section II) provides a survey of the literature cover-ing theoretical and empirical aspects of the competition effect in an integrated market, while section III focuses on the catching up aspect. In the empirical model price reactions stemming from catching up and competition need to be disentangled. Both effects should be studied simultaneously in order to get unbiased estimates. Due to the absence of a sufficient amount of absolute price data, the analysis refers to comparative price levels and basic headings (section IV). They have been constructed by Eurostat and OECD as part of the European Comparison Programme. Stylised facts on recent price trends in the enlarged EU are presented in section V of the report. Sec-tion VI holds the empirical analysis. The econometric approach is built upon principal component analysis that is particularly suited to extract catching up and competition factors in the evolution of comparative price levels. The results are the basis for predictions of the future development of price convergence. Section VII summarizes the main conclusions. CASE Network Reports No. 76/2007 13
  • 14.
    In perfectly competitivemarkets, prices in the domestic country are fully determined by international conditions. Therefore, price setting does not involve any local factors, such as cost or market structures. From the perspective of consumers an equal amount of money could buy the same bundle of goods and services at home and abroad. Individual prices have necessarily converged in equilibrium, implying that the Law of One Price (LOP) should hold. However, several imperfections have to be taken into account, implying that the LOP is unlikely to hold over reasonable time spans. Prices differ as the preconditions for perfect competition are not met. For example, product differentiation of firms and the presence of transaction costs might lead to a lack of competition. In addi-tion, The currency conversion is done by the nominal exchange rate S which is defined as the number of units of domestic currency for a unit of foreign currency. Deviations from the LOP would signal unexploited profit oppor-tunities. In the absence of transportation and other transaction costs perfect competition will equalize the price CASE Network Reports No. 76/2007 Ch. Dreger, K. Kholodilin, K. Lommatzsch, J. Slacalek, P. Wozniak Part II: Competition and price convergence 14 some goods and services are not tradable. As arbitrage does not occur for these products, their prices are not determined by foreign conditions, but by local factors such as preferences and cost structures. In addition, price levels of poorer countries are expected to be lower than those of countries with higher income. While the implica-tions of a catching up process to the richer countries are discussed in the next section, this chapter focuses on the competition aspect. II.1 The Law of One Price The starting point for assessing price convergence in an integrated market is the Law of One Price (LOP). It states that a product must sell for the same price in all locations of the integrated market. Note that the LOP is different from the purchasing power parity (PPP) condition. The latter states that the LOP should hold on the average, i.e. equal baskets of goods and services should cost the same. For example, PPP can be fulfilled, even if the LOP does not hold in any individual product market. According to the LOP, the domestic price P is equal to the foreign price P*, after both price levels have been expressed in the same currency: (1) P SP∗ = MC , 1 1/ | | y p P ε = − , C / L ∂ ∂ ( / )(1 1/ | |) y p P Y L ε = ∂ ∂ − P = (1+η)MC , η = f (ε, gap, ptm)
  • 15.
    instantaneously by arbitragein the product markets. For example, if the domestic exceed foreign prices, it would be profitable to buy products abroad and sell them at home. In consequence there is a flow of products from cheaper to more expensive countries. The additional supply puts a downward pressure on the domestic price until the equilibrium is restored. Then there is no longer motivation for arbitrage transactions. Under these circumstances, prices are fully determined by international forces. This implies that domestic factors do not play any role in the price setting behaviour of firms, unless the region considered is large compared to the size of the entire market. The LOP is based on a number of idealizing assumptions. In particular, all firms are faced by the same horizontal demand curve and choose optimal quantities supplied. In equilibrium, marginal costs are equal to marginal rev-enues, i.e. product prices. Each firm might have a different cost function but this does not affect the price, just the quantity produced. The price of an individual product is exogenous for all firms and consumers, and determined by demand and supply decisions in the integrated market. This means that there are a large number of producers and consumers, none of them has the power to influence the price, agents are not able to collude, and firms can freely enter and exit the market without significant costs. In the real world, several caveats need to be taken into account. Impediments to perfect competition might in-clude cross country differences in the phase of the business cycle (demand pressure), market segmentation, regu-lations on product and labour markets, different consumer preferences at home and abroad, and transportation. Moreover, not all products and factors can be classified as tradable in international markets. Competitive pressures are less important in these cases. In the presence of transportation costs, barriers to trade, and other transaction costs, arbitrage might not oc-cur. Profits resulting from arbitrage are not large enough to cover the costs. These costs generates a neutral band around the equilibrium price where local prices can fluctuate independently from any competition pressures (Obst-feld and Taylor, 1997). Prices adjust only outside the band. Although barriers such as tariffs and similar regulations are not relevant for the Internal Market, non tariff barriers could be still important. Special inspection require-ments on food imports and different national standards such as warranties can foster market differentiation and monopolistic competition, where firms have some pricing power (Rogoff 1996). International trade is not limited to final products, but also to the inputs needed for production (Engel and Rog-ers, 1996, Crucini, Telmer and Zachariadis, 2005). Deviations from the LOP can occur due to cross country differ-ences in non traded and traded factor input costs, and to the differences in the production shares of these inputs. While the costs of tradable inputs are determined in an integrated market, the costs of the non tradable inputs are specific for the country considered. The final price can be decomposed into different stages of the production process. At each stage potential elements can affect price dispersion. For example, Corsetti and Dedola (2005) have emphasized the role of the distribution sector. Due to non tradable retail services, the intensity of competition need not be always reflected in prices. Different local costs can account for price differentials that do not open any profit opportunities arising from arbitrage, see also Wolf (2003). A bias towards goods and services produced in a country may also cause a segmentation of markets. It can oc-cur due to differences in quality or because of reputation problems, see Obstfeld and Rogoff (1996) and Benigno and Thoenissen (2003). Furthermore, a preference in favour of local products might exist because of traditions, climate, culture or different languages. As arbitrage does not take place, prices are also not forced to converge in these cases. Instead, they are determined by local factors. A border effect has been suggested by Engel (1993). It might be traced, to sticky prices, a home goods bias, and also the fact that prices of non tradable inputs are more similar within a country than across states. For instance, labour mobility is more pronounced within an economy than internationally. CASE Network Reports No. 76/2007 Price convergence in the enlarged internal market 15
  • 16.
    II.2 Price settingmodels in segmented markets Often firms are able to segment markets and reduce competition with strategies of product differentiation, local variants, product bundling, and special additional services. Differentiation implies that products are not homog-enous where MC is marginal costs and εy,p is the elasticity of demand with respect to prices, i.e. the negative slope of the demand curve at some price level. Note that this approach includes the LOP as a special case: if markets are fully competitive, the elasticity would tend to infinity in absolute value, and prices and marginal costs coincide. The lower the elasticity in absolute value is, however, the smaller is the reaction of demand to price changes, and the higher the mark up firms can exploit. Provided that labour input L is the variable input factor to production at least over short time intervals, the price setting formula can be rewritten as is specified, with gap as the output gap, i.e. a measure of excess demand over the business cycle, and a pricing to market variable, measured as the degree of the exchange rate pass through (Romer, 2001, Smets and Wouters, 2002). Country price levels will depend on these arguments. The lower the demand elasticity is in its absolute value, the lower the pressure from competition and the higher the mark up. An increase in the output gap could also raise the mark up, as firms might adjust prices easier in periods of economic upturns. But, the interpretation is controversial on this point. Recent work has stressed that the mark up may be nonstationary (Banerjee and Russell, 2004, 2005). Thus only its short run part is related to the business cycle, as it exhibits stationary fluctuations. While the mark up seems to be negatively related to inflation in the long run, it behaves countercyclical in the short run. In an environment of uncertainty and asymmetric loss functions, imperfect competitive firms might set their mark ups below profit maximizing values, in particular in higher inflation periods. The costs in terms of lost profits exceed those arising from the lower level of the mark up. Mark up pricing behaviour is also the basis of approaches to explain the stickiness of prices. A key feature of these models initially advocated by Taylor (1982) and Calvo (1983) is that forward looking firms fully understand the necessity to reoptimize prices in a periodic way. Therefore, they are able to front load future expected mar-ginal costs into their current price. Firms behave in this manner as they might not be able to raise prices when the higher marginal costs materialize. Similarly, to avoid a relative decline in their own prices, firms transmit expected CASE Network Reports No. 76/2007 Ch. Dreger, K. Kholodilin, K. Lommatzsch, J. Slacalek, P. Wozniak 16 in different locations of the market. In monopolistic competitive markets, firms have some power to charge a premium over marginal production costs, thereby raising their profits. Thus, prices include a mark up over marginal costs, i.e. (2) P SP∗ = MC , 1 1/ | | y p P ε = − , C / L ∂ ∂ ( / )(1 1/ | |) y p P Y L ε = ∂ ∂ − MC P = (1+η)MC , η = f (ε, gap, ptm) 1 T N P Pα P −α = * T T P = SP C L ∂ ∂ C L ∂ ∂ * * MC W Y W Y P L P L ∂ ∂ = = ∂ ∂ * * T T , T T T T T T = ⎜ ⎟ ⎜ ⎟ = ⎜ ⎜ ⎟ ⎜ ⎟ ⎟ , 1 W Y / L S W Y L ∂ ∂ = ∂ ∂ T T T * * * / T T T W Y W Y P L P L ∂ ∂ = = ∂ ∂ , * * T N T N W =W =W W =W =W * * W Y W Y P L P L ∂ ∂ = = ∂ ∂ 1 W Y / L S W Y L ∂ ∂ = ∂ ∂ W Y W Y P L P L ∂ ∂ = = ∂ ∂ N T N T , T N N * * N N N N 1 1 * * * * / * * / * α −α −α ⎛ ⎞ ⎛ ⎞ ⎛ ⎛ ∂ ∂ ⎞ ⎛ ∂ ∂ ⎞ ⎞ P P P Y L Y L S S P P P Y L Y L 1 W Y / L S W Y L ∂ ∂ = ∂ ∂ T N T T N N = T ⎜ T ⎟ ⎜ T ⎟ = ⎜ ⎜ ⎟ ⎝ ⎠ ⎝ ⎠ ⎝ ⎝ ∂ / ∂ ⎟ ⎜ ∂ / ∂ ⎟ T N T T ⎠ ⎝ N N ⎠ ⎠ W Y W Y P L P L ∂ ∂ = = ∂ ∂ t t t X = ΛF + u i ,t i i ,t j i ,t CPL α βCPL u − Δ = − + α −α −α ⎛ ⎞ ⎛ ⎞ ⎛ ⎛ ∂ ∂ ⎞ ⎛ ∂ ∂ ⎞ ⎞ W Y W Y P L P L ∂ ∂ = = ∂ ∂ P P P Y L Y L S S P P P Y L Y L T N T T N N = ⎜ ⎟ ⎜ ⎟ = ⎜ ⎜ ⎟ ⎜ ⎟ ⎟ ⎝ ⎠ ⎝ ⎠ ⎝ ⎝ ∂ ∂ ⎠ ⎝ ∂ ∂ ⎠ ⎠ , , 1 , (1 ) i t i i t i t CPL α β CPL u − = + − + α −α −α ⎛ ⎞ ⎛ ⎞ ⎛ ⎛ ∂ ∂ ⎞ ⎛ ∂ ∂ ⎞ ⎞ P P P Y L Y L S S λ = −ln(1− β ) , t* = −ln0.5 λ (3) P SP∗ = , 1 1/ | | y p P ε = − , / ( / )(1 1/ | |) y p P Y L ε = ∂ ∂ − P = (1+η)MC , η = f (ε, gap, ptm) 1 T N P Pα P −α = * T T P = SP * * * * T T , T T T T T T * * * / T T T , * * T N T N W =W =W W =W =W * * * * N N , N N N N N N 1 1 * * * * / * * / * / / T N T T N N t t t X = ΛF + u where ∂C/∂L and ∂Y/∂L denote the partial derivatives of costs C and output Y with respect to labour input (Var-ian, 2006). Apart from a particular market structure, i.e. competitive or monopolistic markets, the optimal price depends positively on nominal wages, and negatively on real productivity, as these two components constitute the marginal costs. Often, a more general model (4) P SP∗ = , 1 1/ | | y p P ε = − , / ( / )(1 1/ | |) y p P Y L ε = ∂ ∂ − P = (1+η)MC , η = f (ε, gap, ptm) 1 T N P Pα P −α = * T T P = SP * * * * T T , T T T T T T * * * / T T T , * * T N T N W =W =W W =W =W * * * * N N , N N N N N N 1 1 * * * * / * * / * T N T T N N
  • 17.
    Price convergence inthe enlarged internal market overall inflation into the prices they control. The number of firms that change prices in a given period is specified exogenously, but can be also determined endogenously. Eichenbaum and Fisher (2004) have provided a recent review of these approaches. Standard model versions are strongly rejected by the data, as point estimates on the frequency of price adjustments are too high and inconsistent with the existing microeconomic evidence (Bills and Klenow, 2002). Nevertheless, extended settings that allow for delays in the implementation of the new prices seem to be more in line with the experience. The key message from the mark up model is that prices in imperfect markets depend on country individual fac-tors, such as demand and cost conditions, the state of the business cycle and pricing to market effects. To examine price convergence, price differentials across economies have to be explored. Therefore, appropriate models are built upon the respective variables of the home and foreign country. In addition to the impact of country specific determinants, trade openness plays a vital role. Recent studies have stressed the increasing role of global drivers to explain price and inflation dynamics, in particular in industrialized countries, see Pain, Koske and Sollie (2006), Borio and Filardo (2006) and Mumtaz and Surico (2006). Almost 70 percent of the inflation variance in the OECD countries can be explained by their first common component, see Ciccarelli and Mojon (2006). Competitive pressures and openness to foreign trade are closely related. Trade open-ness has raised both in industrial and emerging market economies over the past 35 years. The increase has been even stronger in the emerging economies, including the New Member States. While openness, measured as a ratio of the sum of exports and imports to GDP has risen from 70 to 90 percent of GDP in the Old Member States, many of the New Member States exhibit shares from 90 to 180 percent. Eventually these economies have become more competitive due to market reforms and deregulation. Internalization of markets should lead to higher competition between firms, improve the allocation of capital, and increase efficiency. For example, domestic firms in the New Member States had to face competition from the Old Member States. They had to lower their prices and cut mark ups to stay in the market. II.3 Empirical evidence on the competition effect The LOP provides the basic mechanism on why prices should converge in the Internal Market. The pressure of competition will lead to a convergence of prices towards the price of the most efficient supplier. As stated above, several imperfections have to be acknowledged in the real world, especially in the short and medium run. Not surprisinggly, the evidence in favour of the LOP is very limited, and if support could be established, it is mostly related to the long run. In this section, results on the LOP are reviewed. The presentation is focused on the LOP and does not cover the PPP condition, which restates the LOP in terms of a basket of products. In the PPP analy-sis, additional problems occur due to different weighting schemes of goods and services within the domestic and foreign basket. Furthermore, the discussion is focused on papers that refer to price convergence in large markets sharing the same currency such as the US and the euro area. In these markets, the effect of exchange rate fluctuations cannot bias the evidence. However, for the euro area this is only the case since the launch of the EMU in 1999. In addition, the empirical performance of the LOP for identical goods in less integrated markets is considered. Overall, the evidence suggests that convergence tends to be faster in integrated markets and for tradable goods. National borders and geographical distances between countries exert an adverse effect on integration. Nevertheless, a competition effect appears to be significant and robust, but its impact on the path of price convergence does not seem to be very strong. The Law of One Price for identical goods in less integrated markets Haskel and Wolf (2001) have examined the LOP in 25 industrial countries using prices of 100 products sold in IKEA stores. The results indicate that price disparities exist and are substantial across countries. Deviations in a CASE Network Reports No. 76/2007 17
  • 18.
    range between 20and 50 percent can be detected. This might be due to strategic pricing, local distribution costs, taxes and non traded components. The evidence points to strategic pricing, which would lead to different mark ups: although relative prices between individual products vary significantly, no clear cut pattern emerged in their ordering. Pricing is affected by the behaviour of local competitors, but the relationship could be nonlinear, i.e. convergence is faster if price differences are more pronounced. Parsley and Wei (2003) looked at the importance of tradable and non tradable ingredients in a Big Mac using data from 34 countries. The non tradable component is estimated to exceed 50 percent and can be as large as 60 percent. The convergence of prices in the tradable components turns out to be relatively fast. Therefore, the slow convergence of the price for the entire product is likely due to slow adjustment in the non tradable part. The Law of One Price in the US Parsley and Wei (1996) have analysed price convergence based on raw prices of 51 products in 48 cities in the US during the 1975-92 period. The products are divided into tradables (26), perishables (15) and non tradables (10), most of them services. While perishables show the highest dispersion across cities, services exhibit the largest price differential on average. Price convergence is investigated by unit root tests to the price differentials for each product. It should be noted, however, that a unit root analysis is not completly suited to study the convergence phenomenon. Even if price differentials are stationary, price dispersion might increase. Given this remark, the null hypothesis of a random walk is rejected for tradables and for most perishables and services. Hence, price differentials do not contain stochastic trends, and prices should move together in the long run. Convergence appears to be slower for services than for perishables and tradables. But the result is hardly ro-bust, CASE Network Reports No. 76/2007 Ch. Dreger, K. Kholodilin, K. Lommatzsch, J. Slacalek, P. Wozniak 18 as the inclusion of city dummies weakens the path of convergence. The analysis reveals that price differentials are higher the larger the distances. Therefore, distance exerts an adverse effect on the integration of markets (Engle and Rogers, 2001). By exploiting the same dataset, O’Connell and Wei (1997) studied adjustment towards parity by linear and nonlinear models. The existence of transaction costs could introduce nonlinearities in the convergence process, i.e. a neutral band around the LOP, where arbitrage does not occur. The evidence is broadly in line with this prediction. In the linear model, the random walk is rejected only for 7 out of 23 tradables. This would cast seri-ous doubts on the validity of the LOP even as a long run condition. However, if nonlinear adjustment are allowed for, the evidence against nonstationarity is quite strong. Similar results are found for perishables and services. In these cases, adjustment takes more time and is detectable only in some cases. Cecchetti, Mark and Sonora (2000) have tested CPI convergence for 19 cities over a longer period (1918-1995) using panel unit root tests. Relative CPIs are stationary, and this result seems to be robust across sub periods. Anyway, the test statistics might be biased in favour of this conclusion, as they neglect the issue of cross section correlation. Furthermore, deviations are long lasting with estimated half lives as large as 9 years. The half life indi-cates how long it takes for the impact of a shock to diminish by 50 percent. The distance between locations cannot fully rationalize the long lasting adjustment periods: convergence across cities that are closer to each other is a bit faster, but this result is not very strong in the data. A faster convergence in the tradables sector is only confirmed by some of the tests. Engel and Rogers (2001) looked at the dispersion of inflation between US cities using information from 43 product categories. A volatility ratio is defined, i.e. the numerator refers to deviations in inflation of the same good at different locations, i.e. the deviations from the LOP, while the denominator measures the deviations between inflation rates in different product in one place. The lower the volatility ratio, the more integrated the market. The findings indicate higher volatility ratios in tradables, again questioning the presence of price convergence.
  • 19.
    Price convergence inthe enlarged internal market The Law of One Price in the EU Member States Based on a sample of EU cities and individual items data, Rogers (2002) have tested how price dispersion evolved between 1990 and 2001, in particular when compared to the US. Price dispersion has declined in the first half of the 1990s, mainly for tradables. But no further convergence could be determined after the introduction of the euro in 1999. The results of Wolszczak-Derlacz (2006) demonstrate that convergence can even occur due to aggregation, since the magnitude of price dispersion is larger on the micro than on the macro level. Lutz (2002) has studied a wide array of individual prices to see whether the introduction of the euro has led to higher convergence. Price dispersion is compared between euro and non euro area countries before and after the introduction of the common currency. Only for the minority of products, a euro effect can be detected. Allington, Kattuman and Waldmann (2004) and Engel and Rogers (2004) did not find an additional downward shift in price level dispersion in response to the euro introduction. While dispersion declined between 1995 and 1997, it re-mained unchanged thereafter. Goldberg and Verboven (2004, 2005) have investigated the EU car market over the last three decades. Here, transport costs are relatively low compared to the price of the product. The LOP holds quite well in terms of price changes, but there is a lack of price level convergence. Price dispersion has only slightly decreased after the euro was introduced. The euro did not speed up convergence after 2002. In principle, the introduction of the euro has reduced currency costs and exchange risk, while price transparency has been improved. This should lead to higher price convergence. However, the empirical evidence on this claim seems to be quite inconclusive. Nevertheless, it should be noted that most research has focused on the impact of the common currency on the path of consumer price convergence and therefore relied on a cost of living concept. In contrast, Andrén and Oxelheim (2006) have looked at the development of producer prices in the transition from a national exchange rate regime to the currency union. Convergence of producer prices is equally significant before and after the introduction of the euro. To the extent that developments in producer prices are passed through to consumer prices, a further potential for convergence seems to exist in the euro area over the years to come. Mathä (2005) has explored price differentials between Luxembourg and its neighbouring economies. Many com-muters cross borders every day and are able to compare prices. The study is based on store prices in Luxembourg and near distant towns in Germany (Trier), France (Metz) and Belgium (Arlon). Six stores of a similar size are included, and prices of branded goods available in all countries are compared. Transaction costs are proxied by the distance between stores, and national borders. Also a dummy is included to control for habit persistence be-cause of the former currency union between Belgium and Luxembourg. On average, differences between a pair of prices amount to 13 percent, with a standard deviation of 12 percentage points. Distance and border variables are important to explain the dispersion. In addition, the currency union exerts a significant impact. For example, price differentials between Luxembourg and Belgium are lower by 2.2 percentage points. Due to lower costs of arbitrage, among others, exchange rate stability seems to promote price convergence. This claim can be restated for the former currency union between Luxembourg and Belgium (Mathä, 2005), but also for the founding members of the euro area. In fact, price dispersion is relatively low and closely to the US figures (Rogers, 2002). However, these effects might occur as long term benefits, and can hardly be detected in short time intervals. The impact of the liberalisation of the network industries and internet trade on price convergence has been ex-amined by the EU Commission (2001). Although liberalisation of markets led to a decline in prices especially in tel-ecommunications, price dispersion between EU members has not decreased. For example, prices are substantially lower in gas producing countries. Crucini, Telmer and Zachariadis (2005) have employed cross sectional variances to determine whether the vari-ability in price differentials is related to tradable or non tradable inputs. While deviations from the LOP are quite large the mean of the distribution is often close to 0. Price dispersion did not show a trend pattern over time. CASE Network Reports No. 76/2007 19
  • 20.
    However, non tradedgoods have higher price dispersion compared to tradables. A similar conclusion holds for products with a substantial share of non traded inputs. A few studies have modelled the impact of the euro on real exchange rate developments in the euro area. For example, Koedijk, Tims and van Dijk (2004) reported some evidence in favour of stationarity of real exchange rates for euro area countries. This result is obtained if cross country heterogeneities like different rates of mean rever-sion CASE Network Reports No. 76/2007 Ch. Dreger, K. Kholodilin, K. Lommatzsch, J. Slacalek, P. Wozniak 20 within the euro area are acknowledged. The evidence for stationary real exchange rates is quite stronger than outside the euro area. Thus, the process of European integration seems to accelerate convergence. Openness to trade and competition The substantial increase in openness has likely put a downward pressure on prices. Domestic factors become less important in particular for tradables. Insights can be revealed from sectoral studies which relate the increase in sectoral prices to the extent that these industries are subject to international competition. Chen, Imbs and Scott (2006) have reported estimates for the competition effect for manufacturing sectors in some EU countries, i.e. the size by which prices and mark ups fall and productivity is enhanced due to intensified competition. Explanatory variables are domestic and foreign openness (import penetration), the number of firms in domestic and foreign markets and aggregate prices. Competition exerts a positive, albeit small, but significant effect in the short run. In the long run, however, the analysis suggests that the effect diminishes and can even reverse. As domestic firms face tougher competition they might relocate production abroad into more the protected and less competitive regions. Additional evidence has been reported by the IMF (2006) for industrialized countries. In sectors that are exposed to intensified competition, such as manufacturing and business services, producer prices has increased less than headline inflation especially after 1995. A possible explanation of this finding could be the extent of deregulation in important business services such as telecommunications. In addition, the IMF (2006) has found that prices in high tech sectors declined less than in low tech sectors. This might reflect a tendency to outsource larger parts of the production of low tech products in low wage countries. Moreover, prices have grown more slowly in sectors which are exposed to international competition, such as textiles, telecommunications and electrical equipment. A 1 percent increase in the import share (imports divided by output of the respective sector) reduces relative producer price inflation by less than 0.2 percent on the average of the products considered. Similar effects are found for an increase in labour productivity. The impact of com-petitiveness on price dynamics seems to have accelerated as integration has intensified due to the globalization of markets. Although significant and robust to alternative specifications, the impact of the competition variable does not seem to be very strong, and other variables are important as well. For example, the effect of a rise in the import share on producer price inflation is slightly lower than the effect of a change in import prices in absolute value.
  • 21.
    Price convergence inthe enlarged internal market Part III: Catching up and price convergence As the empirical support in favour of the LOP is rather limited, prices are not entirely determined by competi-tive pressures in the Internal Market, and domestic factors need to be taken into account. For developments in the New Member States additional forces come into play. While initial price levels were lower, these countries have experienced an upward trend in price aggregates and a real appreciation of their currencies thereafter. This evo-lution is not related to the functioning of the Internal Market. According to the Balassa Samuelson hypothesis, it might reflect the catching up process of productivity and per capita income that imply differences in the patterns of consumption and production. If convergence towards the EU15 level of per capita income proceeds, prices will rise, implying that price differentials will gradually diminish. Hence, price convergence is related both to market integration and convergence in per capita income. The two effects overlap each other and have to be disentangled on empirical grounds. A lower price level is due to the fact, that the differential between productivity in the tradables and non trada-bles sector is lower for the poorer countries, as long as they catch up to the richer ones. This point is especially relevant for the New Member States but also for southern regions within the euro area. To the extent that inflation differentials are caused by catching up behaviour, they will not affect competitiveness and disappear when real convergence is achieved. Thus a part of the divergent inflation experience in the euro area might be transitory, as the countries move towards a common price level (Rogers, Hufbauer and Wada, 2001). If the euro area widens to include low price countries in Eastern and Central Europe, inflation in the New Member States can substantially increase if price convergence is fastened. III.1 The Balassa-Samuelson hypothesis According to the Balassa-Samuelson model (Balassa 1964, Samuelson 1964) the existence of non tradables can imply differences in aggregate price levels and the presence of trends in the evolution of relative prices, i.e. real exchange rates. The model is also able to demonstrate why price levels of poorer countries are lower than those of countries with higher income. Specifically, the economy is divided into a sector producing internationally traded goods and a sector with non traded goods. The overall price index is a (geometrically) weighted average of the prices for tradable (T) and non tradable (N) goods, i.e. CASE Network Reports No. 76/2007 21
  • 22.
    1 1/ || y p MC MC C L ∂ ∂ C L ∂ ∂ C L ∂ ∂ where 0<α <1 denotes the share of tradables in the price index. A similar decomposition holds for the foreign MC country, where α is assumed to be equal for simplicity. A different weight for the foreign country does not affect the major conclusions. Due to goods arbitrage the price of tradables is determined by the price of foreign tradables, both denoted in the same currency. The LOP is assumed to hold, but only in the tradables sector: C L ∂ ∂ MC As competition is perfect, the real wage in the tradables sector is equal to the marginal product of labour C L ∂ ∂ MC W Y W Y P L P L ∂ ∂ = ∂ ∂ C ∂ L = ∂ where W denotes the nominal wage and an asterisk refers to the foreign country. Because of equation (6) the relationship W Y W Y P L P L ∂ ∂ = = ∂ ∂ is implied. If the nominal exchange rate is constant, relative wages in the tradables sector are expected to move in line with relative productivity in this sector. Countries with higher productivity in the tradables sector are able to pay higher W ∂ Y W ∂ Y = wages, while countries = with lower productivity have a lower wage level. As labour mobility is perfect across the P sectors ∂ L within a P country, ∂ L nominal wages in the tradables and non tradables sector are expected to equal-ize: 1 W Y / L S W Y L Y W Y ∂ ∂ = ∂ ∂ = T ∂ T T ∂ = ∂ ∂ Again, this assumption can be easily weakened without affecting the main findings. As the nominal wage is set in line with the productivity in the tradables sector, this condition implies that services in the less productive country are cheaper. Given that competition for non tradables is perfect, but only within each country, wages are equal to their marginal products: 1 W Y / L S W Y L ∂ ∂ = ∂ ∂ T T T The perfect competition assumption for non tradables within a country simplifies the presentation and does not affect the principal argument. The Balassa-Samuelson point can be also made by the mark-up model. Putting things together, an expression for the equilibrium real exchange rate can be derived. Using (5), (7), (8), (9) and (10) in (1), the condition CASE Network Reports No. 76/2007 C L ∂ ∂ Ch. Dreger, K. Kholodilin, K. Lommatzsch, J. Slacalek, P. Wozniak (5) 2 , / ( / )(1 1/ | |) y p P Y L ε = ∂ ∂ − P = (1+η)MC , η = f (ε, gap, ptm) 1 T N P Pα P −α = * T T P = SP * * , W Y W Y P L P L ∂ ∂ = = ∂ ∂ * * T T , T T T T T T 1 W Y / L S W Y L ∂ ∂ = ∂ ∂ T T T * * * / W Y W Y P L P L T ∂ T T ∂ = = ∂ ∂ W Y W Y P L P L ∂ ∂ = = ∂ ∂ , * * T N T N W =W =W W =W =W * * 1 W Y / L S W Y L ∂ ∂ = ∂ ∂ T T T 1 W Y / L S W Y L ∂ ∂ = ∂ ∂ W Y W Y P L P L T ∂ T T ∂ = = ∂ ∂ * * N N , N N N N N N 1 W Y / L S W Y L ∂ ∂ = ∂ ∂ T T T 1 1 * * * * / * * / * α −α −α ⎛ ⎞ ⎛ ⎞ ⎛ ⎛ ∂ ∂ ⎞ ⎛ ∂ ∂ ⎞ ⎞ P P P Y L Y L S S P P P Y L Y L T N T T N N = ⎜ ⎟ ⎜ ⎟ = ⎜ ⎜ ⎟ ⎜ ⎟ ⎟ ⎝ ⎠ ⎝ ⎠ ⎝ ⎝ ∂ / ∂ ⎠ ⎝ ∂ / ∂ ⎠ ⎠ W Y W Y P L P L ∂ ∂ = = ∂ ∂ T N T T N N 1 W Y / L S W Y L ∂ ∂ = ∂ ∂ T T T W Y W Y P L P L ∂ ∂ = = ∂ ∂ t t t X = ΛF + u W Y W Y P L P L ∂ ∂ = = ∂ ∂ α −α −α ⎛ ⎞ ⎛ ⎞ ⎛ ⎛ ∂ ∂ ⎞ ⎛ ∂ ∂ ⎞ ⎞ P P P Y L Y L S S P P P Y L Y L T N T T N N = ⎜ ⎟ ⎜ ⎟ = ⎜ ⎜ ⎟ ⎜ ⎟ ⎟ ⎝ ⎠ ⎝ ⎠ ⎝ ⎝ ∂ ∂ ⎠ ⎝ ∂ ∂ ⎠ ⎠ α −α −α ⎛ ⎞ ⎛ ⎞ ⎛ ⎛ ∂ ∂ ⎞ ⎛ ∂ ∂ ⎞ ⎞ i ,t i i ,t j i ,t CPL α βCPL u − Δ = − + P P P Y L Y L S S P P P Y L Y L T N T T N N = ⎜ ⎟ ⎜ ⎟ = ⎜ ⎜ ⎟ ⎜ ⎟ ⎟ ⎝ ⎠ ⎝ ⎠ ⎝ ⎝ ∂ ∂ ⎠ ⎝ ∂ ∂ ⎠ ⎠ α −α −α ⎛ ⎞ ⎛ ⎞ ⎛ ⎛ ∂ ∂ ⎞ ⎛ ∂ ∂ ⎞ ⎞ P P P Y L Y L S S P P P Y L Y L W Y W Y P L P L ∂ ∂ = = ∂ ∂ T N T T N N = ⎜ ⎟ ⎜ ⎟ = ⎜ ⎜ ⎟ ⎜ ⎟ ⎟ ⎝ ⎠ ⎝ ⎠ ⎝ ⎝ ∂ ∂ ⎠ ⎝ ∂ ∂ ⎠ ⎠ , , 1 , (1 ) i t i i t i t CPL α β CPL u − = + − + λ = −ln(1− β ) , t* = −ln0.5 λ (6) , MC P ε = − , / ( / )(1 1/ | |) y p P Y L ε = ∂ ∂ − P = (1+η)MC , η = f (ε, gap, ptm) 1 T N P Pα P −α = * T T P = SP * * * * T T , T T T T T T * * * / T T T , * * T N T N W =W =W W =W =W * * * * N N , N N N N N N 1 1 * * * * / * * / * / / T N T T N N t t t X = ΛF + u i ,t i i ,t j i ,t CPL α βCPL u Δ = − + W Y W Y P L P L α − α −α ⎛ ⎞ ⎛ ⎞ ⎛ ⎛ ∂ ∂ ⎞ ⎛ ∂ ∂ ⎞ ⎞ ∂ ∂ = = ∂ ∂ P P P Y L Y L S S P P P Y L Y L T N T T N N = ⎜ ⎟ ⎜ ⎟ = ⎜ ⎜ ⎟ ⎜ ⎟ ⎟ ⎝ ⎠ ⎝ ⎠ ⎝ ⎝ ∂ ∂ ⎠ ⎝ ∂ ∂ ⎠ ⎠ , , 1 , (1 ) i t i i t i t CPL α β CPL u − = + − + α −α −α ⎛ ⎞ ⎛ ⎞ ⎛ ⎛ ∂ ∂ ⎞ ⎛ ∂ ∂ ⎞ ⎞ W Y W Y P L P L ∂ ∂ = = ∂ ∂ P P P Y L Y L S S P P P Y L Y L T N T T N N = ⎜ ⎟ ⎜ ⎟ = ⎜ ⎜ ⎟ ⎜ ⎟ ⎟ ⎝ ⎠ ⎝ ⎠ ⎝ ⎝ ∂ ∂ ⎠ ⎝ ∂ ∂ ⎠ ⎠ λ = −ln(1− β ) , t* = −ln0.5 λ (7) P SP∗ = , 1 1/ | | y p P ε = − , / ( / )(1 1/ | |) y p P Y L ε = ∂ ∂ − P = (1+η)MC , η = f (ε, gap, ptm) 1 T N P Pα P −α = * T T P = SP * * * * T T , T T T T T T * * * / T T T , * * T N T N W =W =W W =W =W * * * * N N , N N N N N N 1 1 * * * * / * * / * / / T N T T N N t t t X = ΛF + u i ,t i i ,t j i ,t CPL α βCPL u − Δ = − + , , 1 , (1 ) i t i i t i t CPL α β CPL u − = + − + λ = −ln(1− β ) , t* = −ln0.5 λ (8) P SP∗ = , 1 1/ | | y p P ε = − , / ( / )(1 1/ | |) y p P Y L ε = ∂ ∂ − P = (1+η)MC , η = f (ε, gap, ptm) 1 T N P Pα P −α = * T T P SP * * * * T T , T T T T T T * * * / T T T , * * T N T N W =W =W W =W =W * * * * N N , N N N N N N 1 1 * * * * / * * / * / / T N T T N N t t t X = ΛF + u i ,t i i ,t j i ,t CPL α βCPL u − Δ = − + , , 1 , (1 ) i t i i t i t CPL α β CPL u − = + − + λ = −ln(1− β ) , t* = −ln0.5 λ (9) P SP∗ = , 1 1/ | | y p P ε = − , / ( / )(1 1/ | |) y p P Y L ε = ∂ ∂ − P = (1+η)MC , η = f (ε, gap, ptm) 1 T N P Pα P −α = * T T P = SP * * * * T T , T T T T T T * * * / T T T , * T N T N W =W =W W =W =W * * * * N N , N N N N N N 1 1 * * * * / * * / * / / T N T T N N t t t X = ΛF + u i ,t i i ,t j i ,t CPL α βCPL u − Δ = − + α −α −α ⎛ ⎞ ⎛ ⎞ ⎛ ⎛ ∂ ∂ ⎞ ⎛ ∂ ∂ ⎞ ⎞ P P P Y L Y L S S P P P Y L Y L T N T T N N = ⎜ ⎟ ⎜ ⎟ = ⎜ ⎜ ⎟ ⎜ ⎟ ⎟ ⎝ ⎠ ⎝ ⎠ ⎝ ⎝ ∂ ∂ ⎠ ⎝ ∂ ∂ ⎠ ⎠ , , 1 , (1 ) i t i i t i t CPL α β CPL u − = + − + λ = −ln(1− β ) , t* = −ln0.5 λ (10) P SP∗ = , 1 1/ | | y p P ε = − , / ( / )(1 1/ | |) y p P Y L ε = ∂ ∂ − P = (1+η)MC , η = f (ε, gap, ptm) 1 T N P Pα P −α = * T T P = SP * * * * T T , T T T T T T * * * / T T T , * * T N T N W W =W W =W =W * * * * N N , N N N N N N 1 1 * * * * / * * / * / / T N T T N N t t t X = ΛF + u i ,t i i ,t j i ,t CPL α βCPL u − Δ = − + , , 1 , (1 ) i t i i t i t CPL α β CPL u − = + − + λ = −ln(1− β ) , t* = −ln0.5 λ (11) P SP∗ = , 1 1/ | | y p P ε = − , / ( / )(1 1/ | |) y p P Y L ε = ∂ ∂ − P = (1+η)MC , η = f (ε, gap, ptm) 1 T N P Pα P −α = * T T P = SP * * * * T T , T T T T T T P L P L * * * / T T T , * * T N T N W =W =W W =W =W * * * * N N , N N N N N N 1 1 * * * * / * * / * / / T N T T N N t t t X = ΛF + u i ,t i i ,t j i ,t CPL α βCPL u − Δ = − +
  • 23.
    is implied. Thereal exchange rate depends on marginal productivity levels in the tradables and non trada-bles sectors. Given that productivity in the non tradables sector differs not too much across countries, the denumerator is roughly equal to 1. Then, domestic prices will fall below foreign prices as long as productivity in the international sector is lower. More generally, the productivity differential between the tradables and non tradables sector is smaller in the low price country. In case of a Cobb-Douglas production technology, marginal and average productivity coincide. Hence, the conclusion can also be stated in terms of average productivity levels. As long as price levels are lower in less productive countries, for example in the New Member States when com-pared to the Old Member States, the Balassa Samuelson effect is at work. In a dynamic perspective, catching up countries will experience faster productivity growth in the tradable than in the non tradable sector. Higher produc-tivity in the tradable sector allows wages to be bid up in that sector without increasing the price of the tradables being produced. The non tradable sector must raise wages in response. However, since productivity is lower, firms in this sector must fund the higher wages by raising the price of non tradables. Thus the effect predicts higher infla-tion rates in non tradables compared to tradables, implying an increase in the relative price of non tradables. Wage growth in the non tradables sector would be somewhat lower provided that labour is not perfectly mobile across the sectors. The process results in a real exchange rate appreciation (Δ(SP*/P)<0) and a higher overall inflation rate in the domestic economy when the nominal exchange rate is fixed, or through some combination of nominal appreciation and inflation if the exchange rate is flexible. The productivity gap to the Old Member States is still substantial and allows for massive productivity growth in the transition countries. If these economies become more advanced, the Balassa Samuelson effect will gradually disap-pear. In the long run, convergence in productivity levels in the traded goods sector would imply convergence of the CASE Network Reports No. 76/2007 Price convergence in the enlarged internal market 23 overall price levels. Due to wage spillovers prices of non tradables are also expected to converge in this process. III.2 Empirical evidence on the catching up effect In general, the presence of the Balassa-Samuelson effect is confirmed, but its magnitude appears to be rather small, see Égert (2003) for a review. This finding is partially caused by empirical shortcomings. Instead of the ordinary tradables and non tradables distinction, goods and services are produced with a different composition of tradable and non tradable inputs. For example, a share of non tradable inputs is required to produce tradable products (Lee and Tang, 2003, MacDonald and Ricci, 2001). In addition, the impact of inflation in the services sec-tor on price convergence is rather limited because of a low weight of services in representative consumer baskets (Blaszkiewicz, Kowalski, Rawdanowicz and Wozniak, 2004). With rising income levels, the relevance of services will gradually increase. Many contributors have explained the relative price of non traded to traded goods by productivity indicators in both sectors or tested for cointegration, i.e. equilibrium relationships between relative prices and productivities. Prices in the traded and non traded sectors are often proxied by producer and consumer price indices, respectively, where different weighting schemes are neglected. By using a set of control variables, Arratibel, Rodriguez-Palen-zuela and Thimann (2002) have concluded that the Balassa Samuelson effect is almost insignificant in explaining inflation developments in accession countries. In particular in the early years of transition, market reforms appear to be more important in explaining relative price movements. Mihaljek and Klau (2003) has explained inflation differentials between six transition economies and the euro area using the spread of productivity growth across tradables and non tradables sectors. The contribution of the Balassa Samuelson effect to the annual inflation dif-ferential is less than one percentage point except of Slovenia. By employing a very detailed dataset, Égert (2003) has estimated the size of the effect between 2 and 3 percentage points for Estonia over the 1993-2002 period. At the end of the period the contribution to inflation is found to be less than one percentage point. In fact, Estonia has
  • 24.
    converged rather rapidlytowards the EU level, both in terms of per capita income and productivity. Similar effects have been reported by Kovács (2002) using a sample of five Central and Eastern European countries. Other studies have focused on the implications for real exchange rates. De Broeck and Sløk (2001) have inves-tigated CASE Network Reports No. 76/2007 Ch. Dreger, K. Kholodilin, K. Lommatzsch, J. Slacalek, P. Wozniak 24 the effect of sectoral productivity growth on real exchange rate developments in a sample of 26 transition countries. They find that differential productivity growth between the tradables and non tradables sector exerts a different impact on the real exchange rate in the EU accession countries compared to the other economies. Accord-ing to Lojschová (2003), the Balassa-Samuelson effect can account for an average annual rate of real appreciation of around 2.5 percent. In principle, a constant nominal exchange rate could justify an inflation rate 2.5 percent-age points above the rate in the euro area. The size of the effect, however, is smaller, if the assumption of the LOP is relaxed for the tradables sector. Wagner (2005) has detected larger BalassaSamuelson effects between the Old Member States, see also Hlouskova and Wagner (2004). The essential point to be taken from these studies is that catching up is important, but it is likely related to a broader concept than the pure Balassa-Samuelson model (Cihak and Holub, 2001, Wagner, 2005, Égert, Halpern and MacDonald, 2006). For example, Cihak and Holub (2003) have reported a strong positive relationship between GDP per capita and the price level, suggesting that relative per capita income is a powerful variable to proxy a catching up effect. As an extension to the pure Balassa Samuelson model, the quality of products, regulated prices and reputation problems have to be taken into account. Indeed, price behaviour in the New Member States might be influenced by several forces linked to the period of transition. Catching up countries could have lower reputation and need to underprice their products to stay in the market, see Égert and Lommatzsch (2005) and Lommatzsch and Tober (2005). This effect will gradually diminish over the catching up period, as reputation will improve, thereby promoting price convergence. Price levels are not uniformly lower in the New Member States, but can differ depending on the product category considered. Furthemore, regulated prices constitute an obstacle to price convergence. Although most of the prices have been liberalised rather quickly, sensitive prices have been deregulated only gradually, and some of them are still in the liberalisation process (Backé, Fidrmuc, Schardax and Reininger, 2002 and MacDonald and Wojcik, 2004). The transition countries started from a distorted system of relative prices. While the weight of regulated prices in price aggregates does not deviate much from the Old Member States, the size of adjustment differs. Over the catching up period, regulations will be reduced, and this will reinforce convergence. In addition, a number of public services requiring networks and capital have been of poor quality in the former planned period. The improvement in the quality and variety of services from network industries like telecommunications, transport or energy will lead to faster price convergence. The prices of these services have an impact on other markets, as they are inputs to other products. This may foster the convergence of prices towards the EU12 level.
  • 25.
    Price convergence inthe enlarged internal market Part IV: Measuring price convergence by comparative price levels In this section, the methodological aspects of empirical indicators available for investigating the process of price convergence are discussed. �Due to the lack of data on absolute prices, data on relative prices are considered�. In the analysis, cross country comparisons are carried out by using comparative price levels (CPLs). They are calculated as ratios between purchasing power parities (PPPs) and nominal exchange rates (to the euro). This chapter clarifies the construction principles of CPLs, and gives also insights into their limitations. Other aggregates like deflators, consumer and producer price indices are also reviewed. IV.1 Deflators, consumer and producer price indices A serious problem to assess price convergence is the fact that the required data are not easily available. Under the LOP, prices of identical goods should equalize in all regions of the Internal Market. But data on prices of individual goods are scarce and only a few studies are based on them. Likewise, baskets of identical goods are considered, such as the Big Mac Index reported by the Economist or prices in IKEA stores, see Haskel and Wolf (1999, 2001). The number of items is often rather small and the selection might not be representative for the entire economy. In addition, even the products of the same producer and brand can sell in different sizes at different locations, are bundled together with different products or are modified according to local tastes. Therefore, these measures can provide only anecdotical evidence on the impact of market integration on the path of price convergence. Because of the lack of individual data, aggregate price measures like the GDP deflator, consumer, producer or wholesale price indexes are often used instead. Indexes also exist for specific components of the major price indexes. The indicators are harmonised across countries and are available over long time spans. They contain a large bundle of representative goods and services and reveal more information on overall price developments than a arbitrary choice of a few items. The main objective of the indicators is, however, to determine the change in price level. Specifically, the GDP deflator is useful to determine real growth in the entire economy. It is applied to nominal GDP to derive the real GDP series. Hence, it compares prices of the output aggregate over different periods of time. Subindicators include deflators for particular expenditure components, such as private and government consump-tion, fixed business and government investment, construction, and exports and imports of goods and services. The consumer price index (CPI) monitors the average change in the prices consumers pay for a certain basket of products, i.e. it measures the changes in the purchasing power of households. In this sense, the CPI can be CASE Network Reports No. 76/2007 25
  • 26.
    seen as aproxy for the change in the cost of living over time. The representative basket is derived from budget surveys and includes goods and services actually purchased by private households regardless on whether they are produced at home or abroad. In addition, special indexes focus on some of the major components, for in-stance CASE Network Reports No. 76/2007 Ch. Dreger, K. Kholodilin, K. Lommatzsch, J. Slacalek, P. Wozniak 26 the CPI of all items less food and energy. The producer price index (PPI) reflects average changes of prices that producers receive for a basket of goods and services at all stages of the manufacturing process, from crude materials to finished products. Subindicators of the PPI include the PPI for chemicals and manufactured goods, among others. Since the deflators, CPIs and PPIs are intended to calculate the changes in prices in the economy, they reflect in-flation rates but not absolute prices. The indexes may be used to investigate price comovements across countries. In particular, inflation rates are expected to move together in the long run provided that a relative version of the LOP is fulfilled. If arbitrage works sufficiently well, inflation differentials are stationary and will cancel out gradually over time. In shorter time intervals, however, national inflation rates may differ substantially. It should be noted that inflation divergence across countries can also reflect adjustment towards the same price level, i.e. it is caused by different initial conditions. The relative version of the LOP does not require that the weighting schemes of goods and services in price ag-gregates are the same at home and abroad. However, if differences exist, they need to be rather stable over time. This assumption does not hold in a sample of EU25 countries: the weights are affected by income levels, which are quite different between the New and Old Member States. Therefore, structural factors put a serious bias on tests of the relative variant of the LOP. Regarding price convergence, aggregates like the CPI are informative for the catching up process in the New Member States, as they inform about the evolution of the cost of living. But they contain less information about advances in competition, as they reflect cumulated inflation rates and not absolute price levels. The latter remains unknown in an analysis based on CPI and PPI measures. Moreover, �the extreme focus on the representativity of goods and services for the country considered makes them less useful for cross country comparisons. IV.2 Comparative price levels To enable the comparison of price levels across countries, Eurostat and the OECD have undertaken the European Comparison Programme which produces PPPs and comparative price levels for a number of product categories. At the most detailed level, PPPs are labelled as basic headings (Eurostat, 2005). The basic headings are related to expenditure categories that are not disaggregated further. For example, cheese is a basic heading, and cheddar, camembert, roquefort, feta, gorgonzola, and gouda are specific individual products that share the same basic head-ing. Expenditures of cheese are reported by countries, but expenditures of cheese varities remain unpublished. Different basic headings include a different number of goods and services, depending on the complexity and the heterogeneity of the product group considered. The basic headings are calculated as unweighted (geometric) averages of the price ratios of goods and services within the same heading, see the Eurostat (2005) manual for the details. Because these ratios are not weighted cross country differences in the structure goods and services within the same basic heading are ignored. Countries have to price not only the items which are representative for their own market, but also at least one item repre-sentative in the other countries. Some missing country pairs can be calculated through a bridging procedure. The basic headings are robust against any differences in the preference structure at home and abroad. If country A consumes more high quality and expensive products than country B, this has no consequence for the basic head-ings, as all products enter the calculation with equal weights. Likewise, a move to higher quality products in B does not show up in the basic headings unless individual prices adjust. Eurostat does not publish the basic headings on a regular basis, but they can be found in specialized publications.
  • 27.
    Price convergence inthe enlarged internal market Purchasing power parities (PPPs) are defined for different GDP aggregates from very detailed (basic headings) to highly aggregated levels (final consumption expenditures of households and GDP). PPPs are the rates of currency conversion that equalise the purchasing power of different currencies by eliminating differences in price levels. PPPs are obtained as relative prices, i.e. they show the ratio of prices expressed in national currencies for the same good or service in different countries. It is important to note that country specific weighting schemes are not ap-plied if PPPs are expressed for basic headings (Eurostat, 2005). PPPs for basic headings are combined with those from other basic headings to provide a PPP for each stage of the aggregation process. For example, the PPP of the entire consumer basket aggregate is based on data for 147, and final household consumption expenditures comprise 226 basic headings. Aggregated PPPs are calculated as Fisher-type PPPs, i.e. as the geometric mean of the Laspeyres and Paasche type indices. In the combination of PPPs, the technique proposed by Esteto, Koves and Szulc (EKS) is applied, which computes the nth root of the product of all Fisher indices, where n denotes the numbers of countries in the analysis. The EKS method is selected as it is invariant with respect to the choice of the base country and fulfills the transitivity condition. In sum, PPPs above the basic heading level can change not only because of a change in the underlying relative prices, but also due to a change in the weighting system in the domestic or foreign country. Comparative Price Levels (CPLs) are used for cross country comparisons of price levels. CPLs are defined as the PPPs divided by the nominal exchange rate, i.e. they relate market exchange rates to purchasing power parities. Stated another way, the CPL level for a certain bundle of goods and services is its cost in one country as a per cent of the cost of the same bundle in another country, when prices in both countries are expressed in the common currency. CPLs are conventionally expressed in terms of indices such that a base country is set equal to 100. A comparative price level of 100 means that, at the given exchange rate, price levels are the same in the country un-der examination and in the reference country. Figures below 100 indicate that the price level in the country under examination is lower than its counterpart in the reference country. Therefore, the market exchange rate assigns a lower value (in currency units of the reference country) to one local currency unit than the purchasing power parity. Starting from such a position, price level convergence is a process of real appreciation of the local currency relative to the currency of the reference country. The CPLs show the extent of price level dispersion and inform which countries have higher prices. As a guide-line, Eurostat (2005) recommends the use of these measures for monitoring price convergence for higher levels of aggregation rather than for very detailed groups. In particular, the selection of monitored products changes every year to ensure that items are both comparable and representative for consumption patterns. This could introduce volatility especially in highly disaggregated CPLs. IV.3 Drawbacks of comparative price levels Price convergence implies that the dispersion of CPLs will decline over time. However, it is quite important to recognize that convergence of price aggregates differ from convergence of individual prices in several respects. These issues need to be acknowledged for a proper interpretation of the outcome of convergence tests. First, provided that all individual prices exhibit convergence, the aggregates will also exhibit convergence. But, when convergence and divergence occur at the same time for individual prices, the behaviour of the aggregates may be hard to explain and interpret. In particular, convergence may occur just because of the aggregation. CPLs might converge even if individual prices are far from being in parities. Second, CPL convergence may reflect not only the dynamics of CPLs in certain subaggregates, but also a change in the weights in the home and the benchmark country. This is a serious problem whenever aggregates above the basic heading level are considered. It might be argued, however, that weights could be rather stable over relatively short periods. However, this is hardly the case for the New Member States, as their expenditure structure will CASE Network Reports No. 76/2007 27
  • 28.
    change during thecatching up period. Due to the complex process of calculating CPLs, it is rather difficult to carry out sensitivity analysis for these measures in response to changes in weights and relative prices. Nevertheless, it should be kept in mind that CPL convergence or divergence can be a joint outcome of a change in prices and the weighting system. Third, it could be more appropriate to study convergence in terms of PPPs or CPLs for basic headings. For the latter, the PPPs calculated at the basic headings level are divided by the market exchange rate. As stated above, the basic headings are robust against any change in the weighting structure. Thus only price changes can affect the corresponding PPPs and CPLs. However, shifts in the expenditures for products sharing the same basic heading are masked in the aggregate. Overall, the analysis of basic headings can provide additional insights in the process of price convergence. A switch to basic headings provides also a way to get insights into the relative importance of catching up and competition for price level convergence. A look at individual markets is required to address the impacts of higher competition on price convergence, and the basic headings are more related to them. Fourth, shifts towards a higher quality of products can result in higher CPLs because of inaccuracies in the selec-tion CASE Network Reports No. 76/2007 Ch. Dreger, K. Kholodilin, K. Lommatzsch, J. Slacalek, P. Wozniak 28 of goods and services to monitor (Eurostat, 2005). The listing for each basic heading contains products that are comparable and representative across countries. If the condition of comparability is strictly adhered to, no potential for a quality shift is left. But the strict rules may not always be easy to fulfil and some room for flexibility is left to the national statistical offices. Goods and services monitored in the New Member States may be of a lower quality compared to the Old Member States. The selection of differing products might be also motivated by the fact that national statistical offices need to monitor representative goods because at least one good for each basic head-ing is necessary for the PPP calculations (Eurostat, 2005). Whenever the generic product specification leaves some room for interpretation they can choose a leading product sold in the country which may turn out very di fferent from the selections in other countries. In practice this problem can be relevant to a sizeable group of products. There is a high likelihood that price lev-els in poorer countries will be underestimated as the price quotations of these countries refer to goods and services of an inferior quality. When per capita income increases in those countries, households will shift their consumption expenditures towards more expensive, higher quality products, implying that the potential for pricing different goods is reduced.
  • 29.
    Price convergence inthe enlarged internal market Part V: Price trends in the enlarged European Union In this chapter recent price trends are explored. The New Member States have lower price levels than the Old Member States, most probably related to the lower level of per capita income. The backlog is most notable in serv-ices, which are often non tradable. Price levels for goods are also lower. This might indicate either insufficient mar-ket integration, deficiencies in tradability or in the reputation of goods and services produced by the New Member States. �Price convergence is most visible for durables, i.e. the most easily traded goods. During the past decade, price levels have been rising towards the euro area average in almost all product categories. The adjustment takes place through higher inflation rates and currency appreciation on part of the New Member States. Inflation dif-ferentials have been reduced since 2000, and in a number of categories, prices have even declined when converted into euros. This suggests that increased competition in the run up to the EU enlargement has also affected price trends in the New Member States. H�igher competition has led to declining prices for many goods, while services have recorded constantly higher inflation rates. V.1 Comparative price levels across countries Aggregate GDP price levels are rather close to one another for the founding members of the EU, but substantially lower in the New Member States, see Graph V.1. Taken the year 2005 as an example, France had a price level of 105% of the euro area and Italy of 100%. Some countries at the periphery (Ireland, Finland) and Luxembourg have experienced higher levels. In the Southern part of the euro area, prices in Spain, Portugal and Greece fall below 90% of the average. However, the price levels in the New Member States are lower. Only Cyprus (84%) exceeds the price level of the lowest price EU15 countries, i.e. Greece (81%) and Portugal (82%). Prices in the other accession countries are much lower; they range from from 70% in Slovenia and 66% in Malta down to 48% in Lithuania and Latvia. The New Member States have significantly recorded lower per capita income and productivity levels compared to the EU12 countries. According to the Balassa-Samuelson effect, this implies a lower aggregate price level because of the lower nontradable costs and hence lower prices of non tradable and (partly also) tradable goods. Graph V.2 confirms that the link between per capita income and the price level is indeed rather strong. Nevertheless, signifi-cant deviations can be observed for some countries. Although the Czech Republic and Portugal had similar per capita incomes in 2005, their price levels differ by roughly 30 points. On the other hand, Sweden and Ireland had CASE Network Reports No. 76/2007 29
  • 30.
    a similar CPLof 120 in 2005, but the per capita incomes differed by 20 points. Consequently, income alone does not explain the cross-country differences in CPL and some other factors are also important. Graph V.2: Comparative price levels of GDP (vertical) and relative per capita income (horizontal), 2005 gr Note: Raw data from Eurostat, in percent of EU12 average (=100). Per capita income is real GDP per capita in PPP. Luxembourg not included due to outlier problems (GDP per capita 233% of EU12, CPL is 109%). Relative wages in 2005 were considerably more dispersed than relative income (Graph V.3). There appears to be also a clearer division between the New Member States (most scattered around 15-35 per cent) and core old members (90-120 per cent). Even within these groups substantial heterogeneities exist. Poland and Slovakia have the same CPL, but differ by 29 per cent in terms of relative wages. Denmark and Belgium have similar wages but show a difference of 32 per cent in the CPL. CASE Network Reports No. 76/2007 Ch. Dreger, K. Kholodilin, K. Lommatzsch, J. Slacalek, P. Wozniak Graph V.1: Comparative price levels for GDP across EU countries, 2005 Note: Raw data from Eurostat, CPLs in terms of the EU12 average (=100). 30 dk ie se fi lu uk fr de nl at be it es cy pt gr si mt hu ee cz pl sk lv lt dk fi be at cy cz de ee es fr hu it lt lv mt nl pl pt se si sk uk ie 140 120 100 80 60 40 140 120 100 80 60 40 40 50 60 70 80 90 100 110 120 130
  • 31.
    Price convergence inthe enlarged internal market Graph V.3: Comparative price level of GDP (vertical) and nominal relative wages (horizontal), 2005 dk fi ie uk de es se fr cy at be gr si ee cz hu it lv lt mt nl lu pl pt sk 140 120 100 80 60 40 10 20 30 40 50 60 70 80 90 100 110 120 130 140 Note: Raw data from Eurostat and AMECO (nominal wages), in percent of EU12 average (=100). Wages are nominal compensation per employee in the total economy. If the LOP holds, prices of (tradable) goods are set by the international market, whereas prices of (non tradable) services are determined by local conditions. The evidence is broadly in line with this prediction: while the CPLs of goods in New Member States range between 60 and 70 per cent of the EU12 in most cases, those of services are significantly lower and range between 30 and 45 per cent (see Graph V.4). The divergence is most notable for government services, where prices in the Eastern countries are even below 30 per cent of the euro area. While the difference between the EU15 and New Member States is much smaller for goods, convergence in their prices is far from complete. Only Cyprus exceeds 80 per cent of the euro area average. The sources of this divergence could be better understood when goods are broken down into aggregates according to their durability. Indeed, Tables A1 and A2 in the appendix suggest that the more tradable goods are the closer their prices converge to the euro area level and the less is the dispersion within the New Member States. This finding is in line with the LOP. The fact that convergence is not full even for durables (CPLs in Eastern accession countries range between 80 and 90 per cent) may point to significant nontradable components in the prices of all goods, such as wages, rents and transportation, but can also reflect reputation problems of goods produced in the New Member States. Graph V.4: Comparative price levels of goods (bright) and services (dark), 2005 dk ie se fi uk nl at fr de be it lu cy es gr pt mt si hu ee cz sk lt pl lv 150 130 110 90 70 50 30 Note: Raw data from Eurostat, in percent of EU12 average (=100). CASE Network Reports No. 76/2007 31
  • 32.
    Most of theprevious findings can be confirmed for COICOP categories, see Table A3 in the appendix. Products that are tradable or contain a large share of traded goods, such as clothing and footwear or personal transport equipment have a relative high price level in the New Member States. On the other hand, housing, which includes rents and public utilities, and labour intensive services such as restaurants and hotels or education and health have relative low price levels. Large price disparities can be observed for alcohol and tobacco. They are mainly caused by EU differences in taxation. The EU directive has imposed a harmonized minimum rate. But many Old Member States have chosen higher rates on both alcohol and tobacco, while most New Member States negotiated prolonged adjustment periods and still charge rates below the minimum. The sources of large disparities in hous-ing, dk fi fr se be at lu de 140 120 100 80 60 40 20 30 40 50 60 70 80 90 100 110 120 130 140 CASE Network Reports No. 76/2007 Ch. Dreger, K. Kholodilin, K. Lommatzsch, J. Slacalek, P. Wozniak 32 water and electricity� are also administrative. These products are regulated at the municipal or national level and large cross country deviations may stem from different policies of local authorities or regulatory agencies. In the New Member States, these prices have been substantially increased as they were set well below costs under communism. It should be noted that prices of network industries, particularly in the telecommunications sector are higher than in the EU12 for some transition economies. This may indicate that either the liberalisation of these industries has proceeded at a lower pace or that investments to upgrade the quality of services have been passed over to prices in the New Member States to a higher extent. V.2 Changes in comparative price levels over time On the aggregate level, prices for GDP and household consumption expenditures have converged over the past decade. Graphs V.5 and V.6 present scatter plots of related CPLs in 1995 and 2005 for all 25 EU countries. Any point above the 45˚ line reflects an increase in CPL in 2005 relative to the base period. Countries with high price levels in 1995 have seen their prices decline relative to the EU12 average, while those with lower CPLs have in-creased. The dispersion of GDP and household consumption CPLs has been reduced in the course of this process. Graph V.5: Comparative price levels of GDP in EU25 countries in 1995 (horizontal) and 2005 (vertical) it gr cy cz ee es hu lt lv mt nl pl pt si sk ie uk Note: Raw data from Eurostat and AMECO, in percent of EU12 average (=100), Malta 1999 instead of 1995. Regarding the individual country developments, the rise in CPLs has been sizeable for the New Member States (more than 15 per cent in Czech Republic, Estonia, Latvia and Lithuania) with the exception of Slovenia, where it COICOP refers to the Classification of Individual Consumption According to Purpose (United Nations statistical meth-odology).
  • 33.
    amounted to aonly 1 per cent. A significant CPL increase has been observed in Italy, Portugal, Spain and Ireland. In contrast, the CPLs for France, Germany, Belgium and Austria which performed relatively poorly in terms of GDP growth have declined. Graph V.6: Comparative price levels for household consumption in EU25 countries in 1995 (horizontal) and 2005 (vertical) cz ee hu lt lv pl sk 20 30 40 50 60 70 80 90 100 110 120 130 140 130 110 90 70 50 CASE Network Reports No. 76/2007 Price convergence in the enlarged internal market 33 lu be it es uk cy gr fr de mt nl pt si ie Note: Raw data from Eurostat, in percent of EU12 average (=100), Malta 1999 instead of 1995. dk fi at se In the New Member States, convergence has occurred most likely through varying inflation rates and currency appreciation rather than through a combination of a price rise in low CPL and a price fall in high CPL countries. The claim for this notion is the positive aggregate inflation in all EU25 countries throughout the period. Convergence in price aggregates can mask disparities at more disaggregated levels. Thus it is important to also consider the developments at the level of narrower GDP or COICOP aggregates. Graph V.7 presents the coefficient of variation for the CPLs in the EU25 over the 1999-2005 period. Furthermore, Table V.1 presents an extensive summary of various statistics (including HICP inflation) documenting the process of price convergence for several COICOP and GDP categories. Evidence of convergence, i.e. a declining price dispersion can be established for most categories. It has been par-ticularly pronounced in the case of government consumption and services as well as semi durables and machinery and equipment. Among COICOP categories the largest reduction in dispersion has been registered for communica-tion as well as clothing, including footwear. For some categories dispersion has increased in the later years.
  • 34.
    Construction Household consumption Government consumption Capital goods Consumer services Government services Clothing Housing, energy Education Restaurants, hostels Note: Raw data from Eurostat. Coefficient of variation of country CPLs. From left to right: First column 1999, second 2001, third 2003, fourth 2005. An analysis of inflation rates (Table V.1) can shed more light on the dynamics of the price convergence process. The moderate decline in dispersion of durables has been a result of deflation in both the Old and the New Member States. Clothing and footwear as well as communications have seen deflation in the EU15 and positive inflation in the New Member States. CASE Network Reports No. 76/2007 Ch. Dreger, K. Kholodilin, K. Lommatzsch, J. Slacalek, P. Wozniak Graph V.7: EU25 price convergence in COICOP categories, 1999-2005 34 GDP Individual consumption Collective consumption Machinery, equipment Non durable goods Semi durable goods Durable goods Food Alcohol, tobacco Tobacco Health Transport Communication Recreation, culture 60 50 40 30 20 10 0
  • 35.
    CASE Network ReportsNo. 76/2007 Price convergence in the enlarged internal market 35 Table V.1 Price convergence in consumer goods and services Expenditure aggregate year CPL Coefficient of variation Average annual HICP inflation 1999-2005 (%) EU15 NMS EU25 EU15 NMS EU15 NMS Household final consumption expenditure 1995 98.0 44.5 39.3 17.8 37.1 1999 102.7 50.8 32.2 13.9 26.7 1.9 4.5 2002 102.7 58.7 28.8 14.9 20.1 2005 100.9 59.3 26.3 12.6 16.7 Food and non-alcoholic beverages 1995 1999 101.4 55.0 26.4 11.0 24.6 1.7 2.9 2002 101.7 61.7 23.5 12.2 20.2 2005 100.7 64.2 23.2 11.9 19.1 Alcoholic beverages, tobacco and narcotics 1995 1999 113.6 65.2 39.2 30.6 27.7 3.9 4.9 2002 114.8 77.8 37.9 32.8 27.6 2005 110.8 67.9 33.9 26.6 31.9 Clothing and footwear 1995 1999 101.2 68.2 20.6 10.6 17.5 -0.1 0.7 2002 96.8 76.1 17.0 11.1 9.2 2005 97.3 83.1 10.6 8.5 8.5 Housing, water, electricity, gas and other fuels 1995 1999 96.8 32.1 50.1 24.5 42.2 2.8 7.9 2002 97.6 37.5 47.0 25.6 31.0 2005 95.5 39.6 42.0 18.1 22.7 Household furnishings, equipment and maintenance 1995 1999 102.9 63.1 22.4 12.1 17.1 0.9 2.2 2002 104.1 69.4 21.2 11.6 13.8 2005 101.8 71.6 18.5 8.4 15.6 Heath 1995 1999 101.3 32.0 47.5 18.7 53.3 2.9 7.1 2002 101.7 41.2 42.0 18.2 44.3 2005 102.7 43.8 39.6 17.3 35.7 Transport 1995 1999 105.2 64.7 25.9 15.0 14.0 2.8 6.2 2002 105.1 73.4 23.5 16.5 12.8 2005 104.3 77.2 22.0 16.1 12.6 Communication 1995 1999 108.3 95.4 30.3 27.3 25.7 -2.9 3.1 2002 100.8 111.1 20.3 12.6 27.8 2005 96.5 89.1 17.5 12.3 21.8 Recreation and culture 1995 1999 102.9 55.2 30.2 12.0 30.9 0.3 3.8 2002 103.3 64.6 25.7 12.0 22.9 2005 101.4 60.4 26.4 10.6 21.0 Education 1995 1999 103.4 27.2 55.4 23.9 65.4 3.9 6.8 2002 104.9 33.6 52.3 24.5 56.7 2005 103.5 34.7 49.4 21.2 47.5 Restaurants and hotels 1995 1999 107.1 59.4 30.1 12.8 29.1 3.2 5.4 2002 107.2 67.0 30.0 17.1 28.7 2005 104.9 63.2 30.2 16.9 22.5 Miscellaneous goods and Services 1995 1999 102.8 42.7 37.3 14.3 30.2 2.5 4.7 2002 103.7 51.1 35.3 16.2 25.8 2005 103.1 52.6 32.7 15.0 23.3 Consumer goods 1995 1999 103.1 62.8 23.3 10.9 18.8 1.5 3.6 2002 102.7 71.6 20.1 11.8 14.5 2005 101.2 73.3 18.0 10.2 13.6 Non-durables 1995 1999 102.9 56.8 27.3 12.7 20.4 1.6 4.8 2002 103.6 67.1 24.0 14.9 16.0 2005 101.9 68.4 21.9 12.5 15.9 Semi-durables 1995 1999 102.3 71.4 18.2 9.0 15.1 0.0 1.2 2002 99.4 79.3 14.9 9.0 8.5 2005 98.7 82.4 10.7 7.3 7.8 Durables 1995 1999 104.4 84.7 15.6 12.1 16.4 -0.6 -0.5 2002 103.5 88.5 13.8 11.1 13.5 2005 101.6 88.4 13.7 10.9 12.2 Consumer services 1995 1999 102.1 39.9 42.2 18.1 37.1 2.5 5.8 2002 102.4 47.0 38.0 18.1 27.8 2005 100.6 47.4 36.2 15.5 21.7 Note: Raw data from Eurostat. CPL in % of the EU12 (=100) level. HICP inflation is refers to the annual average over the 1999-2004 period. For the �New Member States shares in total final consumption expenditures are used as weights.
  • 36.
    Finally, there isclear evidence that convergence in consumer prices occurred through both high inflation in the New Member States and exchange rates appreciations. However, despite a positive relation between changes in CPLs and HICP inflation rates, the correlation is far from perfect. Increasing price levels have been observed in all New Member States, except of Slovenia. By contrast, HICP inflation rates were often lower or even negative (Latvia). �Despite the substantial similarities in the data included in the CPL and HICP calculation, there is no un-equivocal NE nondurable goods NE durable goods NE semidurable goods Energy Services CASE Network Reports No. 76/2007 Ch. Dreger, K. Kholodilin, K. Lommatzsch, J. Slacalek, P. Wozniak 36 relationship between the two price measures. V.3 Changes in HICP subcategories over time Changes in relative price levels can also be studied by exchange rate adjusted Harmonized Indices of Consumer Prices (HICPs). As noted in chapter IV, however, one needs to be aware of limitations of such analysis. Inflation measured by the HICP provides a useful insight into the developments of purchasing power of local currencies over time. The methodology of HICP puts special emphasis on the representativity of monitored items for local markets and does not attach high importance to international comparability. The harmonization refers to statistical procedures used for choosing items and monitoring their prices rather than to the selection of goods and services to be monitored. Whenever consumption patterns differ between EU countries, inflation figures for any specific subaggregate will refer to a heterogeneous basket of goods reflecting locally representative items. Graph V.8.: Annual HICP inflation in the euro area (bright) and the New Member States (dark), adjusted by the exchange rate, average 2001-2005 6 5 4 3 2 1 0 -1 -2 All items Food, beverages Alcohol, tabacco Clothing Housing, energy Education Restaurants, hostels Health Transport Communications Recreation, culture Furnishings Goods Industrial goods NE industrial goods Miscellaneous Note: Raw data from Eurostat. Eastern European transition countries (Czech Republic, Estonia, Hungary, Latvia, Lithuania, Poland, Slovakia and Slovenia) and euro area (dark). NE=Non energy. The New Member States have registered a higher inflation rate over the period, albeit the difference is not very significant for the aggregate: 2.5% in the New Member States vs. 2.2% in the euro area. But there are sizeable dif-ferences within the COICOP categories. Service dominated aggregates such as housing, water, electricity and other fuels as well as communications are characterised by considerably higher inflation in the New Member States. In line with the Balassa Samuelson effect, this is caused by faster price increases in services enhanced by price hikes in public utilities and network industries. Energy and various communication and transportation services have been underinvested in the former communist period. The technological catching up process requires costly invest-ments which inevitably leads to higher price dynamics in New Member States. This is particularly striking in the
  • 37.
    case of communicationservices which are subject to a sizeable deflation in euro area, but exhibit positive (albeit low) inflation in the New Member States. COICOP categories such as health, education, recreation and culture and restaurants and hotels are dominated by market services and have exhibited higher price dynamics in the catching up countries. Prices for goods domi-nated categories such as food, clothing including footwear as well as furnishings including household equipment have risen slower in the New Member States when compared to the euro area. In contrast� to durables and semi durables, prices of non durables tend to grow faster in the New Member States than in the euro area. �In line with the Balassa-Samuelson effect inflation rates in services have been higher than in the euro area. This evolution could be related to housing services, education and catering. CASE Network Reports No. 76/2007 Price convergence in the enlarged internal market 37
  • 38.
    The empirical analysisdetermines whether price convergence has occurred and provides insights into the driv-ing forces and impediments of this process. As already argued in previous chapters, the empirical support of the LOP is rather limited, as the assumption of perfectly competitive markets is not met. In an environment of monopo-listic CASE Network Reports No. 76/2007 Ch. Dreger, K. Kholodilin, K. Lommatzsch, J. Slacalek, P. Wozniak Part VI: Empirical analysis of price convergence 38 competitive markets firms are able to charge prices that include a mark up over marginal costs. Therefore, cross country deviations in price levels may be traced to cross country differences in marginal costs or in mark ups. These determinants can be distinguished to investigate the impact of recent developments in the Internal Market on the process of price level convergence: increased competition due to the EU enlargement and the catching up of the New Member States. Higher market integration is expected to boost competition and puts a downward pressure on prices via the reduction of mark ups. However, this development is overlapped by the catching up process of the New Member States. As far as convergence of income per capita is not achieved, prices in the transition economies are expected to be on an upward trend. The analysis has to separate these two forces. Proxies for catching up and competition reveal insights into the impact of these components on the path of price convergence. Because of the transition period, the time span of data available for the New Member States is rather short. As a consequence, simple time series models are not appropriate. Instead, the analysis is conducted in a panel framework, where the cross section dimension is taken into account. Hence, the estimated effects display the average across countries and markets. To save regressors, circumvent multicollinearity problems and strengthen the interpretation of the empirical results, a factor analysis is performed. Specifically, a catching up factor is extracted by principal component analysis. This common component is employed in regression models together with alternative competition measures, as a com-mon factor for the competition phenomenon is not suitable. A competition factor would relegate a substantial part of the variation to the idiosyncratic elements. After determining the factors of interest, β convergence is investigated in the first step. Here a negative relation-ship between the initial price level and subsequent changes in the price level is expected to hold. The empirical results indicate the presence of β price convergence: countries with lower initial price levels have experienced higher inflation thereafter and vice versa. This finding is especially confirmed for tradables that are subject to in-ternational competition. Second, the analysis switches to the study of price dispersion over time, i.e. σ convergence. A decline in standard deviations can be detected, and the trend parameter is significant. Third, catching up and
  • 39.
    competition measures areemployed as regressors when relative prices are explained for particular markets, such as non durables, semi durables, durables, services, and investment in equipment and buildings. CPLs for broad cat-egories and basic headings are endogeneous. For broad categories, the analysis is done for the 1999-2005 period. For the basic headings the sample period is even shorter (2000-2004). Catching up and competition seems to be important factors to explain the path of price convergence, most nota-bly for the New Member States. The closer per capita incomes are to the EU12 level, the closer their price levels. Catching up implies price increases especially in the non tradables sector, such as services. The evidence is broadly consistent with this prediction. Competition variables are often significant with the correct sign. In particular, higher competition exerts a downward pressure on prices. Furthermore, the removal of price controls will lead to a decrease in CPLs in the Old, but to an increase in the New Member States. Again, the latter reaction is due to catching up behaviour. Throughout the analysis, the EU12 are used as the benchmark, as euro area prices are not subject to exchange rate fluctuations. VI.1 Description of variables Possible determinants to explain the path of price convergence are grouped into competition and catching up regressors. Competition is proxied by several indicators. At the sectoral level openness to foreign trade and import penetration have been constructed using the ProdCom (Production Communautaire) database from Eurostat. On the nationwide level, the business deregulation index and its ingredients are taken from the Fraser Institute data-base, see Gwartney and Lawson with Gartzke (2005). Catching up is expressed in terms of national variables, like per capita income, labour productivity and compensation of employees. The main characteristics of the series are given in the appendix (Table A4). Differences in per capita income constitute the major reason for divergences in price levels across countries. One explanation is provided by the Balassa-Samuelson effect. The catching up process is almost always associated with higher productivity gains in tradables and higher relative productivity growth than in richer, less dynamic economies. Therefore, prices of non tradables are expected to grow faster in the New Member States. Price levels in the New Member States and poorer EU15 countries are expected to follow an upward trend correlated with per capita income, wage and productivity convergence. Note that prices of tradables are also affected in this process, as they include non tradable inputs. ee pl lv lt sk 140 120 100 80 60 40 40 50 60 70 80 90 100 110 120 130 CASE Network Reports No. 76/2007 Price convergence in the enlarged internal market 39 Graph VI.1: Relative GDP per capita (horizontal) and CPL of GDP, 2005 dk fi uk ie nl se be at gr cy pt mt cz de es fr hu it si Note: Raw data from Eurostat, in percent of EU12 average (=100). Luxembourg is not included due to an outlier (GDP 233% of euro area average, CPL 109%). Eurostat has recently calculated basic headings for 2005, but the classification has changed. Under the new system, data are available only for 2003-2005. For the analysis, the older classification is preferred because of the longer time span.
  • 40.
    Measures for theoverall state of the economy are per capita income (in PPP), compensation of employees and labour productivity, all of them obtained at constant market prices (2000=100). The series are taken from the AMECO database of the EU Commission and are defined in relative terms, i.e. they show the country specific in-formation uk nl ie at be ee mt sk 40 60 80 100 120 140 160 180 CASE Network Reports No. 76/2007 Ch. Dreger, K. Kholodilin, K. Lommatzsch, J. Slacalek, P. Wozniak 40 divided by the EU12 benchmark. As argued in section III, these variables should be positively related to the CPLs. Graph VI.1 confirms this relationship between relative GDP per capita and the CPL of GDP, with a highly significant slope coefficient of 0.92. Although the link is quite strong, it is far from perfect. For example, the Czech Republic and Portugal as well as Netherlands and Denmark realize similar levels of per capita GDP (67% and 117%). But their CPLs differ by 27 and 25 percentage points, respectively. Main competition measures refer to the integration of the countries in international markets. Trade openness is proxied by the sum of exports and imports divided by GDP. An alternative measure is import penetration which is obtained as the ratio between imports and output. In order to measure the competition effect, openness and pen-etration have to be measured on a sectoral scale. For this reason, the ProdCom classification has been used. The raw data refer to 4500 headings related to certain products. They are condensed to 212 categories and aggregated further to match the sectoral division used in this study: non durables (36), semi durables (39), durables (35), equip-ment (38), investment buildings (18) and services (0). If no sectoral information can be revealed, the competition indicators are measured by national variables which have been taken from the AMECO database. Graph VI.2: Trade openness (horizontal) and CPL of GDP, 2005 dk fi se cy fr gr cz de es hu it si lv lt pt pl 140 120 100 80 60 40 Note: Raw data from Eurostat, in percent of EU12 average (=100). Luxembourg not included due to an outlier (trade is 294% of euro area average, CPL 109%). On the nationwide level, Graph VI.2 shows that openness might have a negative impact, i.e. higher trade is associated with a lower price level. The slope coefficient of a regression is -0.23, and significant at the 0.1 level. The New Member States are concentrated in the lower right part of the graph: the countries are generally more open, and have lower price levels than the EU12 average. Compared to relative GDP, the relationship appears to be somewhat weaker. Higher openness to foreign trade implies that the domestic producers are confronted with stronger competition from abroad, thereby reducing their mark ups. Therefore an increase in openness should exert a dampening effect on the price evolution. Another option to proxy the competition effect is the business deregulation index reported by the Fraser Insti-tute; see Gwartney and Lawson with Gartzke (2005). It comprises information about price controls, the burden of regulation (administrative conditions and entry of new businesses), time with government bureaucracy, the ease of starting a new business and irregular payments, for example payments for special business licences. The indicator is ranged between 1 to 10, with 1 indicating the lowest and 10 the highest level of deregulation. Because of the rank
  • 41.
    MC C L ∂ ∂ scale only the sign, but not the size of the impact is interpretable. Data are provided on an annual base from 2000 to 2005 at the nationwide level. Before 2000, the indicator is available at the 5 year frequency. Therefore, the value for 1999 has been interpolated on the base of the 1995 information. The overall measure can be broken down into its subcomponents. This is important because the Fraser index is a too broad concept. For example, time with government bureaucracy may not have an obvious impact on price devel-opments. A stronger deregulation in this area would lead to a rise in the Fraser index, although the fundamental price determinants might not have changed. Therefore, for the purpose of this study, price controls seems to be the most relevant variable (Égert, 2006). A removal of price controls during a catching up period is expected to lead to price in-creases in the EU10. In the EU15, the situation is different, as prices have been already liberalized to a higher extent. A further reduction of controls will introduce more competition, which is especially relevant in network industries, such as telecommunications. Thus a downward pressure on prices should be observed for the EU15. Finally, W CPLs ∂ for Y 41 broad W categories ∂ Y and basic headings for 279 product groups have been taken from Eurostat. Nominal P bilateral = ∂ L exchange = P rates ∂ L to the euro are from the ECB Monthly Bulletin. Exchange rates are needed to convert the PPP type expression of basic headings into a CPL comparable series. VI.2 Catching 1 W up ∂ and Y / competition ∂ L factors T = T T S W ∂ Y ∂ L The first step is to derive suitable factors describing catching up behaviour and competition as the main deter-minants of price convergence. Catching up is relatively easy to quantify as it is directly captured by relative per capita income, productivitiy and wages. These measures are closely correlated among each other. The inclusion of all them in the same regression would inevitably create a collinearity problem, see Table A5 in the appendix for the correlation matrix of the original variables. Therefore a common component is extracted instead. It could be interpreted as a catching up factor and can be used as a substitute for the individual variables in a regression of the W ∂ Y W ∂ Y determinants = on price convergence. = This approach is also a convenient way to extenuate data problems caused by P L P L a short time series ∂ dimension. ∂ The catching up factor is extracted by means of principal component analysis (PCA). The idea behind the PCA is that the variability of all α observed −α variables can be reduced to a limited −α number of sources, or common factors. P P P ⎛ The remaining variability ⎛ ⎞ ⎛ is attributed ⎞ to ⎛ S S T N ∂ the Y idiosyncratic ∂ L ⎞ ⎛ ∂ Y ∂ L ⎞ ⎞ = ⎜ = T T P P ⎟ ⎜ ⎟ ⎜ ⎜ ⎟ ⎜ component, N N ⎟ ⎟ i.e. an individual factor for each variable observed. Formally, ⎝ the ⎠ decomposition ⎝ P ⎠ ⎝ ⎝ ∂ Y ∂ L ⎠ ⎝ ∂ Y ∂ L ⎠ ⎠ is applied, where Xt is the n×1 vector of observed variables; Λ is the n×k matrix of factor loadings; Ft is the k×1 vector of common factors (k substantially lower than n); and ut is the n×1 vector of idiosyncratic shocks. The extraction of the common factors from the series observed is done by PCA. The factors are organized in descend-ing order according to the proportion of the total variability they explain. Therefore, the first principal component contributes more than any other principal component to the variance of the original variables. CASE Network Reports No. 76/2007 Price convergence in the enlarged internal market 41 (12) P SP∗ = , 1 1/ | | y p P ε = − , / ( / )(1 1/ | |) y p P Y L ε = ∂ ∂ − P = (1+η)MC , η = f (ε, gap, ptm) 1 T N P Pα P −α = * T T P = SP * * * * T T , T T T T T T * * * / T T T , * * T N T N W =W =W W =W =W * * * * N N , N N N N N N 1 1 * * * * / * * / * / / T N T T N N t t t X = ΛF + u i ,t i i ,t j i ,t CPL α βCPL u − Δ = − + , , 1 , (1 ) i t i i t i t CPL α β CPL u − = + − + λ = −ln(1− β ) , t* = −ln0.5 λ
  • 42.
    Proportion to overallvariance Correlation (Catching up factor, variables) PC_1 99.32 GDP 0.996 PC_2 99.78 Productivity 0.996 PC_3 100.00 Compensation 0.998 Note: Sample period 1999-2005, Luxembourg excluded. Apart from the deregulation index, all series are measured in relative terms (EU12=100). Principal components are calculated across countries, i.e. each of the underlying series comprises 168 observations (24 countries x 7 periods). PC_x denotes the xth principal component, the other variables are defined in the text. The catching up factor refers to the first principal component. The PCA is based on the correlation matrix of the variables. To derive the catching up factor, it is applied to GDP, labour productivity, and compensation of employees, all of them at constant (2000) prices. The first principal com-ponent CASE Network Reports No. 76/2007 Ch. Dreger, K. Kholodilin, K. Lommatzsch, J. Slacalek, P. Wozniak Table VI.1: Principal component analysis 42 amounts to 99 percent of the total variation of the underlying variables, see the left half of Table VI.1. As shown in the right part of the table, it is strongly correlated with the original variables. Hence, the interpretation as catching up factor is straightforward. Competition is more difficult to address. It is partially, albeit not perfectly, manifested in the openness to for-eign trade or the degree of import penetration, and the strength of business regulation. Openness and import penetration are strongly correlated and both are related to market integration. Import penetration might be more informative because it reflects the exposure of the domestic market to international competition. Therefore, it is preferred in the subsequent analysis. The results obtained with openness are almost identical. The correlation of import penetration and openness with either price controls or the Fraser index is rather weak, see Table A5 in the appendix. Hence the estimation of a common factor would be rather imprecise, since a substantial part of informa-tion is classified as idiosyncratic and dropped from the analysis. Due to the low correlation, it is more reasonable to directly include the original variables in the regression of the determinants on price convergence. VI.2 Beta and sigma convergence Two general concepts to measure convergence of certain variables are distinguished in the literature: β- and σ-convergence. They have been used extensively in the literature of economic growth to assess regional or cross country per capita income and productivity convergence (Barro and Sala-i-Martin, 1995). β-convergence in its absolute form postulates that poor countries (low income or productivity) will experience faster income or pro-ductivity growth thereafter. This implication is usually tested by regressing the growth rate, taken as average over some period of time on initial levels for a cross section of countries. The conditional form predicts β-convergence only after other factors have been taken into account. The latter control for a different steady state position across countries. On the other hand, σ-convergence implies a decrease in the dispersion of per capita income or produc-tivity levels across countries. �It can be shown that β-convergence is necessary, but not sufficient for the existence of σ-convergence, see Barro and Sala-i-Martin (1995). Evidence for both concepts would reveal support of the LOP as a long run condition. In the analysis of prices, absolute β-convergence �is built upon a negative relationship between the initial price level and subsequent price increases. Countries with low prices at the beginning of the period have had higher in-flation on average, implying convergence to the mean of the distribution. In terms of CPLs, an initial CPL level (the national price compared to a numeraire price) is used to explain subsequent changes in the CPL measure, i.e.
  • 43.
    = = ∂∂ ⎛ ⎞ ⎛ ⎞ ⎛ ⎛ ∂ ∂ ⎞ ⎛ ∂ ∂ ⎞ ⎞ P P P Y L Y L S S P P P Y L Y L = ⎜ ⎟ ⎜ ⎟ = ⎜ ⎜ ⎟ ⎜ ⎟ ⎟ ⎝ ⎠ ⎝ ⎠ ⎝ ⎝ ∂ ∂ ⎠ ⎝ ∂ ∂ ⎠ ⎠ W Y W Y P L P L ∂ ∂ = = ∂ ∂ α −α −α ⎛ ⎞ ⎛ ⎞ ⎛ ⎛ ∂ ∂ ⎞ ⎛ ∂ ∂ ⎞ ⎞ P P P Y L Y L S S P P P Y L Y L T N T T N N = ⎜ ⎟ ⎜ ⎟ = ⎜ ⎜ ⎟ ⎜ ⎟ ⎟ ⎝ ⎠ ⎝ ⎠ ⎝ ⎝ ∂ ∂ ⎠ ⎝ ∂ ∂ ⎠ ⎠ α −α −α ⎛ ⎞ ⎛ ⎞ ⎛ ⎛ ∂ ∂ ⎞ ⎛ ∂ ∂ ⎞ ⎞ P P P Y L Y L S S P P P Y L Y L T N T T N N = ⎜ ⎟ ⎜ ⎟ = ⎜ ⎜ ⎟ ⎜ ⎟ ⎟ ⎝ ⎠ ⎝ ⎠ ⎝ ⎝ ∂ ∂ ⎠ ⎝ ∂ ∂ ⎠ ⎠ where i is a country index, αi a country specific fixed effect, ui the error term and t denotes time. The initial CPL is the CPL level lagged j periods. The one period lag (j=1) is usually employed in empirical studies, see Dobado and Marrero (2005) and Wolszczak-Derlacz (2006). Then, the equation relating subsequent CPLs is equivalent. The estimated coefficient of the lagged CPL is an indicator of β-conver-gence. CASE Network Reports No. 76/2007 Price convergence in the enlarged internal market 43 (14) / / / / T N T T N N T N T T N N t t t X = ΛF + u i ,t i i ,t j i ,t CPL α βCPL u − Δ = − + , , 1 , (1 ) i t i i t i t CPL α β CPL u − = + − + λ = −ln(1− β ) , t* = −ln0.5 λ (15) * * N N N N P L P L 1 1 * * * * / * * / * / / T N T T N N t t t X = ΛF + u i ,t i i ,t j i ,t CPL α βCPL u − Δ = − + , , 1 , (1 ) i t i i t i t CPL α β CPL u − = + − + λ = −ln(1− β ) , t* = −ln0.5 λ In particular, two parameters of interest can be immediately revealed from the regression results. The speed of convergence and the half lives of shocks are calculated as (16) * * * * N N , N N N N N N 1 1 * * * * / * * / * / / T N T T N N t t t X = ΛF + u i ,t i i ,t j i ,t CPL α βCPL u − Δ = − + , , 1 , (1 ) i t i i t i t CPL α β CPL u − = + − + λ = −ln(1− β ) , t* = −ln0.5 λ where λ is convergence per period. �The half life t* measured in years indicates how long it takes for the impact of a unit shock to diminish by 50 percent. In case of higher autoregressive orders in the convergence model, the absolute value of the first order coefficient is a suitable approximation to obtain measures for the speed of conver-gence and half lives. Due to the dynamic structure of the panel regression (15), the Arellano and Bond (1991) GLS method is appropriate. As mentioned earlier, β-convergence is a necessary, but not a sufficient condition for price convergence. Here, β-convergence must also hold, which is related to a decrease of the standard deviation of prices over time. In prin-ciple, β-convergence is perfectly compatible with a shift in the ranking of prices across countries, without affecting price dispersion. In the analysis, the presence of σ-convergence is investigated by the sign and significance of the slope coefficient in a regression of the CPL dispersion on a linear time trend. In particular, a panel regression is performed for 41 CPLs for broad categories and 279 basic headings, which are observed for 24 countries. Luxembourg is excluded from the EU25 because of outlier problems. The cross section di-mension is 984 (41x24) in case of broad categories and 6696 (279x24) for basic headings. Broad categories are available at the annual frequency from 1999 to 2005, while basic headings are observed over the 2000 to 2004 period. The basic headings have been converted into the same currency, i.e. divided by the nominal exchange rate to the euro. Thus they are measured in a CPL fashion, but related to specific markets. Overall, the cross section dimension is rather large, but the time series dimension is very short in any case. As the results refer to time series phenomena they should be taken with some caution. But at least, they are useful to provide a first indication of the path of convergence. The results are shown in Table VI.2. The speed of convergence and half lives are calculated according to the for-mula (16). The convergence regressions include a multiplicative dummy to control for a possible different speed of convergence due to the EU enlargement in 2004. This is done only for the broad categories, as the basic headings data end in 2004. Due of the short time span, multicollinearity might occur. However the correlation between the price and the price times the dummy is below 0.1. Thus the dummy regressor can be included directly. Its coef-ficient indicates the change of the impact of the lagged price after 2004. It should be noted that some well known statistics are not informative in this case. For example, the familiar R-squared statistic is an OLS concept that is useful because of the unique way it breaks down the total sum of squares into the sum of the model sum of squares and the residual sum of squares. When the parameters are estimated using GLS techniques, the total sum of squares cannot be broken down in the the same way. Specifically, an R-squared statistic computed from GLS sums of squares need not be bounded between zero and one and does not represent the percentage of total varia-tion in the dependent variable that is accounted for by the model. Also, eliminating or adding variables does not always increase or decrease the computed value.
  • 44.
    CASE Network ReportsNo. 76/2007 Ch. Dreger, K. Kholodilin, K. Lommatzsch, J. Slacalek, P. Wozniak Table VI.2: Price convergence in terms of broad categories and basic headings -EU25 countries 4 Broad categories Basic headings β-convergence CPLt-1 0.941 (0.003) 0.795 (0.030) Dummy*CPLt-1 -0.024 (0.009) Speed of convergence Entire period 0.100 Before enlargement 0.061 After enlargement 0.087 Half-life Entire period 6.9 Before enlargement 11.4 After enlargement 8.0 σ-convergence Time trend -0.027 (0.006) -0.009 (0.001) Dummy*Time trend 0.008 (0.001) Note: Sample period 1999-2005 for broad categories, 2000-2004 for basic headings, Luxembourg excluded. Dummy is equal to 1 from 2004 onwards, 0 elsewhere. Arellano-Bond estimation for β-convergence, OLS regression for σ-convergence. Numbers in parantheses denote robust standard deviations. 5.096 observations for broad categories (24 countries×41 indices×6 years), 32.280 observations for the basic headings (24 countries×269 indices×5 years). The original number of basic headings (279) has been reduced by 10 outliers. Overall, the evidence points to the presence of beta convergence: countries with low relative prices in the initial period have experienced higher changes in the price level thereafter. According to the speed of convergence, only 6 percent of the price differential are removed each period, if the analysis focuses on CPLs for broad categories. The speed of convergence seems to have increased due to the EU enlargement. Given the change in the regression coefficient, the half life drops to 8 years after 2003. In case of basic headings, 10 percent of the price differential diminish in each period. Convergence is expected to take a long period of time, but tends to be faster in the case of basic headings. This might be explained by a higher level of competition for more homogeneous products. Simi-larly, �t�he ECB (2003) has concluded that β-convergence does play an important role in explaining different rates of inflation. However, the ECB study is limited to the euro area. Beta convergence can be also confirmed if more homogeneous groups of countries are considered, such as the EU15 and the EU10. The speed of convergence seems to be a little bit faster in the EU15, see Table A6 in the appendix. Thus the Old Member States converge to their steady state at a faster pace. Note that the steady state positions of the EU15 and the EU10 are not restricted to be the same, as the analysis is done for both groups in an independent way. Specifically, the anchor for the price convergence process, i.e. the steady state of the Old Member States is excluded from the EU10 regressions The steady state positions for the EU15 and EU10 could be different, but they can also coincide.
  • 45.
    In addition, thestandard deviations are declining over time. Thus sigma convergence is confirmed, where the reduction in the price dispersion seems to be more pronounced for the broad categories. After the EU enlarge-ment, the trend parameter decreased in absolute value. Hence, sigma convergence has been slightly weaker after 2004. Again, these results are broadly confirmed in case of the EU15 and EU10 countries. As a rule, convergence should be faster for tradables. It might be also expected for non tradables, albeit at a slower pace, as non tradables may include sizeable shares of tradable inputs. Hence, disaggregation could provide additional conclusions. Therefore, the basic headings for consumer products are split into non durables, semi durables, durables and services. On the investment side, basic headings for equipment and buildings are distin-guished. CASE Network Reports No. 76/2007 Price convergence in the enlarged internal market 45 The convergence tests are carried out for these groups, see Table IV.3 for the EU25 results. Table VI.3: Price convergence in terms of groups of basic headings -EU25 countries β-convergence Non durables Semi durables Durables Services Equipment Buildings Pt-1 0.830 (0.063) 0.663 (0.088) 0.720 (0.056) 0.960 (0.020) 0.827 (0.065) 0.894 (0.039) Speed 0.186 0.411 0.329 0.041 0.189 0.112 Half-life 3.7 1.7 2.1 NA 3.7 6.2 σ-convergence Time trend -0.007 (0.002) -0.012 (0.003) -0.025 (0.011) -0.011 (0.002) -0.019 (0.003) 0.005 (0.001) Note: Sample period 2000-2004, 24 countries, Luxembourg excluded. Arellano-Bond estimation for β-convergence, OLS regression for σ-convergence. Numbers in parantheses denote robust standard deviations. Basic headings are split into 69 non durables, 26 semi durables, 29 durables, 75 services, 20 for investment in equipment and 15 for buildings. 45 basic headings could not be classified. NA=A reasonable estimate cannot be reported, as the speed of convergence is close to 0. According to the empirical evidence, the speed of convergence rises with the tradability of the product. As a consequence, shocks are expected to be removed by 50 percent after 2.1 years in case of durables, compared to 3.7 years for non durables. For investment, convergence turns out to be faster for equipments. although equipment and buildings converge at a similar speed to (probably different) steady states in more homogeneous EU15 and EU10 samples (see Table A7 in the appendix). The impact of shocks appears to be longer for non tradables, such as services. Sigma convergence can be established for most categories. VI.3 Determinants of price convergence After establishing the presence of price convergence, insights into their determinants are provided. In particular, CPLs for broad categories and basic headings are regressed on a number of explanatory variables, i.e. the catching up factor and competition variables. As in the analysis of β- and σ-convergence, the number of cross sections is equal to the product of countries times the number of prices. The panel regressions are estimated both for broad categories and basic headings using OLS with fixed effects. The results are displayed in Table VI.4. Sigma convergence can be detected also in terms of the coefficient of variation, but only for broad categories. In the case of basic headings, the results are affected by some very low means in the original data.
  • 46.
    All variables areestimated with the expected signs. While catching up has a positive impact, competition exerts a neg-ative CASE Network Reports No. 76/2007 Ch. Dreger, K. Kholodilin, K. Lommatzsch, J. Slacalek, P. Wozniak 46 effect on relative prices. Price controls do not appear to be significant. However, this reflects the opposite effects of this variable in the EU15 and EU10 subsamples, see Table A8 in the appendix. In fact, the abolishment of price controls has a negative impact for the Old Member States, but a positive one for the New Member States. Over the catching up period, regulations will be reduced in the EU10, and this will reinforce convergence. The subsamples also indicate that catching up is a phenomenon especially linked to the price evolution in the New Member States. More or less, the basic headings analysis confirms the results obtained at the level of broad categories, see Table VI.4. Table VI.4: Determinants of relative prices (CPLs) -EU25 Broad categories Basic headings Catching up 0.109 (0.004) 0.111 (0.004) Import penetration -0.040 (0.003) -0.001 (0.0003) Price controls 0.012 (0.006) -0.001 (0.001) Note: Sample period 1999-2005 for broad categories, 2000-2004 for basic headings. 24 countries, Luxembourg excluded. OLS fixed effects estimation. Numbers in parantheses denote robust standard deviations. 6,888 observations for broad categories (24 coun-tries×41 indices×7 years), 32,280 observations for the basic headings (24 countries×269 indices×5 years). The original number of basic headings (279) has been reduced by 10 outliers. Finally, Table VI.5 reports evidence at the more disaggregated level. As in the convergence analysis, the basic headings for consumption are splitted into non durables, semi durables, durables and services. On the investment side, basic headings for equipment and buildings are distinguished. All variables are estimated with the correct signs. Again, catching up appears to be the most important regres-sor, especially for the New Member States (see Table A9 in the appendix). The catching up coefficient is high in case of services, and particularly low for durables. This finding is in line with the Balassa-Samuelson prediction. According to this hypothesis, catching up should be more visible for non-tradables. However, the evidence is not entirely consistent on this point: for example, the catching up coefficient for non-durables falls below the one for semi durables, which are tradable to a higher extent. Eventually, this finding is caused by conceptual difficulties with assigning products to the groups considered here: the classification schemes for foreign trade data and basic headings do not perfectly coincide, and some arbitrariness might have biased the results. For some groups like services, trade data is not available at all, and has been replaced by the national series. To avoid possible simultaneity bias due to endogeneous regressors, all models have been estimated using instruments (first and two period lags) instead of the contemporaneous values of the catching up factor.
  • 47.
    CASE Network ReportsNo. 76/2007 Price convergence in the enlarged internal market 47 Table VI.5: Determinants of relative prices (CPLs) for groups of basic headings -EU25 Non durables Semi durables Durables Services Equipment Buildings Catching up 0.080 (0.009) 0.116 (0.012) -0.004 (0.010) 0.159 (0.009) 0.087 (0.016) 0.027 (0.014) Import pen-etration -0.002 (0.001) -0.002 (0.002) -0.002 (0.001) -0.001 (0.001) -0.002 (0.001) -0.002 (0.001) Price controls 0.002 (0.001) 0.001 (0.002) -0.001 (0.002) -0.003 (0.001) 0.001 (0.003) 0.002 (0.002) Note: Sample period 2000-2004, 24 countries, Luxembourg excluded. Panel models estimated with two way fixed effects. Numbers in parantheses denote robust standard deviations. Basic headings are split into 69 non durables, 26 semi durables, 29 durables, 75 services, 20 for investment in equipment and 15 for buildings. 45 basic headings could not be classified. Competition proxied by import penetration enters with a negative sign and is significant with the exception of semi durables and services. On average, competition exerts a dampening effect on prices. Price controls do not show a clear pattern, since they work differently for the Old and the New Member States, see Table A9 in the ap-pendix. Removing price controls will lead to a decrease in relative prices in the Old, but to an increase in the New Member States. In the overall sample (Table VI.5), these opposite effects cancel out. Catching up and competition are relevant especially for the New Member States, where significant effects can be detected in most cases. For the Old Member States, a significant contribution of competition can be detected only for non durables. In fact, competition seems to have increased especially during the 1990s, which are excluded from the period under study. Furthermore, as the New Member States account only for 5 percent of real GDP in the Internal Market, their additional impact on competition in the Old Member States might be hardly visible. Overall, there is some evidence that price convergence takes place in the Internal Market. Due to the enlarge-ment, the speed of convergence has increased. Both catching up and competition factors are relevant to explain the process of price convergence, especially for the New Member States. However, it should be noted that the time series dimension of the regressions is too short to arrive at definitive conclusions. This is particularly true in the case of basic headings, and might explain some inconclusive results of the analysis.
  • 48.
    The main aimof the study is to investigate the effects of EU enlargement on price convergence. The Internal Mar-ket is expected to foster market integration and increase efficiency and welfare through a convergence of prices. Although a high degree of market integration is achieved, price dispersion in the EU has considerably increased with the enlargement in 2004. Price levels in the New Member States are substantially lower than in the Old Member States, most likely due to their lower level in per capita income. Moreover, lacks in tradability and in the reputation of goods and services produced in the New Member States may play a role. In addition, inflation rates in the New Member States exceed the average of the EU15. Two principal forces are crucial to explain the process of price convergence in the Internal Market. On the one hand, the catching up process of low income countries leads to a rise in the price levels and higher inflation over a transition period. The increase in overall price level affects consumption and production patterns. This tendency is based on market reforms, the composition of value added and an increase in the variety and quality of goods. On the other hand, the rise in competition exerts a downward pressure on prices because of lower mark ups. The Law of One Price (LOP) is taken as the point of departure, as it constitutes the fundamental mechanism for price convergence to hold in a perfectly competitive market. It postulates that in the absence of barriers to trade, arbitrage will necessarily force prices of identical products to converge, i.e. the domestic price is equal to the for-eign CASE Network Reports No. 76/2007 Ch. Dreger, K. Kholodilin, K. Lommatzsch, J. Slacalek, P. Wozniak Part VII: Conclusions 48 price, when both are expressed in the same currency. Domestic prices are determined by foreign conditions, implying that prices are exogeneous from the perspective of small open economies. But deviations can persist due to transportation costs. Arbitrage will not occur if price differences are not sufficient to cover the related costs. In addition, not all products are tradable in the Internal Market. Even tradable products contain non tradable compo-nents. Prices of non tradables are lower in the New Member States, as long as they are in the a catching up phase. The literature clearly indicates substantial deviations from the LOP even over longer periods of time. However, the LOP might be interpreted as an equilibrium relationship for the long run. Over long time horizons, the impedi-ments of the LOP will gradually lose their significance, i.e. price differentials cannot exist forever. Because the LOP is not an attractor in the short and medium run, the price setting behaviour of firms has to be linked to domestic factors. It can be explained in terms of the mark up of prices over marginal costs of production. If markets are fully competitive, prices and marginal costs will coincide, implying that any mark up should van-ish. In an environment of monopolistic competition firms are able to charge prices that include a mark up over marginal costs. Therefore, cross country deviations in price levels may be traced to cross country differences in marginal costs or in mark ups. For the purpose of this study these determinants have been grouped into catching up and competition variables.
  • 49.
    Due to theabsence of a sufficient amount of absolute price data, �research has been often focused on certain areas or products, where prices are relatively easy available, such as in the food sector. However, these prices are less repre-sentative for the functioning of the Internal Market. On the other hand, studies based on relative price aggregates can-not distinguish whether the effect of lower price dispersion is caused by the convergence of prices of individual goods or services or a change in the weighting system. Moreover, consumer and producer price indexes are less informative regarding advances in competition, as they reflect cumulated inflation rates rather than absolute prices. T�he focus on the representativity of products for the country considered makes them less useful for international comparisons. To overcome the disadvantages of price indices�, the analysis refers to comparative price levels (CPLs). These measures are calculated as the ratio between purchasing power parities (PPPs) and nominal exchange rates. PPPs are based on price levels of a comparable and representative sample of goods and services covering the various aggregates of GDP in the EU25 member states. At the most disaggregated level, PPPs rely on relative price ratios for 279 basic headings. Distinct factors are identified to obtain insights into the impact of catching up and competition on the path of price convergence. A factor analysis is conducted, where a catching up factor is extracted by means of principal component analysis. It is derived from a dataset comprising real GDP, real productivity of labour, and real com-pensation of employees. The first principal component is interpreted as the catching up factor, since it represents almost all of the variation of its ingredients. Competition is more difficult to address. It is partially, albeit not perfectly, manifested in the openness to foreign trade or the degree of import penetration, and the strength of business regulation, the latter proxied by the Fraser index. This measure can be broken down into its ingredients, such as price controls, the burden of regulation, time with government bureaucracy, the ease of starting a new business and irregular payments. For the purpose of this study, price controls are chosen as the most important subindicator. Openness and import penetration are strongly correlated and both are related to market integration. Import penetration might be more informative because it reflects the exposure of the domestic market to international competition and is therefore preferred in the analysis. As the correlation of import penetration and openness to foreign trade with either price controls or the Fraser index is rather weak, the estimation of a competition factor would be rather imprecise: a substantial part of infor-mation would be classified as idiosyncratic and dropped from the analysis. Therefore, it seems more reasonable to directly include the original variables in the regression equation of the determinants on price convergence. The empirical analysis shows a negative relation between the initial price level and subsequent price increases. Countries with lower initial price levels tend to have higher inflation rates thereafter. Convergence of price levels will gradually occur. Convergence appears to be stronger in case for basic headings, probably as they are related to more homogeneous products. In addition, the speed of convergence seems to rise with the tradability of the product considered. Shocks are expected to be removed by 50 percent after 2.1 years in case of durables, com-pared to 3.7 years for non durables. The impact of shocks is even longer for services and buildings. In addition, a decline in the price dispersion over time can be observed, as the slope coefficient in a trend regression appears to be significant in all cases. Catching up and competition seems to be important drivers to explain the path of price convergence. Catching up appears to be the most important regressor, especially for the New Member States. The catching up coefficient is high in the case of services, and low for durables. This finding seems to be in line with the Balassa-Samuelson prediction, as catching up should be more visible for non-tradables. Probably due to classification problems, the evidence is not entirely consistent on this point: for example, the catching up coefficient for non-durables falls be-low the one for semi durables, where the latter products are tradable to a higher extent. Competition exerts a downward pressure on prices, most notably in the New Member States. For the Old Mem-ber States competition may have increased especially during the 1990s, which are not part of the analysis. In ad- CASE Network Reports No. 76/2007 Price convergence in the enlarged internal market 49
  • 50.
    dition, the NewMember States account only for 5 percent of real GDP in the Internal Market. Thus, their impact on competition in the Old Member States could be hardly visible. In fact, competition is insignificant in the EU15 subsample in most cases. Finally, the removal of price controls will lead to a decrease in relative prices in the Old, but to an increase in the New Member States. The opposite effects can be explained by the different degrees of price regulation in the Old and New Member States. To sum up, there is some evidence that price convergence takes place in the Internal Market. Due to the enlarge-ment, CASE Network Reports No. 76/2007 Ch. Dreger, K. Kholodilin, K. Lommatzsch, J. Slacalek, P. Wozniak 50 the speed of convergence has increased. Both catching up and competition factors are relevant to explain the process of price convergence, especially for the New Member States. However, it should be noted that the time series dimension of the regressions is too short for definitive conclusions. This is particularly true in the case of basic headings, and might explain some inconclusive results of the analysis.
  • 51.
    References Allington, NigelF. B., Kattuman, P., Waldmann, F.A. (2005): One Market, one money, one price?, International Journal of Central Banking 1, 73-115. Andrén, N., Oxelheim, L. (2006): Producer prices in the transition to a common currency, Research Institute for Industrial Economics, Stockholm, Working paper 668. Arratibel, O., Rodriguez-Palenzuela, D., Thimann, C. (2002): Inflation dynamics and dual inflation in accession countries: a ‘New Keynesian’ perspective, ECB Working Paper 132, 2002. Arellano, M., Bond, S. (1991): Some tests of specification for panel data. Monte Carlo evidence and an application to employment equations, Review of Economic Studies 58, 277-297. Backé, P., Fidrmuc, J., Schardax, F., Reininger, T. (2002): Price dynamics in Central and Eastern European EU ac-cession CASE Network Reports No. 76/2007 Price convergence in the enlarged internal market 51 countries, Oesterreichische Nationalbank Working Paper 61. Balassa, B. (1964): The purchasing-power parity doctrine: a reappraisal, Journal of Political Economy 72, 584-596. Banerjee, A., Russell, B. (2004): A reinvestigation of the mark up and the business cycle, Economic Modelling 21, 267-284. Banerjee, A., Russell, B. (2005): Inflation and measures of the mark up, Journal of Macroeconomics 27, 289-306. Barro, R., Sala-i-Martin, X. (1995): Economic Growth, MIT Press, New York. Benigno, G., Thoenissen, C. (2003): Equilibrium exchange rates and capital and supply side performance, Eco-nomic Journal 113, 103-124. Bills, M., Klenow, P. (2002): Some evidence on the importance of price stickiness, NBER Working Paper 9069. Blaszkiewicz, M., Kowalski, P., Rawdanowicz, L., Wozniak, P. (2004): The Harrod-Balassa-Samuelson effect in select-ed countries of Central and Eastern Europe, CASE Report 57, Center for Social and Economic Research, Warzaw. Bloom N., Bond S., van Reen J. (2007): Uncertainty and investment dynamics, Review of Economic Studies 74, 391–415. Borio, C., Filardo, A. (2006): Globalisation and inflation: New cross country evidence on the global determinants of domestic inflation, Bank for International Settlements, mimeo. Calvo, G. (1983): Staggered price setting in a utility maximising framework, Journal of Monetary Economics 12, 383-398. Cecchetti, S.G., Mark, N.C., Sonora, R.J. (2000): Price level convergence among United States cities: Lessons for the European Central Bank, NBER Working paper 7681. Chen, N., Imbs, J., Scott, A. (2006): The Dynamics of trade and competition, Working Paper 96, National Bank of Belgium. Ciccarelli, M. Mojon, B. (2005): Global inflation, Working Paper 537, European Central Bank. Cihak, M., Holub, T. (2001): Convergence of relative prices and inflation in Central and Eastern Europe, Interna-tional Monetary Fund Working Paper WP01/124. Cihak, M., Holub, T. (2003): Price convergence: What can the Balassa-Samuelson model tell us?, Czech National Bank Working Paper 8/2003. Corsetti, G., Dedola, L. (2005): A macroeconomic model of international price discrimination, Journal of Interna-tional Economics 67, 129-155. Crucini, M.J., Telmer, C.I., Zachariadis, M. (2005): Understanding European real exchange rates, American Eco-nomic Review 95. Dierx, A., Ilzkovitz, F., Sekkat, K. (2002): European integration and the functioning of product markets: selected issues, EU Commission: Special Report on the European economy 2. De Broeck, M., Sløk, T. (2001): Interpreting real exchange rate movements in transition countries, Bank of Finland Institute for Economies in Transition Discussion paper.
  • 52.
    DG Internal Market(1996): Price competition and price convergence, Single Market Review Series, http://europa. eu.int/comm/internal_market/studies/stud28.htm. Dobado, R., Marrero, G. (2005): Corn market integration in Porfirian Mexico, Journal of Economic History 65, 103-128. Égert, B. (2003): Nominal and real convergence in Estonia: The Balassa-Samuelson (dis)connection, Bank of Es-tonia CASE Network Reports No. 76/2007 Ch. Dreger, K. Kholodilin, K. Lommatzsch, J. Slacalek, P. Wozniak 52 Working paper. Égert, B. (2006): Price level convergence and inflation rates in Europe: East-West Divide?, mimeo. Égert, B., Halpern, L., MacDonald, R. (2006), Equilibrium exchange rates in transition economies: Taking stock of the issues, �Journal of Economic Surveys 20, 257-324. Égert, B., Lommatzsch, K. (2005): The tradable based real exchange rate and estimation uncertainty, In: Welfens, P. J.J., Wziatek-Kubiak, A. (eds.): Structural change and exchange rate dynamics, Springer Berlin Heidelberg NewYork. Eichenbaum, M., Fisher, J.D. (2004): Evaluating the Calvo model of sticky prices, NBER Working Paper 10617. Engel, C. (1993): Real exchange rates and relative prices: An empirical investigation, Journal of Monetary Eco-nomics 32, 35-50. Engel, C., Rogers, J.H. (1996): How wide is the border?, American Economic Review 86, 1112-25. Engel, C., Rogers, J.H. (2001): Violating the Law of One Price: Should we make a federal case out of it? Journal of Money, Credit and Banking 33, 1-15. Engel, C., Rogers, J. (2004): European Product Market Integration after the Euro, Economic Policy, 39, 347-384. European Central Bank (2003), Inflation differentials in the euro area: potential causes and policy implications, Frankfurt. European Commission (2000): The Lisbon European Council – An agenda of economic and social renewal for Europe. European Commission (2001): Price levels and price dispersion in the EU, European economy, Supplement A. European Commission (2004a): Preliminary analysis of price data, DG Internal Market. European Commission (2004b): Facing the challenge. The Lisbon strategy for growth and employment. Report from the high level group chaired by Wim Kok. European Commission (2005): Internal market scoreboard 14. Eurostat (2003), Purchasing power parities and related economic indicators for the euro area, accession countries, candidate countries and EFTA, Statistics in Focus 64. Faber, R.P., Stokman, C.J. (2005): Price convergence in Europe from a macro perspective: Product categories and reliability, De Nederlandsche Bank, Working paper 34/05. Goldberg, P.K., Verboven, F. (2004): Cross-country price dispersion in the European car market, Economic Policy 19, 483-521. Goldberg, P.K., Verboven, F. (2005): Market integration and convergence to the law of one price: Evidence from the European car market, Journal of International Economics 65, 49-73. Gwartney, J., Lawson, R., with Gartzke, E. (2005): Economic Freedom of the World: 2005 annual report of the Fraser Institute, http://www.freetheworld.com. Haskel, J., Wolf, H. (2001): The Law of One Price - A case study, NBER Working Papers 8112. Hlouskova, J., Wagner, M. (2004): What’s really the story with this Balassa Samuelson effect in the CEECs, Univer-sity of Bern, Discussion Paper 04-16. International Monetary Fund (2006): How has globalization affected inflation?, World Economic Outlook, Chapter 3. Koedijk, K., Tims, B., van Dijk, M. (2004): Purchasing power parity and the euro area, Journal of International Money and Finance 23, 1081-1107.
  • 53.
    Kovács, M.A. (2002):On the estimated size of the Balassa-Samuelson effect in five Central and Eastern European countries, National Bank of Hungary, Working Paper 2002/5. Lee, J., Tang, M.K. (2003): Does productivity growth lead to appreciation of the real exchange rate?, IMF Working Paper WP/03/154. Lojschová, A. (2003): Estimating the impact of the Balassa-Samuelson effect in transition economies, Institute for Advanced Studies, Vienna, Economic Series 140. Lommatzsch, K., Tober, S. (2004), What is behind the real appreciation of the accession countries’ currencies? An investigation of the PPI-based real exchange rates, Economic Systems 28, 383-403. Lutz, M (2004): Price convergence under EMU? First estimates, in Deardorff, A. (ed.): Past, present, and future of the European Union. Proceedings of the 13th World Congress of the International Economic Association, Macmil-lan CASE Network Reports No. 76/2007 Price convergence in the enlarged internal market 53 Press. Mathä, T. Y. (2003): What to expect of the euro? Analysing price differences of individual products in Luxembourg and its surrounding regions, Working paper 8, Central Bank of Luxembourg. MacDonald, R., Ricci, L. (2001): PPP and the Balassa Samuelson effect: The role of the distribution sector, IMF Working Paper WP/01/38. MacDonald, R., Wójcik, C. (2004): Catching up: The role of demand, supply and regulated price effects on the real exchange rates of four accession countries, Economics of Transition 12, 153-179. Mihaljek, D., Klau, M. (2003): The Balassa-Samuelson effect in Central Europe: A disaggregated analysis, Bank of International Settements Working Paper 143. Mumtaz, H., Surico, P. (2006): Evolving international inflation dynamics: World and country specific factors, Bank of England. O’Connell, P.G.J., Wei, S.-J. (1997): The bigger they are, the harder they fall: How price differences across US cities are arbitraged, NBER Working Papers 6089. Obstfeld, M., Rogoff, K. (1996): Foundations of international macroeconomics, Cambridge (Mass.), MIT Press. Obstfeld, M, Taylor, A. (1997): Nonlinear aspects of goods-market arbitrage and adjustment: Heckscher’s commod-ity points revisited, Journal of the Japanese and International Economies 11, 441-479. Pain, N., Koske, I., Sollie, M. (2006): Globalisation and inflation in the OECD economies, OECD Economics De-partment Working Paper 524. Parsley, D.C., Wei, S.-J. (1996): Convergence to the Law of One Price without trade barriers and currency fluctua-tions, Quarterly Journal of Economics 111, 1211-36. Parsley, D.C., Wei, S.-J. (2003): A prism into the PPP Puzzles: The microfoundations of Big Mac real exchange rates, NBER Working Paper 10074. Romer, D. (2001): Advanced Macroeconomics, 2nd edition, Boston. Rogers, J., Hufbauer, G.C., Wada, E. (2001): Price level convergence and inflation in Europe, Institute for Interna-tional Economics Working Paper 01-01. Rogers, J.H. (2002): Monetary union, price level convergence, and inflation: How close is Europe to the United States?, International Finance Discussion Papers 740. Washington: Board of Governors of the Federal Reserve System. Rogoff, K. (1996): The purchasing power parity puzzle, Journal of Economic Literature 34, 647-668. Roodman D. (2006): How to do xtabond2: An introduction to “difference” and “system” GMM in Stata. mimeo. Samuelson, P.A. (1964): Theoretical notes on trade problems. Review of Economics and Statistics 46, 145-154. Smets, F., Wouters, R. (2002): An estimated stochastic dynamic general equilibrium model of the euro area, ECB Working paper 171. Taylor, J. (1982): Aggregate dynamics and staggered contracts, Journal of Political Economy 88, 1-24. Varian, H.R. (2006): Intermediate microeconomics. A modern approach, W.W. Norton & Co Ltd., London.
  • 54.
    Wagner, M. (2005):The Balassa-Samuelson effect in ‘East and West’. Differences and similarities, Institute for Advanced Studies, Vienna, Economics Series 180. Wolf, H. (2003): International relative prices: Facts and interpretation, Annex D, Prices and EMU, HM Treasury, London. Wolszczak-Derlacz, J. (2006): One Europe, one product, two prices. The price disparity in the EU, Katholieke Uni-versiteit CASE Network Reports No. 76/2007 Ch. Dreger, K. Kholodilin, K. Lommatzsch, J. Slacalek, P. Wozniak 54 Leuven, Center for Economic Studies, Discussion Paper 06.14.
  • 55.
    CASE Network ReportsNo. 76/2007 Price convergence in the enlarged internal market 5 Appendix
  • 56.
    CASE Network ReportsNo. 76/2007 Ch. Dreger, K. Kholodilin, K. Lommatzsch, J. Slacalek, P. Wozniak Table A1: Relative price levels of selected product categories 56 BL GE FR LU NL AT FN GR SP IR IT PT DK GDP 1995a00 107 119 107 116 105 110 113 72 80 87 78 69 130 1999a00 105 112 104 110 103 104 110 80 82 103 90 73 126 2004a00 100 103 106 106 103 100 112 80 87 115 99 81 130 2005a00 100 103 105 106 103 101 113 81 89 116 100 82 131 Total goods 1995a00 105 114 108 109 105 109 107 83 84 88 80 82 133 1999a00 103 108 106 102 105 105 103 90 85 103 92 83 131 2004a00 99 103 105 98 107 103 109 86 91 119 97 86 128 2005a00 100 103 103 99 105 103 109 87 91 120 99 86 128 Consumer goods 1995a00 106 106 108 104 100 111 126 88 88 97 87 90 133 1999a00 105 102 105 96 101 104 117 93 86 106 98 90 132 2004a00 101 102 101 97 101 102 113 87 87 116 105 92 131 2005a00 102 102 100 98 100 102 112 88 88 115 105 92 131 Non-durable goods 1995a00 104 107 106 100 97 111 124 80 85 96 91 85 136 1999a00 103 101 107 93 95 103 118 89 84 109 102 88 135 2004a00 101 104 103 96 104 102 113 82 81 121 104 89 133 2005a00 102 105 102 97 103 102 112 82 82 121 104 88 132 Semi-durable goods 1995a00 113 107 112 117 101 107 124 103 90 91 82 88 115 1999a00 114 105 103 109 106 106 109 101 91 89 94 84 113 2004a00 103 102 96 104 91 105 109 95 98 99 106 90 116 2005a00 104 101 96 104 88 104 108 99 99 95 107 90 115 Durable goods 1995a00 106 103 108 106 110 116 135 102 96 109 81 114 146 1999a00 102 102 101 95 113 107 122 100 90 117 94 100 142 2004a00 101 95 100 97 103 101 117 101 98 117 105 111 142 2005a00 102 95 99 97 103 100 115 102 99 116 106 112 143 Capital goods 1995a00 104 126 108 116 111 106 85 76 78 76 70 69 132 1999a00 101 117 107 112 111 105 88 85 83 100 83 75 131 2004a00 96 104 112 99 115 105 104 84 95 121 88 77 123 2005a00 99 104 108 100 112 106 104 85 95 126 90 77 125 Total services 1995a00 109 126 106 128 106 111 120 63 77 85 75 59 129 1999a00 108 118 102 121 102 104 119 72 80 103 89 64 124 2004a00 102 105 106 120 102 98 119 75 83 119 101 78 137 2005a00 102 104 106 120 102 98 119 76 85 119 102 78 138 Consumer services 1995a00 109 121 116 114 109 110 128 70 79 89 75 52 129 1999a00 109 113 111 110 106 102 129 79 82 107 88 59 121 2004a00 104 101 113 106 104 96 126 81 87 125 98 75 139 2005a00 103 100 113 105 103 96 125 81 90 124 99 76 138 Government services 1995a00 110 132 97 145 104 112 113 54 75 81 76 67 131 1999a00 107 126 94 137 98 107 109 62 77 100 92 73 129 2004a00 100 110 100 135 100 101 112 68 79 112 106 81 135 2005a00 101 110 99 136 100 102 113 69 80 114 107 82 138
  • 57.
    CASE Network ReportsNo. 76/2007 Price convergence in the enlarged internal market 57 SW UK CZ ES CY LA LI HU MT PO SV SL GDP 1995a00 112 83 36 36 80 31 24 41 41 69 38 1999a00 119 109 43 51 85 44 40 44 64 46 72 40 2004a00 116 105 51 55 84 47 46 57 65 47 70 50 2005a00 115 105 55 57 84 48 48 58 67 53 70 51 Total goods 1995a00 110 88 1999a00 116 114 59 74 87 67 62 63 78 62 81 59 2004a00 117 107 68 74 92 66 66 74 80 60 78 70 2005a00 118 107 73 74 92 67 68 76 82 68 77 72 Consumer goods 1995a00 113 89 1999a00 116 114 59 68 94 65 60 61 85 60 85 53 2004a00 116 104 71 71 100 65 65 74 87 62 83 71 2005a00 112 103 75 72 101 65 66 75 88 70 83 72 Non-durable goods 1995a00 118 92 1999a00 119 113 52 62 83 59 54 55 79 55 83 47 2004a00 119 107 64 65 98 59 59 68 80 58 79 65 2005a00 115 107 68 67 100 60 60 70 81 66 79 67 Semi-durable goods 1995a00 105 83 1999a00 114 111 70 76 101 72 69 66 83 70 91 63 2004a00 114 95 89 84 98 80 81 84 89 70 93 82 2005a00 111 93 92 86 97 77 80 86 89 76 94 85 Durable goods 1995a00 103 89 1999a00 112 120 86 88 130 95 82 87 109 81 87 78 2004a00 108 105 87 84 109 83 83 89 115 79 89 86 2005a00 104 104 90 81 109 82 80 89 115 87 87 87 Capital goods 1995a00 105 87 1999a00 115 114 59 85 77 72 67 68 68 64 75 67 2004a00 119 113 64 78 80 67 69 74 69 57 71 70 2005a00 125 114 70 77 80 68 74 78 72 65 70 72 Total services 1995a00 115 79 1999a00 123 106 30 35 81 28 26 30 54 34 63 25 2004a00 118 102 37 41 76 35 31 43 55 36 64 34 2005a00 116 103 40 43 76 35 32 44 55 41 64 36 Consumer services 1995a00 124 79 1999a00 132 107 32 47 82 36 31 34 58 40 63 27 2004a00 119 99 38 52 74 43 37 46 55 42 63 38 2005a00 116 99 41 54 75 44 39 48 56 48 64 40 Government services 1995a00 108 79 1999a00 116 105 29 26 82 22 22 26 50 28 63 24 2004a00 116 106 36 33 78 28 26 40 55 31 65 30 2005a00 115 107 40 34 79 28 27 42 55 36 65 32 Note: Raw data from Eurostat, in percent of EU12 average (=100). BL=Belgium, GE=Germany, FR=France, LU=Luxembourg, NL=Netherlands, AT= Austria, FN=Finland, GR=Greece, SP=Spain, IR=Ireland, IT=Italy, PT=Portugal, DK=Denmark, SW=Sweden, UK=United Kingdom, CZ=Czech Republic, ES=Estonia, CY=Cyprus, LA=Latvia, LI=Lithuania, HU=Hungary, MT= Malta, PO=Poland, SV=Slovenia, SK=Slovakia.
  • 58.
    CASE Network ReportsNo. 76/2007 Ch. Dreger, K. Kholodilin, K. Lommatzsch, J. Slacalek, P. Wozniak Table A2: Relative price levels of main GDP expenditure categories 58 BL GE FR LU NL AT FN GR SP IR IT PT DK GDP 1995a00 107 119 107 116 105 110 113 72 80 87 78 69 130 1999a00 105 112 104 110 103 104 110 80 82 103 90 73 126 2004a00 100 103 106 106 103 100 112 80 87 115 99 81 130 2005a00 100 103 105 106 103 101 113 81 89 116 100 82 131 Individual consumption 1995a00 108 116 107 116 104 112 124 74 81 90 80 70 131 1999a00 107 110 104 107 101 104 119 81 82 105 93 74 127 2004a00 101 103 104 110 102 100 118 80 85 119 103 84 136 2005a00 101 102 104 110 101 100 118 81 87 119 103 84 136 Gross fixed capital formation 1995a00 104 126 108 116 111 106 85 76 78 76 70 69 132 1999a00 101 117 107 112 111 105 88 85 83 100 83 75 131 2004a00 96 104 112 99 115 105 104 84 95 121 88 77 123 2005a00 99 104 108 100 112 106 104 85 95 126 90 77 125 Machinery and equipment 1995a00 99 116 116 102 108 95 103 106 83 95 74 93 129 1999a00 95 110 109 98 104 93 103 110 87 102 86 99 117 2004a00 97 102 103 95 100 99 104 106 96 110 96 108 115 2005a00 99 101 104 94 98 98 102 107 97 107 98 105 113 Construction 1995a00 107 131 102 126 118 111 73 61 75 66 66 56 132 1999a00 104 122 106 125 125 112 78 69 81 100 78 59 143 2004a00 99 108 116 98 127 111 103 71 92 124 81 59 135 2005a00 101 109 109 100 127 114 106 72 93 135 83 61 138 Final consumption expenditure 1995a00 108 117 107 118 104 111 122 72 80 89 79 69 131 1999a00 107 112 103 110 102 104 118 79 82 104 93 73 127 2004a00 101 103 104 112 102 100 117 79 85 118 103 83 135 2005a00 101 103 104 112 101 100 117 80 86 118 103 83 136 Household final consumption expenditure 1995a00 107 112 111 109 104 111 127 78 82 93 81 70 131 1999a00 107 107 108 101 103 103 122 86 83 106 93 73 126 2004a00 102 101 106 101 102 99 119 84 88 121 101 84 134 2005a00 102 100 106 102 102 99 118 85 89 120 102 84 135 Government final consumption expenditure 1995a00 110 132 97 145 104 112 113 54 75 81 76 67 131 1999a00 107 126 94 137 98 107 109 62 77 100 92 73 129 2004a00 100 110 100 135 100 101 112 68 79 112 106 81 135 2005a00 101 110 99 136 100 102 113 69 80 114 107 82 138
  • 59.
    GDP 1995a00 11283 41 36 31 24 38 41 36 69 80 1999a00 119 109 46 51 44 40 40 44 43 72 85 64 2004a00 116 105 47 55 47 46 50 57 51 70 84 65 2005a00 115 105 53 57 48 48 51 58 55 70 84 67 Individual consumption 1995a00 115 83 1999a00 121 110 44 47 42 38 36 40 40 71 87 66 2004a00 118 103 46 52 46 44 47 54 48 71 86 67 2005a00 115 103 52 54 47 45 49 55 52 71 86 68 Gross fixed capital formation 1995a00 105 87 1999a00 115 114 64 85 72 67 67 68 59 75 77 68 2004a00 119 113 57 78 67 69 70 74 64 71 80 69 2005a00 125 114 65 77 68 74 72 78 70 70 80 72 Machinery and equipment 1995a00 94 93 1999a00 98 106 80 87 79 83 89 80 80 94 91 89 2004a00 97 99 85 94 86 86 96 91 87 92 107 97 2005a00 98 98 93 91 87 85 97 93 93 91 103 99 Construction 1995a00 117 84 1999a00 134 122 49 80 63 53 49 58 43 59 64 51 2004a00 148 126 43 67 55 57 53 63 49 57 66 54 2005a00 161 128 49 67 57 65 55 68 55 56 68 58 Final consumption expenditure 1995a00 114 82 1999a00 121 109 43 45 39 36 34 39 39 70 87 64 2004a00 118 103 44 50 44 42 45 53 47 70 84 65 2005a00 115 103 50 52 45 43 47 54 51 70 85 66 Household final consumption expenditure 1995a00 118 84 43 39 36 29 37 41 38 71 1999a00 123 110 50 56 50 45 40 46 45 74 89 70 2004a00 117 101 51 61 53 51 53 59 53 73 87 70 2005a00 114 101 58 62 54 52 55 61 56 72 88 71 Government final consumption expenditure 1995a00 108 79 1999a00 116 105 28 26 22 22 24 26 29 63 82 50 2004a00 116 106 31 33 28 26 30 40 36 65 78 55 2005a00 115 107 36 34 28 27 32 42 40 65 79 55 Note: Raw data from Eurostat, in percent of EU12 average (=100). BL=Belgium, GE=Germany, FR=France, LU=Luxembourg, NL=Netherlands, AT= Austria, FN=Finland, GR=Greece, SP=Spain, IR=Ireland, IT=Italy, PT=Portugal, DK=Denmark, SW= Sweden, UK=United Kingdom, CZ=Czech Republic, ES=Estonia, CY=Cyprus, LA=Latvia, LI=Lithuania, HU=Hungary, MT= Mal-ta, CASE Network Reports No. 76/2007 Price convergence in the enlarged internal market SW UK PO ES LA LI SK HU CZ SL CY MT 59 PO=Poland, SV=Slovenia, SK=Slovakia.
  • 60.
    CASE Network ReportsNo. 76/2007 Ch. Dreger, K. Kholodilin, K. Lommatzsch, J. Slacalek, P. Wozniak Table A3: Relative price levels of main COICOP categories 60 BL GE FR LU NL AT FN GR SP IR IT PT DK Individual consumption 1995a00 108 116 107 116 104 112 124 74 81 90 80 70 131 1999a00 107 110 104 107 101 104 119 81 82 105 93 74 127 2004a00 101 103 104 110 102 100 118 80 85 119 103 84 136 2005a00 101 102 104 110 101 100 118 81 87 119 103 84 136 Alcoholic beverages, tobacco and narcotics 1995a00 112 106 105 97 109 116 189 77 69 161 89 75 159 1999a00 107 99 115 84 102 104 164 85 71 163 104 76 146 2004a00 100 100 114 88 104 98 137 83 78 185 100 83 124 2005a00 99 103 110 89 102 98 130 82 78 179 101 83 123 Alcoholic beverages 1995a00 115 95 107 105 117 116 229 94 76 194 82 81 154 1999a00 105 92 111 94 107 107 192 99 76 179 101 80 136 2004a00 93 95 94 91 103 100 169 100 84 198 111 112 132 2005a00 96 95 94 93 103 99 162 104 84 199 113 111 130 Tobacco 1995a00 112 120 105 91 104 117 153 70 64 141 93 71 170 1999a00 110 108 119 79 99 103 138 79 69 154 105 73 157 2004a00 114 109 147 84 107 97 115 73 73 185 92 68 124 2005a00 109 116 138 85 105 99 109 69 72 174 94 68 122 Clothing and footwear 1995a00 117 107 117 130 96 106 124 107 90 92 83 95 110 1999a00 118 108 100 120 103 109 104 102 91 81 95 82 101 2004a00 104 102 92 106 86 105 110 96 98 94 109 90 108 2005a00 104 101 92 107 84 104 110 101 100 91 111 90 108 Housing, water, electricity, gas and other fuels 1995a00 109 131 115 120 103 100 122 73 69 79 66 40 130 1999a00 103 120 112 125 106 93 119 77 72 110 80 39 126 2004a00 105 104 110 111 109 84 116 74 85 128 92 70 134 2005a00 103 102 110 111 110 86 116 74 89 125 93 70 133 Household furnishings, equipment and maintenance 1995a00 107 112 112 113 102 114 119 82 89 88 82 73 117 1999a00 104 105 110 99 114 104 102 87 86 102 93 75 121 2004a00 103 96 105 104 95 100 110 93 98 114 105 88 123 2005a00 104 96 105 105 94 99 111 94 99 111 105 88 123 Health 1995a00 113 128 95 130 111 117 120 50 74 80 81 65 137 1999a00 108 122 90 116 93 108 111 60 79 104 101 69 131 2004a00 97 99 98 115 100 99 126 75 84 116 122 84 144 2005a00 97 99 97 116 99 101 128 77 84 119 122 85 147
  • 61.
    Individual consumption 1995a00115 83 1999a00 121 110 44 47 42 38 36 40 40 71 87 66 2004a00 118 103 46 52 46 44 47 54 48 71 86 67 2005a00 115 103 52 54 47 45 49 55 52 71 86 68 Alcoholic beverages, tobacco and narcotics 1995a00 165 138 1999a00 165 189 71 68 63 63 49 49 53 70 104 106 2004a00 137 180 58 64 55 60 66 70 64 68 136 116 2005a00 131 175 65 65 53 58 65 70 67 67 131 112 Alcoholic beverages 1995a00 192 142 1999a00 166 164 103 105 99 95 56 61 61 88 141 146 2004a00 163 163 92 95 98 87 79 86 85 85 165 132 2005a00 159 160 103 97 95 87 81 88 91 83 163 131 Tobacco 1995a00 144 134 1999a00 167 211 47 44 35 31 44 41 48 58 78 82 2004a00 123 207 35 40 29 33 58 60 50 58 118 107 2005a00 115 200 39 40 27 31 56 60 52 58 112 101 Clothing and footwear 1995a00 103 81 1999a00 108 107 67 73 65 65 57 59 68 88 101 77 2004a00 110 89 70 90 80 85 83 86 96 92 100 88 2005a00 107 86 74 92 77 84 85 88 98 91 98 87 Housing, water, electricity, gas and other fuels 1995a00 121 62 1999a00 121 78 30 41 25 24 19 29 28 62 67 40 2004a00 108 75 34 47 36 30 34 37 37 57 59 34 2005a00 105 75 39 48 37 31 36 38 39 58 60 35 Household furnishings, equipment and maintenance 1995a00 107 90 1999a00 113 119 58 67 69 61 59 64 67 70 99 85 2004a00 119 109 62 70 64 65 68 68 71 79 94 97 2005a00 115 108 70 70 64 64 68 69 76 82 95 99 Health 1995a00 111 81 1999a00 112 104 29 28 24 23 26 25 28 60 88 55 2004a00 126 108 36 41 33 31 33 44 35 67 95 63 2005a00 125 109 41 43 35 35 36 46 39 67 93 64 Transport 1995a00 103 101 109 97 115 116 129 73 90 101 86 103 142 1999a00 104 100 104 89 110 109 130 78 92 112 95 98 141 2004a00 100 103 100 92 118 110 124 80 90 113 97 91 154 2005a00 101 103 100 93 118 109 123 80 91 111 98 93 154 Personal transport equipment 1995a00 101 95 104 99 118 116 151 118 105 129 87 137 186 1999a00 100 97 101 90 120 107 140 114 96 133 93 123 183 2004a00 99 97 97 93 116 105 126 98 98 128 101 123 187 2005a00 99 96 97 93 117 106 125 97 99 128 102 124 188 Communication 1995a00 158 111 100 76 98 145 147 64 84 156 84 82 104 1999a00 156 111 73 74 154 134 154 74 92 109 104 93 115 2004a00 104 101 104 81 98 100 84 103 96 110 97 97 80 2005a00 106 102 105 79 95 94 76 104 97 111 98 98 79 Recreation and culture 1995a00 104 103 108 103 94 110 121 86 92 80 90 75 120 1999a00 109 102 106 104 98 106 125 88 89 99 95 84 124 2004a00 98 102 104 107 97 100 118 87 91 110 101 87 131 2005a00 99 102 103 108 97 99 117 88 92 110 101 88 130 Education 1995a00 112 150 95 171 101 122 115 56 78 81 73 85 130 1999a00 110 145 92 167 98 116 112 61 79 95 85 91 129 2004a00 103 128 96 163 96 105 106 62 73 112 103 95 131 2005a00 103 128 96 164 97 107 108 63 75 115 102 96 133 Restaurants and hotels 1995a00 101 107 118 114 111 111 132 92 90 113 91 60 131 1999a00 110 97 110 105 90 100 125 107 92 120 103 83 117 2004a00 108 98 114 99 104 101 129 92 92 129 103 79 155 2005a00 109 97 113 100 104 101 129 92 94 131 103 78 155 Miscellaneous goods and services 1995a00 103 117 106 117 106 116 120 68 76 84 71 69 133 1999a00 102 108 106 102 98 103 115 81 81 93 90 70 123 2004a00 100 101 106 104 101 105 122 77 81 118 101 88 141 2005a00 101 101 105 105 100 106 122 78 83 118 102 88 142 CASE Network Reports No. 76/2007 Price convergence in the enlarged internal market SW UK PO ES LA LI SK HU CZ SL CY MT BL GE FR LU NL AT FN GR SP IR IT PT DK 61
  • 62.
    CASE Network ReportsNo. 76/2007 Ch. Dreger, K. Kholodilin, K. Lommatzsch, J. Slacalek, P. Wozniak 62 SW UK PO ES LA LI SK HU CZ SV CY MT Transport 1995a00 114 92 1999a00 115 127 64 63 66 59 55 70 59 75 88 77 2004a00 125 118 70 68 63 65 71 83 67 82 95 89 2005a00 122 118 78 70 65 66 72 84 71 80 95 91 Personal transport equipment 1995a00 102 94 1999a00 107 127 86 92 105 93 79 91 89 93 152 129 2004a00 102 103 84 91 88 87 89 97 92 91 115 124 2005a00 98 103 90 84 89 81 93 97 95 86 113 122 Communication 1995a00 123 122 1999a00 160 161 115 77 120 89 70 81 68 58 77 127 2004a00 78 90 81 80 104 59 92 86 86 69 47 85 2005a00 73 87 92 78 97 59 96 88 100 69 44 91 Recreation and culture 1995a00 112 84 1999a00 126 108 56 58 50 47 43 47 45 85 101 76 2004a00 119 103 54 57 51 50 50 58 48 78 90 73 2005a00 116 102 61 59 51 51 52 60 52 79 91 74 Education 1995a00 106 89 1999a00 117 116 23 21 17 18 20 22 24 63 86 51 2004a00 111 115 27 25 22 20 23 35 32 64 76 52 2005a00 110 116 31 27 22 22 23 36 36 66 78 53 Restaurants and hotels 1995a00 116 92 1999a00 122 135 64 62 69 46 42 48 45 72 105 76 2004a00 127 120 59 63 58 56 48 61 46 67 102 71 2005a00 125 121 67 63 60 56 51 63 49 68 104 70 Miscellaneous goods and services 1995a00 108 85 1999a00 121 107 42 42 40 37 35 35 38 69 73 65 2004a00 125 107 45 50 42 43 46 53 46 73 85 66 2005a00 123 108 51 52 42 45 49 54 49 73 86 67 Note: Raw data from Eurostat, in percent of EU12 average (=100). BL=Belgium, GE=Germany, FR=France, LU=Luxembourg, NL=Netherlands, AT= Austria, FN=Finland, GR=Greece, SP=Spain, IR=Ireland, IT=Italy, PT=Portugal, DK=Denmark, SW=Sweden, UK=United Kingdom, CZ=Czech Republic, ES=Estonia, CY=Cyprus, LA=Latvia, LI=Lithuania, HU=Hungary, MT= Malta, PO=Poland, SV=Slovenia, SK=Slovakia.
  • 63.
    CASE Network ReportsNo. 76/2007 Price convergence in the enlarged internal market 63 Table A4: Mean and standard deviation of variables, 1999-2005 EU25 EU15 EU10 Mean Std Dev Mean Std Dev Mean Std Dev CPL 1.488 0.087 1.536 0.039 1.420 0.091 GDP -0.507 0.723 0.021 0.301 -1.246 0.437 PRO -0.555 0.696 -0.041 0.280 -1.275 0.407 COM -0.607 0.761 -0.047 0.273 -1.391 0.482 ER 2.520 2.317 2.771 2.321 2.170 2.266 PEN 3.807 1.605 3.043 1.367 4.878 1.264 OPEN 3.657 1.633 3.153 1.605 4.362 1.395 CONTROL 0.917 0.268 1.021 0.210 0.771 0.273 Note: Raw data from Eurostat. All variables are in logarithms and, apart from the exchange rate (ER), also in relative terms (EU12=100). PRO=Labour productivity, COM=Compensation of employees, PEN=import penetration (share of imports in produc-tion), OPEN=Openness to foreign trade (sum of exports and imports divided by GDP). CONTROL=Degree of price controls.
  • 64.
    CASE Network ReportsNo. 76/2007 Ch. Dreger, K. Kholodilin, K. Lommatzsch, J. Slacalek, P. Wozniak Table A5: Correlation matrix of explanatory variables, 1999-2005 EU25 64 GDP PRO COM ER PEN OPEN GDP 1.00 0.99 0.99 -0.09 -0.47 -0.26 PRO 0.99 1.00 0.99 -0.07 -0.46 -0.25 COM 0.99 0.99 1.00 -0.06 -0.48 -0.29 ER -0.09 -0.07 -0.06 1.00 -0.04 -0.03 PEN -0.47 -0.46 -0.48 -0.04 1.00 0.94 OPEN -0.26 -0.25 -0.29 -0.03 0.94 1.00 CONTROL 0.43 0.41 0.37 -0.06 -0.13 0.04 EU15 GDP PRO COM ER PEN OPEN GDP 1.00 0.95 0.92 -0.70 0.19 0.38 PRO 0.95 1.00 0.96 -0.65 0.25 0.43 COM 0.92 0.96 1.00 -0.66 0.25 0.38 ER -0.70 -0.65 -0.66 1.00 -0.13 -0.28 PEN 0.19 0.25 0.25 -0.13 1.00 0.96 OPEN 0.38 0.43 0.38 -0.28 0.96 1.00 CONTROL 0.56 0.50 0.47 -0.53 0.02 0.14 EU10 GDP PRO COM ER PEN OPEN GDP 1.00 0.98 0.96 -0.12 -0.09 -0.16 PRO 0.98 1.00 0.97 -0.14 -0.07 -0.14 COM 0.96 0.97 1.00 -0.11 -0.16 -0.23 ER -0.12 -0.14 -0.11 1.00 0.31 0.51 PEN -0.09 -0.07 -0.16 0.31 1.00 0.96 OPEN -0.16 -0.14 -0.23 0.51 0.96 1.00 CONTROL -0.28 -0.36 -0.42 0.29 0.37 0.39 Note: Raw data from Eurostat. �All variables are in logarithms and, apart from the exchange rate (ER), also in relative terms (EU12=100). PRO=Labour productivity, COM=Compensation of employees, PEN=import penetration (share of imports in produc-tion), OPEN=Openness to foreign trade (sum of exports and imports divided by GDP). CONTROL=Degree of price controls.
  • 65.
    CASE Network ReportsNo. 76/2007 Price convergence in the enlarged internal market 65 Table A6: Price convergence in terms of broad categories and basic headings EU15 Broad categories Basic headings β-convergence CPLt-1 0.931 (0.011) 0.578 (0.008) Dummy*CPLt-1 -0.054 (0.022) Speed of convergence 0.07 0.24 Half-life 9.8 2.9 σ-convergence Time trend -0.032 (0.001) -0.207 (0.005) Dummy*Time trend 0.016 (0.001) EU10 Broad categories Basic headings β-convergence CPLt-1 0.935 (0.005) 0.703 (0.065) Dummy*CPLt-1 -0.048 (0.018) Speed of convergence 0.07 0.15 Half-life 10.3 4.5 σ-convergence Time trend -0.064 (0.002) -0.013 (0.001) Dummy*Time trend 0.028 (0.003) Note: Sample period 1999-2005 for broad categories, 2000-2004 for basic headings, Luxembourg excluded. Dummy is equal to 1 from 2004 onwards, 0 elsewhere. Arellano-Bond estimation (β-convergence), OLS regression (σ-convergence). Numbers in parentheses denote standard deviations. 6.888 observations for broad categories (24 countries×41 indices×7 years), 32.280 observations for the basic headings (24 countries×269 indices×5 years). The original number of basic headings (279) has been reduced by 10 outliers.
  • 66.
    CASE Network ReportsNo. 76/2007 Ch. Dreger, K. Kholodilin, K. Lommatzsch, J. Slacalek, P. Wozniak Table A7: Price convergence in terms of groups of basic headings EU15 β-convergence 6 Non durables Semi durables Durables Services Equipment Buildings Pt-1 0.585 (0.016) 0.344 (0.009) 0.343 (0.008) 0.832 (0.008) 0.727 (0.012) 0.739 (0.008) Speed 0.54 1.07 1.07 0.18 0.32 0.30 Half-life 1.3 0.7 0.6 3.8 2.2 2.3 σ-convergence Time trend -0.211 (0.002) -0.208 (0.003) -0.210 (0.002) -0.199 (0.003) -0.221 (0.004) 0.179 (0.005) EU10 β-convergence Non durables Semi durables Durables Services Equipment Buildings Pt-1 0.725 (0.091) 0.243 (0.111) 0.714 (0.074) 0.997 (0.010) 0.764 (0.188) 0.794 (0.055) Speed 0.32 1.42 0.34 NA 0.27 0.23 Half-life 2.2 0.5 2.1 NA 2.6 3.0 σ-convergence Time trend -0.015 (0.003) -0.012 (0.004) -0.022 (0.002) -0.008 (0.002) -0.025 (0.003) -0.016 (0.002) Note: Sample period 2000-2004, 24 countries, Luxembourg excluded. Arellano-Bond estimation (β-convergence), OLS regression (σ-convergence). Numbers in parentheses denote standard deviations. Basic headings are split into 69 non durables, 26 semi durables, 29 durables, 75 services, 20 for investment in equipment and 15 for buildings. 45 basic headings could not be classified. NA=A reason-able estimate cannot be reported, as the speed of convergence is close to 0.
  • 67.
    CASE Network ReportsNo. 76/2007 Price convergence in the enlarged internal market 67 Table A8: Determinants of relative prices (CPLs) EU15 Broad categories Basic headings Catching up 0.0003 (0.001) 0.025 (0.004) Import penetration -0.011 (0.001) -0.004 (0.001) Price controls -0.003 (0.002) -0.003 (0.001) EU10 Broad categories Basic headings Catching up 0.016 (0.001) 0.065 (0.004) Import penetration -0.009 (0.001) -0.007 (0.001) Price controls 0.006 (0.002) 0.019 (0.002) Note: Sample period 1999-2005 for broad categories, 2000-2004 for basic headings. 24 countries, Luxembourg excluded. Arellano- Bond estimation. Numbers in parentheses denote standard deviations. 6.888 observations for broad categories (24 countries×41 indi-ces×7 years), 32.280 observations for the basic headings (24 countries×269 indices×5 years). The original number of basic headings (279) has been reduced by 10 outliers.
  • 68.
    CASE Network ReportsNo. 76/2007 Ch. Dreger, K. Kholodilin, K. Lommatzsch, J. Slacalek, P. Wozniak Table A9: Determinants of relative prices (CPLs) for groups of basic headings -EU15 68 Non durables Semi durables Durables Services Equipment Buildings Catching up 0.023 (0.011) 0.002 (0.017) 0.010 (0.014) 0.041 (0.007) -0.111 (0.037) 0.080 (0.045) Import penetration -0.004 (0.002) -0.002 (0.002) -0.001 (0.001) -0.002 (0.002) -0.005 (0.003) -0.005 (0.003) Price controls -0.005 (0.002) -0.013 (0.004) -0.009 (0.003) -0.001 (0.002) -0.010 (0.004) -0.000 (0.006) EU10 Non durables Semi durables Durables Services Equip-ment Buildings Catching up 0.067 (0.010) 0.119 (0.011) 0.043 (0.008) 0.063 (0.005) 0.112 (0.011) 0.023 (0.013) Import penetration -0.004 (0.003) -0.007 (0.002) -0.007 (0.001) -0.003 (0.002) -0.002 (0.001) -0.000 (0.001) Price controls 0.007 (0.006) -0.002 (0.003) 0.004 (0.003) 0.017 (0.003) 0.011 (0.004) -0.010 (0.007) Note: Sample period 2000-2004, 24 countries, Luxembourg excluded. Panel models estimated with two way fixed effects. Numbers in parentheses denote standard deviations. Basic headings are split into 69 non durables, 26 semi durables, 29 durables, 75 services, 20 for investment in equipment and 15 for buildings. 45 basic headings could not be classified.