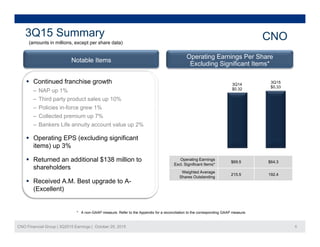
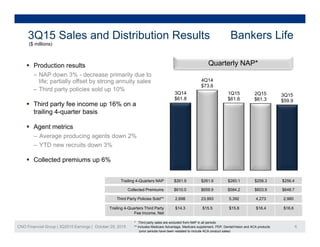
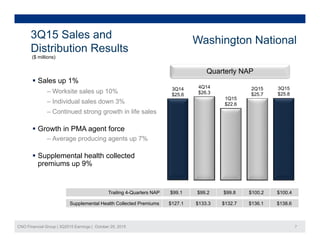
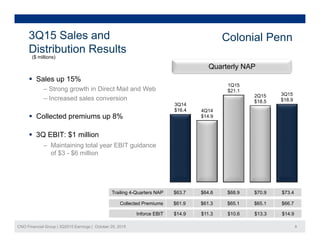
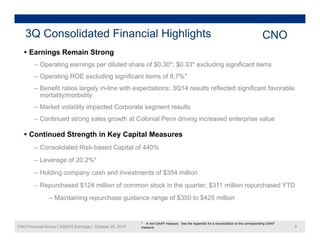
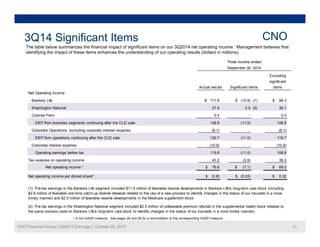
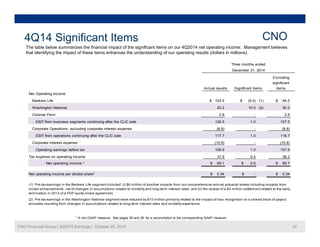
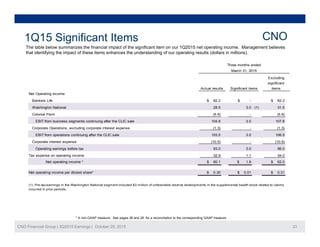
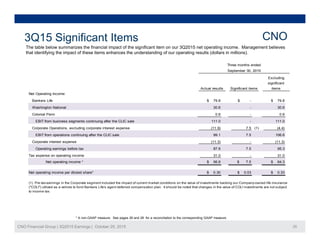
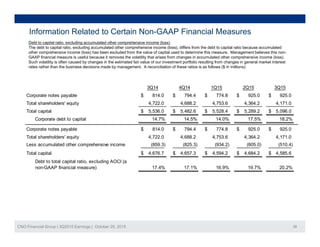
3Q153Q15
Financial and operating results for the period ended September 30, 2015
October 29, 2015
Unless otherwise specified, comparisons in this presentation are between 3Q15 and 3Q14.
Forward-Looking Statements
Certain statements made in this presentation should be considered
forward-looking statements as defined in the Private Securities Litigation
Reform Act of 1995. These include statements about future results of
operations and capital plans. We caution investors that these forward-
looking statements are not guarantees of future performance, and actual
results may differ materially. Investors should consider the important
risks and uncertainties that may cause actual results to differ, including
those included in our press release issued on October 28, 2015, our
Quarterly Reports on Form 10-Q, our Annual Report on Form 10-K and
th fili k ith th S iti d E h C i i Wother filings we make with the Securities and Exchange Commission. We
assume no obligation to update this presentation, which speaks as of
today’s date.
CNO Financial Group | 3Q2015 Earnings | October 29, 2015 2
Non-GAAP Measures
This presentation contains the following financial measures that differ from the
comparable measures under Generally Accepted Accounting Principles (GAAP):
operating earnings measures; book value excluding accumulated other comprehensiveoperating earnings measures; book value, excluding accumulated other comprehensive
income (loss) per share; operating return measures; earnings before the net loss on the
sale of CLIC and gain (loss) on reinsurance transactions, the earnings of CLIC prior to
being sold, net realized investment gains (losses), fair value changes in embedded
derivative liabilities, fair value changes related to the agent deferred compensation plan,derivative liabilities, fair value changes related to the agent deferred compensation plan,
loss on extinguishment of debt, other non-operating items, corporate interest expense
and taxes; and debt to capital ratios, excluding accumulated other comprehensive income
(loss). Reconciliations between those non-GAAP measures and the comparable GAAP
measures are included in the Appendix, or on the page such measure is presented.measures are included in the Appendix, or on the page such measure is presented.
While management believes these measures are useful to enhance understanding and
comparability of our financial results, these non-GAAP measures should not be
considered substitutes for the most directly comparable GAAP measures.
Additional information concerning non-GAAP measures is included in our periodic filings
with the Securities and Exchange Commission that are available in the “Investors – SEC
Filings” section of CNO’s website, www.CNOinc.com.
CNO Financial Group | 3Q2015 Earnings | October 29, 2015 3
CNO Financial Group | 3Q2015 Earnings | October 29, 2015 4
CNO3Q15 Summary
(amounts in millions, except per share data)
Operating Earnings Per Share
Excluding Significant Items*
Notable Items
 Continued franchise growth
‒ NAP up 1%
‒ Third party product sales up 10%
‒ Policies in-force grew 1%
3Q14
$0.32
3Q15
$0.33
‒ Policies in-force grew 1%
‒ Collected premium up 7%
‒ Bankers Life annuity account value up 2%
 Operating EPS (excluding significant
Operating Earnings
Excl. Significant Items*
$69.5 $64.3
Operating EPS (excluding significant
items) up 3%
 Returned an additional $138 million to
shareholders
Weighted Average
Shares Outstanding
215.5 192.4
 Received A.M. Best upgrade to A-
(Excellent)
CNO Financial Group | 3Q2015 Earnings | October 29, 2015 5
* A non-GAAP measure. Refer to the Appendix for a reconciliation to the corresponding GAAP measure.
3Q15 Sales and Distribution Results Bankers Life
($ millions)($ millions)
Quarterly NAP* Production results
‒ NAP down 3% - decrease primarily due todo 3% dec ease p a y due o
life; partially offset by strong annuity sales
‒ Third party policies sold up 10%
 Third party fee income up 16% on a
3Q14
$61.8
4Q14
$73.6
1Q15
$61.6
2Q15
$61.3
3Q15
$59.9
trailing 4-quarter basis
 Agent metrics
‒ Average producing agents down 2%g p g g
‒ YTD new recruits down 3%
 Collected premiums up 6%
Third Party Policies Sold** 2,698 23,993 5,392 4,273 2,980
Trailing 4-Quarters NAP $261.9 $261.6 $260.1 $258.3 $256.4
Collected Premiums $610.0 $659.9 $584.2 $603.9 $648.7
CNO Financial Group | 3Q2015 Earnings | October 29, 2015 6
* Third party sales are excluded from NAP in all periods
** Includes Medicare Advantage, Medicare supplement, PDP, Dental/Vision and ACA products
(prior periods have been restated to include ACA product sales)
Trailing 4-Quarters Third Party
Fee Income, Net
$14.3 $15.5 $15.8 $16.4 $16.6
Washington National3Q15 Sales and
Di t ib ti R lt
g
Distribution Results
($ millions)
Quarterly NAP
 Sales up 1%
‒ Worksite sales up 10%
‒ Individual sales down 3%
3Q14
$25.6
4Q14
$26.3
1Q15
$22.6
2Q15
$25.7
3Q15
$25.8
‒ Continued strong growth in life sales
 Growth in PMA agent force
‒ Average producing agents up 7%‒ Average producing agents up 7%
 Supplemental health collected
premiums up 9%
Trailing 4-Quarters NAP $99.1 $99.2 $99.8 $100.2 $100.4
CNO Financial Group | 3Q2015 Earnings | October 29, 2015 7
Supplemental Health Collected Premiums $127.1 $133.3 $132.7 $136.1 $138.6
3Q15 Sales and
Di t ib ti R lt
Colonial Penn
Distribution Results
($ millions)
Quarterly NAP
S l 15%
3Q14
1Q15
$21.1
2Q15
$18.5
3Q15
$18.9
 Sales up 15%
‒ Strong growth in Direct Mail and Web
‒ Increased sales conversion
$16.4 4Q14
$14.9 Collected premiums up 8%
 3Q EBIT: $1 million
‒ Maintaining total year EBIT guidance
of $3 - $6 million
Trailing 4-Quarters NAP $63.7 $64.6 $68.9 $70.9 $73.4
$ $ $ $ $
CNO Financial Group | 3Q2015 Earnings | October 29, 2015 8
Collected Premiums $61.9 $61.3 $65.1 $65.1 $66.7
Inforce EBIT $14.9 $11.3 $10.6 $13.3 $14.9
3Q Consolidated Financial Highlights CNO
 Earnings Remain Strong
‒ Operating earnings per diluted share of $0.30*; $0.33* excluding significant items
‒ Operating ROE excluding significant items of 8 7%*‒ Operating ROE excluding significant items of 8.7%
‒ Benefit ratios largely in-line with expectations; 3Q14 results reflected significant favorable
mortality/morbidity
‒ Market volatility impacted Corporate segment resultsMarket volatility impacted Corporate segment results
‒ Continued strong sales growth at Colonial Penn driving increased enterprise value
 Continued Strength in Key Capital Measures
‒ Consolidated Risk-based Capital of 440%
‒ Leverage of 20.2%*
H ldi h d i f $3 4 illi‒ Holding company cash and investments of $354 million
‒ Repurchased $124 million of common stock in the quarter; $311 million repurchased YTD
‒ Maintaining repurchase guidance range of $350 to $425 million
CNO Financial Group | 3Q2015 Earnings | October 29, 2015 9
g g g
* A non-GAAP measure. See the Appendix for a reconciliation to the corresponding GAAP
measure.
($ millions)Segment Earnings CNO
3Q15 EarningsSegment EBIT Excluding Significant Items*
$30.1 $30.2
$29 1
$118.7$119.7
$106.5
$114.7
$106.6
 Bankers Life results reflect build in LTC
future loss reserve, lower Med supp and
annuity margins
$31.5
$29.1
$30.6
annuity margins
 Washington National supplemental
health interest-adjusted benefit ratio
stabilized in the quarter
$4 2
$98.3 $94.5
$82.2
$86.4
$79.8
q
 Colonial Penn results reflect growth in
premiums
 Corporate segment EBIT in line with
$(9.1) $(8.8)
$(1.3)
$(5.0) $(4.4)
$0.4 $2.8
$(5.9)
$4.2 $0.6
3Q14 4Q14 1Q15 2Q15 3Q15
 Corporate segment EBIT in-line with
expectations
CNO Financial Group | 3Q2015 Earnings | October 29, 2015 10
Corporate CP BLC WN
* A non-GAAP measure. See the Appendix for a reconciliation to the corresponding
GAAP measure.
($ millions)Health Margins CNO
3Q15 Highlights & Outlook
Bankers Life Medicare Supplement
$194 $193 $193 $193 $193
70.0% 68 7%
71.5%
 Medicare supplement benefit ratio of 71 5% reflects66.2%
70.0%
67.4% 68.7%
3Q14 4Q14 1Q15 2Q15 3Q15
 Medicare supplement benefit ratio of 71.5% reflects
moderately higher claims experience; YTD results in-
line with expectations
 4Q15 Outlook: Benefit ratio of ~70%
Bankers Life Long-term Care IABR*
3Q14 4Q14 1Q15 2Q15 3Q15
$125 $124 $123 $121 $119
83.0%
84.6%
83.8%  Continued stability in LTC claims and persistency;
IABR* of 83 8% in-line with expectations
Washington National Supplemental Health IABR*
70.5%
77.8%
3Q14 4Q14 1Q15 2Q15 3Q15
IABR of 83.8% in-line with expectations
 4Q15 Outlook: Interest-adjusted benefit ratio of ~84%
$126 $132 $133 $134 $137
56.0%
54.4%
57.6%
65.7%
57.4%
 Supplemental health IABR* of 57.4%, in-line with
expectations
 4Q15 Outlook: Interest-adjusted benefit ratio of ~58%
CNO Financial Group | 3Q2015 Earnings | October 29, 2015 11
3Q14 4Q14 1Q15 2Q15 3Q15
Earned Premium Reported Benefit Ratio
* Interest-adjusted benefit ratio (IABR); a non-GAAP measure. Refer to the Appendix for the
corresponding GAAP measure.
4Q15 Outlook: Interest adjusted benefit ratio of 58%
Investment Results CNO
($ millions)
$ $ $21 956 $22 042
( )
Average Invested Assets and Cash Realized Gains, Losses and Impairments
$12.4
$42.7
$21,687 $21,852 $21,854 $21,956 $22,042
$300.1 $305.4 $300.1 $302.1 $298.2Net
Investment
Income
Gross Realized Gains
Gross Realized Losses
Impairments
$21 3
$30.3
$12 6
$1.3 $7.9
Income
$11.1
$16.8
$13.7
$20.2**
$22.6
$13.2
$23.3 $23.1
$4.2 $4.2
$21.3
$15.4
$12.6
3Q14 4Q14 1Q15 2Q15 3Q15
Earned Yield*: 5.79% 5.83% 5.81% 5.78% 5.68%
New Money Rate: 5.23% 5.01% 5.36% 5.06% 5.21%
Pre-Pay / Call / Make-
h l I $8.6 $8.3 $5.1 $9.9 $5.6
3Q14 4Q14 1Q15 2Q15
$7.1
3Q15
$2.8
whole Income: $8.6 $8.3 $5.1 $9.9 $5.6
 3Q15 new money rate benefited from wider spreads
 Sequential and year over year decline in pre pay/make
 Higher level of realized gains and losses due to tactical
repositioning activity in credit and structured sectors
 Impairments of $12.4 million, largely related to energy sector
CNO Financial Group | 3Q2015 Earnings | October 29, 2015 12
* Earned Yield excludes FHLB.
** Excludes $11.3 million gain on dissolution of variable interest entity.
 Sequential and year-over-year decline in pre-pay/make-
whole income
Impairments of $12.4 million, largely related to energy sector
and Puerto Rico
Bankers Life LTC Update CNO
 Continued progress on rate increases with filings/approvals running ahead of
expectations
 September YTD incurred claims in-line with year-end 2014 loss recognition
testing assumptions
Claims management initiatives showing positive results Claims management initiatives showing positive results
 Accelerated build in future loss reserves (FLR)
 Interest rate environment continues to be a challenge
Anticipate modest improvement to year-end 2015 loss
recognition testing margins
CNO Financial Group | 3Q2015 Earnings | October 29, 2015 13
recognition testing margins
Wrap-up CNO
 Strengthening the foundation of the franchise through
business investments
 Focused on long-term profitable growth
 Continue to explore options to reduce LTC exposure
 CFO search progressingCFO search progressing
 Expect to provide 2016 guidance as part of 4Q15 earnings
callcall
CNO Financial Group | 3Q2015 Earnings | October 29, 2015 14
Questions and Answers
CNO Financial Group | 3Q2015 Earnings | October 29, 2015 15
Appendix
CNO Financial Group | 3Q2015 Earnings | October 29, 2015 16
2015 Sales Guidance CNO
Anticipate consolidated sales growth to be near low end
of guidance of 1% - 3%
N l d f id f fl t t 3%Near low end of guidance of flat to -3%
Near low end of guidance of 3 to 5%
Near high end of guidance of 12 to 15%
CNO Financial Group | 3Q2015 Earnings | October 29, 2015 17
Producing Agent Counts
1st Yr 2nd Yr 3rd Yr + Total Qtr Avg (3) 1st Yr 2nd Yr 3rd Yr + Total Qtr Avg (3)
9/30/2015 2,077 601 1,871 4,549 4,693 411 115 365 891 892
Bankers Life (1) Washington National (2)
, , , ,
6/30/2015 2,484 606 1,891 4,981 4,939 423 132 346 901 882
3/31/2015 2,468 657 1,894 5,019 4,850 344 127 340 811 830
12/31/2014 2,258 664 1,868 4,790 4,842 365 128 337 830 831
9/30/2014 2,233 667 1,822 4,722 4,783 382 134 336 852 835
6/30/2014 2,427 699 1,782 4,908 4,932 377 116 331 824 809
3/31/2014 2,493 714 1,797 5,004 4,875 332 108 315 755 758
12/31/2013 2,557 693 1,718 4,968 5,046 335 112 296 743 756, , , ,
12/31/2012 2,429 662 1,600 4,691 4,850 298 108 269 675 687
12/31/2011 2,461 600 1,587 4,648 4,702
12/31/2010 2,199 668 1,486 4,353 4,391
12/31/2009 2,564 662 1,513 4,739 4,742, , , ,
12/31/2008 2,489 651 1,324 4,464 4,417
12/31/2007 2,198 554 1,231 3,983 4,034
(1) Defined as the number of agents that have sold at least one policy in the period
(2) Defined as active PMA appointed agents with $1,000 or more of New Annualized Premium in the prior 12 months
CNO Financial Group | 3Q2015 Earnings | October 29, 2015 18
( ) pp g $ , p
(3) Agent counts at the end of each month used to calculate the average for the quarter
3Q15 Holding Company Liquidity
CNO($ millions) CNO($ )
3Q15
Cash and Investments Balance - Beginning $385.1
Sources
Net Dividends from Insurance Subsidiaries 64.4
Interest/Earnings on Corporate Investments 4.2
Surplus Debenture Interest 24.2
Service and Investment Fees, Net 27.3
Other 1.3
Total Sources 121.4
UsesUses
Interest 0.6
Share Repurchases 127.3
Financing Costs 0.7
Common Stock Dividend 13.2
Holding Company Expenses and Other 2.7
Total Uses 144.5
Non-cash changes in investment balances (7.9)
CNO Financial Group | 3Q2015 Earnings | October 29, 2015 19
Unrestricted Cash and Investments Balance - 9/30/2015 $354.1
Leveraging Considerable Tax Assets CNO
($ millions)($ millions)
3Q 2015 Loss Carryforwards Outlook and Value
Life
$106
v Expect modest future valuation allowance
releases as taxable income has stabilized
 Annual cash flows are expected to be
d d b $50 illi i 2017 lif
$967
reduced by $50 million in 2017 as life
NOL’s are fully utilized
 Significant non-life NOL’s expire in 2023
Estimated economic value of $475Non-Life
$861
$233*
 Estimated economic value of ~$475
million @ 10% discount rate
Non-Life
Loss Carryforwards Valuation Allowance
CNO Financial Group | 3Q2015 Earnings | October 29, 2015 20
* Excludes $13 million related to net state operating loss carryforwards.
Th t bl b l i th fi i l i t f i ifi t it 3Q2014 t ti i M t b li th t
3Q14 Significant Items CNO
The table below summarizes the financial impact of significant items on our 3Q2014 net operating income. Management believes that
identifying the impact of these items enhances the understanding of our operating results (dollars in millions).
Three months ended
September 30, 2014
Excluding
Net Operating Income:
Bankers Life $ 111.8 $ (13.5) (1) $ 98.3
Washington National (2) 30 1
Actual results Significant items
Excluding
significant
items
27 6 2 5Washington National (2)
Colonial Penn
EBIT from business segments continuing after the CLIC sale
Corporate Operations, excluding corporate interest expense
EBIT from operations continuing after the CLIC sale (11.0) 119.7130.7
139.8 (11.0) 128.8
(9.1) - (9.1)
30.1
0.4 - 0.4
27.6 2.5
EBIT from operations continuing after the CLIC sale
Corporate interest expense
Operating earnings before tax
Tax expense on operating income
Net operating income * $ 76.6 $ (7.1) $ 69.5
(11.0) 119.7
(10.9)
(11.0) 108.8
43.2 (3.9) 39.3
130.7
119.8
(10.9) -
Net operating income per diluted share* $ 0.35 $ (0.03) $ 0.32
(1) Pre-tax earnings in the Bankers Life segment included $11.0 million of favorable reserve developments in Bankers Life's long-term care block (including
$2.8 million of favorable one-time catch-up reserve releases related to the use of a new process to identify changes in the status of our insureds in a more
timely manner) and $2.5 million of favorable reserve developments in the Medicare supplement block.
CNO Financial Group | 3Q2015 Earnings | October 29, 2015 21
(2) Pre-tax earnings in the Washington National segment included $2.5 million of unfavorable premium refunds in the supplemental health block (related to
the same process used on Bankers Life's long-term care block to identify changes in the status of our insureds in a more timely manner).
* A non-GAAP measure. See pages 26 and 28 for a reconciliation to the corresponding GAAP measure.
f f f Q201
4Q14 Significant Items CNO
Three months ended
December 31, 2014
E l di
The table below summarizes the financial impact of the significant items on our 4Q2014 net operating income. Management believes
that identifying the impact of these items enhances the understanding of our operating results (dollars in millions).
Net Operating Income:
Bankers Life $ 103.5 $ (9.0) (1) $ 94.5
Washington National (2)
Actual results Significant items
Excluding
significant
items
20 2 10 0 30 2Washington National (2)
Colonial Penn
EBIT from business segments continuing after the CLIC sale
Corporate Operations, excluding corporate interest expense
EBIT from operations continuing after the CLIC sale
127.5
20.2 10.0 30.2
1.0 118.7
2.8 - 2.8
126.5 1.0
(8.8) - (8.8)
117.7
Corporate interest expense
Operating earnings before tax
Tax expense on operating income
Net operating income * $ 69.1 $ 0.6 $ 69.7
(10.8) - (10.8)
106.9 1.0 107.9
37.8 0.4 38.2
Net operating income per diluted share* $ 0.34 $ - $ 0.34
(2) Pre-tax earnings in the Washington National segment were reduced by $10 million primarily related to the impact of loss recognition on a closed block of payout
(1) Pre-tax earnings in the Bankers Life segment included: (i) $6 million of positive impacts from our comprehensive annual actuarial review including impacts from
model enhancements, net of changes in assumptions related to mortality and long-term interest rates; and (ii) the receipt of a $3 million settlement related to the early
termination in 2013 of a PDP quota-share agreement.
CNO Financial Group | 3Q2015 Earnings | October 29, 2015 22
annuities resulting from changes in assumptions related to long-term interest rates and mortality experience.
* A non-GAAP measure. See pages 26 and 28 for a reconciliation to the corresponding GAAP measure.
f f f 1Q201
1Q15 Significant Items CNO
The table below summarizes the financial impact of the significant item on our 1Q2015 net operating income. Management believes
that identifying the impact of these items enhances the understanding of our operating results (dollars in millions).
Three months ended
March 31, 2015
E l di
Net Operating Income:
Bankers Life $ 82.2 $ - $ 82.2
Washington National (1)
Actual results Significant items
Excluding
significant
items
28 5 3 0 31 5Washington National (1)
Colonial Penn
EBIT from business segments continuing after the CLIC sale
Corporate Operations, excluding corporate interest expense
EBIT from operations continuing after the CLIC sale
107.8
28.5 3.0 31.5
3.0 106.5
(5.9) - (5.9)
104.8 3.0
(1.3) - (1.3)
103.5
Corporate interest expense
Operating earnings before tax
Tax expense on operating income
Net operating income * $ 60.1 $ 1.9 $ 62.0
(10.5) - (10.5)
93.0 3.0 96.0
32.9 1.1 34.0
Net operating income per diluted share* $ 0.30 $ 0.01 $ 0.31
(1) Pre-tax earnings in the Washington National segment included $3 million of unfavorable reserve developments in the supplemental health block related to claims
incurred in prior periods.
CNO Financial Group | 3Q2015 Earnings | October 29, 2015 23
* A non-GAAP measure. See pages 26 and 28 for a reconciliation to the corresponding GAAP measure.
f f f 2Q201
2Q15 Significant Items CNO
The table below summarizes the financial impact of the significant item on our 2Q2015 net operating income. Management believes
that identifying the impact of these items enhances the understanding of our operating results (dollars in millions).
Three months ended
June 30, 2015
E l di
Net Operating Income:
Bankers Life $ 86.4 $ - $ 86.4
Washington National (1)
Actual results Significant items
Excluding
significant
items
20 1 9 0 29 1Washington National (1)
Colonial Penn
EBIT from business segments continuing after the CLIC sale
Corporate Operations, excluding corporate interest expense
EBIT from operations continuing after the CLIC sale
119.7
20.1 9.0 29.1
9.0 114.7
4.2 - 4.2
110.7 9.0
(5.0) - (5.0)
105.7
Corporate interest expense
Operating earnings before tax
Tax expense on operating income
Net operating income * $ 60.8 $ 5.8 $ 66.6
(11.9) - (11.9)
93.8 9.0 102.8
33.0 3.2 36.2
Net operating income per diluted share* $ 0.31 $ 0.03 $ 0.34
(1) Pre-tax earnings in the Washington National segment included $9 million of unfavorable reserve developments in the supplemental health block related to claims
incurred in prior periods.
CNO Financial Group | 3Q2015 Earnings | October 29, 2015 24
* A non-GAAP measure. See pages 26 and 28 for a reconciliation to the corresponding GAAP measure.
f f f 3Q201
3Q15 Significant Items CNO
The table below summarizes the financial impact of the significant item on our 3Q2015 net operating income. Management believes
that identifying the impact of these items enhances the understanding of our operating results (dollars in millions).
Three months ended
September 30, 2015
E l di
Net Operating Income:
Bankers Life $ 79.8 $ - $ 79.8
Washington National 30 6 - 30 6
Actual results Significant items
Excluding
significant
items
Washington National
Colonial Penn
EBIT from business segments continuing after the CLIC sale
Corporate Operations, excluding corporate interest expense (1)
EBIT from operations continuing after the CLIC sale
(11.9) 7.5 (4.4)
99.1 7.5 106.6
0.6 - 0.6
111.0 - 111.0
30.6 - 30.6
Corporate interest expense
Operating earnings before tax
Tax expense on operating income
Net operating income * $ 56.8 $ 7.5 $ 64.3
87.8 7.5 95.3
31.0 - 31.0
(11.3) - (11.3)
Net operating income per diluted share* $ 0.30 $ 0.03 $ 0.33
(1) Pre-tax earnings in the Corporate segment included the impact of current market conditions on the value of investments backing our Company-owned life insurance
("COLI") utilized as a vehicle to fund Bankers Life's agent deferred compensation plan. It should be noted that changes in the value of COLI investments are not subject
to income tax.
CNO Financial Group | 3Q2015 Earnings | October 29, 2015 25
* A non-GAAP measure. See pages 26 and 28 for a reconciliation to the corresponding GAAP measure.
Quarterly Earnings CNOy g
3Q14 4Q14 1Q15 2Q15 3Q15
Bankers Life 111.8$ 103.5$ 82.2$ 86.4$ 79.8$
Washington National 27 6 20 2 28 5 20 1 30 6
($ millions)
Washington National 27.6 20.2 28.5 20.1 30.6
Colonial Penn 0.4 2.8 (5.9) 4.2 0.6
EBIT from business segments continuing after the CLIC sale 139.8 126.5 104.8 110.7 111.0
Corporate operations, excluding interest expense (9.1) (8.8) (1.3) (5.0) (11.9)
EBIT* from operations continuing after the CLIC sale 130.7 117.7 103.5 105.7 99.1
Corporate interest expense (10.9) (10.8) (10.5) (11.9) (11.3)
O ti i b f t 119 8 106 9 93 0 93 8 87 8Operating earnings before taxes 119.8 106.9 93.0 93.8 87.8
Tax expense on period income 43.2 37.8 32.9 33.0 31.0
Net operating income 76.6 69.1 60.1 60.8 56.8
Net loss on sale of CLIC and gain (loss) on reinsurance transactions, including impact of taxes 22.9 2.9 - - -
Net realized investment gains (losses), net of related amortization and taxes 2.6 (2.3) (1.4) (6.8) (12.3)
Fair value changes in embedded derivative liabilities, net of related amortization and taxes - (11.4) (8.3) 16.8 (10.2)
Fair value changes related to the agent deferred compensation plan, net of taxes - (9.8) - - -
Loss on extinguishment of debt, net of taxes - - - (21.3) -
Valuation allowance for deferred tax assets and other tax items 16.8 34.1 - - -
Other (1.5) 1.3 2.4 (2.7) (0.5)
Net income 117.4$ 83.9$ 52.8$ 46.8$ 33.8$
*Management believes that an analysis of earnings before the net loss on sale of CLIC and gain (loss) on reinsurance transactions, net realized investment gains (losses), fair value
changes in embedded derivative liabilities, fair value changes related to the agent deferred compensation plan, loss on extinguishment of debt, other non-operating items, corporate
interest expense and taxes (“EBIT,” a non-GAAP financial measure) provides a clearer comparison of the operating results of the company quarter-over-quarter because it excludes: (1)
the net loss on sale of CLIC and gain (loss) on reinsurance transactions, (2) net realized investment gains (losses); (3) fair value changes due to fluctuations in the interest rates used to
discount embedded derivative liabilities related to our fixed index annuities that are unrelated to the company’s underlying fundamentals; (4) fair value changes related to the agent
deferred compensation plan; (5) loss on extinguishment of debt; (6) charges in the valuation allowance for deferred tax assets; and (7) other non-operating items consisting primarily of
CNO Financial Group | 3Q2015 Earnings | October 29, 2015 26
deferred compensation plan; (5) loss on extinguishment of debt; (6) charges in the valuation allowance for deferred tax assets; and (7) other non operating items consisting primarily of
equity in earnings of certain non-strategic investments and earnings attributable to variable interest entities. The table above provides a reconciliation of EBIT to net income.
Information Related to Certain Non-GAAP Financial Measures
The following provides additional information regarding certain non-GAAP measures used in this presentation.
A non-GAAP measure is a numerical measure of a company’s performance, financial position, or cash flows
that excludes or includes amounts that are normally excluded or included in the most directly comparable
measure calculated and presented in accordance with GAAP. While management believes these measures
are useful to enhance understanding and comparability of our financial results these non-GAAP measuresare useful to enhance understanding and comparability of our financial results, these non-GAAP measures
should not be considered as substitutes for the most directly comparable GAAP measures. Additional
information concerning non-GAAP measures is included in our periodic filings with the Securities and
Exchange Commission that are available in the “Investors – SEC Filings” section of CNO’s website,
www.CNOinc.com.
Operating earnings measures
Management believes that an analysis of net income applicable to common stock before net loss on sale of
CLIC and gain (loss) on reinsurance transactions, net realized gains or losses, fair value changes due to
fluctuations in the interest rates used to discount embedded derivative liabilities related to our fixed index
annuities, fair value changes related to the agent deferred compensation plan, loss on extinguishment of debt,
changes in our valuation allowance for deferred tax assets and other non-operating items consisting primarilychanges in our valuation allowance for deferred tax assets and other non-operating items consisting primarily
of equity in earnings of certain non-strategic investments and earnings attributable to variable interest entities
(“net operating income,” a non-GAAP financial measure) is important to evaluate the performance of the
Company and is a key measure commonly used in the life insurance industry. Management uses this
measure to evaluate performance because these items are unrelated to the Company’s continuing operations.
CNO Financial Group | 3Q2015 Earnings | October 29, 2015 27
Information Related to Certain Non-GAAP Financial Measures
A reconciliation of net income applicable to common stock to net operating income (and related per-share amounts) is as follows
(dollars in millions, except per-share amounts):
3Q14 4Q14 1Q15 2Q15 3Q15
Net income applicable to common stock 117.4$ 83.9$ 52.8$ 46.8$ 33.8$
Net loss on sale of CLIC and gain (loss) on reinsurance transactions (including impact of taxes) (22.9) (2.9) - - -
Net realized investment (gains) losses, net of related amortization and taxes (2.6) 2.3 1.4 6.8 12.3
Fair value changes in embedded derivative liabilities, net of related amortization and taxes - 11.4 8.3 (16.8) 10.2Fair value changes in embedded derivative liabilities, net of related amortization and taxes 11.4 8.3 (16.8) 10.2
Fair value changes related to the agent deferred compensation plan (net of taxes) - 9.8 - - -
Valuation allowance for deferred tax assets and other tax items (16.8) (34.1) - - -
Loss on extinguishment of debt (net of taxes) - - - 21.3 -
Other 1.5 (1.3) (2.4) 2.7 0.5
Net operating income (a non-GAAP financial measure) 76.6$ 69.1$ 60.1$ 60.8$ 56.8$
Per diluted share:
$ $ $ $ $Net income (loss) 0.54$ 0.41$ 0.26$ 0.24$ 0.18$
Net loss on sale of CLIC and gain (loss) on reinsurance transactions (including impact of taxes) (0.11) (0.01) - - -
Net realized investment (gains) losses, net of related amortization and taxes (0.01) 0.01 0.01 0.03 0.07
Fair value changes in embedded derivative liabilities, net of related amortization and taxes - 0.05 0.04 (0.08) 0.05
Fair value changes related to the agent deferred compensation plan (net of taxes) - 0.05 - - -
Valuation allowance for deferred tax assets and other tax items (0.08) (0.17) - - -
Loss on extinguishment of debt (net of taxes) - - - 0.11 -
Other 0.01 - (0.01) 0.01 -
Net operating income (a non-GAAP financial measure) 0.35$ 0.34$ 0.30$ 0.31$ 0.30$
CNO Financial Group | 3Q2015 Earnings | October 29, 2015 28
Information Related to Certain Non-GAAP Financial Measures
A reconciliation of operating income and shares used to calculate basic and diluted operating earnings per share is as
follows (dollars in millions, except per-share amounts, and shares in thousands):
3Q14 4Q14 1Q15 2Q15 3Q15
Operating income 76.6$ 69.1$ 60.1$ 60.8$ 56.8$
Weighted average shares outstanding for basic earnings per share 210,525 204,298 200,491 195,857 190,259
Effect of dilutive securities on weighted average shares:
Stock options, restricted stock and performance units 2,447 2,645 1,784 2,216 2,106
Warrants (a) 2,486 - -
Weighted average shares outstanding for diluted earnings per share 215,458 206,943 202,275 198,073 192,365
Operating earnings per diluted share 0.35$ 0.34$ 0.30$ 0.31$ 0.30$
(a) All outstanding warrants were repurchased in September 2014.
CNO Financial Group | 3Q2015 Earnings | October 29, 2015 29
B k l dil t d h
Information Related to Certain Non-GAAP Financial Measures
Book value per diluted share
Book value per diluted share reflects the potential dilution that could occur if outstanding stock options and warrants were exercised, restricted stock and
performance units were vested and convertible securities were converted. The dilution from options, warrants, restricted shares and performance units is
calculated using the treasury stock method. Under this method, we assume the proceeds from the exercise of the options and warrants (or the unrecognized
compensation expense with respect to restricted stock and performance units) will be used to purchase shares of our common stock at the closing market price
on the last day of the period. In addition, the calculation of this non-GAAP measure differs from the corresponding GAAP measure because accumulated other
comprehensive income (loss) has been excluded from the value of capital used to determine this measure. Management believes this non-GAAP measure is
useful because it removes the volatility that arises from changes in the unrealized appreciation (depreciation) of our investmentsuseful because it removes the volatility that arises from changes in the unrealized appreciation (depreciation) of our investments.
A reconciliation from book value per share to book value per diluted share, excluding accumulated other comprehensive income (loss) is as follows (dollars in
millions, except per share amounts):
3Q14 4Q14 1Q15 2Q15 3Q15
Total shareholders' equity 4,722.0$ 4,688.2$ 4,753.6$ 4,364.2$ 4,171.0$
Shares outstanding for the period 207,640,050 203,324,458 198,631,949 193,467,712 186,741,760
Book value per share 22.74$ 23.06$ 23.93$ 22.56$ 22.34$
Total shareholders' equity 4,722.0$ 4,688.2$ 4,753.6$ 4,364.2$ 4,171.0$
Less accumulated other comprehensive income (859.3) (825.3) (934.2) (605.0) (510.4)
Adjusted shareholders' equity excluding AOCI 3,862.7$ 3,862.9$ 3,819.4$ 3,759.2$ 3,660.6$
Shares outstanding for the period 207,640,050 203,324,458 198,631,949 193,467,712 186,741,760
Dilutive common stock equivalents related to:
Warrants, stock options, restricted stock and performance units 2,406,402 2,645,322 1,857,139 2,243,615 2,176,988
Diluted shares outstanding 210,046,452 205,969,780 200,489,088 195,711,327 188,918,748
Book value per diluted share (a non-GAAP financial measure) 18.39$ 18.75$ 19.05$ 19.21$ 19.38$
CNO Financial Group | 3Q2015 Earnings | October 29, 2015 30
Information Related to Certain Non-GAAP Financial Measures
The interest-adjusted benefit ratio (a non-GAAP measure) is calculated by dividing the product's insurance policy benefits less
imputed interest income on the accumulated assets backing the insurance liabilities by insurance policy income. Interest income is
an important factor in measuring the performance of longer duration health products. The net cash flows generally cause an
accumulation of amounts in the early years of a policy (accounted for as reserve increases), which will be paid out as benefits in
later policy years (accounted for as reserve decreases) Accordingly as the policies age the benefit ratio will typically increase but
Interest-adjusted benefit ratios
later policy years (accounted for as reserve decreases). Accordingly, as the policies age, the benefit ratio will typically increase, but
the increase in the change in reserve will be partially offset by the imputed interest income earned on the accumulated assets. The
interest-adjusted benefit ratio reflects the effects of such interest income offset. Since interest income is an important factor in
measuring the performance of these products, management believes a benefit ratio, which includes the effect of interest income, is
useful in analyzing product performance.
3Q14 4Q14 1Q15 2Q15 3Q15
Bankers Life
Long-term care benefit ratios
Earned premium 125.5$ 124.0$ 122.6$ 120.5$ 119.0$
B fit ti b f i t d i t t i 123 6% 131 8% 137 8% 140 7% 141 1%Benefit ratio before imputed interest income on reserves 123.6% 131.8% 137.8% 140.7% 141.1%
Interest-adjusted benefit ratio 70.5% 77.8% 83.0% 84.6% 83.8%
Underwriting margin (earned premium plus imputed interest income on reserves less policy benefits) 36.9$ 27.6$ 20.8$ 18.6$ 19.3$
Washington National
Supplemental health benefit ratios
Earned premium 125 8$ 132 1$ 132 8$ 134 4$ 136 6$Earned premium 125.8$ 132.1$ 132.8$ 134.4$ 136.6$
Benefit ratio before imputed interest income on reserves 81.9% 79.1% 82.4% 90.3% 81.7%
Interest-adjusted benefit ratio 56.0% 54.4% 57.6% 65.7% 57.4%
Underwriting margin (earned premium plus imputed interest income on reserves less policy benefits) 55.2$ 60.3$ 56.2$ 46.1$ 58.2$
CNO Financial Group | 3Q2015 Earnings | October 29, 2015 31
Information Related to Certain Non-GAAP Financial Measures
Operating return measures
Management believes that an analysis of net income applicable to common stock before the net loss on sale of CLIC
and gain (loss) on reinsurance transactions, the earnings of CLIC prior to being sold, net realized gains or losses, fair
value changes due to fluctuations in the interest rates used to discount embedded derivative liabilities related to our
fixed index annuities, fair value changes related to the agent deferred compensation plan, loss on extinguishment of
d bt h i l ti ll f d f d t t d th ti it i ti i il fdebt, changes in our valuation allowance for deferred tax assets and other non-operating items consisting primarily of
equity in earnings of certain non-strategic investments and earnings attributable to variable interest entities (“net
operating income,” a non-GAAP financial measure) is important to evaluate the performance of the Company and is a
key measure commonly used in the life insurance industry. Management uses this measure to evaluate performance
because these items are unrelated to the Company’s continuing operations.
Management also believes that an operating return, excluding significant items, is important as the impact of these
items enhances the understanding of our operating results.
This non-GAAP financial measure also differs from return on equity because accumulated other comprehensive income
(loss) has been excluded from the value of equity used to determine this ratio. Management believes this non-GAAP
financial measure is useful because it removes the volatility that arises from changes in accumulated other
comprehensive income (loss). Such volatility is often caused by changes in the estimated fair value of our investment
portfolio resulting from changes in general market interest rates rather than the business decisions made by
management.
In addition our equity includes the value of significant net operating loss carryforwards (included in income tax assets)In addition, our equity includes the value of significant net operating loss carryforwards (included in income tax assets).
In accordance with GAAP, these assets are not discounted, and accordingly will not provide a return to shareholders
(until after it is realized as a reduction to taxes that would otherwise be paid). Management believes that excluding this
value from the equity component of this measure enhances the understanding of the effect these non-discounted
assets have on operating returns and the comparability of these measures from period-to-period. Operating return
measures are used in measuring the performance of our business units and are used as a basis for incentive
CNO Financial Group | 3Q2015 Earnings | October 29, 2015 32
measures are used in measuring the performance of our business units and are used as a basis for incentive
compensation.
Information Related to Certain Non-GAAP Financial Measures
Th l l ti f (i) ti t it l di l t d th h i i (l ) d tThe calculations of: (i) operating return on equity, excluding accumulated other comprehensive income (loss) and net
operating loss carryforwards (a non-GAAP financial measure); (ii) operating return, excluding significant items, on
equity, excluding accumulated other comprehensive income (loss) and net operating loss carryforwards (a non-
GAAP financial measure); and (iii) return on equity are as follows (dollars in millions):
Trailing twelve months ended
3Q14 4Q14 1Q15 2Q15 3Q15
Operating income 274.0$ 276.9$ 277.1$ 266.6$ 246.8$
Operating income, excluding significant items 266.8$ 272.3$ 272.5$ 267.8$ 262.6$
Trailing twelve months ended
Net Income 73.5$ 51.4$ 332.2$ 300.9$ 217.3$
Average common equity, excluding accumulated other
comprehensive income (loss) and net operating loss
carryforwards (a non-GAAP financial measure) 3,097.9$ 3,052.1$ 3,029.3$ 3,027.6$ 3,009.4$y ( )
Average common shareholders' equity 4,816.0$ 4,774.6$ 4,746.6$ 4,692.0$ 4,563.1$
Operating return on equity, excluding accumulated other
comprehensive income (loss) and net operating loss
carryforwards (a non-GAAP financial measure) 8.8% 9.1% 9.1% 8.8% 8.2%carryforwards (a non GAAP financial measure) 8.8% 9.1% 9.1% 8.8% 8.2%
Operating return, excluding significant items, on equity, excluding
accumulated other comprehensive income (loss) and net
operating loss carryforwards (a non-GAAP financial measure) 8.6% 8.9% 9.0% 8.8% 8.7%
Return on equity 1.5% 1.1% 7.0% 6.4% 4.8%
CNO Financial Group | 3Q2015 Earnings | October 29, 2015 33
q y
(Continued on next page)
Information Related to Certain Non-GAAP Financial Measures
The following summarizes: (i) operating earnings; (ii) significant items; (iii) operating earnings, excluding significant
items; and (iv) net income (dollars in millions):
Operating
Operating earnings,
earnings, excluding Net
excluding significant income -
Operating Significant significant items - trailing Net trailing
earnings (a) items (b) items four quarters income four quarters
4Q13 66.2$ (2.0)$ 64.2$ -$ 106.0$ -$
1Q14 59.9 1.9 61.8 246.2 (228.0) 238.1
2Q14 71.3 - 71.3 260.1 78.1 239.1
3Q14 76.6 (7.1) 69.5 266.8 117.4 73.5
4Q14 69.1 0.6 69.7 272.3 83.9 51.4
1Q15 60.1 1.9 62.0 272.5 52.8 332.2
2Q15 60 8 5 8 66 6 267 8 46 8 300 92Q15 60.8 5.8 66.6 267.8 46.8 300.9
3Q15 56.8 7.5 64.3 262.6 33.8 217.3
(a) - Operating earnings excludes the results from CLIC prior to being sold.
(b) - The significant items have been discussed in prior press releases.
CNO Financial Group | 3Q2015 Earnings | October 29, 2015 34
(Continued on next page)
Information Related to Certain Non-GAAP Financial Measures
A reconciliation of pretax operating earnings (a non-GAAP financial measure) to net income is as follows (dollars in
millions):
3Q14 4Q14 1Q15 2Q15 3Q15
Twelve months ended
Pretax operating earnings (a non-GAAP financial measure) 422.2$ 427.4$ 428.4$ 413.5$ 381.5$
Income tax (expense) benefit (148.2) (150.5) (151.3) (146.9) (134.7)
Operating return 274.0 276.9 277.1 266.6 246.8
Earnings of CLIC prior to being sold, net of taxes 24.9 15.2 8.5 - -
Net loss on sale of CLIC and gain (loss) on reinsurance transactions,
inculding impact of taxes (335.9) (269.7) 28.3 25.8 2.9
Net realized investment gains, net of related amortization and taxes 32.8 21.4 6.4 (7.9) (22.8)Net realized investment gains, net of related amortization and taxes 32.8 21.4 6.4 (7.9) (22.8)
Fair value changes in embedded derivative liabilities, net of related
amortization and taxes (4.6) (23.4) (24.5) (2.9) (13.1)
Fair value changes related to the agent deferred compensation
plan, net of taxes (7.6) (17.4) (17.4) (9.8) (9.8)
Loss on extinguishment or modification of debt (net of taxes) (0.4) (0.4) (0.4) (21.3) (21.3)
Valuation allowance for deferred tax assets and other tax items 100.1 54.9 54.9 50.9 34.1
Other (9.8) (6.1) (0.7) (0.5) 0.5
CNO Financial Group | 3Q2015 Earnings | October 29, 2015 35
Net income 73.5$ 51.4$ 332.2$ 300.9$ 217.3$
(Continued on next page)
Information Related to Certain Non-GAAP Financial Measures
A reconciliation of consolidated capital, excluding accumulated other comprehensive income (loss) and net operating
loss carryforwards (a non-GAAP financial measure) to common shareholders’ equity, is as follows (dollars in millions):
1Q13 2Q13 3Q13 4Q13
Consolidated capital, excluding accumulated other comprehensive
income (loss) and net operating loss carryforwards
(a non-GAAP financial measure) 3,002.9$ 3,067.6$ 3,181.9$ 3,258.1$
Net operating loss carryforwards 855.0 815.7 970.7 965.3
Accumulated other comprehensive income 1,170.7 698.1 634.0 731.8
Common shareholders' equity 5,028.6$ 4,581.4$ 4,786.6$ 4,955.2$
1Q14 2Q14 3Q14 4Q14
Consolidated capital, excluding accumulated other comprehensive
income (loss) and net operating loss carryforwards
$ $ $ $(a non-GAAP financial measure) 2,996.0$ 3,032.6$ 3,028.0$ 3,045.3$
Net operating loss carryforwards 948.0 885.6 834.7 817.6
Accumulated other comprehensive income 766.2 926.1 859.3 825.3
Common shareholders' equity 4,710.2$ 4,844.3$ 4,722.0$ 4,688.2$
1Q15 2Q15 3Q15
Consolidated capital, excluding accumulated other comprehensive
income (loss) and net operating loss carryforwards
(a non-GAAP financial measure) 3,026.1$ 2,989.7$ 2,924.9$
Net operating loss carryforwards 793.3 769.5 735.7
CNO Financial Group | 3Q2015 Earnings | October 29, 2015 36
Accumulated other comprehensive income 934.2 605.0 510.4
Common shareholders' equity 4,753.6$ 4,364.2$ 4,171.0$
Information Related to Certain Non-GAAP Financial Measures
A reconciliation of consolidated capital, excluding accumulated other comprehensive income (loss) and net operating
loss carryforwards (a non-GAAP financial measure) to common shareholders’ equity, is as follows (dollars in millions):
3Q14 4Q14 1Q15 2Q15 3Q15
Trailing Four Quarter Average
Consolidated capital, excluding accumulated other comprehensive
income (loss) and net operating loss carryforwards
(a non-GAAP financial measure) 3,097.9$ 3,052.1$ 3,029.3$ 3,027.6$ 3,009.4$
Net operating loss carryforwards 925.4 890.0 852.1 818.3 791.4Net operating loss carryforwards 925.4 890.0 852.1 818.3 791.4
Accumulated other comprehensive income 792.7 832.5 865.2 846.1 762.3
Common shareholders' equity 4,816.0$ 4,774.6$ 4,746.6$ 4,692.0$ 4,563.1$
CNO Financial Group | 3Q2015 Earnings | October 29, 2015 37
Information Related to Certain Non-GAAP Financial Measures
Debt to capital ratio, excluding accumulated other comprehensive income (loss)
The debt to capital ratio, excluding accumulated other comprehensive income (loss), differs from the debt to capital ratio because accumulated
other comprehensive income (loss) has been excluded from the value of capital used to determine this measure. Management believes this non-
GAAP financial measure is useful because it removes the volatility that arises from changes in accumulated other comprehensive income (loss).
Such volatility is often caused by changes in the estimated fair value of our investment portfolio resulting from changes in general market interest
rates rather than the business decisions made by management. A reconciliation of these ratios is as follows ($ in millions):
3Q14 4Q14 1Q15 2Q15 3Q15
Corporate notes payable 814.0$ 794.4$ 774.8$ 925.0$ 925.0$
Total shareholders' equity 4,722.0 4,688.2 4,753.6 4,364.2 4,171.0
Total capital 5,536.0$ 5,482.6$ 5,528.4$ 5,289.2$ 5,096.0$
Corporate debt to capital 14.7% 14.5% 14.0% 17.5% 18.2%
Corporate notes payable 814.0$ 794.4$ 774.8$ 925.0$ 925.0$
Total shareholders' equity 4,722.0 4,688.2 4,753.6 4,364.2 4,171.0q y , , , , ,
Less accumulated other comprehensive income (859.3) (825.3) (934.2) (605.0) (510.4)
Total capital 4,676.7$ 4,657.3$ 4,594.2$ 4,684.2$ 4,585.6$
Debt to total capital ratio, excluding AOCI (a
non-GAAP financial measure) 17.4% 17.1% 16.9% 19.7% 20.2%
CNO Financial Group | 3Q2015 Earnings | October 29, 2015 38

CNO Q3 2015 Investor Presentation

  • 1.
    3Q153Q15 Financial and operatingresults for the period ended September 30, 2015 October 29, 2015 Unless otherwise specified, comparisons in this presentation are between 3Q15 and 3Q14.
  • 2.
    Forward-Looking Statements Certain statementsmade in this presentation should be considered forward-looking statements as defined in the Private Securities Litigation Reform Act of 1995. These include statements about future results of operations and capital plans. We caution investors that these forward- looking statements are not guarantees of future performance, and actual results may differ materially. Investors should consider the important risks and uncertainties that may cause actual results to differ, including those included in our press release issued on October 28, 2015, our Quarterly Reports on Form 10-Q, our Annual Report on Form 10-K and th fili k ith th S iti d E h C i i Wother filings we make with the Securities and Exchange Commission. We assume no obligation to update this presentation, which speaks as of today’s date. CNO Financial Group | 3Q2015 Earnings | October 29, 2015 2
  • 3.
    Non-GAAP Measures This presentationcontains the following financial measures that differ from the comparable measures under Generally Accepted Accounting Principles (GAAP): operating earnings measures; book value excluding accumulated other comprehensiveoperating earnings measures; book value, excluding accumulated other comprehensive income (loss) per share; operating return measures; earnings before the net loss on the sale of CLIC and gain (loss) on reinsurance transactions, the earnings of CLIC prior to being sold, net realized investment gains (losses), fair value changes in embedded derivative liabilities, fair value changes related to the agent deferred compensation plan,derivative liabilities, fair value changes related to the agent deferred compensation plan, loss on extinguishment of debt, other non-operating items, corporate interest expense and taxes; and debt to capital ratios, excluding accumulated other comprehensive income (loss). Reconciliations between those non-GAAP measures and the comparable GAAP measures are included in the Appendix, or on the page such measure is presented.measures are included in the Appendix, or on the page such measure is presented. While management believes these measures are useful to enhance understanding and comparability of our financial results, these non-GAAP measures should not be considered substitutes for the most directly comparable GAAP measures. Additional information concerning non-GAAP measures is included in our periodic filings with the Securities and Exchange Commission that are available in the “Investors – SEC Filings” section of CNO’s website, www.CNOinc.com. CNO Financial Group | 3Q2015 Earnings | October 29, 2015 3
  • 4.
    CNO Financial Group| 3Q2015 Earnings | October 29, 2015 4
  • 5.
    CNO3Q15 Summary (amounts inmillions, except per share data) Operating Earnings Per Share Excluding Significant Items* Notable Items  Continued franchise growth ‒ NAP up 1% ‒ Third party product sales up 10% ‒ Policies in-force grew 1% 3Q14 $0.32 3Q15 $0.33 ‒ Policies in-force grew 1% ‒ Collected premium up 7% ‒ Bankers Life annuity account value up 2%  Operating EPS (excluding significant Operating Earnings Excl. Significant Items* $69.5 $64.3 Operating EPS (excluding significant items) up 3%  Returned an additional $138 million to shareholders Weighted Average Shares Outstanding 215.5 192.4  Received A.M. Best upgrade to A- (Excellent) CNO Financial Group | 3Q2015 Earnings | October 29, 2015 5 * A non-GAAP measure. Refer to the Appendix for a reconciliation to the corresponding GAAP measure.
  • 6.
    3Q15 Sales andDistribution Results Bankers Life ($ millions)($ millions) Quarterly NAP* Production results ‒ NAP down 3% - decrease primarily due todo 3% dec ease p a y due o life; partially offset by strong annuity sales ‒ Third party policies sold up 10%  Third party fee income up 16% on a 3Q14 $61.8 4Q14 $73.6 1Q15 $61.6 2Q15 $61.3 3Q15 $59.9 trailing 4-quarter basis  Agent metrics ‒ Average producing agents down 2%g p g g ‒ YTD new recruits down 3%  Collected premiums up 6% Third Party Policies Sold** 2,698 23,993 5,392 4,273 2,980 Trailing 4-Quarters NAP $261.9 $261.6 $260.1 $258.3 $256.4 Collected Premiums $610.0 $659.9 $584.2 $603.9 $648.7 CNO Financial Group | 3Q2015 Earnings | October 29, 2015 6 * Third party sales are excluded from NAP in all periods ** Includes Medicare Advantage, Medicare supplement, PDP, Dental/Vision and ACA products (prior periods have been restated to include ACA product sales) Trailing 4-Quarters Third Party Fee Income, Net $14.3 $15.5 $15.8 $16.4 $16.6
  • 7.
    Washington National3Q15 Salesand Di t ib ti R lt g Distribution Results ($ millions) Quarterly NAP  Sales up 1% ‒ Worksite sales up 10% ‒ Individual sales down 3% 3Q14 $25.6 4Q14 $26.3 1Q15 $22.6 2Q15 $25.7 3Q15 $25.8 ‒ Continued strong growth in life sales  Growth in PMA agent force ‒ Average producing agents up 7%‒ Average producing agents up 7%  Supplemental health collected premiums up 9% Trailing 4-Quarters NAP $99.1 $99.2 $99.8 $100.2 $100.4 CNO Financial Group | 3Q2015 Earnings | October 29, 2015 7 Supplemental Health Collected Premiums $127.1 $133.3 $132.7 $136.1 $138.6
  • 8.
    3Q15 Sales and Dit ib ti R lt Colonial Penn Distribution Results ($ millions) Quarterly NAP S l 15% 3Q14 1Q15 $21.1 2Q15 $18.5 3Q15 $18.9  Sales up 15% ‒ Strong growth in Direct Mail and Web ‒ Increased sales conversion $16.4 4Q14 $14.9 Collected premiums up 8%  3Q EBIT: $1 million ‒ Maintaining total year EBIT guidance of $3 - $6 million Trailing 4-Quarters NAP $63.7 $64.6 $68.9 $70.9 $73.4 $ $ $ $ $ CNO Financial Group | 3Q2015 Earnings | October 29, 2015 8 Collected Premiums $61.9 $61.3 $65.1 $65.1 $66.7 Inforce EBIT $14.9 $11.3 $10.6 $13.3 $14.9
  • 9.
    3Q Consolidated FinancialHighlights CNO  Earnings Remain Strong ‒ Operating earnings per diluted share of $0.30*; $0.33* excluding significant items ‒ Operating ROE excluding significant items of 8 7%*‒ Operating ROE excluding significant items of 8.7% ‒ Benefit ratios largely in-line with expectations; 3Q14 results reflected significant favorable mortality/morbidity ‒ Market volatility impacted Corporate segment resultsMarket volatility impacted Corporate segment results ‒ Continued strong sales growth at Colonial Penn driving increased enterprise value  Continued Strength in Key Capital Measures ‒ Consolidated Risk-based Capital of 440% ‒ Leverage of 20.2%* H ldi h d i f $3 4 illi‒ Holding company cash and investments of $354 million ‒ Repurchased $124 million of common stock in the quarter; $311 million repurchased YTD ‒ Maintaining repurchase guidance range of $350 to $425 million CNO Financial Group | 3Q2015 Earnings | October 29, 2015 9 g g g * A non-GAAP measure. See the Appendix for a reconciliation to the corresponding GAAP measure.
  • 10.
    ($ millions)Segment EarningsCNO 3Q15 EarningsSegment EBIT Excluding Significant Items* $30.1 $30.2 $29 1 $118.7$119.7 $106.5 $114.7 $106.6  Bankers Life results reflect build in LTC future loss reserve, lower Med supp and annuity margins $31.5 $29.1 $30.6 annuity margins  Washington National supplemental health interest-adjusted benefit ratio stabilized in the quarter $4 2 $98.3 $94.5 $82.2 $86.4 $79.8 q  Colonial Penn results reflect growth in premiums  Corporate segment EBIT in line with $(9.1) $(8.8) $(1.3) $(5.0) $(4.4) $0.4 $2.8 $(5.9) $4.2 $0.6 3Q14 4Q14 1Q15 2Q15 3Q15  Corporate segment EBIT in-line with expectations CNO Financial Group | 3Q2015 Earnings | October 29, 2015 10 Corporate CP BLC WN * A non-GAAP measure. See the Appendix for a reconciliation to the corresponding GAAP measure.
  • 11.
    ($ millions)Health MarginsCNO 3Q15 Highlights & Outlook Bankers Life Medicare Supplement $194 $193 $193 $193 $193 70.0% 68 7% 71.5%  Medicare supplement benefit ratio of 71 5% reflects66.2% 70.0% 67.4% 68.7% 3Q14 4Q14 1Q15 2Q15 3Q15  Medicare supplement benefit ratio of 71.5% reflects moderately higher claims experience; YTD results in- line with expectations  4Q15 Outlook: Benefit ratio of ~70% Bankers Life Long-term Care IABR* 3Q14 4Q14 1Q15 2Q15 3Q15 $125 $124 $123 $121 $119 83.0% 84.6% 83.8%  Continued stability in LTC claims and persistency; IABR* of 83 8% in-line with expectations Washington National Supplemental Health IABR* 70.5% 77.8% 3Q14 4Q14 1Q15 2Q15 3Q15 IABR of 83.8% in-line with expectations  4Q15 Outlook: Interest-adjusted benefit ratio of ~84% $126 $132 $133 $134 $137 56.0% 54.4% 57.6% 65.7% 57.4%  Supplemental health IABR* of 57.4%, in-line with expectations  4Q15 Outlook: Interest-adjusted benefit ratio of ~58% CNO Financial Group | 3Q2015 Earnings | October 29, 2015 11 3Q14 4Q14 1Q15 2Q15 3Q15 Earned Premium Reported Benefit Ratio * Interest-adjusted benefit ratio (IABR); a non-GAAP measure. Refer to the Appendix for the corresponding GAAP measure. 4Q15 Outlook: Interest adjusted benefit ratio of 58%
  • 12.
    Investment Results CNO ($millions) $ $ $21 956 $22 042 ( ) Average Invested Assets and Cash Realized Gains, Losses and Impairments $12.4 $42.7 $21,687 $21,852 $21,854 $21,956 $22,042 $300.1 $305.4 $300.1 $302.1 $298.2Net Investment Income Gross Realized Gains Gross Realized Losses Impairments $21 3 $30.3 $12 6 $1.3 $7.9 Income $11.1 $16.8 $13.7 $20.2** $22.6 $13.2 $23.3 $23.1 $4.2 $4.2 $21.3 $15.4 $12.6 3Q14 4Q14 1Q15 2Q15 3Q15 Earned Yield*: 5.79% 5.83% 5.81% 5.78% 5.68% New Money Rate: 5.23% 5.01% 5.36% 5.06% 5.21% Pre-Pay / Call / Make- h l I $8.6 $8.3 $5.1 $9.9 $5.6 3Q14 4Q14 1Q15 2Q15 $7.1 3Q15 $2.8 whole Income: $8.6 $8.3 $5.1 $9.9 $5.6  3Q15 new money rate benefited from wider spreads  Sequential and year over year decline in pre pay/make  Higher level of realized gains and losses due to tactical repositioning activity in credit and structured sectors  Impairments of $12.4 million, largely related to energy sector CNO Financial Group | 3Q2015 Earnings | October 29, 2015 12 * Earned Yield excludes FHLB. ** Excludes $11.3 million gain on dissolution of variable interest entity.  Sequential and year-over-year decline in pre-pay/make- whole income Impairments of $12.4 million, largely related to energy sector and Puerto Rico
  • 13.
    Bankers Life LTCUpdate CNO  Continued progress on rate increases with filings/approvals running ahead of expectations  September YTD incurred claims in-line with year-end 2014 loss recognition testing assumptions Claims management initiatives showing positive results Claims management initiatives showing positive results  Accelerated build in future loss reserves (FLR)  Interest rate environment continues to be a challenge Anticipate modest improvement to year-end 2015 loss recognition testing margins CNO Financial Group | 3Q2015 Earnings | October 29, 2015 13 recognition testing margins
  • 14.
    Wrap-up CNO  Strengtheningthe foundation of the franchise through business investments  Focused on long-term profitable growth  Continue to explore options to reduce LTC exposure  CFO search progressingCFO search progressing  Expect to provide 2016 guidance as part of 4Q15 earnings callcall CNO Financial Group | 3Q2015 Earnings | October 29, 2015 14
  • 15.
    Questions and Answers CNOFinancial Group | 3Q2015 Earnings | October 29, 2015 15
  • 16.
    Appendix CNO Financial Group| 3Q2015 Earnings | October 29, 2015 16
  • 17.
    2015 Sales GuidanceCNO Anticipate consolidated sales growth to be near low end of guidance of 1% - 3% N l d f id f fl t t 3%Near low end of guidance of flat to -3% Near low end of guidance of 3 to 5% Near high end of guidance of 12 to 15% CNO Financial Group | 3Q2015 Earnings | October 29, 2015 17
  • 18.
    Producing Agent Counts 1stYr 2nd Yr 3rd Yr + Total Qtr Avg (3) 1st Yr 2nd Yr 3rd Yr + Total Qtr Avg (3) 9/30/2015 2,077 601 1,871 4,549 4,693 411 115 365 891 892 Bankers Life (1) Washington National (2) , , , , 6/30/2015 2,484 606 1,891 4,981 4,939 423 132 346 901 882 3/31/2015 2,468 657 1,894 5,019 4,850 344 127 340 811 830 12/31/2014 2,258 664 1,868 4,790 4,842 365 128 337 830 831 9/30/2014 2,233 667 1,822 4,722 4,783 382 134 336 852 835 6/30/2014 2,427 699 1,782 4,908 4,932 377 116 331 824 809 3/31/2014 2,493 714 1,797 5,004 4,875 332 108 315 755 758 12/31/2013 2,557 693 1,718 4,968 5,046 335 112 296 743 756, , , , 12/31/2012 2,429 662 1,600 4,691 4,850 298 108 269 675 687 12/31/2011 2,461 600 1,587 4,648 4,702 12/31/2010 2,199 668 1,486 4,353 4,391 12/31/2009 2,564 662 1,513 4,739 4,742, , , , 12/31/2008 2,489 651 1,324 4,464 4,417 12/31/2007 2,198 554 1,231 3,983 4,034 (1) Defined as the number of agents that have sold at least one policy in the period (2) Defined as active PMA appointed agents with $1,000 or more of New Annualized Premium in the prior 12 months CNO Financial Group | 3Q2015 Earnings | October 29, 2015 18 ( ) pp g $ , p (3) Agent counts at the end of each month used to calculate the average for the quarter
  • 19.
    3Q15 Holding CompanyLiquidity CNO($ millions) CNO($ ) 3Q15 Cash and Investments Balance - Beginning $385.1 Sources Net Dividends from Insurance Subsidiaries 64.4 Interest/Earnings on Corporate Investments 4.2 Surplus Debenture Interest 24.2 Service and Investment Fees, Net 27.3 Other 1.3 Total Sources 121.4 UsesUses Interest 0.6 Share Repurchases 127.3 Financing Costs 0.7 Common Stock Dividend 13.2 Holding Company Expenses and Other 2.7 Total Uses 144.5 Non-cash changes in investment balances (7.9) CNO Financial Group | 3Q2015 Earnings | October 29, 2015 19 Unrestricted Cash and Investments Balance - 9/30/2015 $354.1
  • 20.
    Leveraging Considerable TaxAssets CNO ($ millions)($ millions) 3Q 2015 Loss Carryforwards Outlook and Value Life $106 v Expect modest future valuation allowance releases as taxable income has stabilized  Annual cash flows are expected to be d d b $50 illi i 2017 lif $967 reduced by $50 million in 2017 as life NOL’s are fully utilized  Significant non-life NOL’s expire in 2023 Estimated economic value of $475Non-Life $861 $233*  Estimated economic value of ~$475 million @ 10% discount rate Non-Life Loss Carryforwards Valuation Allowance CNO Financial Group | 3Q2015 Earnings | October 29, 2015 20 * Excludes $13 million related to net state operating loss carryforwards.
  • 21.
    Th t blb l i th fi i l i t f i ifi t it 3Q2014 t ti i M t b li th t 3Q14 Significant Items CNO The table below summarizes the financial impact of significant items on our 3Q2014 net operating income. Management believes that identifying the impact of these items enhances the understanding of our operating results (dollars in millions). Three months ended September 30, 2014 Excluding Net Operating Income: Bankers Life $ 111.8 $ (13.5) (1) $ 98.3 Washington National (2) 30 1 Actual results Significant items Excluding significant items 27 6 2 5Washington National (2) Colonial Penn EBIT from business segments continuing after the CLIC sale Corporate Operations, excluding corporate interest expense EBIT from operations continuing after the CLIC sale (11.0) 119.7130.7 139.8 (11.0) 128.8 (9.1) - (9.1) 30.1 0.4 - 0.4 27.6 2.5 EBIT from operations continuing after the CLIC sale Corporate interest expense Operating earnings before tax Tax expense on operating income Net operating income * $ 76.6 $ (7.1) $ 69.5 (11.0) 119.7 (10.9) (11.0) 108.8 43.2 (3.9) 39.3 130.7 119.8 (10.9) - Net operating income per diluted share* $ 0.35 $ (0.03) $ 0.32 (1) Pre-tax earnings in the Bankers Life segment included $11.0 million of favorable reserve developments in Bankers Life's long-term care block (including $2.8 million of favorable one-time catch-up reserve releases related to the use of a new process to identify changes in the status of our insureds in a more timely manner) and $2.5 million of favorable reserve developments in the Medicare supplement block. CNO Financial Group | 3Q2015 Earnings | October 29, 2015 21 (2) Pre-tax earnings in the Washington National segment included $2.5 million of unfavorable premium refunds in the supplemental health block (related to the same process used on Bankers Life's long-term care block to identify changes in the status of our insureds in a more timely manner). * A non-GAAP measure. See pages 26 and 28 for a reconciliation to the corresponding GAAP measure.
  • 22.
    f f fQ201 4Q14 Significant Items CNO Three months ended December 31, 2014 E l di The table below summarizes the financial impact of the significant items on our 4Q2014 net operating income. Management believes that identifying the impact of these items enhances the understanding of our operating results (dollars in millions). Net Operating Income: Bankers Life $ 103.5 $ (9.0) (1) $ 94.5 Washington National (2) Actual results Significant items Excluding significant items 20 2 10 0 30 2Washington National (2) Colonial Penn EBIT from business segments continuing after the CLIC sale Corporate Operations, excluding corporate interest expense EBIT from operations continuing after the CLIC sale 127.5 20.2 10.0 30.2 1.0 118.7 2.8 - 2.8 126.5 1.0 (8.8) - (8.8) 117.7 Corporate interest expense Operating earnings before tax Tax expense on operating income Net operating income * $ 69.1 $ 0.6 $ 69.7 (10.8) - (10.8) 106.9 1.0 107.9 37.8 0.4 38.2 Net operating income per diluted share* $ 0.34 $ - $ 0.34 (2) Pre-tax earnings in the Washington National segment were reduced by $10 million primarily related to the impact of loss recognition on a closed block of payout (1) Pre-tax earnings in the Bankers Life segment included: (i) $6 million of positive impacts from our comprehensive annual actuarial review including impacts from model enhancements, net of changes in assumptions related to mortality and long-term interest rates; and (ii) the receipt of a $3 million settlement related to the early termination in 2013 of a PDP quota-share agreement. CNO Financial Group | 3Q2015 Earnings | October 29, 2015 22 annuities resulting from changes in assumptions related to long-term interest rates and mortality experience. * A non-GAAP measure. See pages 26 and 28 for a reconciliation to the corresponding GAAP measure.
  • 23.
    f f f1Q201 1Q15 Significant Items CNO The table below summarizes the financial impact of the significant item on our 1Q2015 net operating income. Management believes that identifying the impact of these items enhances the understanding of our operating results (dollars in millions). Three months ended March 31, 2015 E l di Net Operating Income: Bankers Life $ 82.2 $ - $ 82.2 Washington National (1) Actual results Significant items Excluding significant items 28 5 3 0 31 5Washington National (1) Colonial Penn EBIT from business segments continuing after the CLIC sale Corporate Operations, excluding corporate interest expense EBIT from operations continuing after the CLIC sale 107.8 28.5 3.0 31.5 3.0 106.5 (5.9) - (5.9) 104.8 3.0 (1.3) - (1.3) 103.5 Corporate interest expense Operating earnings before tax Tax expense on operating income Net operating income * $ 60.1 $ 1.9 $ 62.0 (10.5) - (10.5) 93.0 3.0 96.0 32.9 1.1 34.0 Net operating income per diluted share* $ 0.30 $ 0.01 $ 0.31 (1) Pre-tax earnings in the Washington National segment included $3 million of unfavorable reserve developments in the supplemental health block related to claims incurred in prior periods. CNO Financial Group | 3Q2015 Earnings | October 29, 2015 23 * A non-GAAP measure. See pages 26 and 28 for a reconciliation to the corresponding GAAP measure.
  • 24.
    f f f2Q201 2Q15 Significant Items CNO The table below summarizes the financial impact of the significant item on our 2Q2015 net operating income. Management believes that identifying the impact of these items enhances the understanding of our operating results (dollars in millions). Three months ended June 30, 2015 E l di Net Operating Income: Bankers Life $ 86.4 $ - $ 86.4 Washington National (1) Actual results Significant items Excluding significant items 20 1 9 0 29 1Washington National (1) Colonial Penn EBIT from business segments continuing after the CLIC sale Corporate Operations, excluding corporate interest expense EBIT from operations continuing after the CLIC sale 119.7 20.1 9.0 29.1 9.0 114.7 4.2 - 4.2 110.7 9.0 (5.0) - (5.0) 105.7 Corporate interest expense Operating earnings before tax Tax expense on operating income Net operating income * $ 60.8 $ 5.8 $ 66.6 (11.9) - (11.9) 93.8 9.0 102.8 33.0 3.2 36.2 Net operating income per diluted share* $ 0.31 $ 0.03 $ 0.34 (1) Pre-tax earnings in the Washington National segment included $9 million of unfavorable reserve developments in the supplemental health block related to claims incurred in prior periods. CNO Financial Group | 3Q2015 Earnings | October 29, 2015 24 * A non-GAAP measure. See pages 26 and 28 for a reconciliation to the corresponding GAAP measure.
  • 25.
    f f f3Q201 3Q15 Significant Items CNO The table below summarizes the financial impact of the significant item on our 3Q2015 net operating income. Management believes that identifying the impact of these items enhances the understanding of our operating results (dollars in millions). Three months ended September 30, 2015 E l di Net Operating Income: Bankers Life $ 79.8 $ - $ 79.8 Washington National 30 6 - 30 6 Actual results Significant items Excluding significant items Washington National Colonial Penn EBIT from business segments continuing after the CLIC sale Corporate Operations, excluding corporate interest expense (1) EBIT from operations continuing after the CLIC sale (11.9) 7.5 (4.4) 99.1 7.5 106.6 0.6 - 0.6 111.0 - 111.0 30.6 - 30.6 Corporate interest expense Operating earnings before tax Tax expense on operating income Net operating income * $ 56.8 $ 7.5 $ 64.3 87.8 7.5 95.3 31.0 - 31.0 (11.3) - (11.3) Net operating income per diluted share* $ 0.30 $ 0.03 $ 0.33 (1) Pre-tax earnings in the Corporate segment included the impact of current market conditions on the value of investments backing our Company-owned life insurance ("COLI") utilized as a vehicle to fund Bankers Life's agent deferred compensation plan. It should be noted that changes in the value of COLI investments are not subject to income tax. CNO Financial Group | 3Q2015 Earnings | October 29, 2015 25 * A non-GAAP measure. See pages 26 and 28 for a reconciliation to the corresponding GAAP measure.
  • 26.
    Quarterly Earnings CNOyg 3Q14 4Q14 1Q15 2Q15 3Q15 Bankers Life 111.8$ 103.5$ 82.2$ 86.4$ 79.8$ Washington National 27 6 20 2 28 5 20 1 30 6 ($ millions) Washington National 27.6 20.2 28.5 20.1 30.6 Colonial Penn 0.4 2.8 (5.9) 4.2 0.6 EBIT from business segments continuing after the CLIC sale 139.8 126.5 104.8 110.7 111.0 Corporate operations, excluding interest expense (9.1) (8.8) (1.3) (5.0) (11.9) EBIT* from operations continuing after the CLIC sale 130.7 117.7 103.5 105.7 99.1 Corporate interest expense (10.9) (10.8) (10.5) (11.9) (11.3) O ti i b f t 119 8 106 9 93 0 93 8 87 8Operating earnings before taxes 119.8 106.9 93.0 93.8 87.8 Tax expense on period income 43.2 37.8 32.9 33.0 31.0 Net operating income 76.6 69.1 60.1 60.8 56.8 Net loss on sale of CLIC and gain (loss) on reinsurance transactions, including impact of taxes 22.9 2.9 - - - Net realized investment gains (losses), net of related amortization and taxes 2.6 (2.3) (1.4) (6.8) (12.3) Fair value changes in embedded derivative liabilities, net of related amortization and taxes - (11.4) (8.3) 16.8 (10.2) Fair value changes related to the agent deferred compensation plan, net of taxes - (9.8) - - - Loss on extinguishment of debt, net of taxes - - - (21.3) - Valuation allowance for deferred tax assets and other tax items 16.8 34.1 - - - Other (1.5) 1.3 2.4 (2.7) (0.5) Net income 117.4$ 83.9$ 52.8$ 46.8$ 33.8$ *Management believes that an analysis of earnings before the net loss on sale of CLIC and gain (loss) on reinsurance transactions, net realized investment gains (losses), fair value changes in embedded derivative liabilities, fair value changes related to the agent deferred compensation plan, loss on extinguishment of debt, other non-operating items, corporate interest expense and taxes (“EBIT,” a non-GAAP financial measure) provides a clearer comparison of the operating results of the company quarter-over-quarter because it excludes: (1) the net loss on sale of CLIC and gain (loss) on reinsurance transactions, (2) net realized investment gains (losses); (3) fair value changes due to fluctuations in the interest rates used to discount embedded derivative liabilities related to our fixed index annuities that are unrelated to the company’s underlying fundamentals; (4) fair value changes related to the agent deferred compensation plan; (5) loss on extinguishment of debt; (6) charges in the valuation allowance for deferred tax assets; and (7) other non-operating items consisting primarily of CNO Financial Group | 3Q2015 Earnings | October 29, 2015 26 deferred compensation plan; (5) loss on extinguishment of debt; (6) charges in the valuation allowance for deferred tax assets; and (7) other non operating items consisting primarily of equity in earnings of certain non-strategic investments and earnings attributable to variable interest entities. The table above provides a reconciliation of EBIT to net income.
  • 27.
    Information Related toCertain Non-GAAP Financial Measures The following provides additional information regarding certain non-GAAP measures used in this presentation. A non-GAAP measure is a numerical measure of a company’s performance, financial position, or cash flows that excludes or includes amounts that are normally excluded or included in the most directly comparable measure calculated and presented in accordance with GAAP. While management believes these measures are useful to enhance understanding and comparability of our financial results these non-GAAP measuresare useful to enhance understanding and comparability of our financial results, these non-GAAP measures should not be considered as substitutes for the most directly comparable GAAP measures. Additional information concerning non-GAAP measures is included in our periodic filings with the Securities and Exchange Commission that are available in the “Investors – SEC Filings” section of CNO’s website, www.CNOinc.com. Operating earnings measures Management believes that an analysis of net income applicable to common stock before net loss on sale of CLIC and gain (loss) on reinsurance transactions, net realized gains or losses, fair value changes due to fluctuations in the interest rates used to discount embedded derivative liabilities related to our fixed index annuities, fair value changes related to the agent deferred compensation plan, loss on extinguishment of debt, changes in our valuation allowance for deferred tax assets and other non-operating items consisting primarilychanges in our valuation allowance for deferred tax assets and other non-operating items consisting primarily of equity in earnings of certain non-strategic investments and earnings attributable to variable interest entities (“net operating income,” a non-GAAP financial measure) is important to evaluate the performance of the Company and is a key measure commonly used in the life insurance industry. Management uses this measure to evaluate performance because these items are unrelated to the Company’s continuing operations. CNO Financial Group | 3Q2015 Earnings | October 29, 2015 27
  • 28.
    Information Related toCertain Non-GAAP Financial Measures A reconciliation of net income applicable to common stock to net operating income (and related per-share amounts) is as follows (dollars in millions, except per-share amounts): 3Q14 4Q14 1Q15 2Q15 3Q15 Net income applicable to common stock 117.4$ 83.9$ 52.8$ 46.8$ 33.8$ Net loss on sale of CLIC and gain (loss) on reinsurance transactions (including impact of taxes) (22.9) (2.9) - - - Net realized investment (gains) losses, net of related amortization and taxes (2.6) 2.3 1.4 6.8 12.3 Fair value changes in embedded derivative liabilities, net of related amortization and taxes - 11.4 8.3 (16.8) 10.2Fair value changes in embedded derivative liabilities, net of related amortization and taxes 11.4 8.3 (16.8) 10.2 Fair value changes related to the agent deferred compensation plan (net of taxes) - 9.8 - - - Valuation allowance for deferred tax assets and other tax items (16.8) (34.1) - - - Loss on extinguishment of debt (net of taxes) - - - 21.3 - Other 1.5 (1.3) (2.4) 2.7 0.5 Net operating income (a non-GAAP financial measure) 76.6$ 69.1$ 60.1$ 60.8$ 56.8$ Per diluted share: $ $ $ $ $Net income (loss) 0.54$ 0.41$ 0.26$ 0.24$ 0.18$ Net loss on sale of CLIC and gain (loss) on reinsurance transactions (including impact of taxes) (0.11) (0.01) - - - Net realized investment (gains) losses, net of related amortization and taxes (0.01) 0.01 0.01 0.03 0.07 Fair value changes in embedded derivative liabilities, net of related amortization and taxes - 0.05 0.04 (0.08) 0.05 Fair value changes related to the agent deferred compensation plan (net of taxes) - 0.05 - - - Valuation allowance for deferred tax assets and other tax items (0.08) (0.17) - - - Loss on extinguishment of debt (net of taxes) - - - 0.11 - Other 0.01 - (0.01) 0.01 - Net operating income (a non-GAAP financial measure) 0.35$ 0.34$ 0.30$ 0.31$ 0.30$ CNO Financial Group | 3Q2015 Earnings | October 29, 2015 28
  • 29.
    Information Related toCertain Non-GAAP Financial Measures A reconciliation of operating income and shares used to calculate basic and diluted operating earnings per share is as follows (dollars in millions, except per-share amounts, and shares in thousands): 3Q14 4Q14 1Q15 2Q15 3Q15 Operating income 76.6$ 69.1$ 60.1$ 60.8$ 56.8$ Weighted average shares outstanding for basic earnings per share 210,525 204,298 200,491 195,857 190,259 Effect of dilutive securities on weighted average shares: Stock options, restricted stock and performance units 2,447 2,645 1,784 2,216 2,106 Warrants (a) 2,486 - - Weighted average shares outstanding for diluted earnings per share 215,458 206,943 202,275 198,073 192,365 Operating earnings per diluted share 0.35$ 0.34$ 0.30$ 0.31$ 0.30$ (a) All outstanding warrants were repurchased in September 2014. CNO Financial Group | 3Q2015 Earnings | October 29, 2015 29
  • 30.
    B k ldil t d h Information Related to Certain Non-GAAP Financial Measures Book value per diluted share Book value per diluted share reflects the potential dilution that could occur if outstanding stock options and warrants were exercised, restricted stock and performance units were vested and convertible securities were converted. The dilution from options, warrants, restricted shares and performance units is calculated using the treasury stock method. Under this method, we assume the proceeds from the exercise of the options and warrants (or the unrecognized compensation expense with respect to restricted stock and performance units) will be used to purchase shares of our common stock at the closing market price on the last day of the period. In addition, the calculation of this non-GAAP measure differs from the corresponding GAAP measure because accumulated other comprehensive income (loss) has been excluded from the value of capital used to determine this measure. Management believes this non-GAAP measure is useful because it removes the volatility that arises from changes in the unrealized appreciation (depreciation) of our investmentsuseful because it removes the volatility that arises from changes in the unrealized appreciation (depreciation) of our investments. A reconciliation from book value per share to book value per diluted share, excluding accumulated other comprehensive income (loss) is as follows (dollars in millions, except per share amounts): 3Q14 4Q14 1Q15 2Q15 3Q15 Total shareholders' equity 4,722.0$ 4,688.2$ 4,753.6$ 4,364.2$ 4,171.0$ Shares outstanding for the period 207,640,050 203,324,458 198,631,949 193,467,712 186,741,760 Book value per share 22.74$ 23.06$ 23.93$ 22.56$ 22.34$ Total shareholders' equity 4,722.0$ 4,688.2$ 4,753.6$ 4,364.2$ 4,171.0$ Less accumulated other comprehensive income (859.3) (825.3) (934.2) (605.0) (510.4) Adjusted shareholders' equity excluding AOCI 3,862.7$ 3,862.9$ 3,819.4$ 3,759.2$ 3,660.6$ Shares outstanding for the period 207,640,050 203,324,458 198,631,949 193,467,712 186,741,760 Dilutive common stock equivalents related to: Warrants, stock options, restricted stock and performance units 2,406,402 2,645,322 1,857,139 2,243,615 2,176,988 Diluted shares outstanding 210,046,452 205,969,780 200,489,088 195,711,327 188,918,748 Book value per diluted share (a non-GAAP financial measure) 18.39$ 18.75$ 19.05$ 19.21$ 19.38$ CNO Financial Group | 3Q2015 Earnings | October 29, 2015 30
  • 31.
    Information Related toCertain Non-GAAP Financial Measures The interest-adjusted benefit ratio (a non-GAAP measure) is calculated by dividing the product's insurance policy benefits less imputed interest income on the accumulated assets backing the insurance liabilities by insurance policy income. Interest income is an important factor in measuring the performance of longer duration health products. The net cash flows generally cause an accumulation of amounts in the early years of a policy (accounted for as reserve increases), which will be paid out as benefits in later policy years (accounted for as reserve decreases) Accordingly as the policies age the benefit ratio will typically increase but Interest-adjusted benefit ratios later policy years (accounted for as reserve decreases). Accordingly, as the policies age, the benefit ratio will typically increase, but the increase in the change in reserve will be partially offset by the imputed interest income earned on the accumulated assets. The interest-adjusted benefit ratio reflects the effects of such interest income offset. Since interest income is an important factor in measuring the performance of these products, management believes a benefit ratio, which includes the effect of interest income, is useful in analyzing product performance. 3Q14 4Q14 1Q15 2Q15 3Q15 Bankers Life Long-term care benefit ratios Earned premium 125.5$ 124.0$ 122.6$ 120.5$ 119.0$ B fit ti b f i t d i t t i 123 6% 131 8% 137 8% 140 7% 141 1%Benefit ratio before imputed interest income on reserves 123.6% 131.8% 137.8% 140.7% 141.1% Interest-adjusted benefit ratio 70.5% 77.8% 83.0% 84.6% 83.8% Underwriting margin (earned premium plus imputed interest income on reserves less policy benefits) 36.9$ 27.6$ 20.8$ 18.6$ 19.3$ Washington National Supplemental health benefit ratios Earned premium 125 8$ 132 1$ 132 8$ 134 4$ 136 6$Earned premium 125.8$ 132.1$ 132.8$ 134.4$ 136.6$ Benefit ratio before imputed interest income on reserves 81.9% 79.1% 82.4% 90.3% 81.7% Interest-adjusted benefit ratio 56.0% 54.4% 57.6% 65.7% 57.4% Underwriting margin (earned premium plus imputed interest income on reserves less policy benefits) 55.2$ 60.3$ 56.2$ 46.1$ 58.2$ CNO Financial Group | 3Q2015 Earnings | October 29, 2015 31
  • 32.
    Information Related toCertain Non-GAAP Financial Measures Operating return measures Management believes that an analysis of net income applicable to common stock before the net loss on sale of CLIC and gain (loss) on reinsurance transactions, the earnings of CLIC prior to being sold, net realized gains or losses, fair value changes due to fluctuations in the interest rates used to discount embedded derivative liabilities related to our fixed index annuities, fair value changes related to the agent deferred compensation plan, loss on extinguishment of d bt h i l ti ll f d f d t t d th ti it i ti i il fdebt, changes in our valuation allowance for deferred tax assets and other non-operating items consisting primarily of equity in earnings of certain non-strategic investments and earnings attributable to variable interest entities (“net operating income,” a non-GAAP financial measure) is important to evaluate the performance of the Company and is a key measure commonly used in the life insurance industry. Management uses this measure to evaluate performance because these items are unrelated to the Company’s continuing operations. Management also believes that an operating return, excluding significant items, is important as the impact of these items enhances the understanding of our operating results. This non-GAAP financial measure also differs from return on equity because accumulated other comprehensive income (loss) has been excluded from the value of equity used to determine this ratio. Management believes this non-GAAP financial measure is useful because it removes the volatility that arises from changes in accumulated other comprehensive income (loss). Such volatility is often caused by changes in the estimated fair value of our investment portfolio resulting from changes in general market interest rates rather than the business decisions made by management. In addition our equity includes the value of significant net operating loss carryforwards (included in income tax assets)In addition, our equity includes the value of significant net operating loss carryforwards (included in income tax assets). In accordance with GAAP, these assets are not discounted, and accordingly will not provide a return to shareholders (until after it is realized as a reduction to taxes that would otherwise be paid). Management believes that excluding this value from the equity component of this measure enhances the understanding of the effect these non-discounted assets have on operating returns and the comparability of these measures from period-to-period. Operating return measures are used in measuring the performance of our business units and are used as a basis for incentive CNO Financial Group | 3Q2015 Earnings | October 29, 2015 32 measures are used in measuring the performance of our business units and are used as a basis for incentive compensation.
  • 33.
    Information Related toCertain Non-GAAP Financial Measures Th l l ti f (i) ti t it l di l t d th h i i (l ) d tThe calculations of: (i) operating return on equity, excluding accumulated other comprehensive income (loss) and net operating loss carryforwards (a non-GAAP financial measure); (ii) operating return, excluding significant items, on equity, excluding accumulated other comprehensive income (loss) and net operating loss carryforwards (a non- GAAP financial measure); and (iii) return on equity are as follows (dollars in millions): Trailing twelve months ended 3Q14 4Q14 1Q15 2Q15 3Q15 Operating income 274.0$ 276.9$ 277.1$ 266.6$ 246.8$ Operating income, excluding significant items 266.8$ 272.3$ 272.5$ 267.8$ 262.6$ Trailing twelve months ended Net Income 73.5$ 51.4$ 332.2$ 300.9$ 217.3$ Average common equity, excluding accumulated other comprehensive income (loss) and net operating loss carryforwards (a non-GAAP financial measure) 3,097.9$ 3,052.1$ 3,029.3$ 3,027.6$ 3,009.4$y ( ) Average common shareholders' equity 4,816.0$ 4,774.6$ 4,746.6$ 4,692.0$ 4,563.1$ Operating return on equity, excluding accumulated other comprehensive income (loss) and net operating loss carryforwards (a non-GAAP financial measure) 8.8% 9.1% 9.1% 8.8% 8.2%carryforwards (a non GAAP financial measure) 8.8% 9.1% 9.1% 8.8% 8.2% Operating return, excluding significant items, on equity, excluding accumulated other comprehensive income (loss) and net operating loss carryforwards (a non-GAAP financial measure) 8.6% 8.9% 9.0% 8.8% 8.7% Return on equity 1.5% 1.1% 7.0% 6.4% 4.8% CNO Financial Group | 3Q2015 Earnings | October 29, 2015 33 q y (Continued on next page)
  • 34.
    Information Related toCertain Non-GAAP Financial Measures The following summarizes: (i) operating earnings; (ii) significant items; (iii) operating earnings, excluding significant items; and (iv) net income (dollars in millions): Operating Operating earnings, earnings, excluding Net excluding significant income - Operating Significant significant items - trailing Net trailing earnings (a) items (b) items four quarters income four quarters 4Q13 66.2$ (2.0)$ 64.2$ -$ 106.0$ -$ 1Q14 59.9 1.9 61.8 246.2 (228.0) 238.1 2Q14 71.3 - 71.3 260.1 78.1 239.1 3Q14 76.6 (7.1) 69.5 266.8 117.4 73.5 4Q14 69.1 0.6 69.7 272.3 83.9 51.4 1Q15 60.1 1.9 62.0 272.5 52.8 332.2 2Q15 60 8 5 8 66 6 267 8 46 8 300 92Q15 60.8 5.8 66.6 267.8 46.8 300.9 3Q15 56.8 7.5 64.3 262.6 33.8 217.3 (a) - Operating earnings excludes the results from CLIC prior to being sold. (b) - The significant items have been discussed in prior press releases. CNO Financial Group | 3Q2015 Earnings | October 29, 2015 34 (Continued on next page)
  • 35.
    Information Related toCertain Non-GAAP Financial Measures A reconciliation of pretax operating earnings (a non-GAAP financial measure) to net income is as follows (dollars in millions): 3Q14 4Q14 1Q15 2Q15 3Q15 Twelve months ended Pretax operating earnings (a non-GAAP financial measure) 422.2$ 427.4$ 428.4$ 413.5$ 381.5$ Income tax (expense) benefit (148.2) (150.5) (151.3) (146.9) (134.7) Operating return 274.0 276.9 277.1 266.6 246.8 Earnings of CLIC prior to being sold, net of taxes 24.9 15.2 8.5 - - Net loss on sale of CLIC and gain (loss) on reinsurance transactions, inculding impact of taxes (335.9) (269.7) 28.3 25.8 2.9 Net realized investment gains, net of related amortization and taxes 32.8 21.4 6.4 (7.9) (22.8)Net realized investment gains, net of related amortization and taxes 32.8 21.4 6.4 (7.9) (22.8) Fair value changes in embedded derivative liabilities, net of related amortization and taxes (4.6) (23.4) (24.5) (2.9) (13.1) Fair value changes related to the agent deferred compensation plan, net of taxes (7.6) (17.4) (17.4) (9.8) (9.8) Loss on extinguishment or modification of debt (net of taxes) (0.4) (0.4) (0.4) (21.3) (21.3) Valuation allowance for deferred tax assets and other tax items 100.1 54.9 54.9 50.9 34.1 Other (9.8) (6.1) (0.7) (0.5) 0.5 CNO Financial Group | 3Q2015 Earnings | October 29, 2015 35 Net income 73.5$ 51.4$ 332.2$ 300.9$ 217.3$ (Continued on next page)
  • 36.
    Information Related toCertain Non-GAAP Financial Measures A reconciliation of consolidated capital, excluding accumulated other comprehensive income (loss) and net operating loss carryforwards (a non-GAAP financial measure) to common shareholders’ equity, is as follows (dollars in millions): 1Q13 2Q13 3Q13 4Q13 Consolidated capital, excluding accumulated other comprehensive income (loss) and net operating loss carryforwards (a non-GAAP financial measure) 3,002.9$ 3,067.6$ 3,181.9$ 3,258.1$ Net operating loss carryforwards 855.0 815.7 970.7 965.3 Accumulated other comprehensive income 1,170.7 698.1 634.0 731.8 Common shareholders' equity 5,028.6$ 4,581.4$ 4,786.6$ 4,955.2$ 1Q14 2Q14 3Q14 4Q14 Consolidated capital, excluding accumulated other comprehensive income (loss) and net operating loss carryforwards $ $ $ $(a non-GAAP financial measure) 2,996.0$ 3,032.6$ 3,028.0$ 3,045.3$ Net operating loss carryforwards 948.0 885.6 834.7 817.6 Accumulated other comprehensive income 766.2 926.1 859.3 825.3 Common shareholders' equity 4,710.2$ 4,844.3$ 4,722.0$ 4,688.2$ 1Q15 2Q15 3Q15 Consolidated capital, excluding accumulated other comprehensive income (loss) and net operating loss carryforwards (a non-GAAP financial measure) 3,026.1$ 2,989.7$ 2,924.9$ Net operating loss carryforwards 793.3 769.5 735.7 CNO Financial Group | 3Q2015 Earnings | October 29, 2015 36 Accumulated other comprehensive income 934.2 605.0 510.4 Common shareholders' equity 4,753.6$ 4,364.2$ 4,171.0$
  • 37.
    Information Related toCertain Non-GAAP Financial Measures A reconciliation of consolidated capital, excluding accumulated other comprehensive income (loss) and net operating loss carryforwards (a non-GAAP financial measure) to common shareholders’ equity, is as follows (dollars in millions): 3Q14 4Q14 1Q15 2Q15 3Q15 Trailing Four Quarter Average Consolidated capital, excluding accumulated other comprehensive income (loss) and net operating loss carryforwards (a non-GAAP financial measure) 3,097.9$ 3,052.1$ 3,029.3$ 3,027.6$ 3,009.4$ Net operating loss carryforwards 925.4 890.0 852.1 818.3 791.4Net operating loss carryforwards 925.4 890.0 852.1 818.3 791.4 Accumulated other comprehensive income 792.7 832.5 865.2 846.1 762.3 Common shareholders' equity 4,816.0$ 4,774.6$ 4,746.6$ 4,692.0$ 4,563.1$ CNO Financial Group | 3Q2015 Earnings | October 29, 2015 37
  • 38.
    Information Related toCertain Non-GAAP Financial Measures Debt to capital ratio, excluding accumulated other comprehensive income (loss) The debt to capital ratio, excluding accumulated other comprehensive income (loss), differs from the debt to capital ratio because accumulated other comprehensive income (loss) has been excluded from the value of capital used to determine this measure. Management believes this non- GAAP financial measure is useful because it removes the volatility that arises from changes in accumulated other comprehensive income (loss). Such volatility is often caused by changes in the estimated fair value of our investment portfolio resulting from changes in general market interest rates rather than the business decisions made by management. A reconciliation of these ratios is as follows ($ in millions): 3Q14 4Q14 1Q15 2Q15 3Q15 Corporate notes payable 814.0$ 794.4$ 774.8$ 925.0$ 925.0$ Total shareholders' equity 4,722.0 4,688.2 4,753.6 4,364.2 4,171.0 Total capital 5,536.0$ 5,482.6$ 5,528.4$ 5,289.2$ 5,096.0$ Corporate debt to capital 14.7% 14.5% 14.0% 17.5% 18.2% Corporate notes payable 814.0$ 794.4$ 774.8$ 925.0$ 925.0$ Total shareholders' equity 4,722.0 4,688.2 4,753.6 4,364.2 4,171.0q y , , , , , Less accumulated other comprehensive income (859.3) (825.3) (934.2) (605.0) (510.4) Total capital 4,676.7$ 4,657.3$ 4,594.2$ 4,684.2$ 4,585.6$ Debt to total capital ratio, excluding AOCI (a non-GAAP financial measure) 17.4% 17.1% 16.9% 19.7% 20.2% CNO Financial Group | 3Q2015 Earnings | October 29, 2015 38