Download free for 30 days
Sign in
Upload
Language (EN)
Support
Business
Mobile
Social Media
Marketing
Technology
Art & Photos
Career
Design
Education
Presentations & Public Speaking
Government & Nonprofit
Healthcare
Internet
Law
Leadership & Management
Automotive
Engineering
Software
Recruiting & HR
Retail
Sales
Services
Science
Small Business & Entrepreneurship
Food
Environment
Economy & Finance
Data & Analytics
Investor Relations
Sports
Spiritual
News & Politics
Travel
Self Improvement
Real Estate
Entertainment & Humor
Health & Medicine
Devices & Hardware
Lifestyle
Change Language
Language
English
Español
Português
Français
Deutsche
Cancel
Save
EN
Uploaded by
tcooper66
560 views
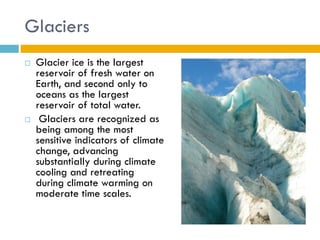
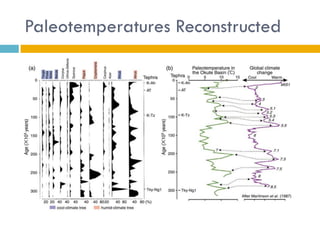
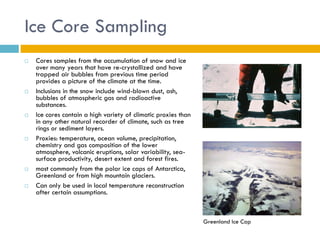
Climate Chanage
Travel
◦
Technology
◦
Read more
0
Save
Share
Embed
Embed presentation
Download
Downloaded 26 times
1
/ 32
2
/ 32
3
/ 32
4
/ 32
5
/ 32
6
/ 32
7
/ 32
8
/ 32
9
/ 32
10
/ 32
11
/ 32
12
/ 32
13
/ 32
14
/ 32
15
/ 32
16
/ 32
17
/ 32
18
/ 32
19
/ 32
20
/ 32
21
/ 32
22
/ 32
23
/ 32
24
/ 32
25
/ 32
26
/ 32
27
/ 32
28
/ 32
29
/ 32
30
/ 32
31
/ 32
32
/ 32
More Related Content
PPTX
Ge Tutorials Part V Embedding Objects
by
tcooper66
PDF
Southern Right Whales
by
tcooper66
PPTX
Cooper Family Reunion 2009
by
tcooper66
PPT
Kml Basics Chpt 4 Styles & Icons
by
tcooper66
PDF
Climate and the Asian Monsoon
by
tcooper66
PPT
Kml Basics Chpt 1 Overview
by
tcooper66
PDF
Spectroscopy
by
tcooper66
PPTX
Java Koch Curves
by
tcooper66
Ge Tutorials Part V Embedding Objects
by
tcooper66
Southern Right Whales
by
tcooper66
Cooper Family Reunion 2009
by
tcooper66
Kml Basics Chpt 4 Styles & Icons
by
tcooper66
Climate and the Asian Monsoon
by
tcooper66
Kml Basics Chpt 1 Overview
by
tcooper66
Spectroscopy
by
tcooper66
Java Koch Curves
by
tcooper66
More from tcooper66
PPTX
Java tree fractals
by
tcooper66
PPTX
Waitomo slideshow
by
tcooper66
PPTX
Energy Facts and Fiction
by
tcooper66
PPTX
Designing And Leading Collaborative Projects
by
tcooper66
PPTX
C:\Fakepath\Designing And Managing Collaborative Projects
by
tcooper66
PDF
Ge Tutorials Part Vi Design Principles
by
tcooper66
PPTX
GE Tutorials Part VI Design Principles
by
tcooper66
PPT
Kml Basics Chpt 5 Overlays
by
tcooper66
PPT
Kml Basics Chpt 3 Geometry
by
tcooper66
PPT
Kml Basics Chpt 2 Placemarks
by
tcooper66
PPTX
Creating Tours in Google Earth
by
tcooper66
PPTX
Google Earth Tutorials Part III
by
tcooper66
PPT
Wind Energy
by
tcooper66
PPTX
Google Earth Tutorials Part II
by
tcooper66
PPTX
Google Earth Tutorials - Part I
by
tcooper66
PDF
Clean Watersheds Project Presentation
by
tcooper66
PPT
Designing and Managing Collaborative Projects with Web 2.0 Tools
by
tcooper66
PDF
Nitrogen Fertalizer Impacts on Carbon Sequestration and Substitution in the P...
by
tcooper66
PDF
Becoming a Networked Learner
by
tcooper66
PDF
Community Ecology
by
tcooper66
Java tree fractals
by
tcooper66
Waitomo slideshow
by
tcooper66
Energy Facts and Fiction
by
tcooper66
Designing And Leading Collaborative Projects
by
tcooper66
C:\Fakepath\Designing And Managing Collaborative Projects
by
tcooper66
Ge Tutorials Part Vi Design Principles
by
tcooper66
GE Tutorials Part VI Design Principles
by
tcooper66
Kml Basics Chpt 5 Overlays
by
tcooper66
Kml Basics Chpt 3 Geometry
by
tcooper66
Kml Basics Chpt 2 Placemarks
by
tcooper66
Creating Tours in Google Earth
by
tcooper66
Google Earth Tutorials Part III
by
tcooper66
Wind Energy
by
tcooper66
Google Earth Tutorials Part II
by
tcooper66
Google Earth Tutorials - Part I
by
tcooper66
Clean Watersheds Project Presentation
by
tcooper66
Designing and Managing Collaborative Projects with Web 2.0 Tools
by
tcooper66
Nitrogen Fertalizer Impacts on Carbon Sequestration and Substitution in the P...
by
tcooper66
Becoming a Networked Learner
by
tcooper66
Community Ecology
by
tcooper66
Download