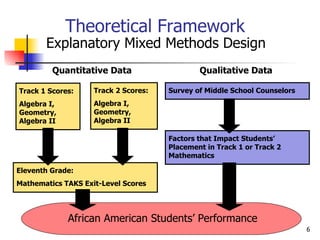
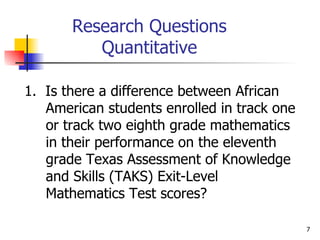
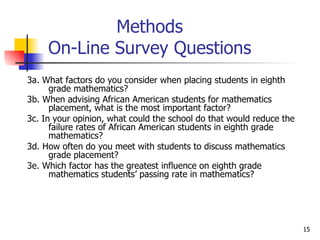
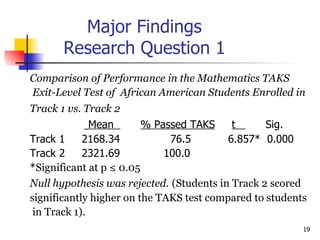
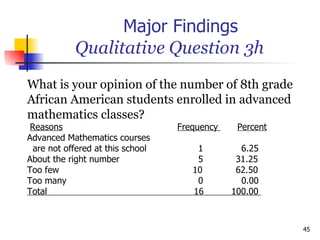
IMPACT OF HIGH SCHOOL MATHEMATICS CURRICULA ON  THE MATHEMATICS TAKS EXIT-LEVEL PERFORMANCE OF AFRICAN AMERICAN STUDENTS A Dissertation Defense by Clarence Johnson September 17, 2008 Chair: William Allan Kritsonis, Ph.D.
Committee Members William Allan Kritsonis, Ph.D . ( Dissertation Chair) Pamela Barber-Freeman, Ph.D.  Camille Gibson, Ph.D. (Member)   (Member) Douglas Hermond, Ph.D.  David Herrington, Ph.D. (Member)   (Member)
Dissertation Defense Format I. Purpose of the Study II. Theoretical Framework III. Research Questions IV. Null Hypotheses V. Pilot Study VI. Subjects of the Study VII. Instrumentation VIII. On-Line Survey Questions IX. Data Analysis X. Independent/Dependent Variables XI. Major Findings -Quantitative XII. Major Findings- Qualitative/Interview and Related Literature Support XIII. Implications XIV. Recommendations for Further Study XV. Challenges & Opportunities
Purpose of the Study The purpose of this study was to investigate the impact that high school mathematics scores and courses had on the Mathematics TAKS Exit-Level performance of African American students. Some middle school counselors were surveyed to investigate factors that contributed to African American students’ passing the Mathematics TAKS Exit-Level Test.
Note The results of this study may be helpful to  school administrators, teachers, and  parents. The results will help to give  needed attention to students in terms of proper placement in mathematics courses  along with support in the learning process.
Theoretical Framework Explanatory Mixed Methods Design Quantitative Data Qualitative Data Track 1 Scores: Algebra I, Geometry, Algebra II Track 2 Scores: Algebra I, Geometry, Algebra II Eleventh Grade: Mathematics TAKS Exit-Level Scores Survey of Middle School Counselors Factors that Impact Students’ Placement in Track 1 or Track 2 Mathematics African American Students’ Performance
Research Questions Quantitative 1.  Is there a difference between African American students enrolled in track one or track two eighth grade mathematics in their performance on the eleventh grade Texas Assessment of Knowledge and Skills (TAKS) Exit-Level Mathematics Test scores?
Research Questions Quantitative 2. Is there a relationship between  mathematics scores in Algebra I,  geometry, and/or Algebra II of African  American students enrolled in track one  or track two in eighth and ninth grades  and their eleventh grade Texas Assessment of Knowledge and Skills (TAKS) Exit-Level Mathematics Test scores?
Research Questions Qualitative 3. What factors do counselors identify as  influential in African American students’  placement in track one or track two  mathematics?
Null  Hypotheses H 01: There is no statistically significant difference between African American students enrolled in track one and those in track two eighth grade mathematics in their performance on the eleventh grade Texas Assessment of Knowledge and Skills (TAKS) Exit-Level Mathematics Test scores.
Null Hypotheses H 02: There is no statistically significant relationship between mathematics scores in Algebra I, geometry, and/or Algebra II of African American students enrolled in track one or track two in eighth and ninth grades and their eleventh grade Texas Assessment of Knowledge and Skills (TAKS) Exit-Level Mathematics Test scores.
Methods Pilot Study Pilot Study – Initial Survey with 15 Questions Reduced to Nine (9) A panel of experts reviewed the  survey: An executive director of guidance and  counseling Two university professors Three middle school counselors Two high school mathematics  teachers
Methods Subjects of the Study Quantitative  –  262  African American Students from 6 Urban High Schools in Texas Qualitative  –  16  Counselors from Nine  (9) Middle Schools in Texas
Methods Instrumentation Quantitative  – Data Banks of TEA and School District – SASIxp Qualitative  – On-line Survey
Methods On-Line Survey Questions 3a. What factors do you consider when placing students in eighth grade mathematics? 3b. When advising African American students for mathematics placement, what is the most important factor? 3c. In your opinion, what could the school do that would reduce the failure rates of African American students in eighth grade mathematics? 3d. How often do you meet with students to discuss mathematics grade placement? 3e. Which factor has the greatest influence on eighth grade mathematics students’ passing rate in mathematics?
Methods  On-Line Survey Questions 3f.  What is the most important factor that contributes  to the recommendation of African American males to eighth grade advanced mathematics?  3g. In your opinion, do teachers at this school frequently meet with African American students about how they can succeed in mathematics courses? 3h. What is your opinion of the number of eighth grade African American students enrolled in advanced mathematics classes? 3i. How do you rate the counseling department in dealing with African American eighth grade students in mathematics?
Methods Data Analysis Descriptive Statistics Correlation Statistics – Pearson r, Multiple Correlation (R) t - test for 2 Independent Samples Analysis of Variance (ANOVA)
Methods Variables-Independent/Dependent Independent Variables  – African American Students’ Scores in Algebra I, geometry and Algebra II  Track 1 Track 2 Dependent Variable  –TAKS Exit-Level Mathematics Scores
Major Findings Research Question 1 Comparison of Performance in the Mathematics TAKS  Exit-Level Test of  African American Students Enrolled in  Track 1 vs. Track 2   Mean  % Passed TAKS   t  Sig. Track 1  2168.34  76.5  6.857*  0.000 Track 2  2321.69  100.0 * Significant at p ≤ 0.05 Null hypothesis was rejected.   (Students in Track 2 scored  significantly higher on the TAKS test compared to students in Track 1).
Major Findings Research Question 2 Relationship Between Scores in  Algebra I and TAKS Exit-Level Mathematics Test Pearson r  Track 1   Track 2 TAKS Scores  0.297*  0.455* Sig. (2-tailed)  0.000  0.001 * Significant at p ≤ 0.05
Major Findings Research Question 2 Relationship Between Scores in  Geometry and TAKS Exit-Level Mathematics Test Pearson r  Track 1   Track 2 TAKS Scores  0.651*  0.475*  Sig. (2-tailed)  0.000  0.001 * Significant at p≤ 0.05
Major Findings Research Question 2 Relationship Between Scores in  Algebra II and TAKS Exit-Level Mathematics Test Pearson r  Track 1   Track 2 TAKS Scores  0.503*  0.435*  Sig. (2-tailed)  0.000  0.002 *Significant at p ≤ 0.05
Major Findings Research Question 2 Analysis Of Variance (ANOVA) for Track 1  Students Passing the Mathematics TAKS Exit- Level Test Sum of Squares   df   F  Sig. Regression  982241.97  3  45.254  0.000 Residual  1215491.8  168  Total  2197733.8  171 Predictors: Constant, T1Algebra II, T1Algebra I, T1Geometry Dependent Variable: T1TAKS
Major Findings Research Question 2 Coefficients for Track 1 Mathematics TAKS Exit-Level Test Unstandardized  Coefficients  t  Sig. Constant  1297.279  15.949  0.000  T1Algebra I  0.967  1.188  0.236  T1Geometry  7.770  7.479  0.000  T1Algebra II  2.867  2.769  0.006 Dependent Variable: T 1  TAKS  Regression Equation to Predict Value of TAKS Score: Ŷ = 1297.279 + 0.967X1 +7.770X2 + 2.867X3, where X1 = Algebra I score, X2 = geometry score, X3 = Algebra II score and Constant = 1297.279.
Major Findings Research Question 2 Analysis Of Variance (ANOVA) for Track  2   Students Passing the Mathematics TAKS Exit-Level Test Sum of Squares   df   F  Sig. Regression  349238.75  3  11.613  0.000 Residual  431032.18  43  Total  780270.94  46 Predictors: Constant, T 2  Algebra II, T 2  Algebra I, T 2  Geometry Dependent Variable: T 2  TAKS
Major Findings Research Question 2 Coefficients for Track  2  Mathematics TAKS Exit-Level Test Unstandardized  Coefficients  t  Sig. Constant  1025.724  4.334  0.000  T2 Algebra I  4.760  1.560  0.126 T2 Geometry  6.679  3.277  0.002  T2 Algebra II  4.383  1.879  0.067 Dependent Variable: T 2  TAKS   Regression Equation to Predict Value of TAKS Score: Ŷ = 1025.724+ 4.760X1  + 6.679X2 + 4.383X3,   where X1 = Algebra I score, X2 = geometry score, X3 = Algebra II score and Constant = 1025.724.
Number of Years Respondents    Worked as a School Counselor Years    Frequency   Percent 1  -  5   6     37.50 6  -  10   1     6.25 11 -  15   4   25.00 16 -  20  3   18.75 21 -  25   1   6.25 26 -  30   1   6.25 Total   16   100.00
Major Findings   Qualitative Question 3a What factors do you consider when placing  students in 8th grade mathematics? Factors   Frequency  Percent* Parental input   3 18.75 Previous academic achievement   15 93.75 School district policy  14 87.50 Teachers’ recommendation   14 87.50 * Due to multiple responses, percentages do not add up to 100.
Interview Support “ District policy requires standardized test  scores (primarily Iowa and TAKS) to be  used with grades.”  “ District guidelines direct the placement of  students in Algebra in the 8th grade.” “ I follow the same schedule that the  students from the home school enter  with.”
Related Literature Support In Principles and Standards for School  Mathematics, the National Council of Teachers of  Mathematics (NCTM, 2000) identified algebra as  one of the central themes in K-12 mathematics.  Many educators perceive algebra as the gateway  to higher mathematics, and many state  graduation requirements include at least 1 year of  algebra (McCoy, 2005).
Major Findings   Qualitative Question 3b When advising African American students for  mathematics placement, what is the most  important factor?  Factors   Frequency  Percent* Student’s desire for more  challenging courses   11 68.75 Teacher’s recommendation    4 25.00 Counselor’s recommendation   0   0.00 Family history   0   0.00 *Due to less than total documented responses, percentages do not add up to 100.
Interview Support “ The district has a matrix that we follow that guides us in  placing students in Algebra I as an 8th grader. We  examine previous grades and teacher  recommendations to determine placement in our AVID  (college prep) program.”  “ Teacher recommendations are important but much less  reliable due to subjectivity.”  “ I would consider the students’ desire for a challenge and  then speak with the teacher as well.”  “ I follow the same schedule that the students from the  home school enter with.”
Major Findings   Qualitative Question 3c In your opinion, what could the school do that  would reduce the failure rates of African  American students in 8th grade mathematics? Factors     Frequency  Percent* More tutorials/remediation   12   75.00 Better trained mathematics teachers  9   56.25 More parental involvement   12   75.00 Change entry level    3   18.75 * Due to multiple responses, percentages do not add up to 100.
Interview Support “ The ‘Ethnic Disparity Gap’ is irrelevant when there are strong supportive homes.”  “ This is in consonance with the counselors’ claim that parental involvement has tremendous, effective influence on students’ success.”
Related Literature Support Much of the difference in school  achievement found between African  American students and others is due to  the effects of substantially different  school opportunities, and in particular, greatly disparate access to high quality  teachers and teaching (Darling-Hammonds,  2000).
Major Findings   Qualitative Question 3d How often do you meet with students to  discuss mathematics grade placement? Timeline   Frequency   Percent* One time a year    5   31.25 Bi-annually   8   50.00 Monthly   1   6.25 Parent’s request   5   31.25 * Due to multiple responses, percentages do not add up to 100.
Interview Support “ Course selection or qualification for advanced classes is  the only time we meet to discuss placement. ‘District’s  Track’ doesn’t allow a student to enter in higher classes in  8th grade unless enrolled in 7th grade mathematics.”  “ I follow the same schedule that the student’s from the  home school enter with.” “ We tell students in the 6th grade when we let them  choose their courses about district mathematics  requirements. We tell them again at orientation night  during the first day of school. We tell them again at open  house, early fall. We tell them again in the GT parents’  meeting held in the fall and spring. We send out letters  late spring.”
Major Findings   Qualitative Question 3e Which factor has the greatest influence on 8th  grade mathematics students’ passing rate in  mathematics? Factors     Frequency   Percent* Certified Mathematics teacher    0   0.00 Parental involvement   2    12.50 Teacher’s expectation   5  31.25 Peer group pressure   0     0.00 Student’s attitude    8   50.00 *Due to total documented responses, percentages do not add up to 100.
Related Literature Support Working in an urban Missouri junior high school,  investigators studied what happened when  students of average mathematics achievement  were assigned to an advanced eighth-grade pre- algebra class. They found that the achievement of accelerated average students was better than  the achievement of similar students in previous  years who had not taken accelerated  mathematics (Burris, Heubert, & Levin, 2006).
Related Literature Support The average-achieving students in the high-track  classes enrolled in more advanced high school  mathematics courses than did students at similar achievement levels from previous low-track  cohorts. The results of the studies are consistent with the  findings and demonstrated almost no growth among  students placed in low-track, remedial eighth-grade  classrooms, and the conclusions from a study  commissioned by the National Research Council that  documented strong negative effects of low-track classes  (Burris, Heubert, & Levin, 2006).
Major Findings   Qualitative Question 3f What is the most important factor that  contributes to the recommendation of African American males to 8th grade advanced  mathematics? Factors    Frequency   Percent* Athletic coach’s recommendation    1   6.25 Student’s interest   1    6.25 Principal’s/counselor’s recommendation  1   6.25 Achievement scores   12   75.00 * Due to total documented responses, percentages do not add up to 100.
Interview Support A counselor repeated the matrix’s  guideline as basis for her action regarding  placement of African American students  in 8th grade mathematics.  Counselor commented: “Once again,  Algebra I placement is determined by a  matrix given to us by the district.”
Major Findings   Qualitative Question 3g In your opinion, do teachers at this school  frequently meet with African American students  about how they can succeed in mathematics  courses? Response    Frequency  Percent Strongly agree   0   0.00 Agree   6   37.50 Unsure   7   43.75 Disagree   1   6.25 Strongly disagree   2   12.50 Total  16  100.00
Related Literature Support A student’s path in middle school can shape his or her course in high school, which affects success  in college and thereby determines a career path. As we look at African Americans in the  workplace, our gaze is necessarily directed back to their formative academic experiences in  middle school, high school and college, where the track to their future success is first laid down  (“Report Highlights Importance of Middle School Math”, 2003).
Major Findings   Qualitative Question 3h What is your opinion of the number of 8th grade  African American students enrolled in advanced  mathematics classes?  Reasons     Frequency  Percent Advanced Mathematics courses are not offered at this school   1   6.25 About the right number   5   31.25 Too few   10   62.50 Too many   0   0.00 Total  16  100.00
Related Literature Support African American students are twice as  likely to be placed in non-academic track  classes and remedial mathematics  classes. Placement in these classes  exposes students to a less challenging  curriculum and the least experienced  teachers (Rubin & Noguera, 2004).
Related Literature Support Berry (2003) stated that African American  students receive mathematics instruction  that is not consistent with mathematics  education reform; furthermore, the  mathematics instruction that many African American students receive is in opposition  to their culture styles and learning  preferences.
Related Literature Support African American students take fewer  algebra and geometry courses than White  students and these courses are often  “gate-keepers” to science and mathematics  degrees and performance on standardized  examinations (Russell, 2005).
Major Findings   Qualitative Question 3i How do you rate the counseling department in  dealing with African American 8th grade  students in mathematics? Rating     Frequency   Percent* Outstanding    1   6.25 Above average   6   37.50 Adequate   8   50.00 Poor   0   0.00 *Due to total documented responses, percentages do not add up to 100.
Interview Support “ We have a large group of student load  and we treat them all the same in  placement and do not single out one  group. We speak to all the same and with  the same information which to encourage  them all.”
Implications Berry (2003) points outs that African American students’  mathematics achievement levels are indicative of the  instruction that they receive. Data collected on teachers’  instructional practices indicate differences between African American students and their peers.  National Assessment of Educational Progress (NAEP) data suggest  that most African American students are not experiencing  instructional practices consistent with the  recommendations suggested by the National Council of Teachers of Mathematics (NCTM), whereas more White  students are experiencing NCTM standards-based  instruction (Lubienski, 2001).
Implications The power and influence of the middle-class,  affluent, and more privileged parents plays an  important role in deciding who will be in “their  kid’s classes.” More often than not, political  pressure from parents coupled with low  expectations for African Americans in the  classroom by teachers, counselors, and  administrators result in homogeneous tracks  and ability groups (Russell, 2005).
Implications Ward (2008) pointed out that mathematics achievement  builds to increasing levels of complexity only when the base  is solid, and that base is formed from the earliest days of  elementary school. Too many elementary school teachers, strong in other subjects and talented in connecting with  children, lack the mathematics background needed to  prepare students for algebra by the eighth grade.  Additional research based training, targeted at the specific skills needed for effective algebra instruction, will be  critical and costly.
Implications The existence of linear regression equations  may become one of the bases for remediation  efforts to assure that students pass the  mathematics high-stakes test. Administrators  and teachers may forestall problems associated  with the State of Texas requirement for  students to graduate from high school.
Recommendations for Further Study A study should be conducted to involve representative samples from one or more districts in a similar study to determine if results can be duplicated. A study should be conducted to involve another group of students (Whites, Hispanics, Asians, etc.) in a similar study.
Recommendations for Further Study A study should be conducted to determine specific activities of the guidance and counseling department in the placement of students not only in mathematics but also in the different core areas of science, English and social studies. A study should be conducted on the quality of mathematics instruction involved in the different tracks.
Recommendations for Further Study A study should be conducted to predict the performance of African American students in the other core areas.  A quantitative study should be conducted with a large random sample of teachers and school counselors regarding the impact of high school mathematics curricula on the mathematics TAKS Exit-Level performance of students.
Recommendations for Further Study A study should be conducted regarding remediation practices done by the school and the home in preparing students to succeed in the high-stakes tests given by the State of Texas, not only in mathematics but also in the other core areas.
Challenges & Opportunities Although African Americans have  increased their participation in  mathematics and the sciences within the  last decade, it is important to note that  these advances are still miniscule when  compared to those of White students  (Russell, 2005).
Challenges & Opportunities The attitudes and experiences of many school personnel need to change, too. I have been on campuses and in  classrooms throughout the state, and it is consistent from  one end to the other: certain students are seen as algebra- ready, and certain students are not. It’s no mystery: Asian and White students on one hand; Latino, African American and poor students of all ethnicities on the other. But they are not ready. This is the common and perfectly honest  explanation. But it is our job to make them ready. It is work we have chosen. It is our responsibility (Ward, 2008).
REFERENCES Berry, R. Q., III. (2003).  Voices of African American male middle  school students: A portrait of successful middle school mathematics students . Unpublished Doctoral Dissertation. University of North Carolina at Chapel Hill, Chapel Hill, NC. Burris, C. C., Heubert, J. P., & Levin, H. M. (2006). Accelerating mathematics achievement.  Educational Research Journal, 43 (1), 105-136. Darling-Hammonds, L. (2000). New standards and old inequalities:  School reform and the education of African American students.  The Journal of Negro Education ,  69 (4), 263-287.
REFERENCES Lubienski, S. T. (2001, April). A second look at mathematics achievement gaps: Intersections of race, class, and gender in NAEP data. Paper Presented at American Educational Research Association, Seattle, WA.   McCoy, L. P. (2005). Effect of Demographic and personal variables on achievement in eighth-grade algebra.  Journal of Educational Research, 98 (3), 131-135.   National Council of Teachers of Mathematics. (2000).  Principles and standards for school mathematics.  Reston, VA: NCTM. Report highlights importance of middle school math (2003).  Black Issues in Higher Education ,  20 (19), 11.
REFERENCES Rubin, B. C., & Norguera, P. A. (2004).  Tracking detracking: Sorting through the dilemmas and possibilities of detracking in practice.  Equity & Excellence, 37 , 92-101. Russell, M. L. (2005). Untapped talent and unlimited potential: African American students and the science pipeline.  The Negro Educational Review,   56 (2/3), 167-182. Texas Education Agency  ( 2005 ). Accountability System State Data Table 2005.  Austin, TX: Author. Retrieved January 25, 2006,  from  http://www.tea.state.tx.us/perfreport/account/2005/state.html   Ward, R. (2008, July 23).Our expectations for all children.  The San Diego Union-Tribune.  p. A18.
Thank You !!! For  listening  to  my  presentation! Have a wonderful day!!!

Clarence Johnson, Dissertation PPT, Dr. William Allan Kritsonis, Dissertation Chair, PVAMU/Member of the Texas A&M University System

  • 1.
    IMPACT OF HIGHSCHOOL MATHEMATICS CURRICULA ON THE MATHEMATICS TAKS EXIT-LEVEL PERFORMANCE OF AFRICAN AMERICAN STUDENTS A Dissertation Defense by Clarence Johnson September 17, 2008 Chair: William Allan Kritsonis, Ph.D.
  • 2.
    Committee Members WilliamAllan Kritsonis, Ph.D . ( Dissertation Chair) Pamela Barber-Freeman, Ph.D. Camille Gibson, Ph.D. (Member) (Member) Douglas Hermond, Ph.D. David Herrington, Ph.D. (Member) (Member)
  • 3.
    Dissertation Defense FormatI. Purpose of the Study II. Theoretical Framework III. Research Questions IV. Null Hypotheses V. Pilot Study VI. Subjects of the Study VII. Instrumentation VIII. On-Line Survey Questions IX. Data Analysis X. Independent/Dependent Variables XI. Major Findings -Quantitative XII. Major Findings- Qualitative/Interview and Related Literature Support XIII. Implications XIV. Recommendations for Further Study XV. Challenges & Opportunities
  • 4.
    Purpose of theStudy The purpose of this study was to investigate the impact that high school mathematics scores and courses had on the Mathematics TAKS Exit-Level performance of African American students. Some middle school counselors were surveyed to investigate factors that contributed to African American students’ passing the Mathematics TAKS Exit-Level Test.
  • 5.
    Note The resultsof this study may be helpful to school administrators, teachers, and parents. The results will help to give needed attention to students in terms of proper placement in mathematics courses along with support in the learning process.
  • 6.
    Theoretical Framework ExplanatoryMixed Methods Design Quantitative Data Qualitative Data Track 1 Scores: Algebra I, Geometry, Algebra II Track 2 Scores: Algebra I, Geometry, Algebra II Eleventh Grade: Mathematics TAKS Exit-Level Scores Survey of Middle School Counselors Factors that Impact Students’ Placement in Track 1 or Track 2 Mathematics African American Students’ Performance
  • 7.
    Research Questions Quantitative1. Is there a difference between African American students enrolled in track one or track two eighth grade mathematics in their performance on the eleventh grade Texas Assessment of Knowledge and Skills (TAKS) Exit-Level Mathematics Test scores?
  • 8.
    Research Questions Quantitative2. Is there a relationship between mathematics scores in Algebra I, geometry, and/or Algebra II of African American students enrolled in track one or track two in eighth and ninth grades and their eleventh grade Texas Assessment of Knowledge and Skills (TAKS) Exit-Level Mathematics Test scores?
  • 9.
    Research Questions Qualitative3. What factors do counselors identify as influential in African American students’ placement in track one or track two mathematics?
  • 10.
    Null HypothesesH 01: There is no statistically significant difference between African American students enrolled in track one and those in track two eighth grade mathematics in their performance on the eleventh grade Texas Assessment of Knowledge and Skills (TAKS) Exit-Level Mathematics Test scores.
  • 11.
    Null Hypotheses H02: There is no statistically significant relationship between mathematics scores in Algebra I, geometry, and/or Algebra II of African American students enrolled in track one or track two in eighth and ninth grades and their eleventh grade Texas Assessment of Knowledge and Skills (TAKS) Exit-Level Mathematics Test scores.
  • 12.
    Methods Pilot StudyPilot Study – Initial Survey with 15 Questions Reduced to Nine (9) A panel of experts reviewed the survey: An executive director of guidance and counseling Two university professors Three middle school counselors Two high school mathematics teachers
  • 13.
    Methods Subjects ofthe Study Quantitative – 262 African American Students from 6 Urban High Schools in Texas Qualitative – 16 Counselors from Nine (9) Middle Schools in Texas
  • 14.
    Methods Instrumentation Quantitative – Data Banks of TEA and School District – SASIxp Qualitative – On-line Survey
  • 15.
    Methods On-Line SurveyQuestions 3a. What factors do you consider when placing students in eighth grade mathematics? 3b. When advising African American students for mathematics placement, what is the most important factor? 3c. In your opinion, what could the school do that would reduce the failure rates of African American students in eighth grade mathematics? 3d. How often do you meet with students to discuss mathematics grade placement? 3e. Which factor has the greatest influence on eighth grade mathematics students’ passing rate in mathematics?
  • 16.
    Methods On-LineSurvey Questions 3f. What is the most important factor that contributes to the recommendation of African American males to eighth grade advanced mathematics? 3g. In your opinion, do teachers at this school frequently meet with African American students about how they can succeed in mathematics courses? 3h. What is your opinion of the number of eighth grade African American students enrolled in advanced mathematics classes? 3i. How do you rate the counseling department in dealing with African American eighth grade students in mathematics?
  • 17.
    Methods Data AnalysisDescriptive Statistics Correlation Statistics – Pearson r, Multiple Correlation (R) t - test for 2 Independent Samples Analysis of Variance (ANOVA)
  • 18.
    Methods Variables-Independent/Dependent IndependentVariables – African American Students’ Scores in Algebra I, geometry and Algebra II Track 1 Track 2 Dependent Variable –TAKS Exit-Level Mathematics Scores
  • 19.
    Major Findings ResearchQuestion 1 Comparison of Performance in the Mathematics TAKS Exit-Level Test of African American Students Enrolled in Track 1 vs. Track 2 Mean % Passed TAKS t Sig. Track 1 2168.34 76.5 6.857* 0.000 Track 2 2321.69 100.0 * Significant at p ≤ 0.05 Null hypothesis was rejected. (Students in Track 2 scored significantly higher on the TAKS test compared to students in Track 1).
  • 20.
    Major Findings ResearchQuestion 2 Relationship Between Scores in Algebra I and TAKS Exit-Level Mathematics Test Pearson r Track 1 Track 2 TAKS Scores 0.297* 0.455* Sig. (2-tailed) 0.000 0.001 * Significant at p ≤ 0.05
  • 21.
    Major Findings ResearchQuestion 2 Relationship Between Scores in Geometry and TAKS Exit-Level Mathematics Test Pearson r Track 1 Track 2 TAKS Scores 0.651* 0.475* Sig. (2-tailed) 0.000 0.001 * Significant at p≤ 0.05
  • 22.
    Major Findings ResearchQuestion 2 Relationship Between Scores in Algebra II and TAKS Exit-Level Mathematics Test Pearson r Track 1 Track 2 TAKS Scores 0.503* 0.435* Sig. (2-tailed) 0.000 0.002 *Significant at p ≤ 0.05
  • 23.
    Major Findings ResearchQuestion 2 Analysis Of Variance (ANOVA) for Track 1 Students Passing the Mathematics TAKS Exit- Level Test Sum of Squares df F Sig. Regression 982241.97 3 45.254 0.000 Residual 1215491.8 168 Total 2197733.8 171 Predictors: Constant, T1Algebra II, T1Algebra I, T1Geometry Dependent Variable: T1TAKS
  • 24.
    Major Findings ResearchQuestion 2 Coefficients for Track 1 Mathematics TAKS Exit-Level Test Unstandardized Coefficients t Sig. Constant 1297.279 15.949 0.000 T1Algebra I 0.967 1.188 0.236 T1Geometry 7.770 7.479 0.000 T1Algebra II 2.867 2.769 0.006 Dependent Variable: T 1 TAKS Regression Equation to Predict Value of TAKS Score: Ŷ = 1297.279 + 0.967X1 +7.770X2 + 2.867X3, where X1 = Algebra I score, X2 = geometry score, X3 = Algebra II score and Constant = 1297.279.
  • 25.
    Major Findings ResearchQuestion 2 Analysis Of Variance (ANOVA) for Track 2 Students Passing the Mathematics TAKS Exit-Level Test Sum of Squares df F Sig. Regression 349238.75 3 11.613 0.000 Residual 431032.18 43 Total 780270.94 46 Predictors: Constant, T 2 Algebra II, T 2 Algebra I, T 2 Geometry Dependent Variable: T 2 TAKS
  • 26.
    Major Findings ResearchQuestion 2 Coefficients for Track 2 Mathematics TAKS Exit-Level Test Unstandardized Coefficients t Sig. Constant 1025.724 4.334 0.000 T2 Algebra I 4.760 1.560 0.126 T2 Geometry 6.679 3.277 0.002 T2 Algebra II 4.383 1.879 0.067 Dependent Variable: T 2 TAKS Regression Equation to Predict Value of TAKS Score: Ŷ = 1025.724+ 4.760X1 + 6.679X2 + 4.383X3, where X1 = Algebra I score, X2 = geometry score, X3 = Algebra II score and Constant = 1025.724.
  • 27.
    Number of YearsRespondents Worked as a School Counselor Years Frequency Percent 1 - 5 6 37.50 6 - 10 1 6.25 11 - 15 4 25.00 16 - 20 3 18.75 21 - 25 1 6.25 26 - 30 1 6.25 Total 16 100.00
  • 28.
    Major Findings Qualitative Question 3a What factors do you consider when placing students in 8th grade mathematics? Factors Frequency Percent* Parental input 3 18.75 Previous academic achievement 15 93.75 School district policy 14 87.50 Teachers’ recommendation 14 87.50 * Due to multiple responses, percentages do not add up to 100.
  • 29.
    Interview Support “District policy requires standardized test scores (primarily Iowa and TAKS) to be used with grades.” “ District guidelines direct the placement of students in Algebra in the 8th grade.” “ I follow the same schedule that the students from the home school enter with.”
  • 30.
    Related Literature SupportIn Principles and Standards for School Mathematics, the National Council of Teachers of Mathematics (NCTM, 2000) identified algebra as one of the central themes in K-12 mathematics. Many educators perceive algebra as the gateway to higher mathematics, and many state graduation requirements include at least 1 year of algebra (McCoy, 2005).
  • 31.
    Major Findings Qualitative Question 3b When advising African American students for mathematics placement, what is the most important factor? Factors Frequency Percent* Student’s desire for more challenging courses 11 68.75 Teacher’s recommendation 4 25.00 Counselor’s recommendation 0 0.00 Family history 0 0.00 *Due to less than total documented responses, percentages do not add up to 100.
  • 32.
    Interview Support “The district has a matrix that we follow that guides us in placing students in Algebra I as an 8th grader. We examine previous grades and teacher recommendations to determine placement in our AVID (college prep) program.” “ Teacher recommendations are important but much less reliable due to subjectivity.” “ I would consider the students’ desire for a challenge and then speak with the teacher as well.” “ I follow the same schedule that the students from the home school enter with.”
  • 33.
    Major Findings Qualitative Question 3c In your opinion, what could the school do that would reduce the failure rates of African American students in 8th grade mathematics? Factors Frequency Percent* More tutorials/remediation 12 75.00 Better trained mathematics teachers 9 56.25 More parental involvement 12 75.00 Change entry level 3 18.75 * Due to multiple responses, percentages do not add up to 100.
  • 34.
    Interview Support “The ‘Ethnic Disparity Gap’ is irrelevant when there are strong supportive homes.” “ This is in consonance with the counselors’ claim that parental involvement has tremendous, effective influence on students’ success.”
  • 35.
    Related Literature SupportMuch of the difference in school achievement found between African American students and others is due to the effects of substantially different school opportunities, and in particular, greatly disparate access to high quality teachers and teaching (Darling-Hammonds, 2000).
  • 36.
    Major Findings Qualitative Question 3d How often do you meet with students to discuss mathematics grade placement? Timeline Frequency Percent* One time a year 5 31.25 Bi-annually 8 50.00 Monthly 1 6.25 Parent’s request 5 31.25 * Due to multiple responses, percentages do not add up to 100.
  • 37.
    Interview Support “Course selection or qualification for advanced classes is the only time we meet to discuss placement. ‘District’s Track’ doesn’t allow a student to enter in higher classes in 8th grade unless enrolled in 7th grade mathematics.” “ I follow the same schedule that the student’s from the home school enter with.” “ We tell students in the 6th grade when we let them choose their courses about district mathematics requirements. We tell them again at orientation night during the first day of school. We tell them again at open house, early fall. We tell them again in the GT parents’ meeting held in the fall and spring. We send out letters late spring.”
  • 38.
    Major Findings Qualitative Question 3e Which factor has the greatest influence on 8th grade mathematics students’ passing rate in mathematics? Factors Frequency Percent* Certified Mathematics teacher 0 0.00 Parental involvement 2 12.50 Teacher’s expectation 5 31.25 Peer group pressure 0 0.00 Student’s attitude 8 50.00 *Due to total documented responses, percentages do not add up to 100.
  • 39.
    Related Literature SupportWorking in an urban Missouri junior high school, investigators studied what happened when students of average mathematics achievement were assigned to an advanced eighth-grade pre- algebra class. They found that the achievement of accelerated average students was better than the achievement of similar students in previous years who had not taken accelerated mathematics (Burris, Heubert, & Levin, 2006).
  • 40.
    Related Literature SupportThe average-achieving students in the high-track classes enrolled in more advanced high school mathematics courses than did students at similar achievement levels from previous low-track cohorts. The results of the studies are consistent with the findings and demonstrated almost no growth among students placed in low-track, remedial eighth-grade classrooms, and the conclusions from a study commissioned by the National Research Council that documented strong negative effects of low-track classes (Burris, Heubert, & Levin, 2006).
  • 41.
    Major Findings Qualitative Question 3f What is the most important factor that contributes to the recommendation of African American males to 8th grade advanced mathematics? Factors Frequency Percent* Athletic coach’s recommendation 1 6.25 Student’s interest 1 6.25 Principal’s/counselor’s recommendation 1 6.25 Achievement scores 12 75.00 * Due to total documented responses, percentages do not add up to 100.
  • 42.
    Interview Support Acounselor repeated the matrix’s guideline as basis for her action regarding placement of African American students in 8th grade mathematics. Counselor commented: “Once again, Algebra I placement is determined by a matrix given to us by the district.”
  • 43.
    Major Findings Qualitative Question 3g In your opinion, do teachers at this school frequently meet with African American students about how they can succeed in mathematics courses? Response Frequency Percent Strongly agree 0 0.00 Agree 6 37.50 Unsure 7 43.75 Disagree 1 6.25 Strongly disagree 2 12.50 Total 16 100.00
  • 44.
    Related Literature SupportA student’s path in middle school can shape his or her course in high school, which affects success in college and thereby determines a career path. As we look at African Americans in the workplace, our gaze is necessarily directed back to their formative academic experiences in middle school, high school and college, where the track to their future success is first laid down (“Report Highlights Importance of Middle School Math”, 2003).
  • 45.
    Major Findings Qualitative Question 3h What is your opinion of the number of 8th grade African American students enrolled in advanced mathematics classes? Reasons Frequency Percent Advanced Mathematics courses are not offered at this school 1 6.25 About the right number 5 31.25 Too few 10 62.50 Too many 0 0.00 Total 16 100.00
  • 46.
    Related Literature SupportAfrican American students are twice as likely to be placed in non-academic track classes and remedial mathematics classes. Placement in these classes exposes students to a less challenging curriculum and the least experienced teachers (Rubin & Noguera, 2004).
  • 47.
    Related Literature SupportBerry (2003) stated that African American students receive mathematics instruction that is not consistent with mathematics education reform; furthermore, the mathematics instruction that many African American students receive is in opposition to their culture styles and learning preferences.
  • 48.
    Related Literature SupportAfrican American students take fewer algebra and geometry courses than White students and these courses are often “gate-keepers” to science and mathematics degrees and performance on standardized examinations (Russell, 2005).
  • 49.
    Major Findings Qualitative Question 3i How do you rate the counseling department in dealing with African American 8th grade students in mathematics? Rating Frequency Percent* Outstanding 1 6.25 Above average 6 37.50 Adequate 8 50.00 Poor 0 0.00 *Due to total documented responses, percentages do not add up to 100.
  • 50.
    Interview Support “We have a large group of student load and we treat them all the same in placement and do not single out one group. We speak to all the same and with the same information which to encourage them all.”
  • 51.
    Implications Berry (2003)points outs that African American students’ mathematics achievement levels are indicative of the instruction that they receive. Data collected on teachers’ instructional practices indicate differences between African American students and their peers. National Assessment of Educational Progress (NAEP) data suggest that most African American students are not experiencing instructional practices consistent with the recommendations suggested by the National Council of Teachers of Mathematics (NCTM), whereas more White students are experiencing NCTM standards-based instruction (Lubienski, 2001).
  • 52.
    Implications The powerand influence of the middle-class, affluent, and more privileged parents plays an important role in deciding who will be in “their kid’s classes.” More often than not, political pressure from parents coupled with low expectations for African Americans in the classroom by teachers, counselors, and administrators result in homogeneous tracks and ability groups (Russell, 2005).
  • 53.
    Implications Ward (2008)pointed out that mathematics achievement builds to increasing levels of complexity only when the base is solid, and that base is formed from the earliest days of elementary school. Too many elementary school teachers, strong in other subjects and talented in connecting with children, lack the mathematics background needed to prepare students for algebra by the eighth grade. Additional research based training, targeted at the specific skills needed for effective algebra instruction, will be critical and costly.
  • 54.
    Implications The existenceof linear regression equations may become one of the bases for remediation efforts to assure that students pass the mathematics high-stakes test. Administrators and teachers may forestall problems associated with the State of Texas requirement for students to graduate from high school.
  • 55.
    Recommendations for FurtherStudy A study should be conducted to involve representative samples from one or more districts in a similar study to determine if results can be duplicated. A study should be conducted to involve another group of students (Whites, Hispanics, Asians, etc.) in a similar study.
  • 56.
    Recommendations for FurtherStudy A study should be conducted to determine specific activities of the guidance and counseling department in the placement of students not only in mathematics but also in the different core areas of science, English and social studies. A study should be conducted on the quality of mathematics instruction involved in the different tracks.
  • 57.
    Recommendations for FurtherStudy A study should be conducted to predict the performance of African American students in the other core areas. A quantitative study should be conducted with a large random sample of teachers and school counselors regarding the impact of high school mathematics curricula on the mathematics TAKS Exit-Level performance of students.
  • 58.
    Recommendations for FurtherStudy A study should be conducted regarding remediation practices done by the school and the home in preparing students to succeed in the high-stakes tests given by the State of Texas, not only in mathematics but also in the other core areas.
  • 59.
    Challenges & OpportunitiesAlthough African Americans have increased their participation in mathematics and the sciences within the last decade, it is important to note that these advances are still miniscule when compared to those of White students (Russell, 2005).
  • 60.
    Challenges & OpportunitiesThe attitudes and experiences of many school personnel need to change, too. I have been on campuses and in classrooms throughout the state, and it is consistent from one end to the other: certain students are seen as algebra- ready, and certain students are not. It’s no mystery: Asian and White students on one hand; Latino, African American and poor students of all ethnicities on the other. But they are not ready. This is the common and perfectly honest explanation. But it is our job to make them ready. It is work we have chosen. It is our responsibility (Ward, 2008).
  • 61.
    REFERENCES Berry, R.Q., III. (2003). Voices of African American male middle school students: A portrait of successful middle school mathematics students . Unpublished Doctoral Dissertation. University of North Carolina at Chapel Hill, Chapel Hill, NC. Burris, C. C., Heubert, J. P., & Levin, H. M. (2006). Accelerating mathematics achievement. Educational Research Journal, 43 (1), 105-136. Darling-Hammonds, L. (2000). New standards and old inequalities: School reform and the education of African American students. The Journal of Negro Education , 69 (4), 263-287.
  • 62.
    REFERENCES Lubienski, S.T. (2001, April). A second look at mathematics achievement gaps: Intersections of race, class, and gender in NAEP data. Paper Presented at American Educational Research Association, Seattle, WA. McCoy, L. P. (2005). Effect of Demographic and personal variables on achievement in eighth-grade algebra. Journal of Educational Research, 98 (3), 131-135. National Council of Teachers of Mathematics. (2000). Principles and standards for school mathematics. Reston, VA: NCTM. Report highlights importance of middle school math (2003). Black Issues in Higher Education , 20 (19), 11.
  • 63.
    REFERENCES Rubin, B.C., & Norguera, P. A. (2004). Tracking detracking: Sorting through the dilemmas and possibilities of detracking in practice. Equity & Excellence, 37 , 92-101. Russell, M. L. (2005). Untapped talent and unlimited potential: African American students and the science pipeline. The Negro Educational Review, 56 (2/3), 167-182. Texas Education Agency ( 2005 ). Accountability System State Data Table 2005. Austin, TX: Author. Retrieved January 25, 2006, from http://www.tea.state.tx.us/perfreport/account/2005/state.html Ward, R. (2008, July 23).Our expectations for all children. The San Diego Union-Tribune. p. A18.
  • 64.
    Thank You !!!For listening to my presentation! Have a wonderful day!!!