Download as PDF, PPTX

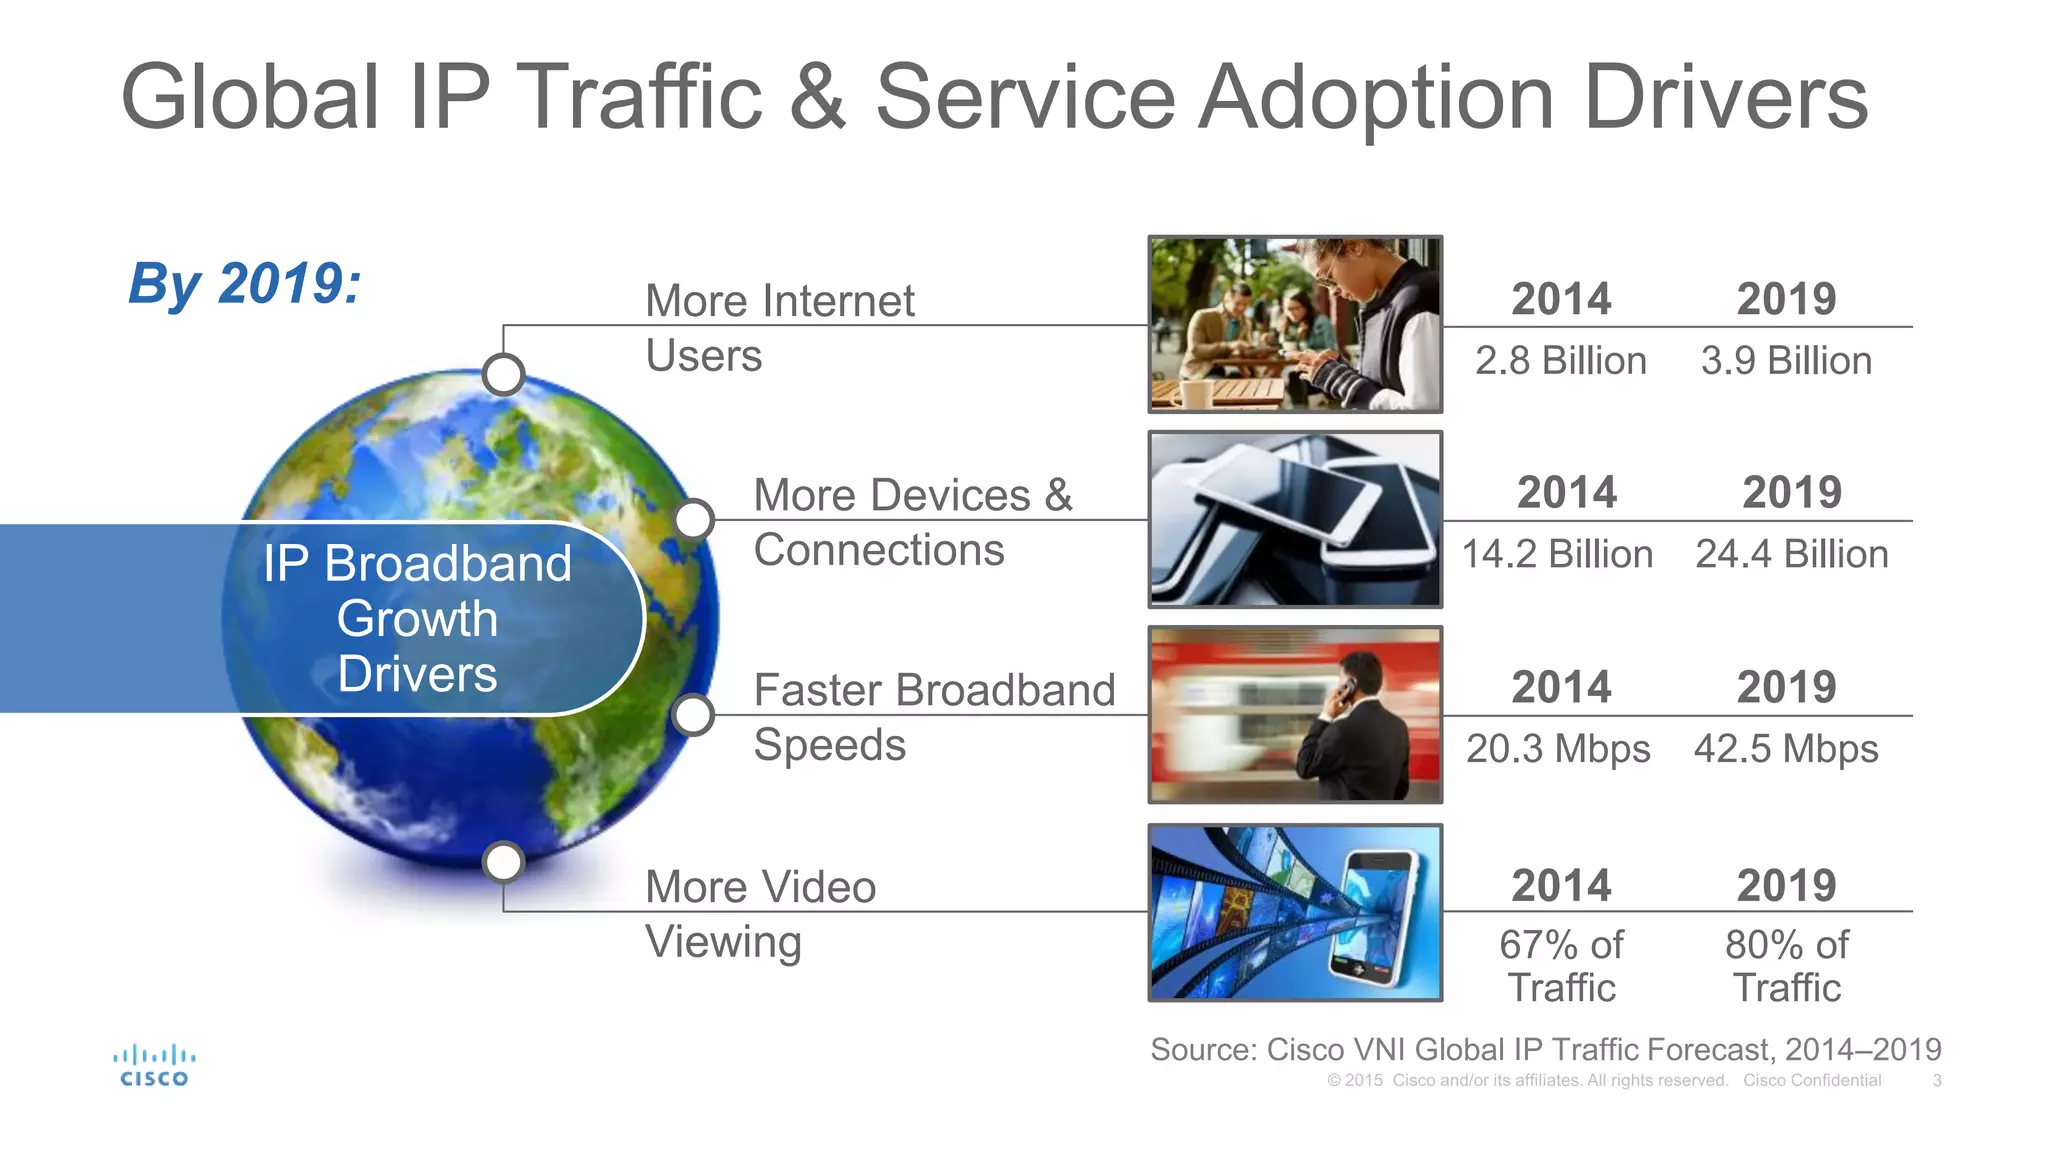


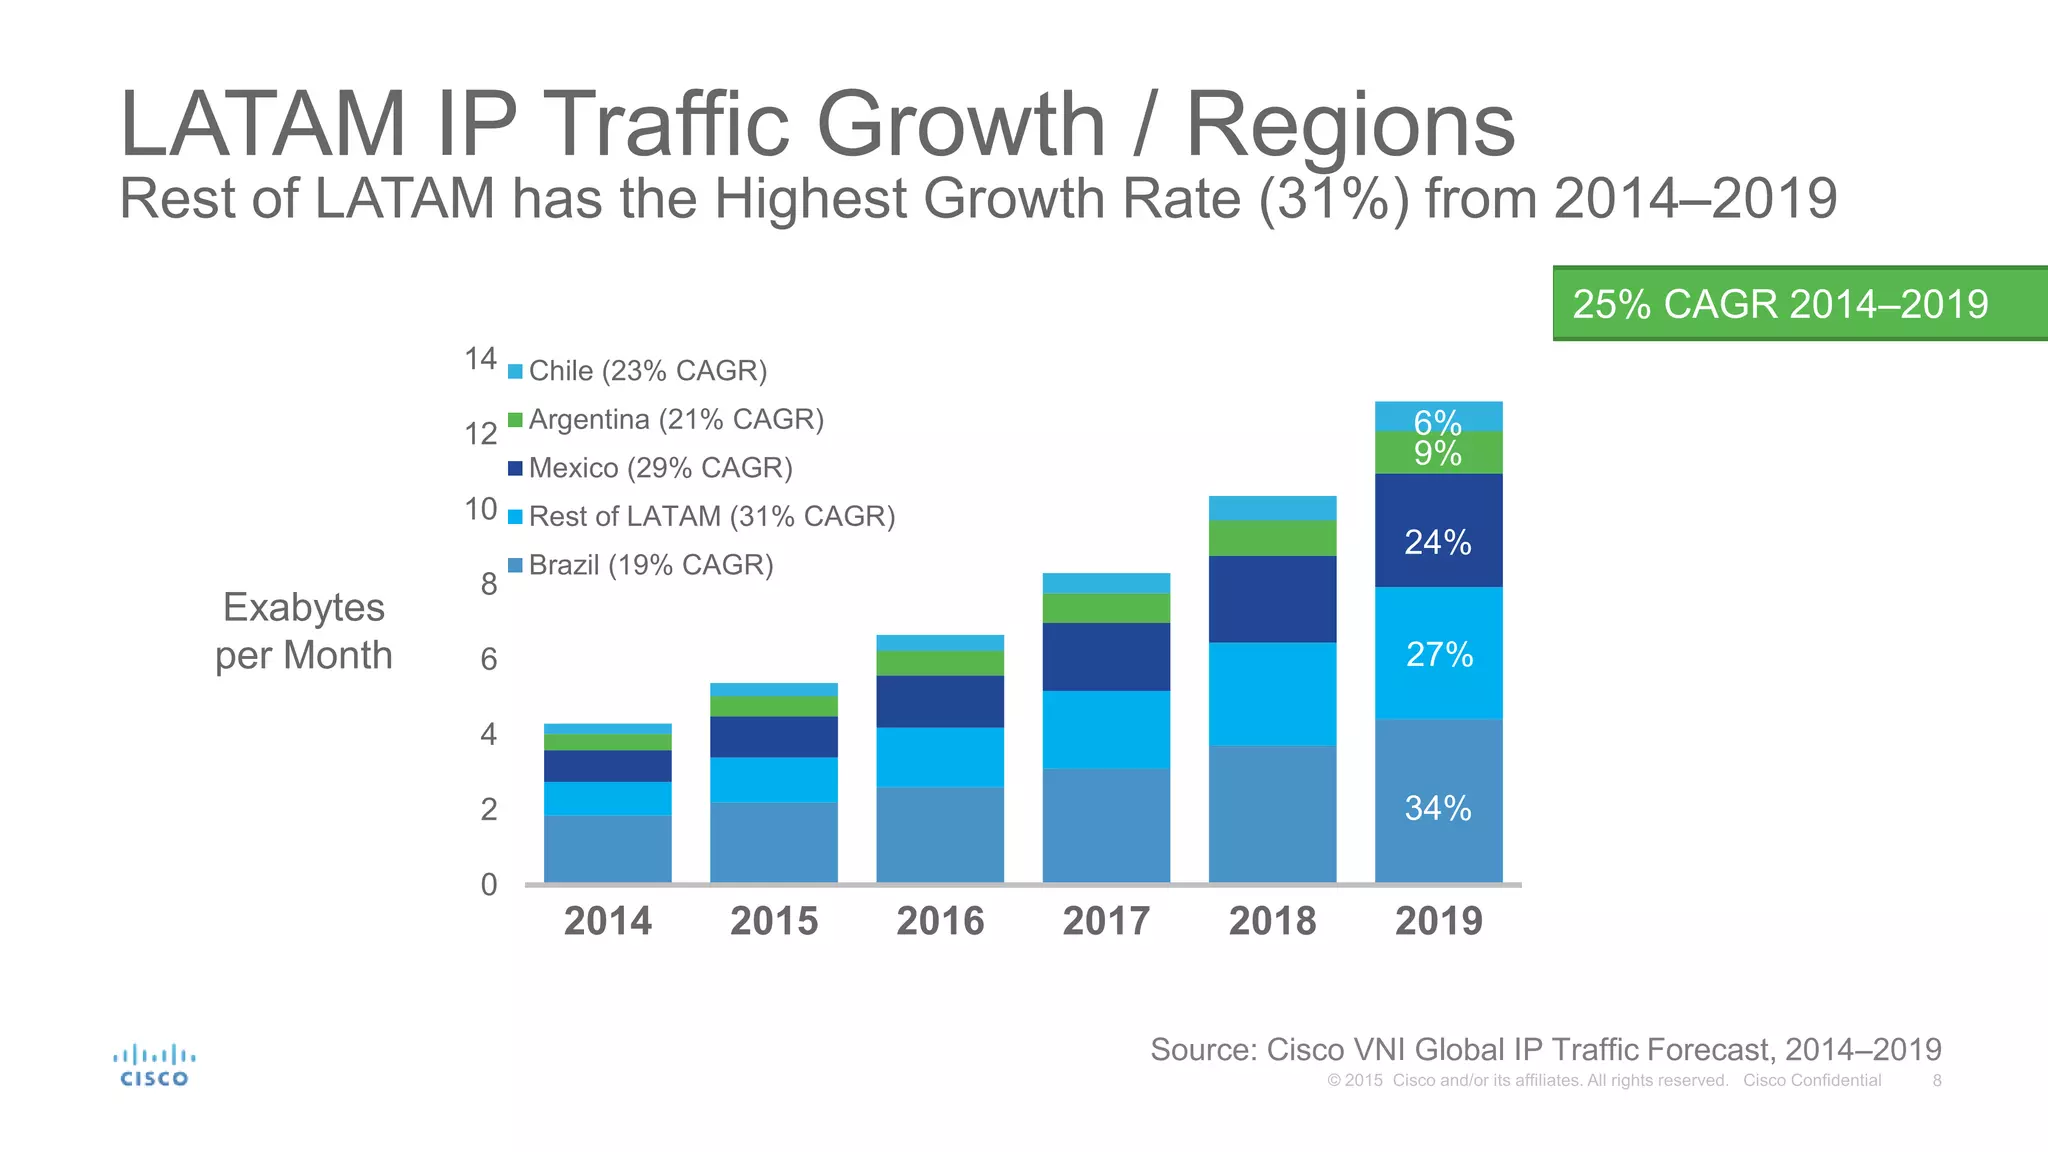
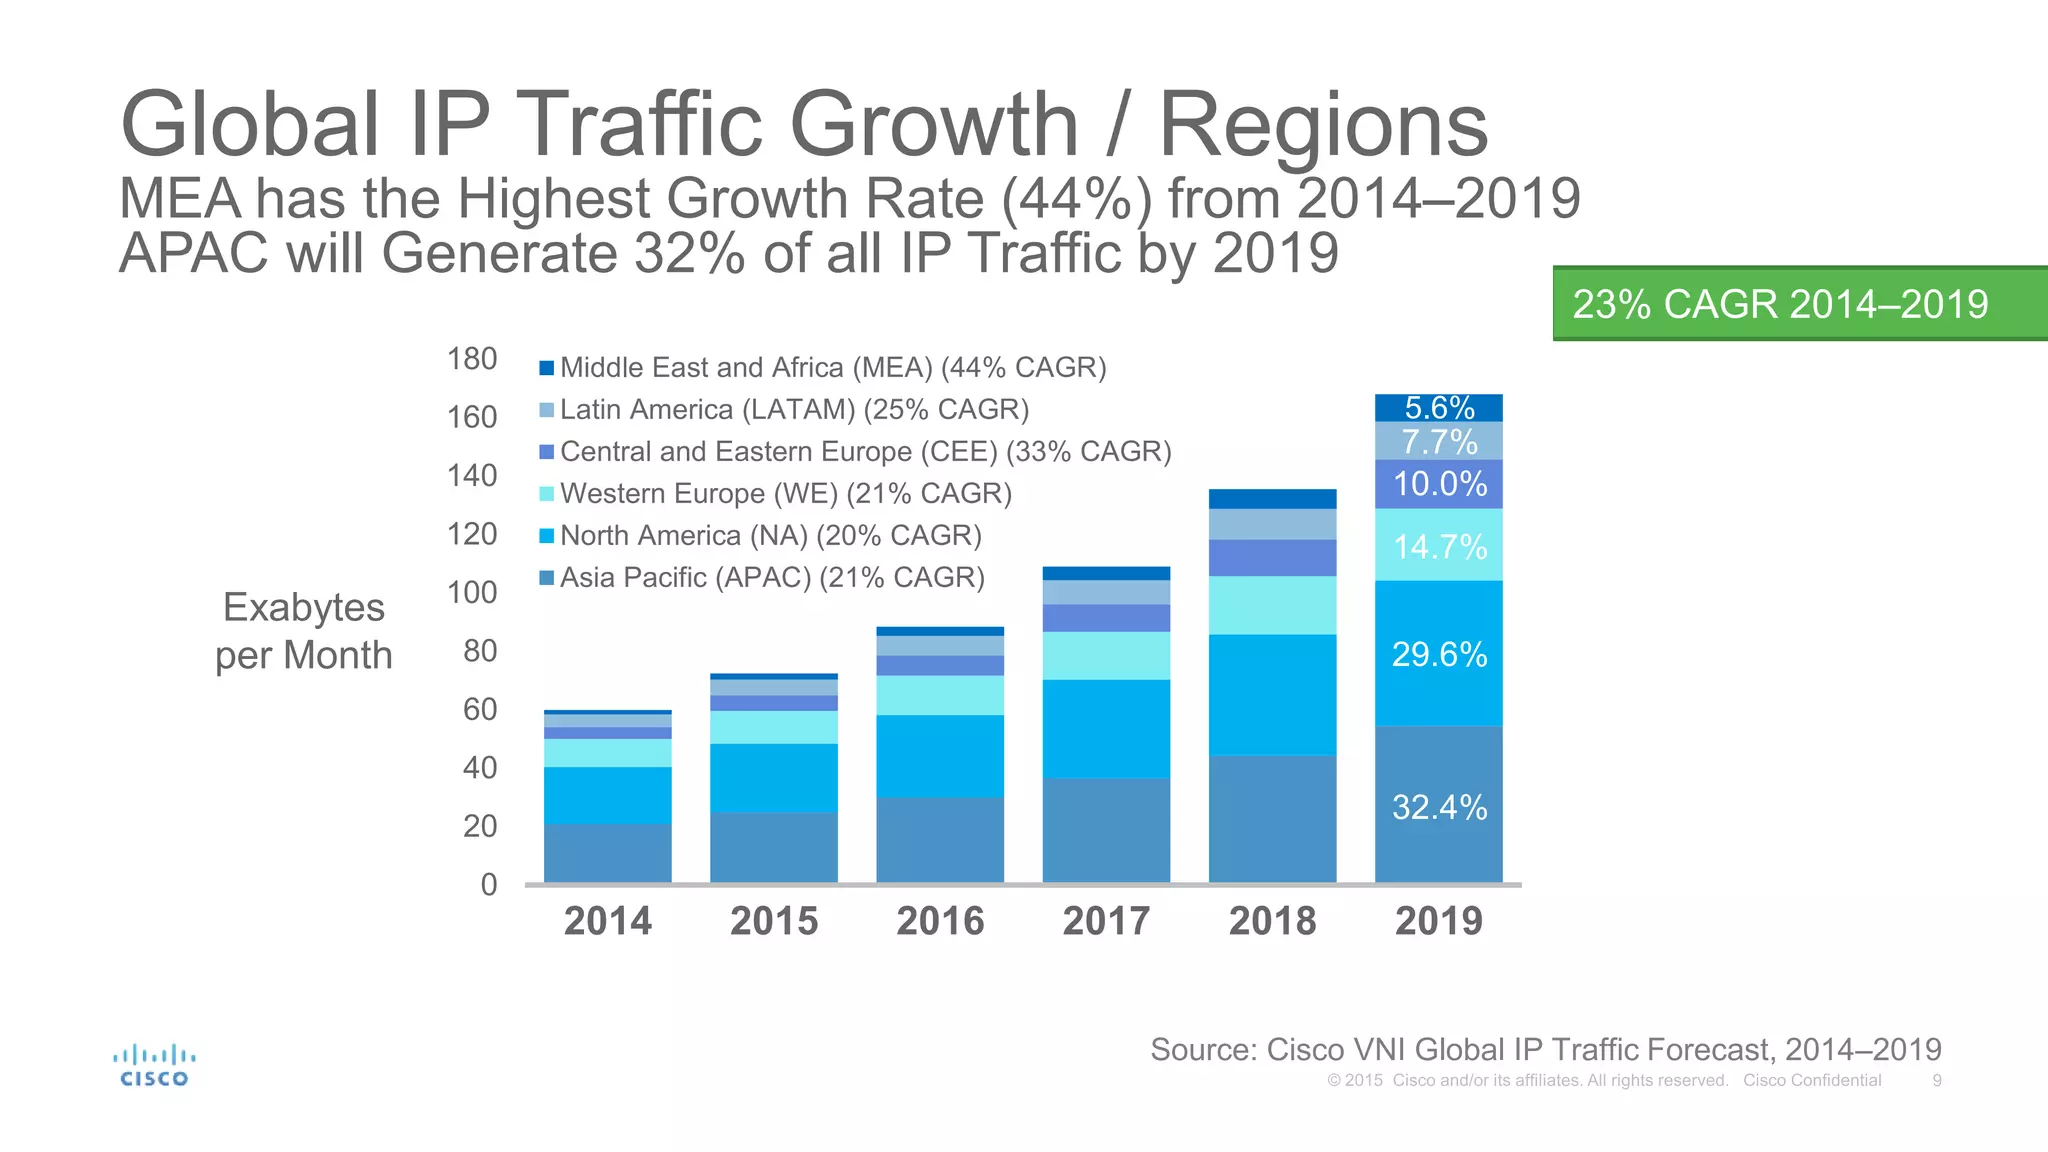

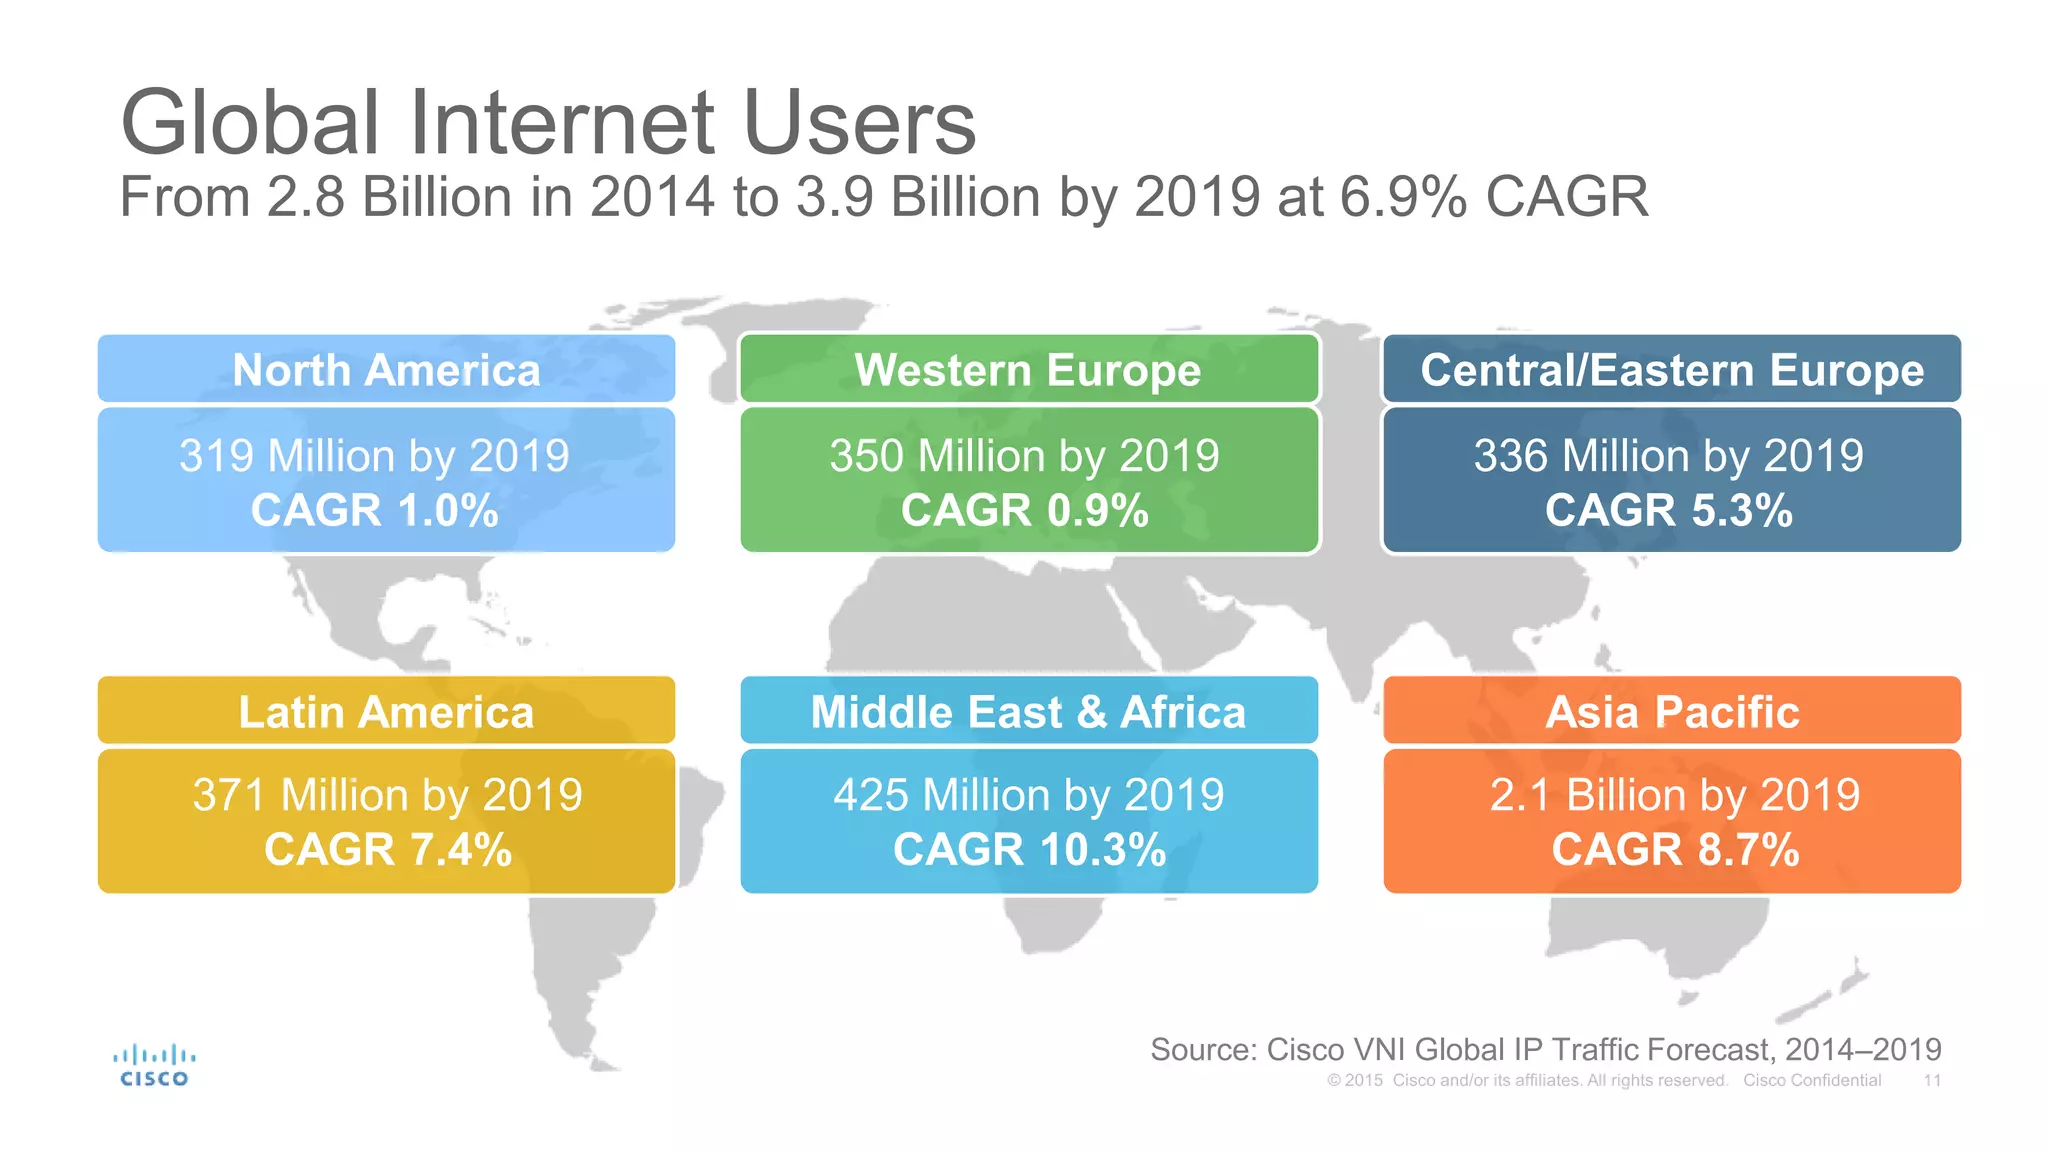
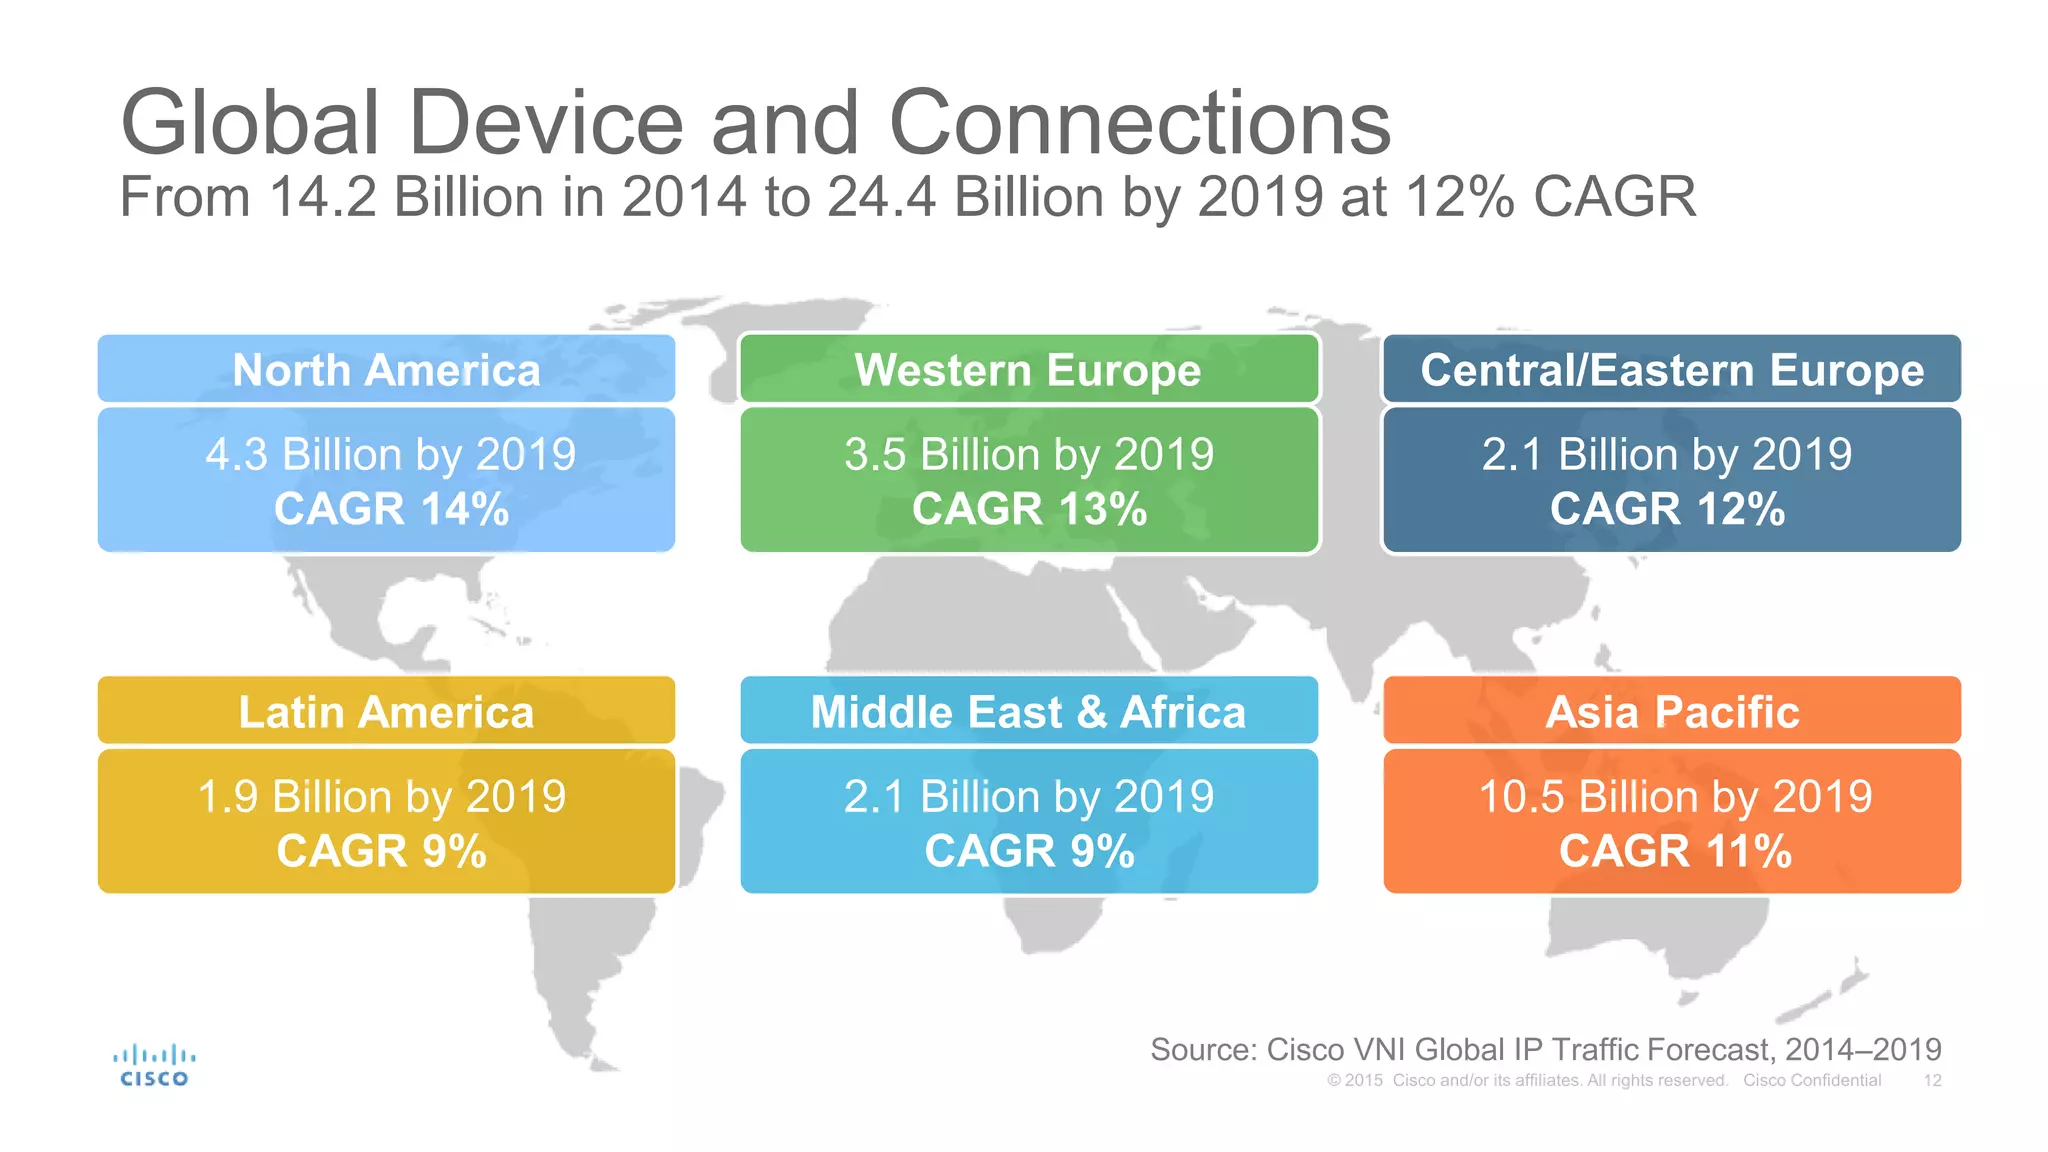
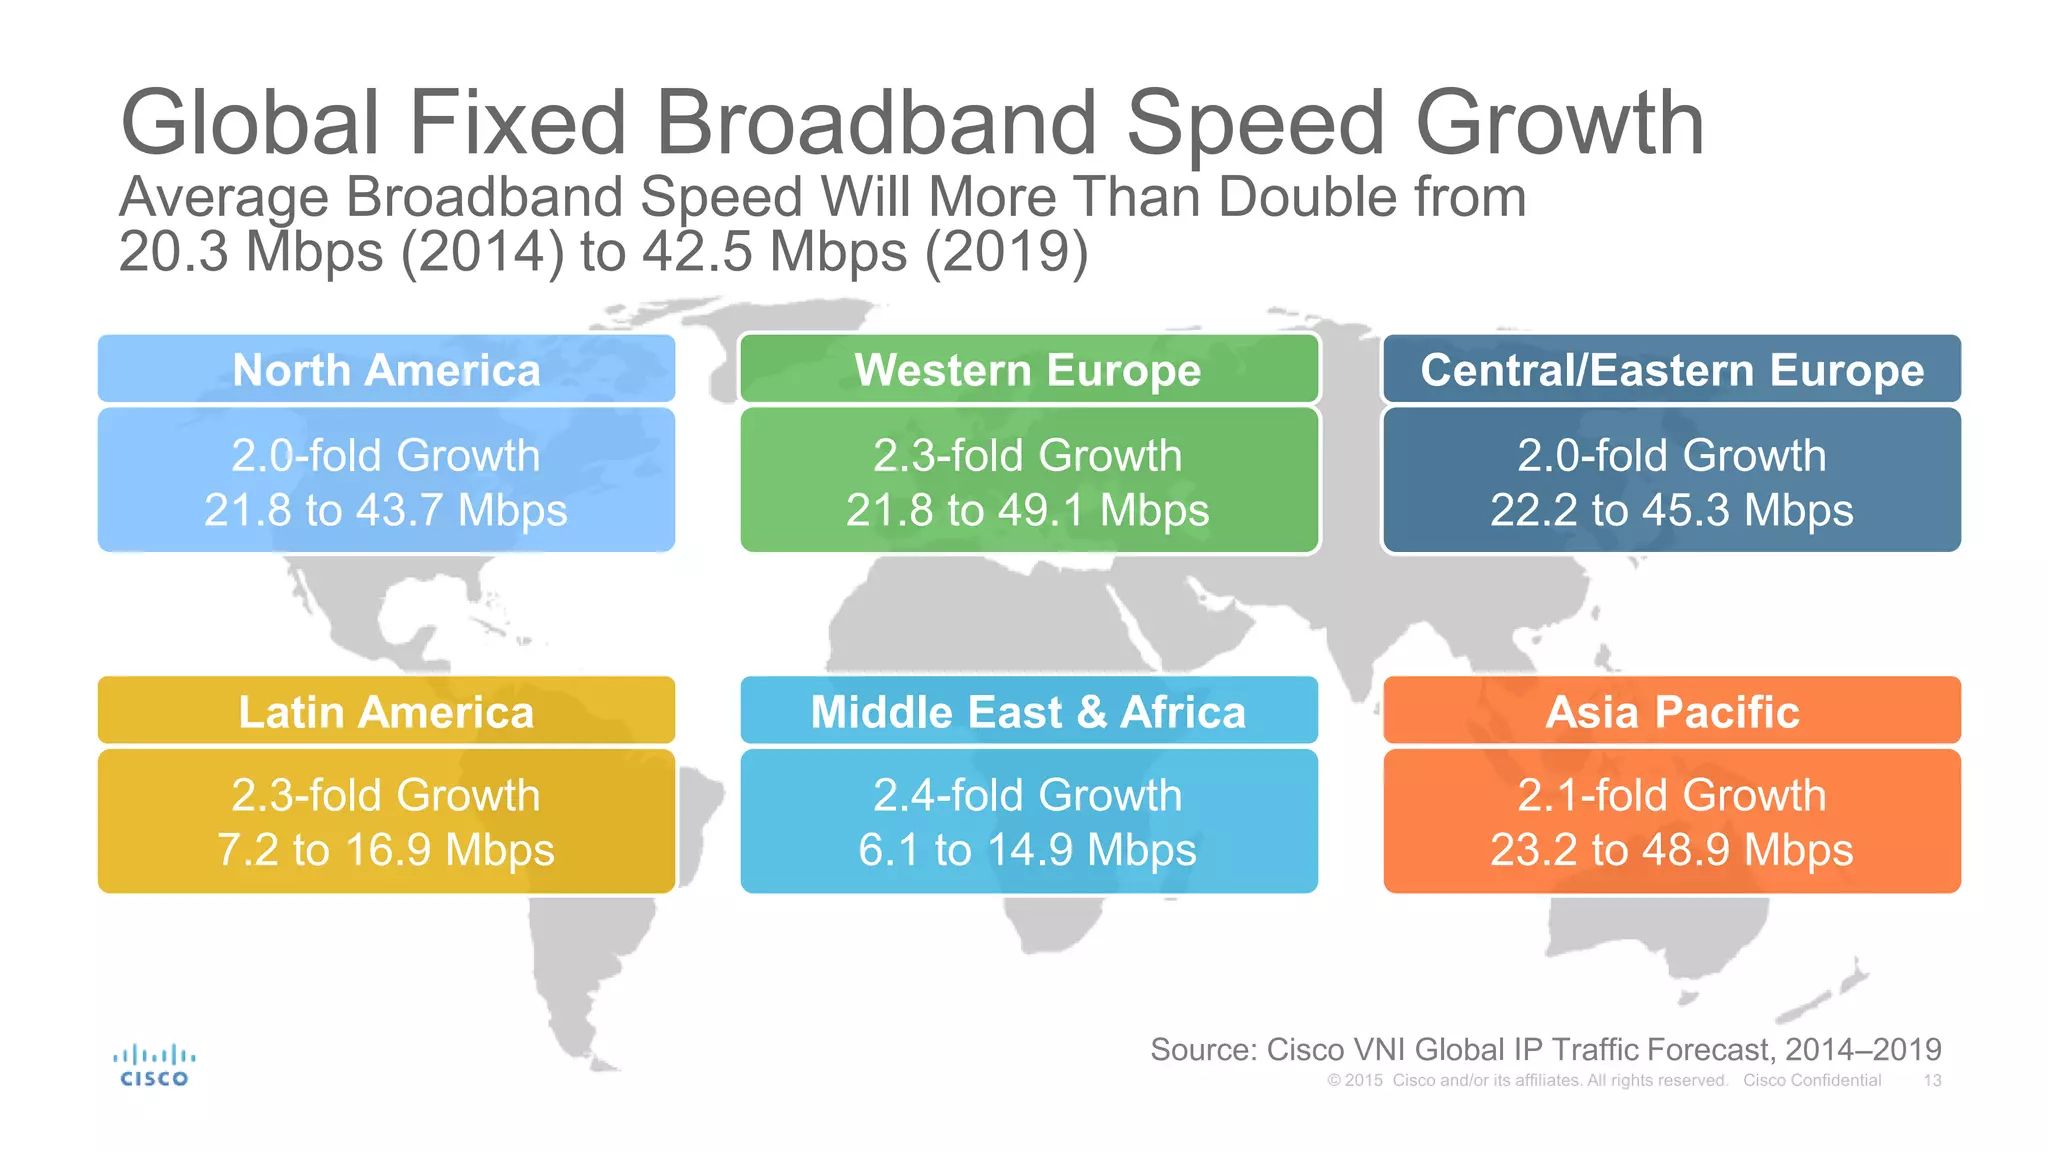
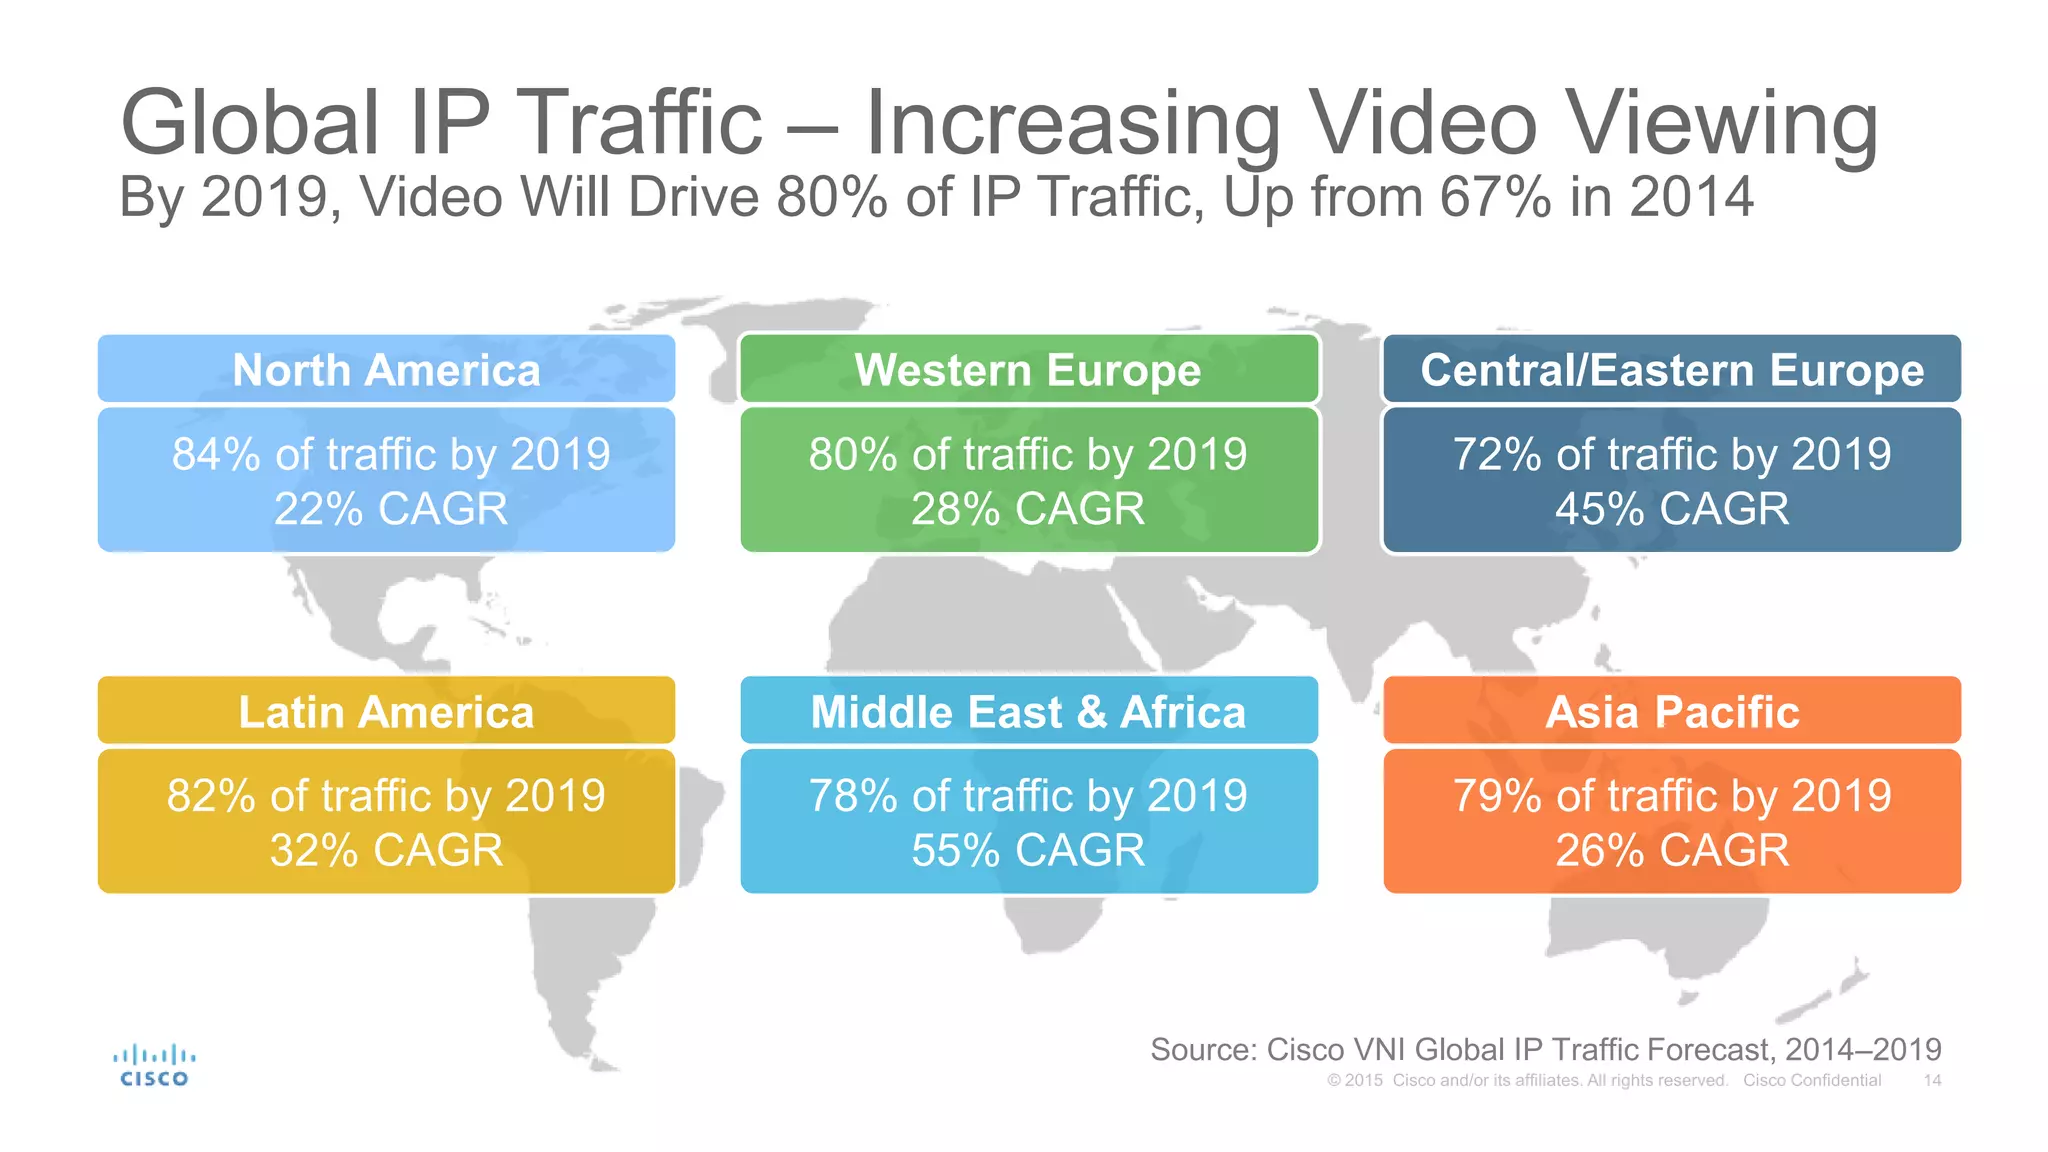


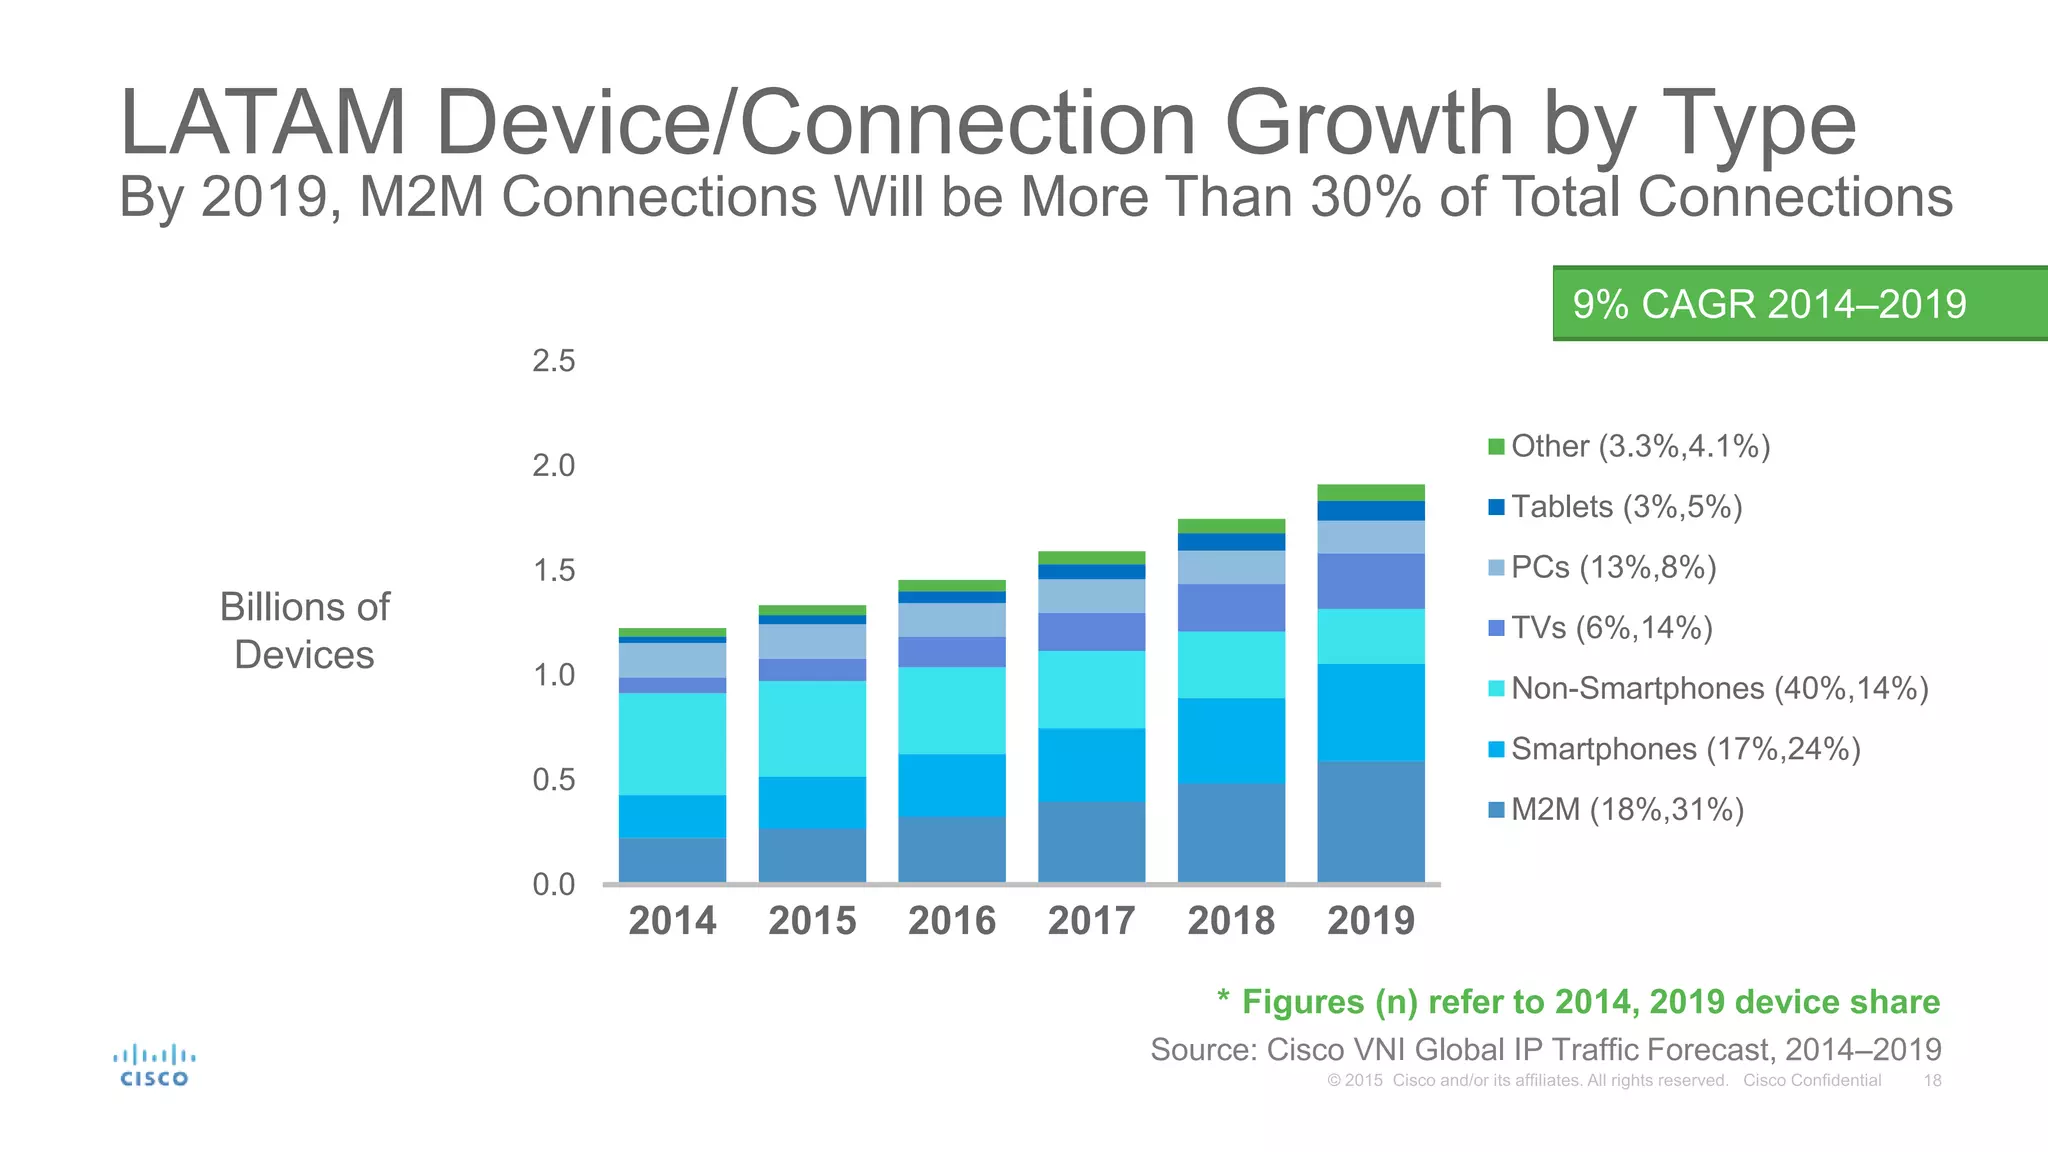
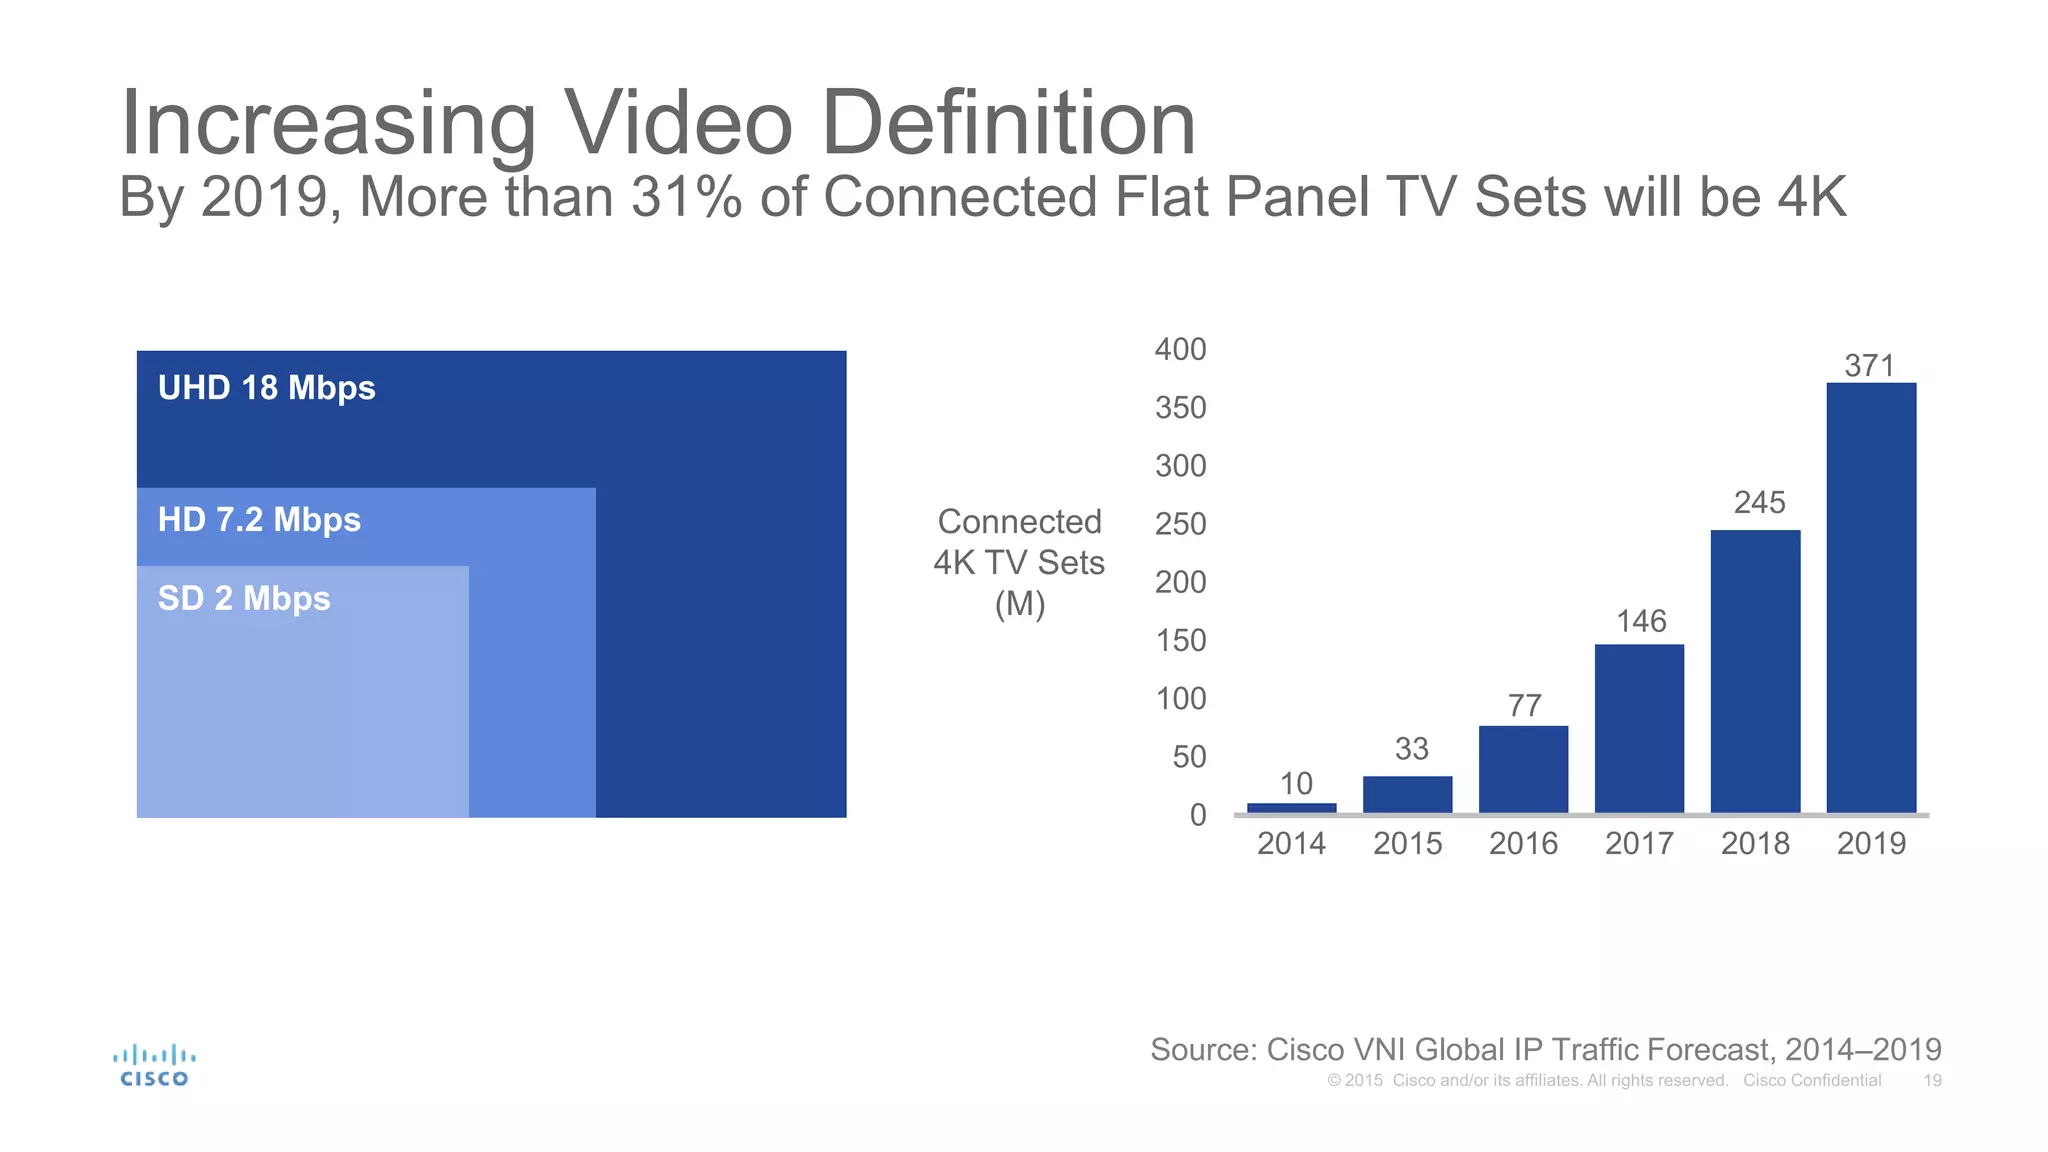
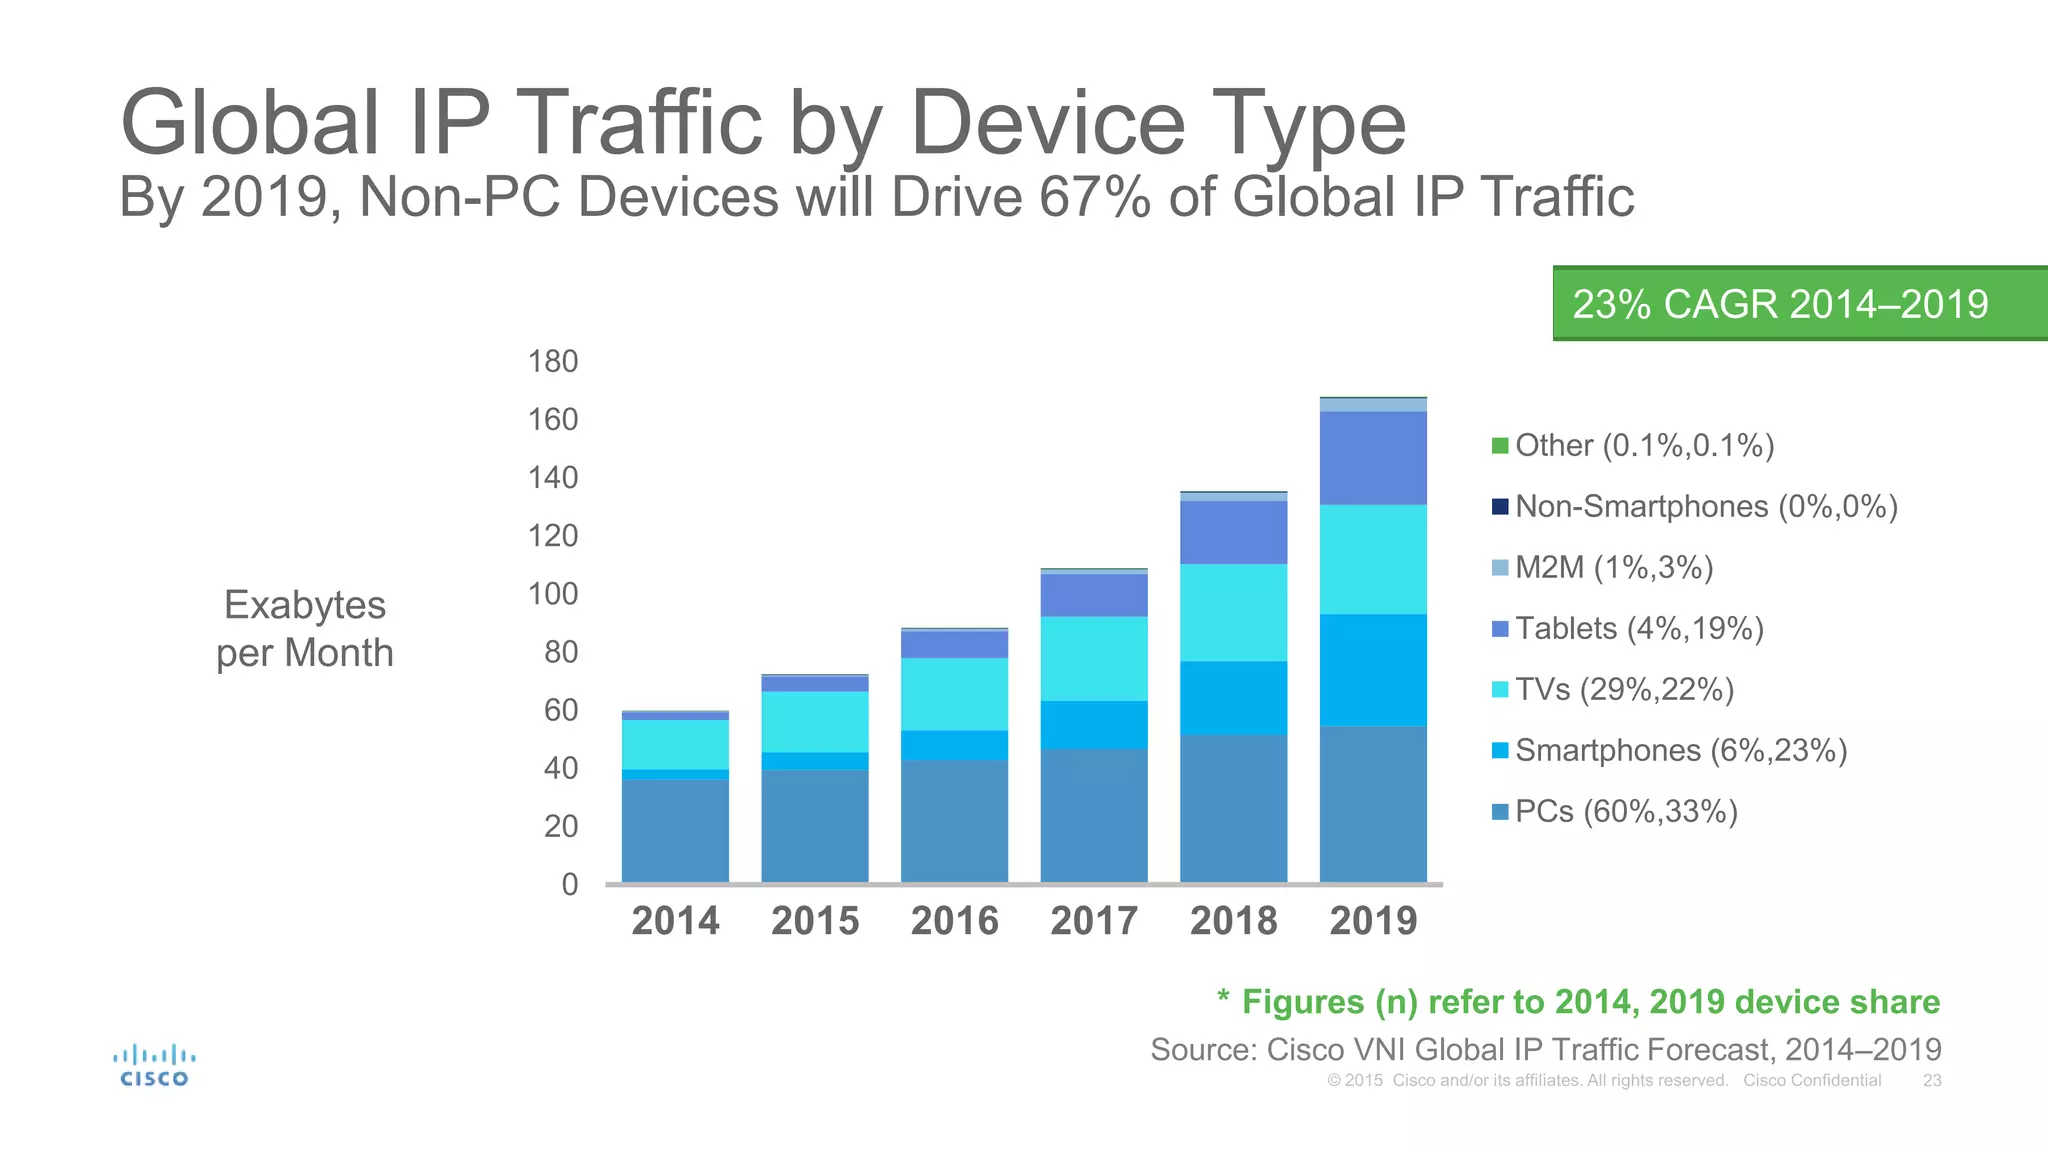
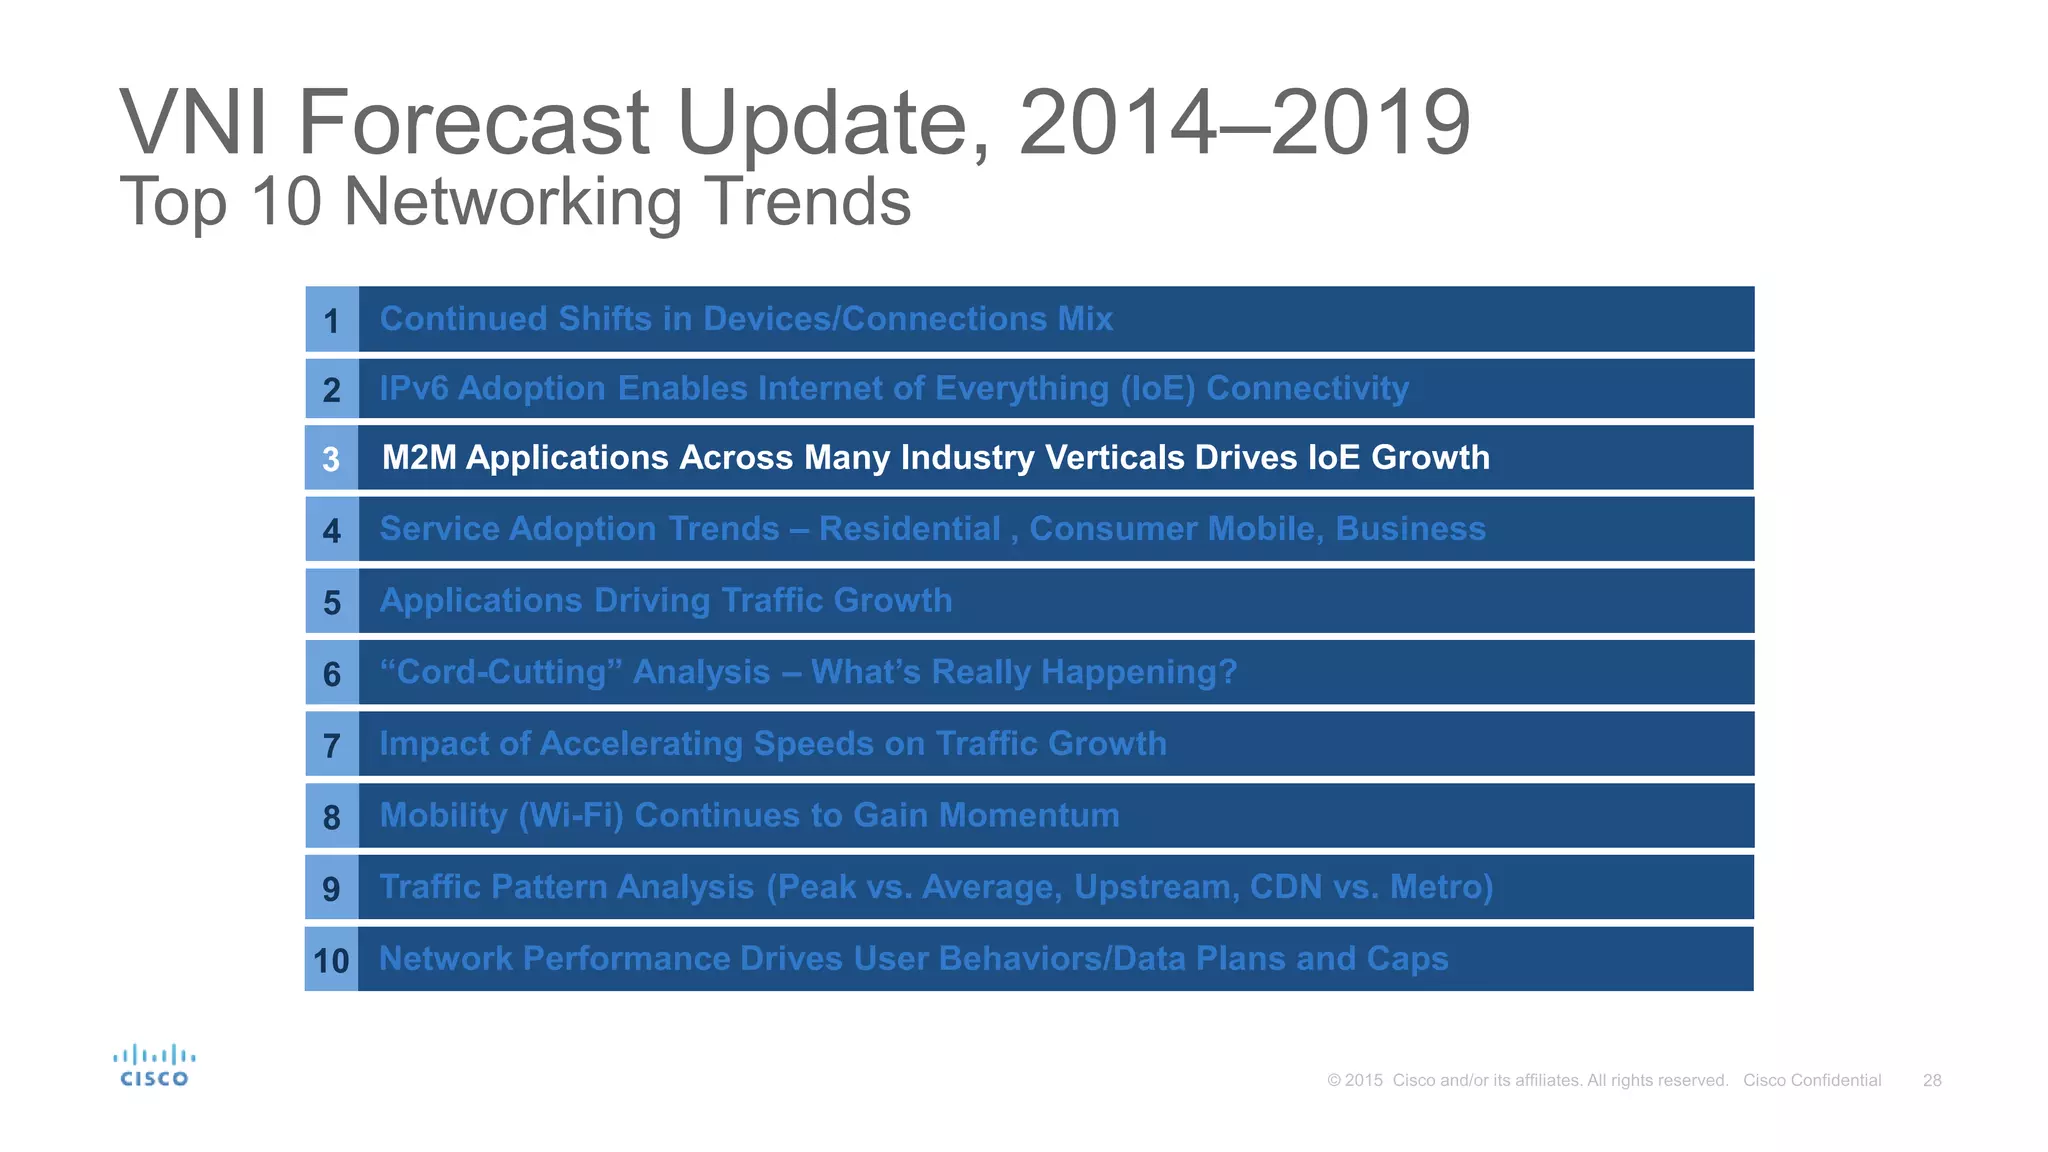
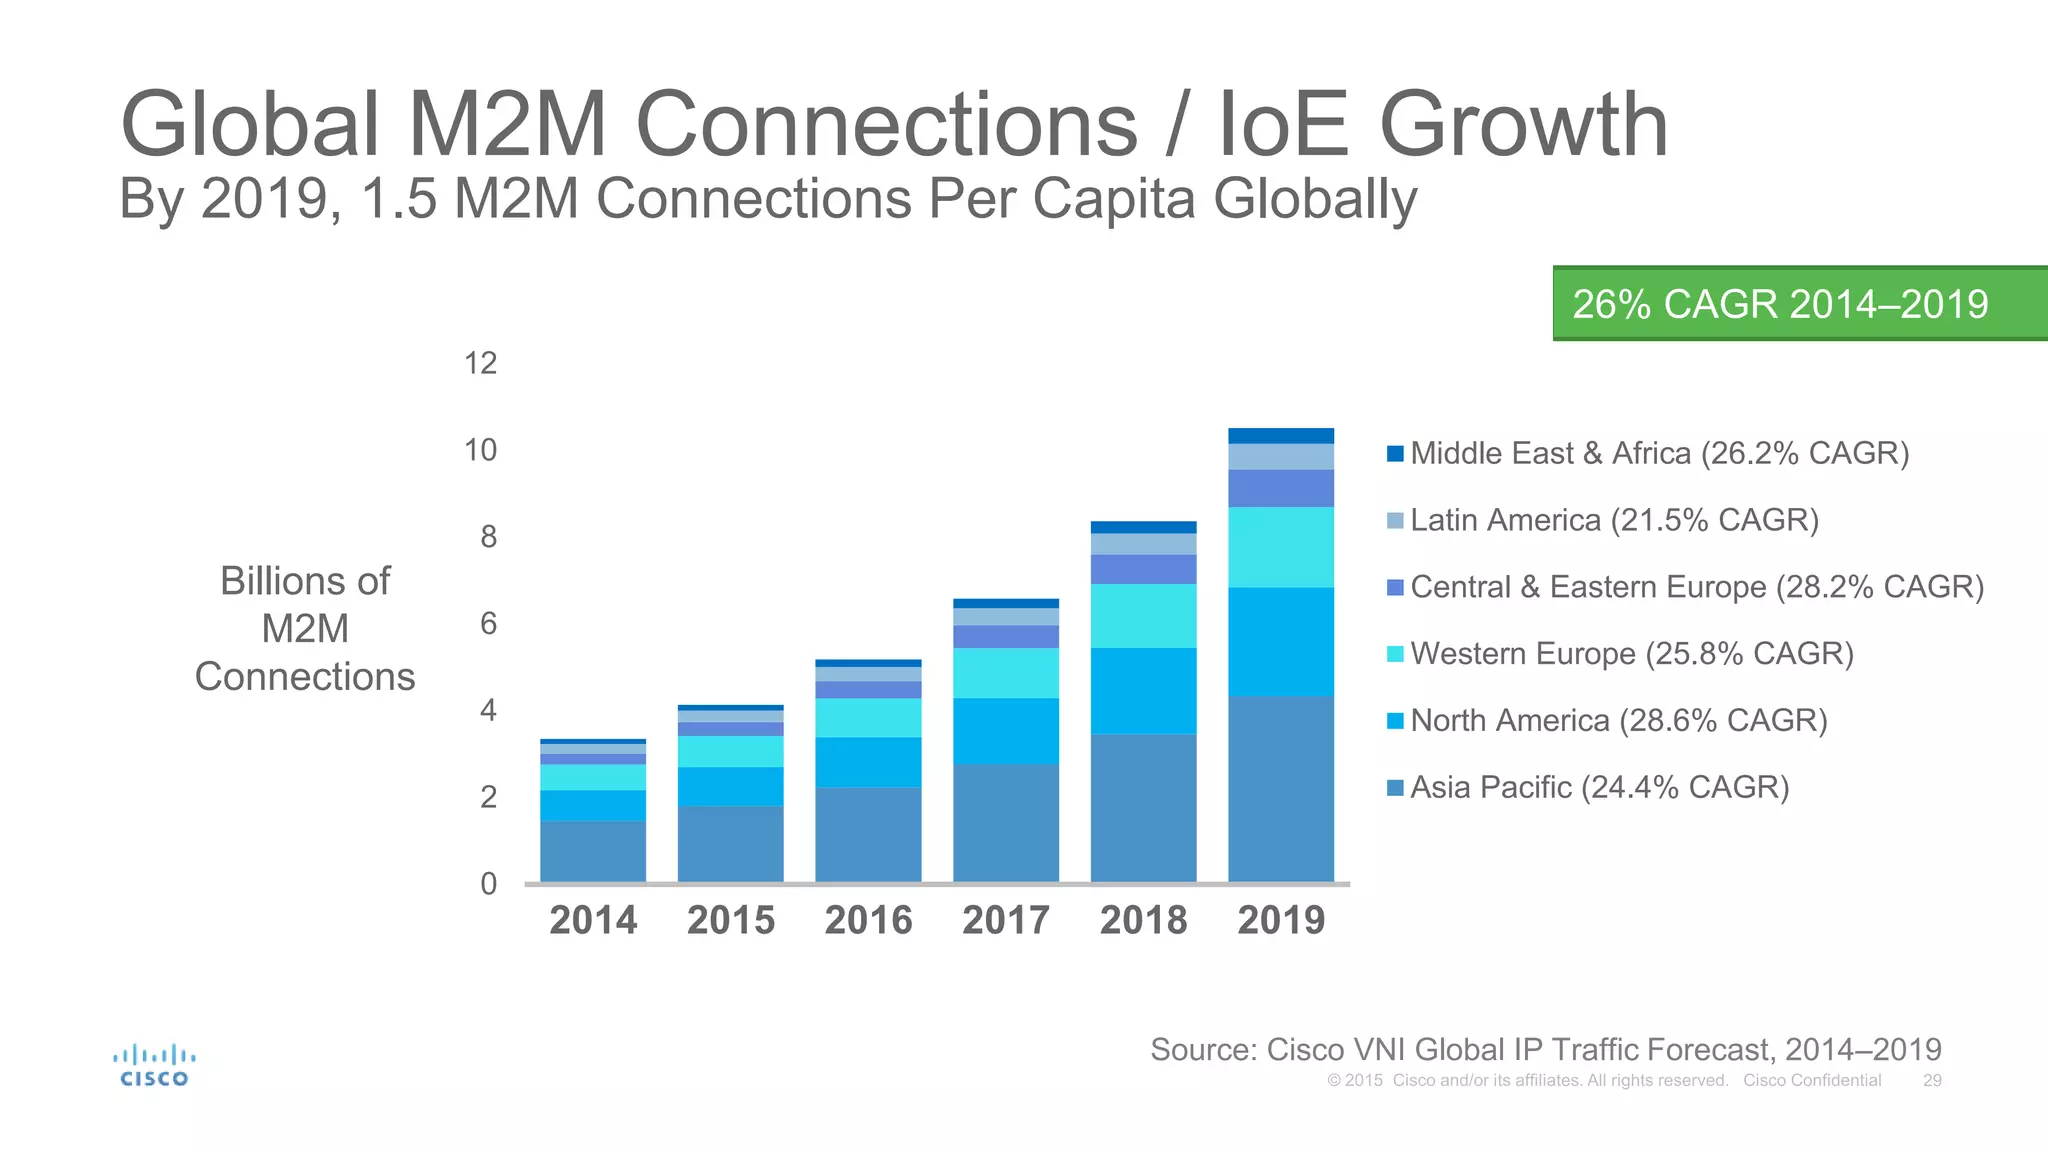

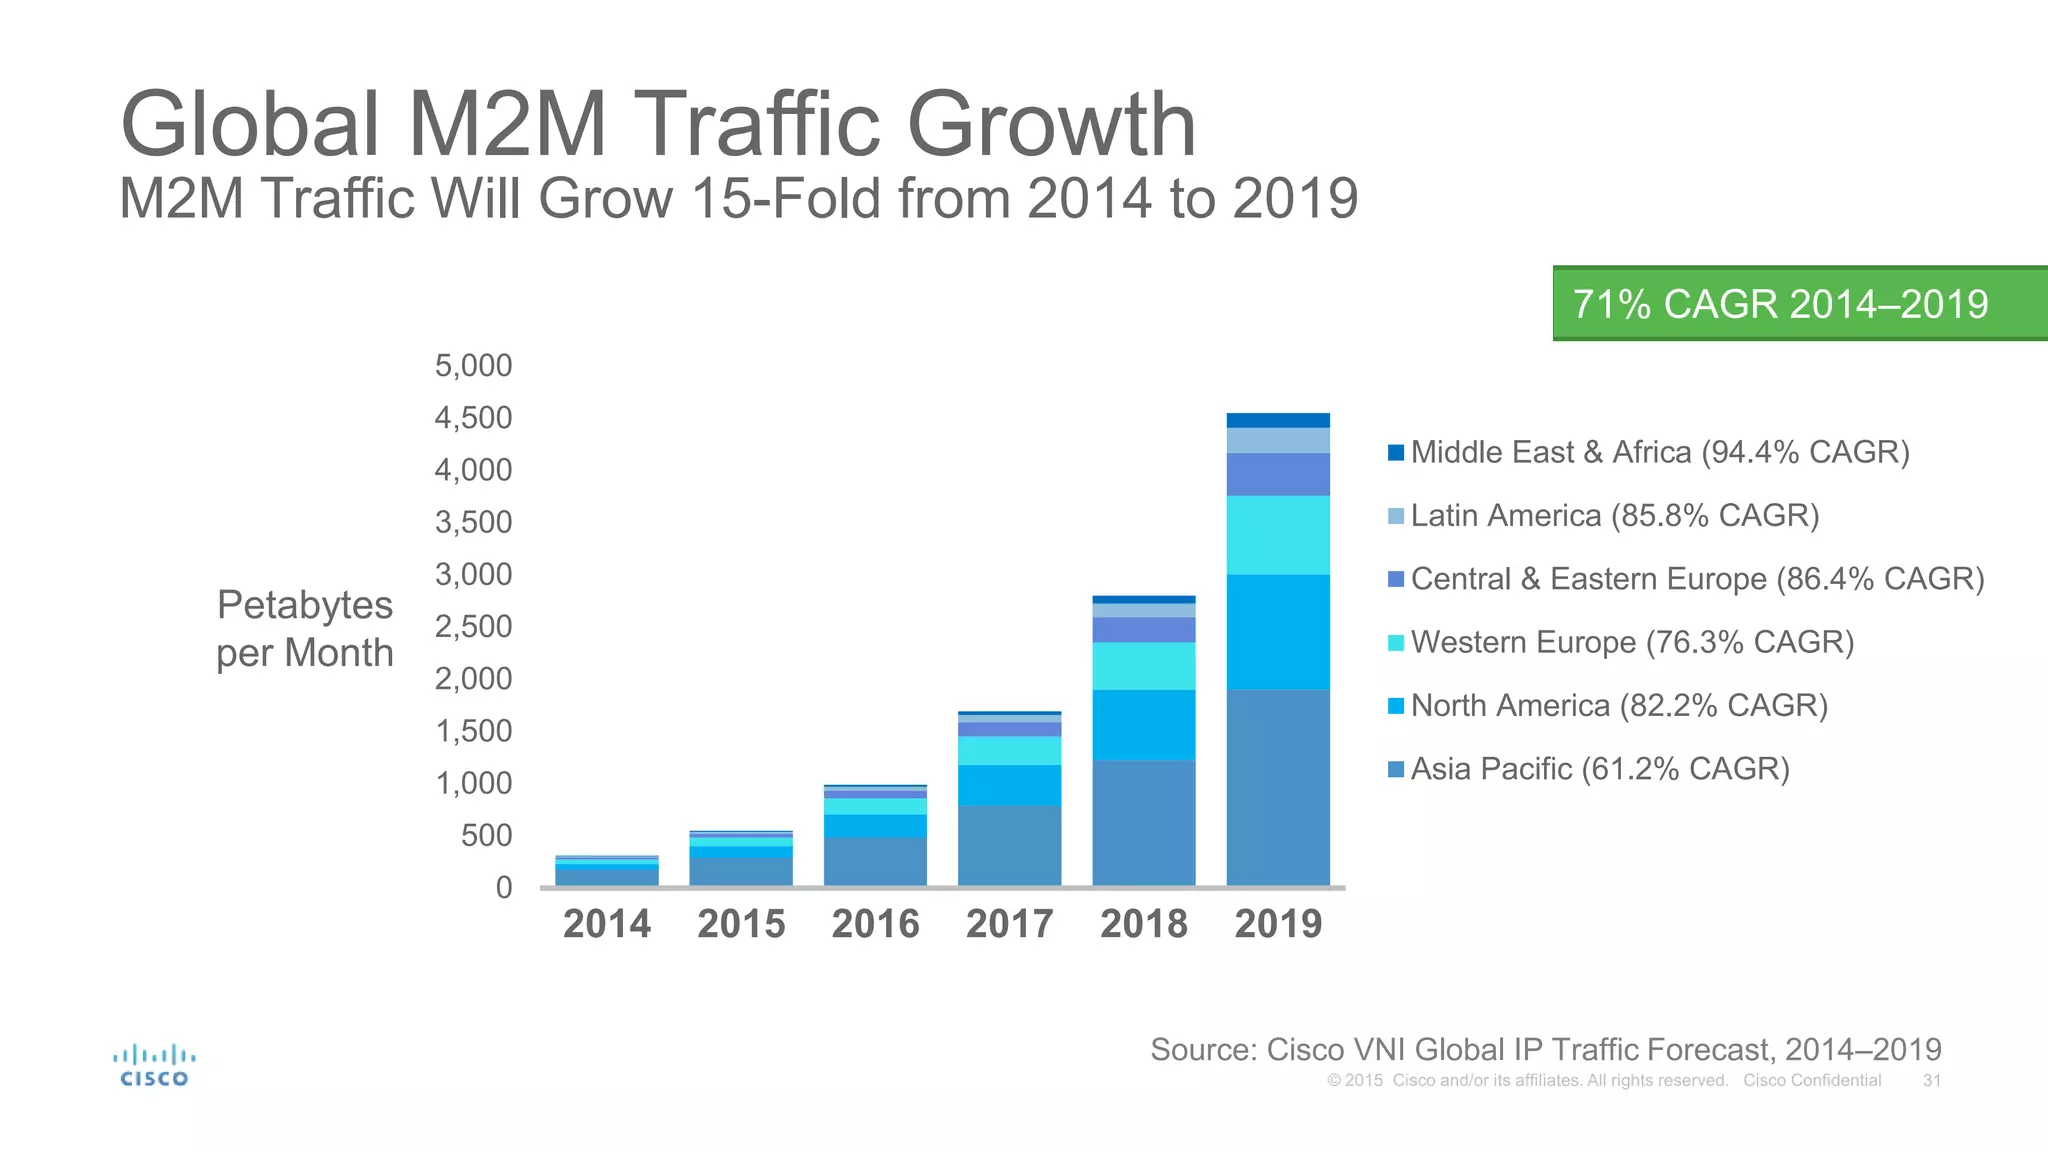
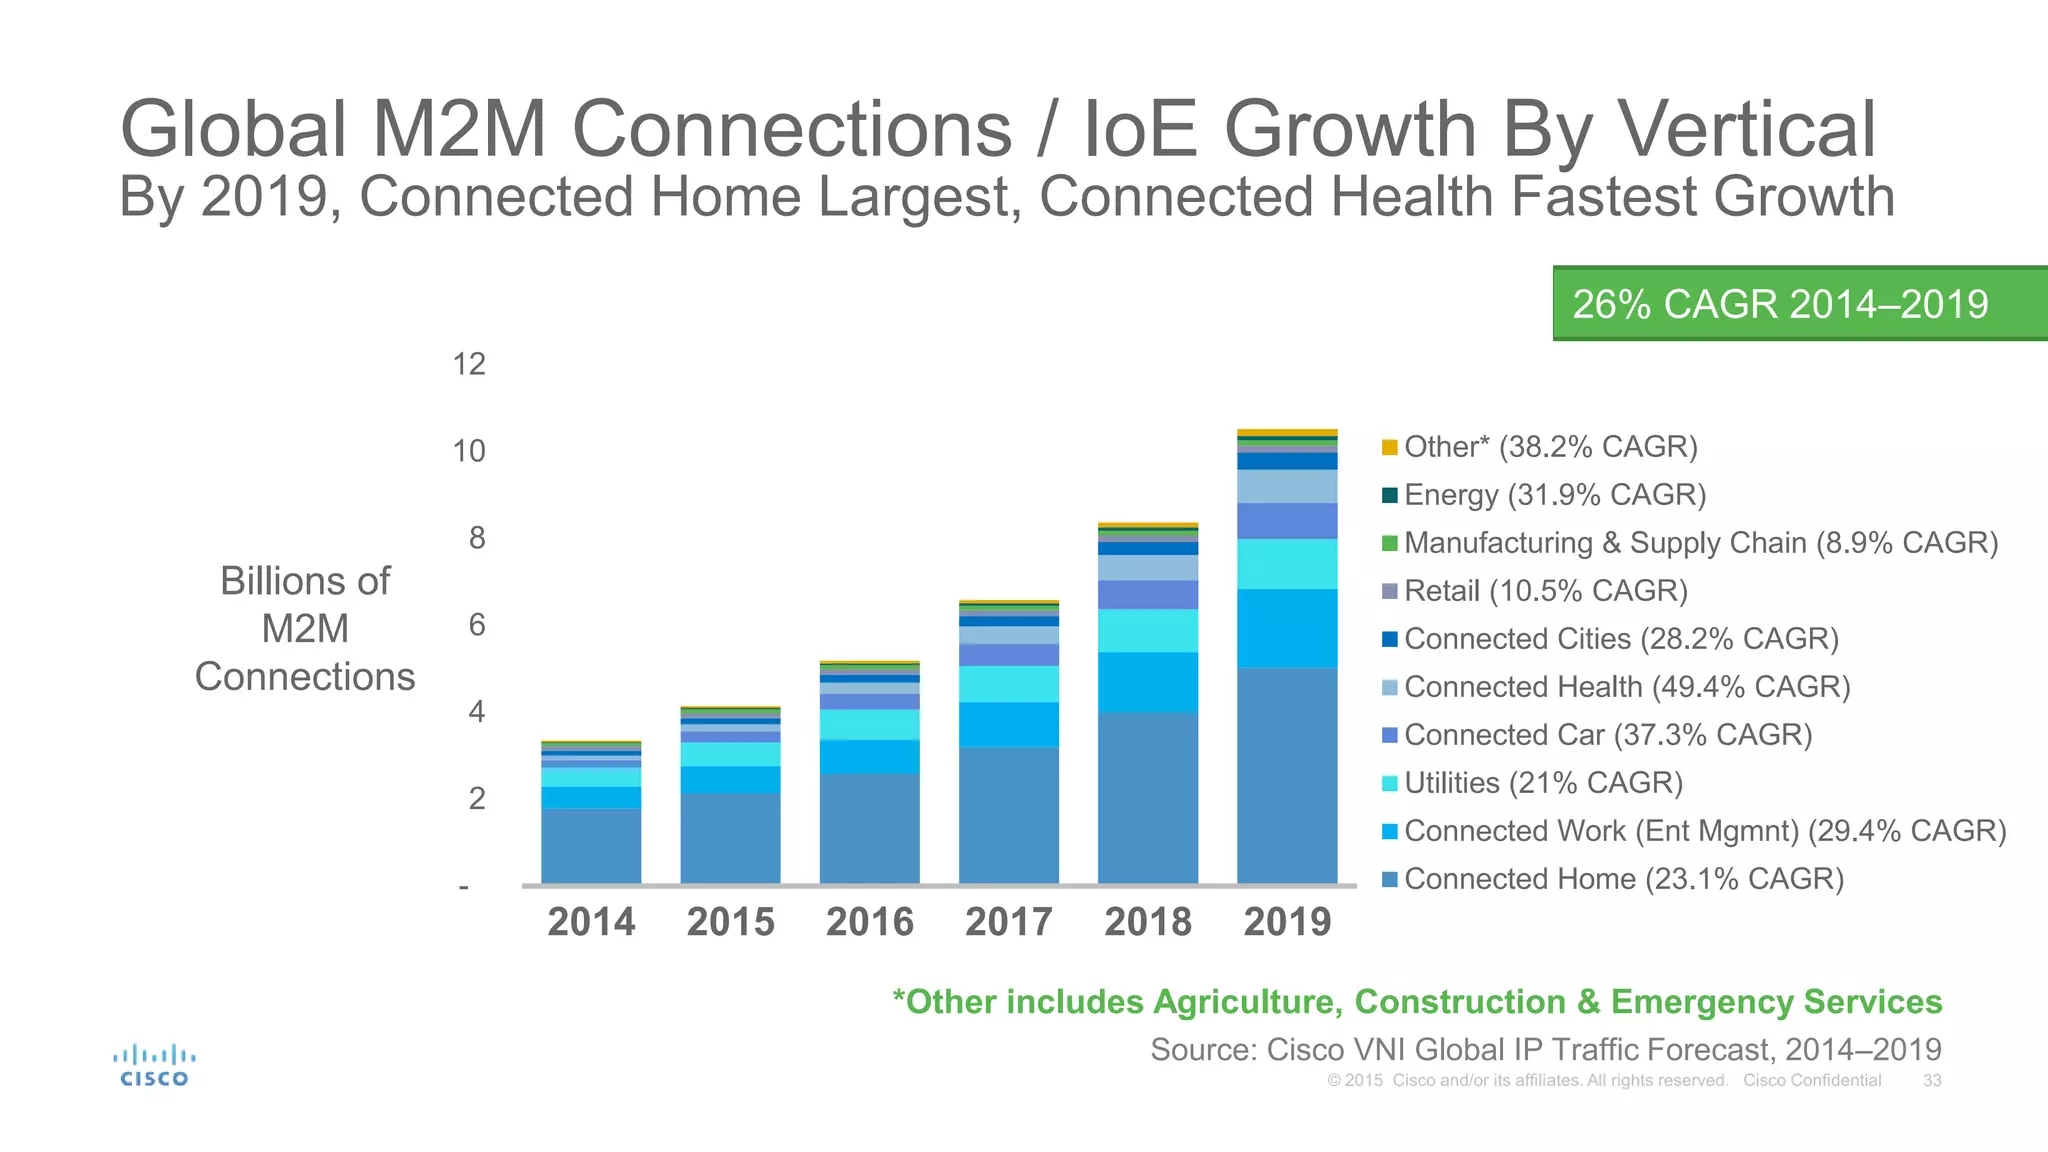
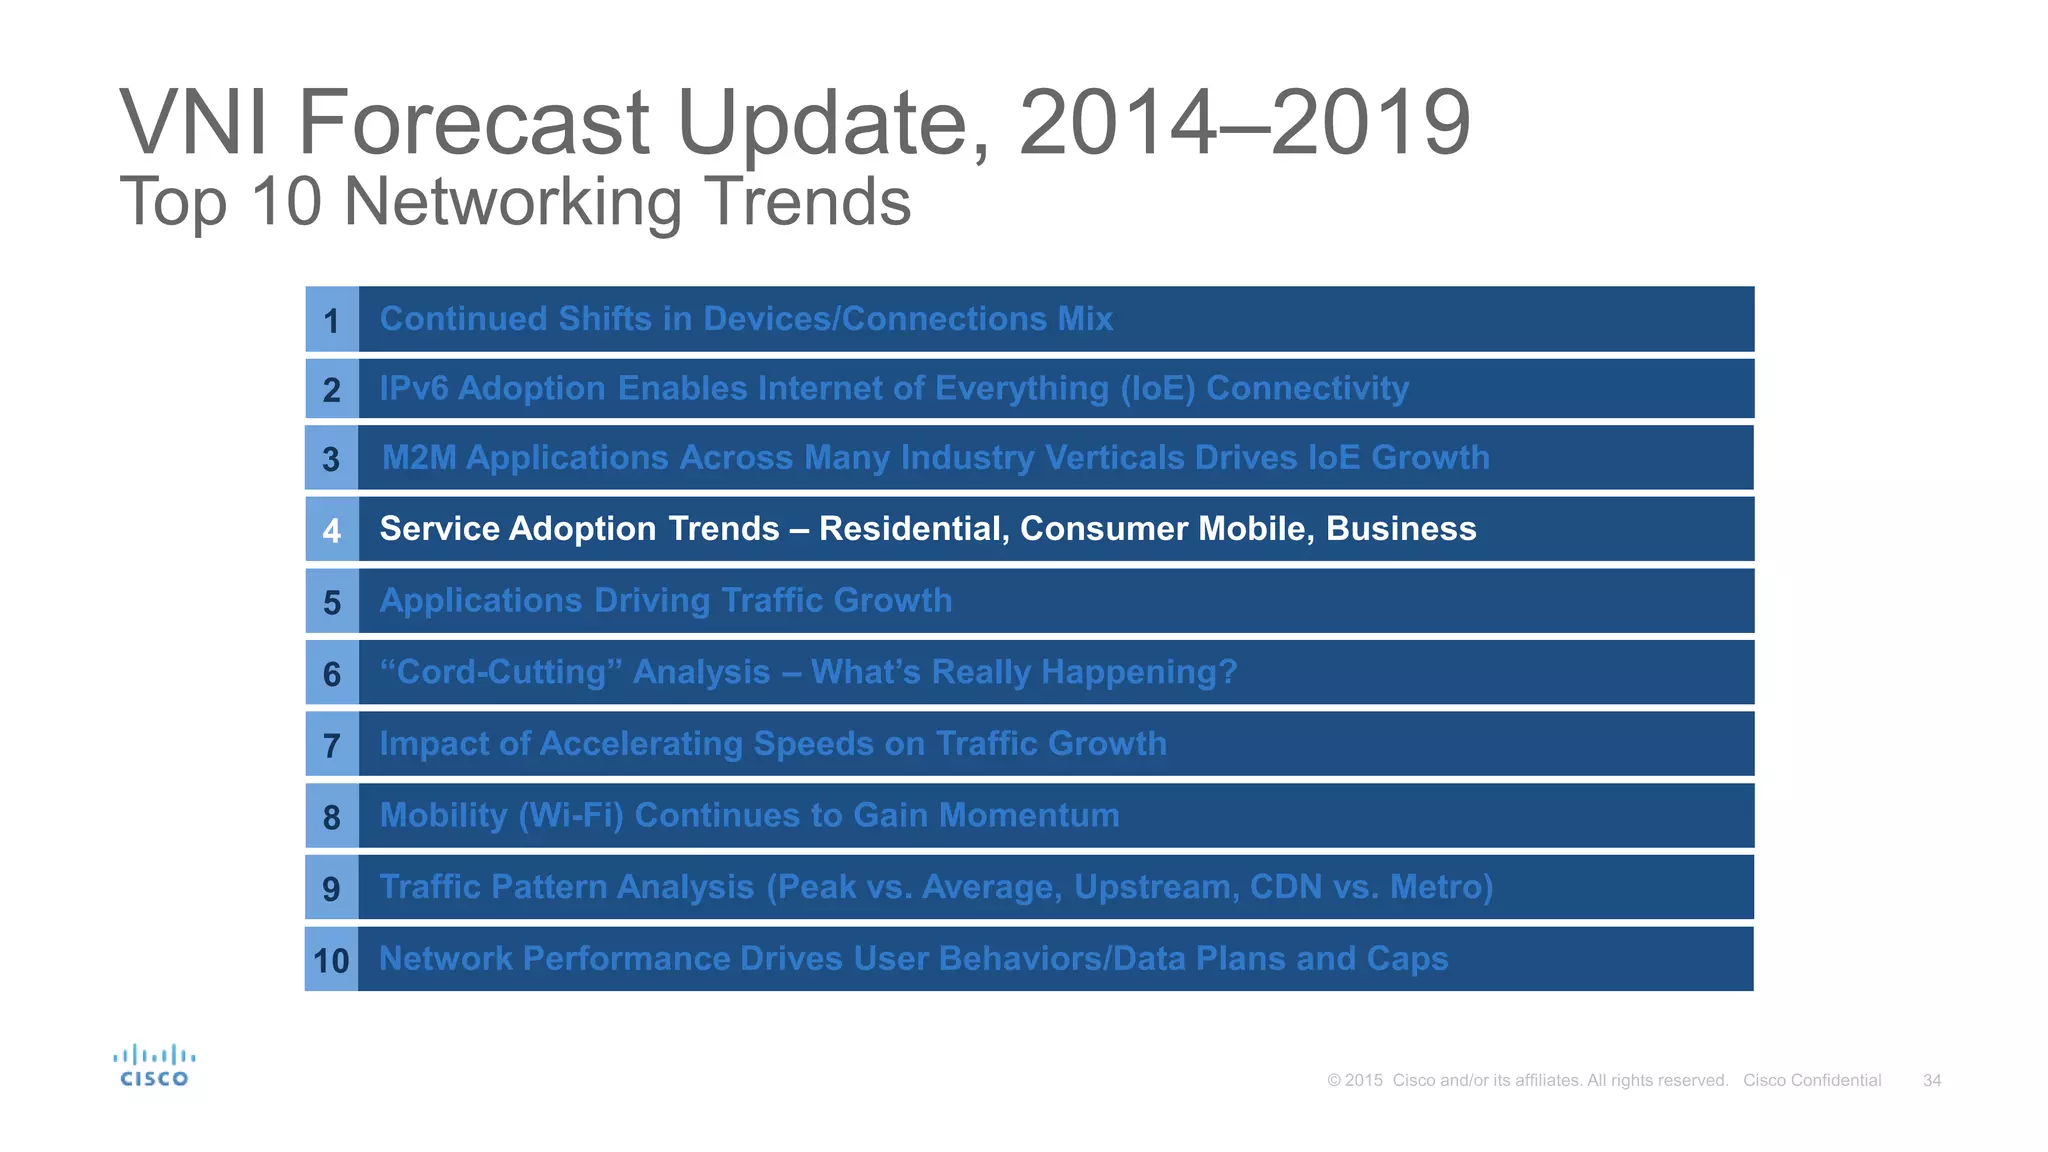
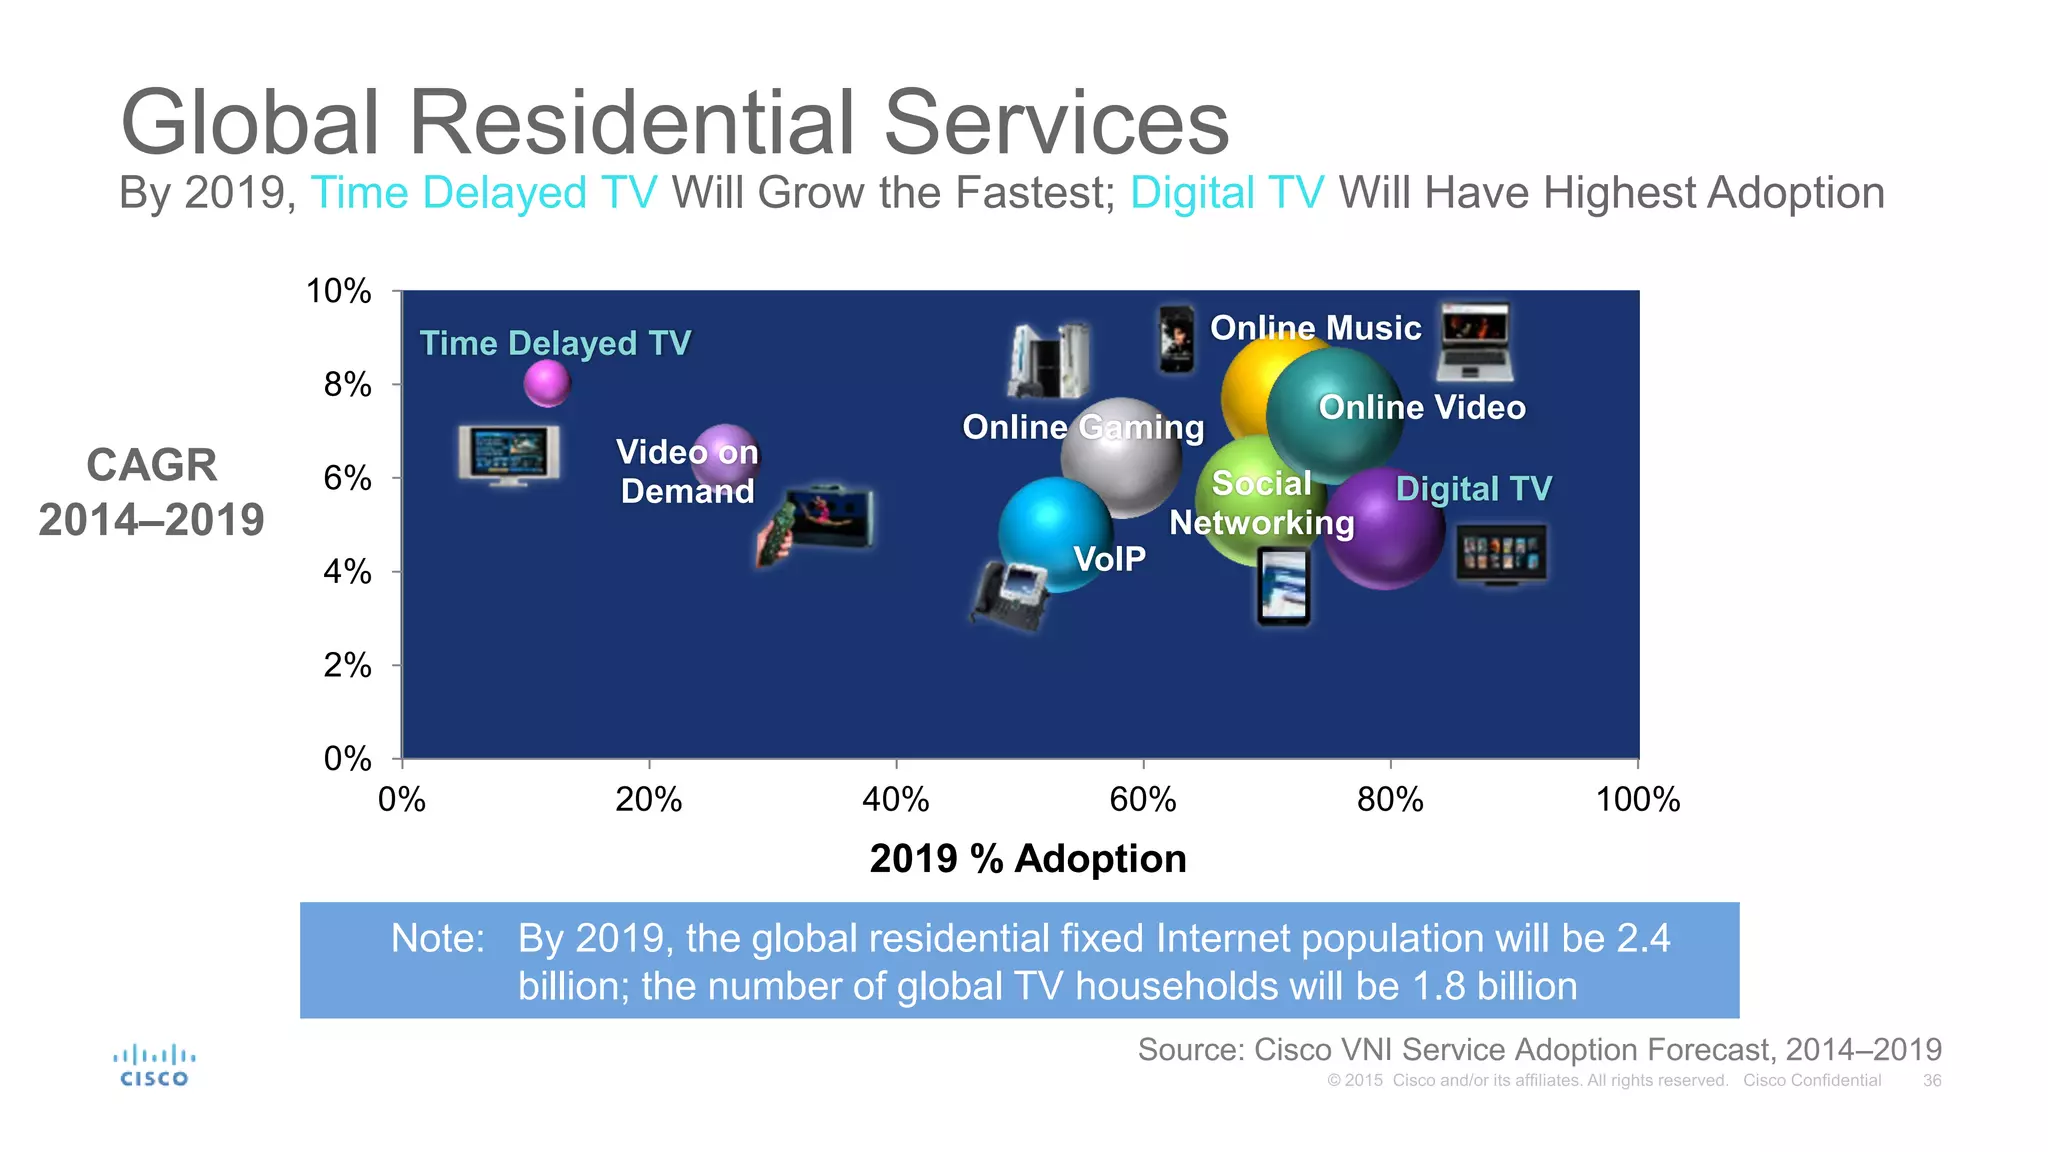


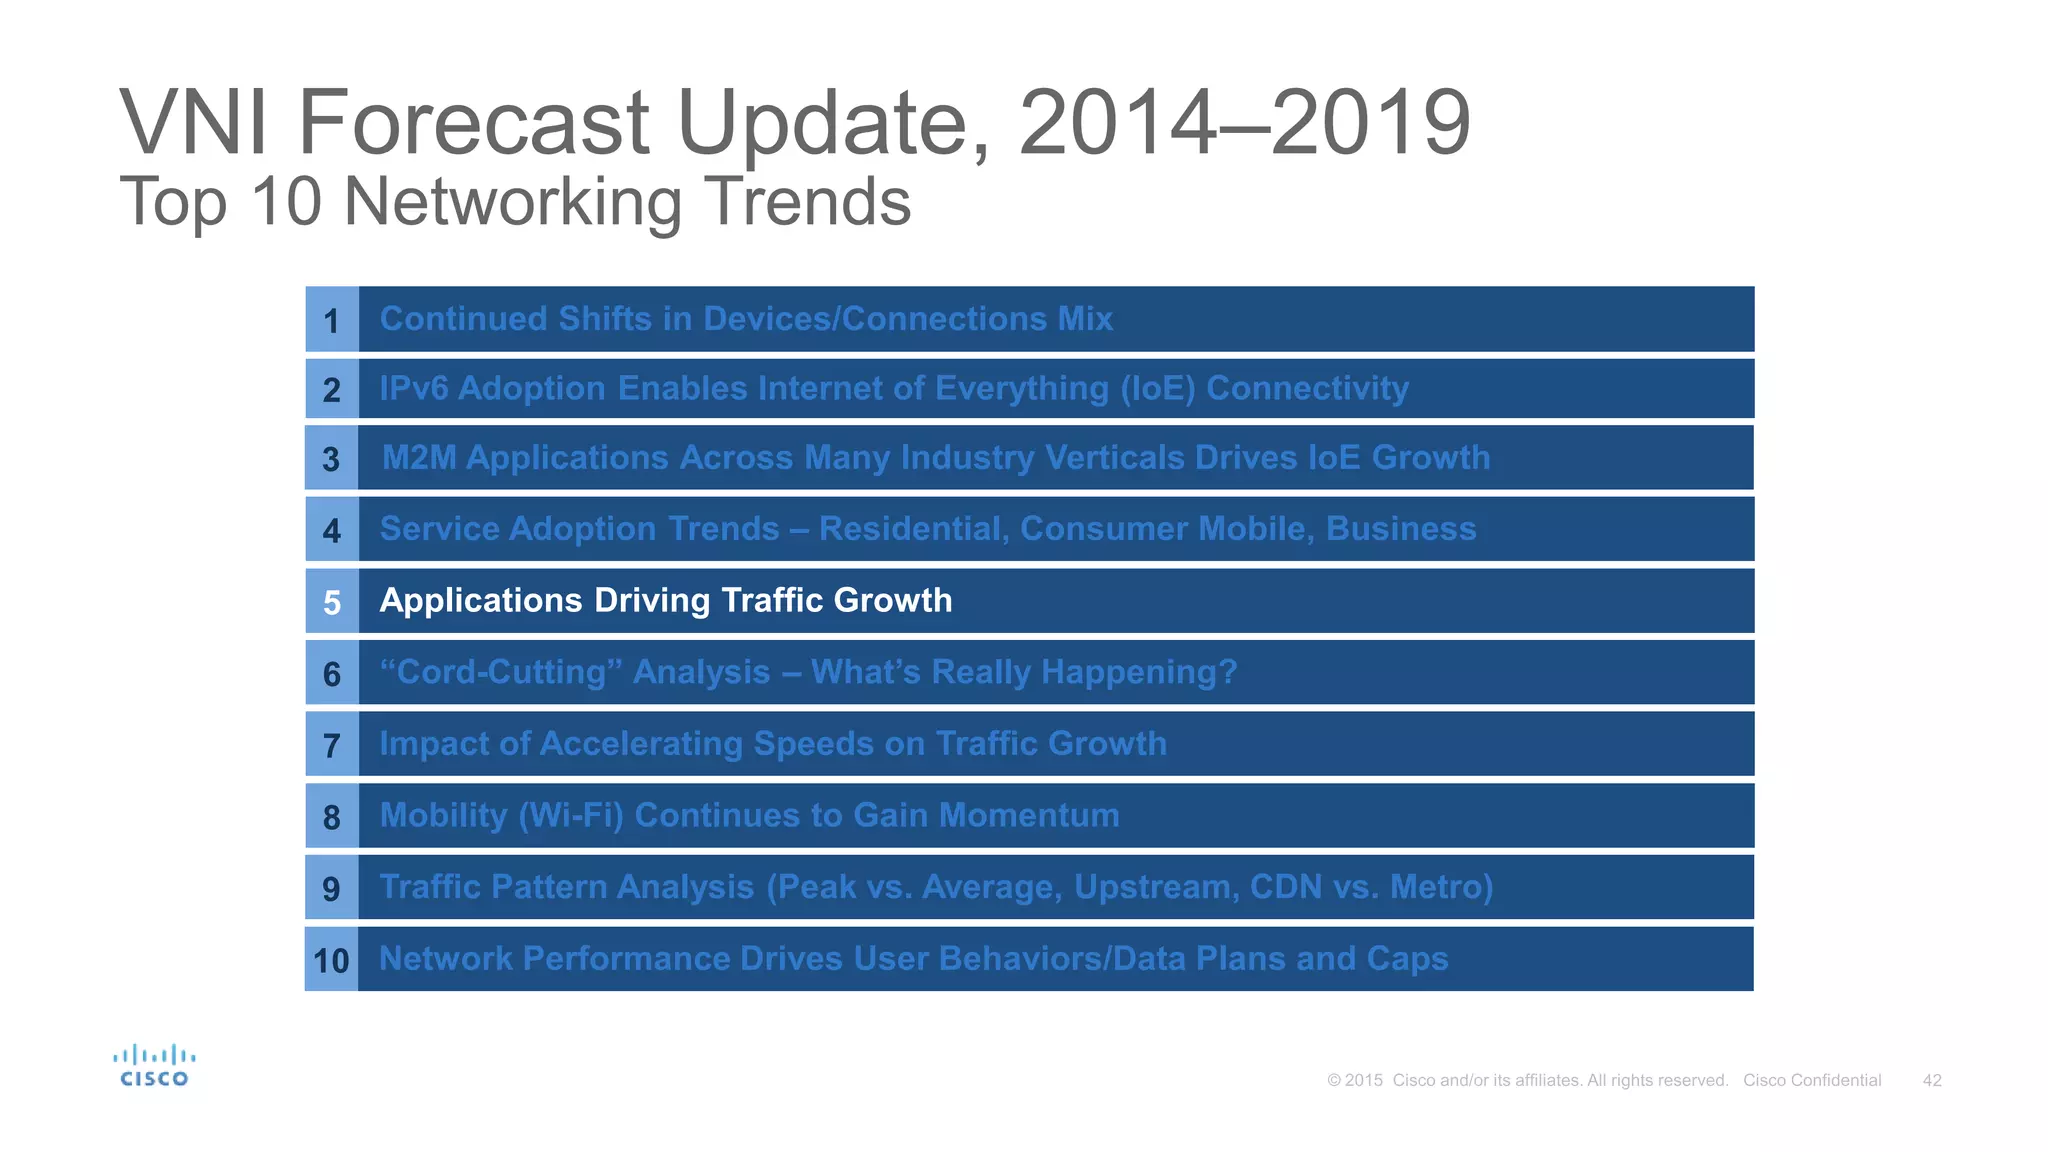
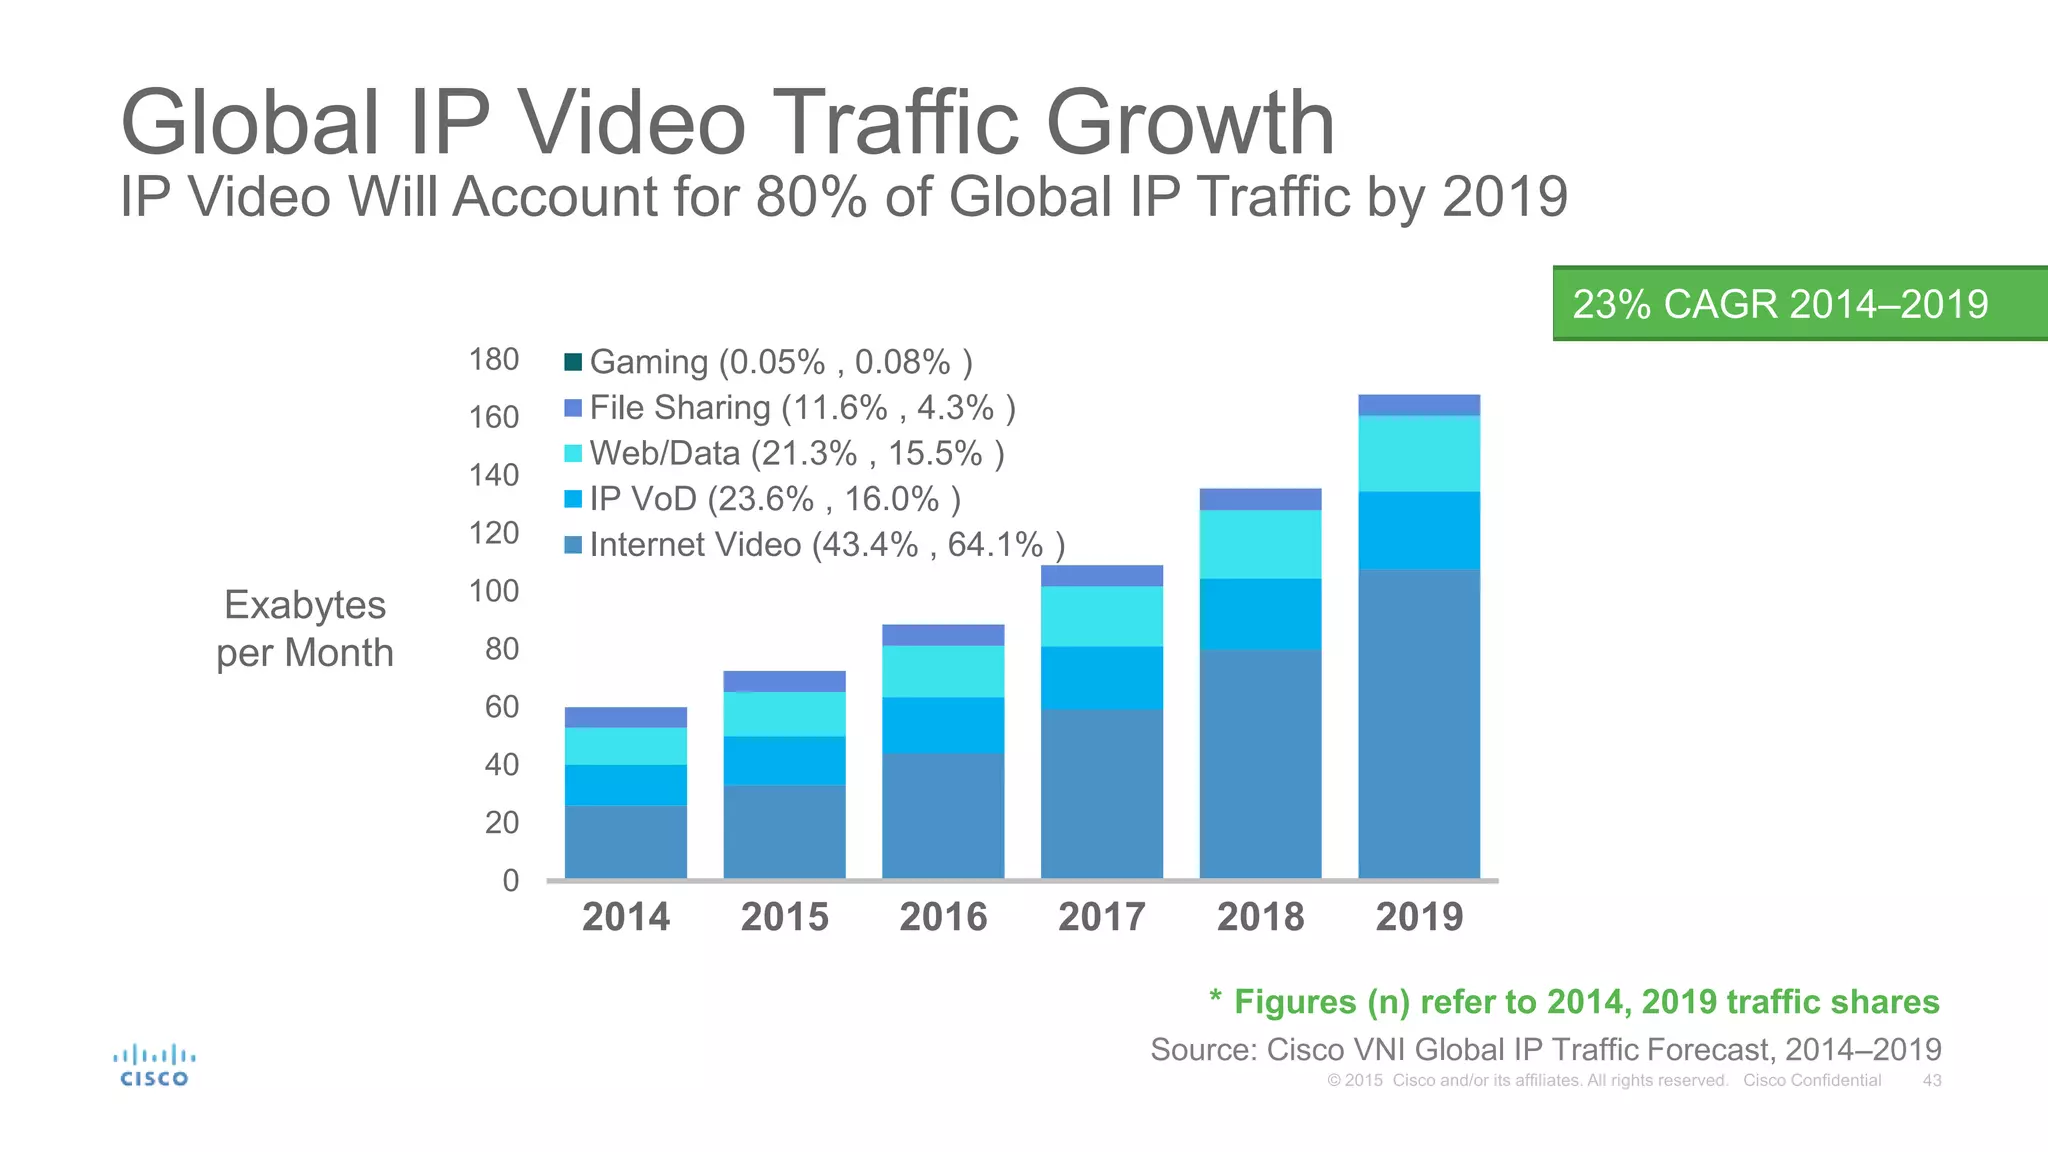
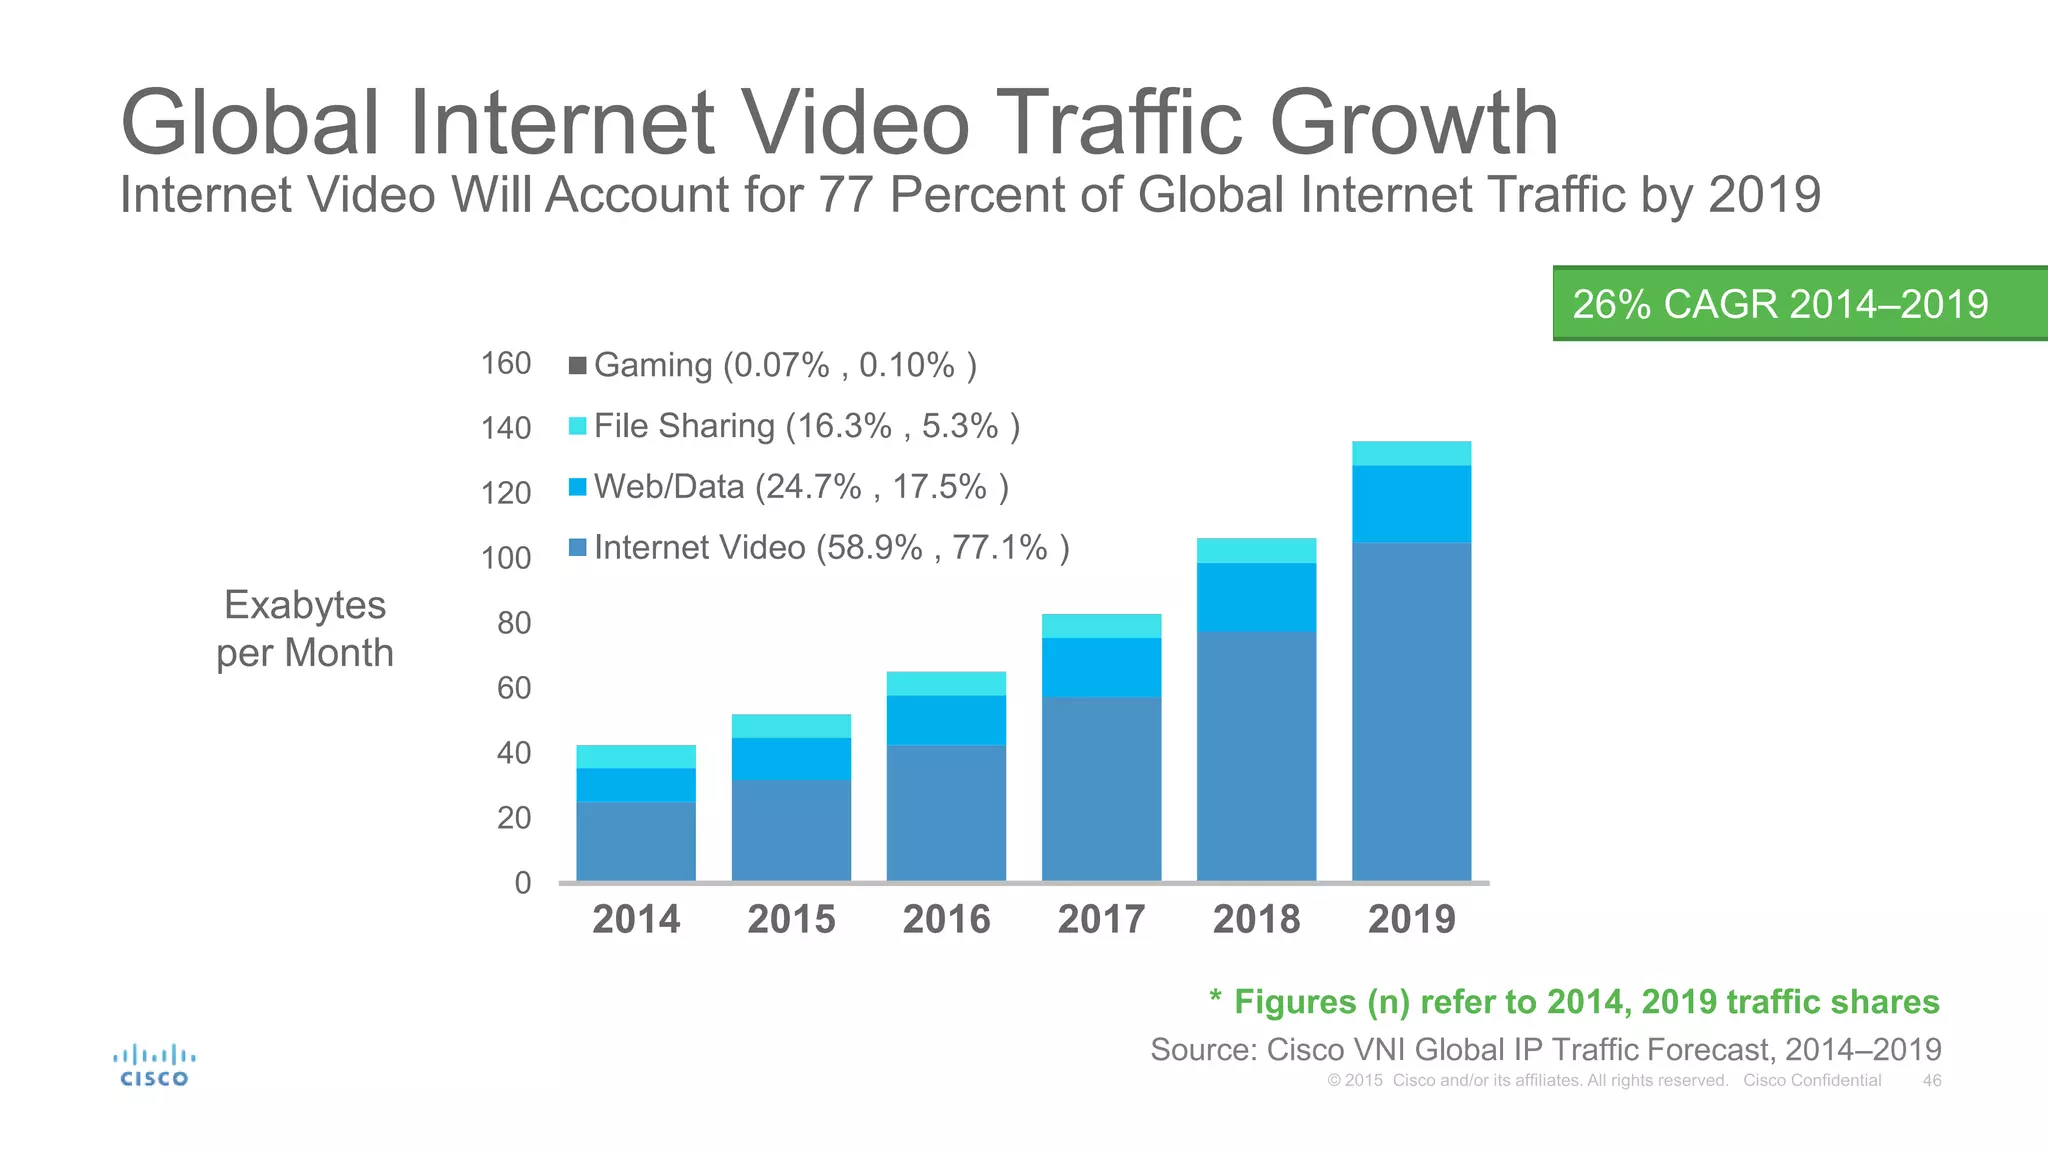
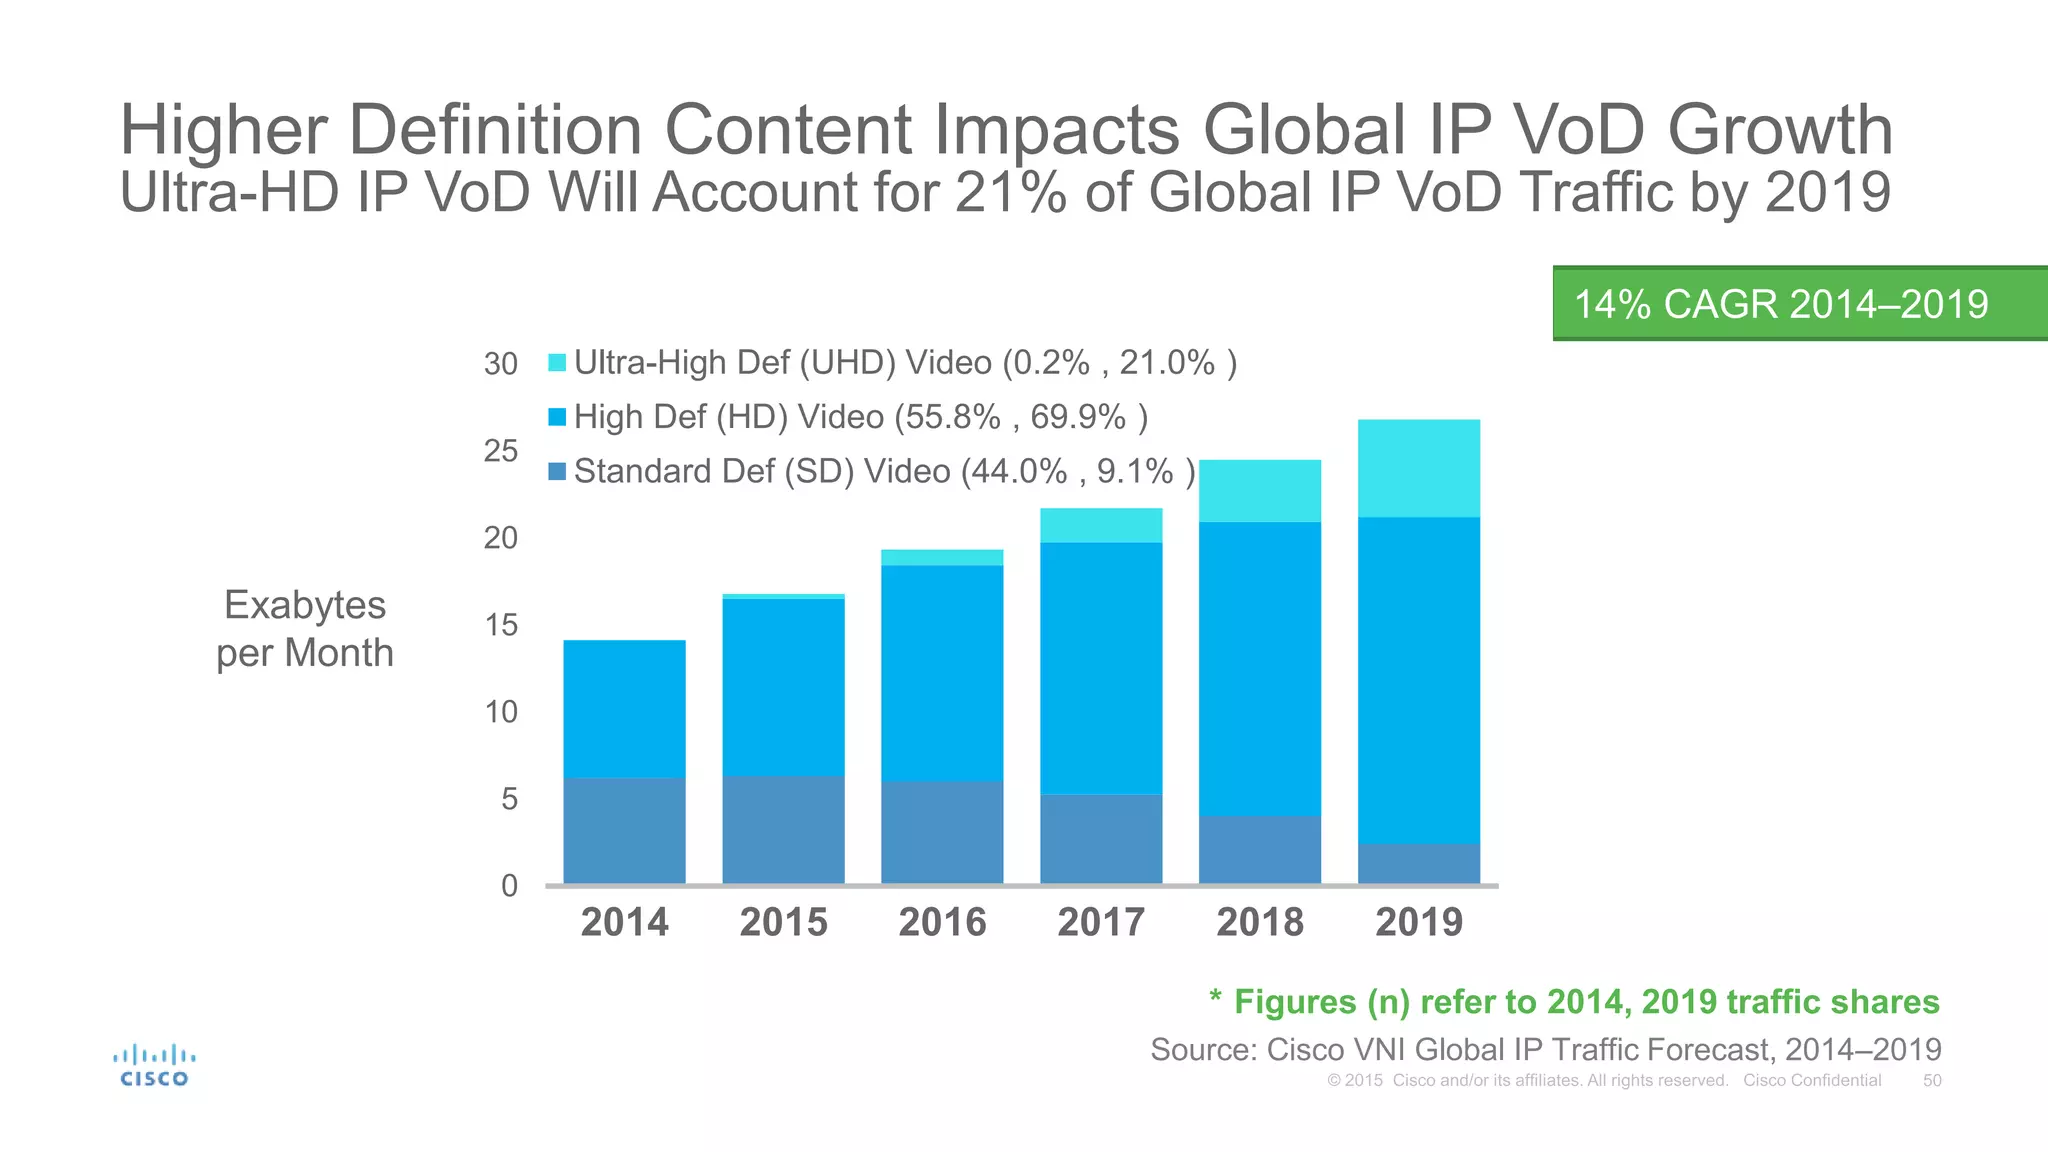


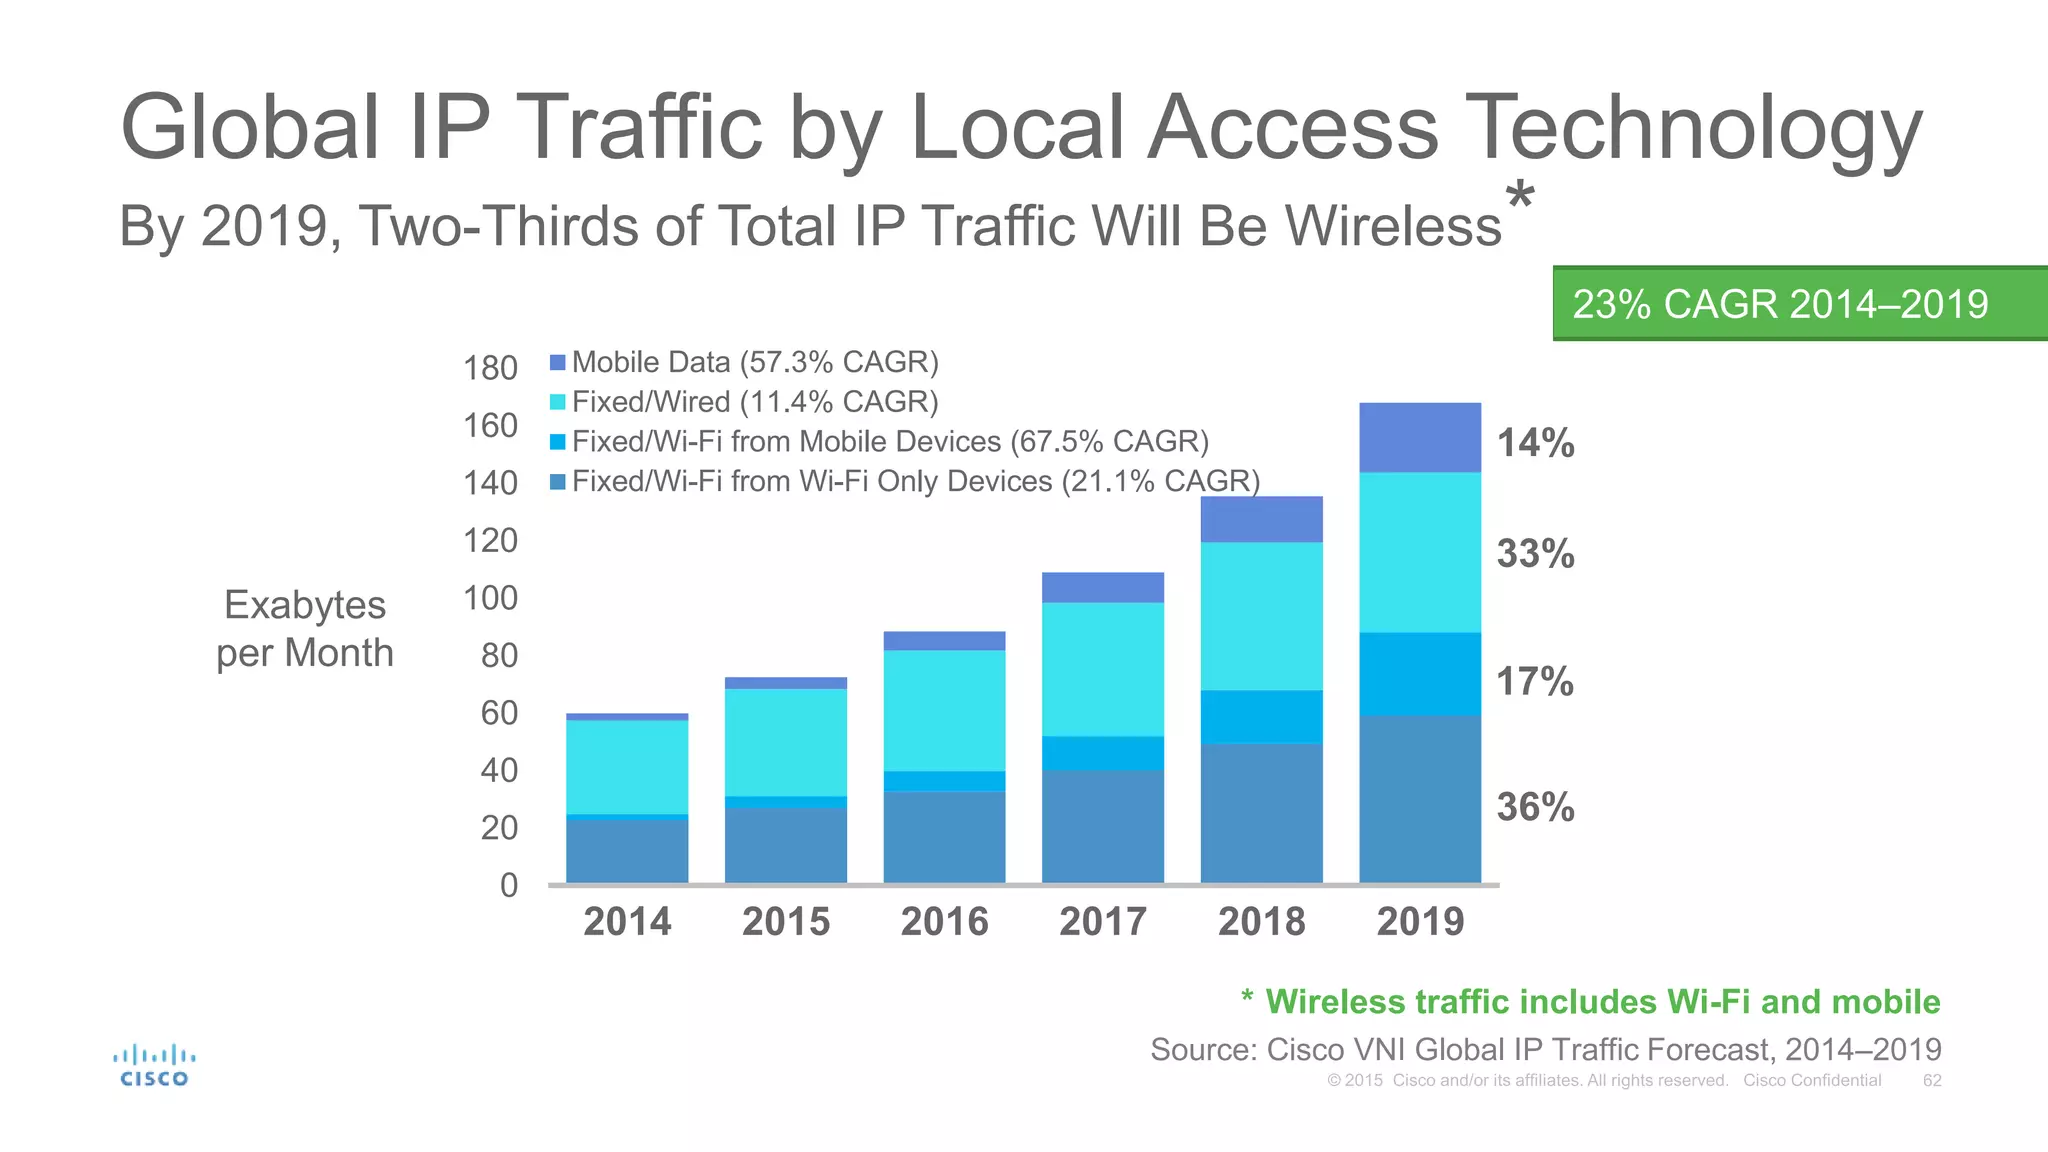
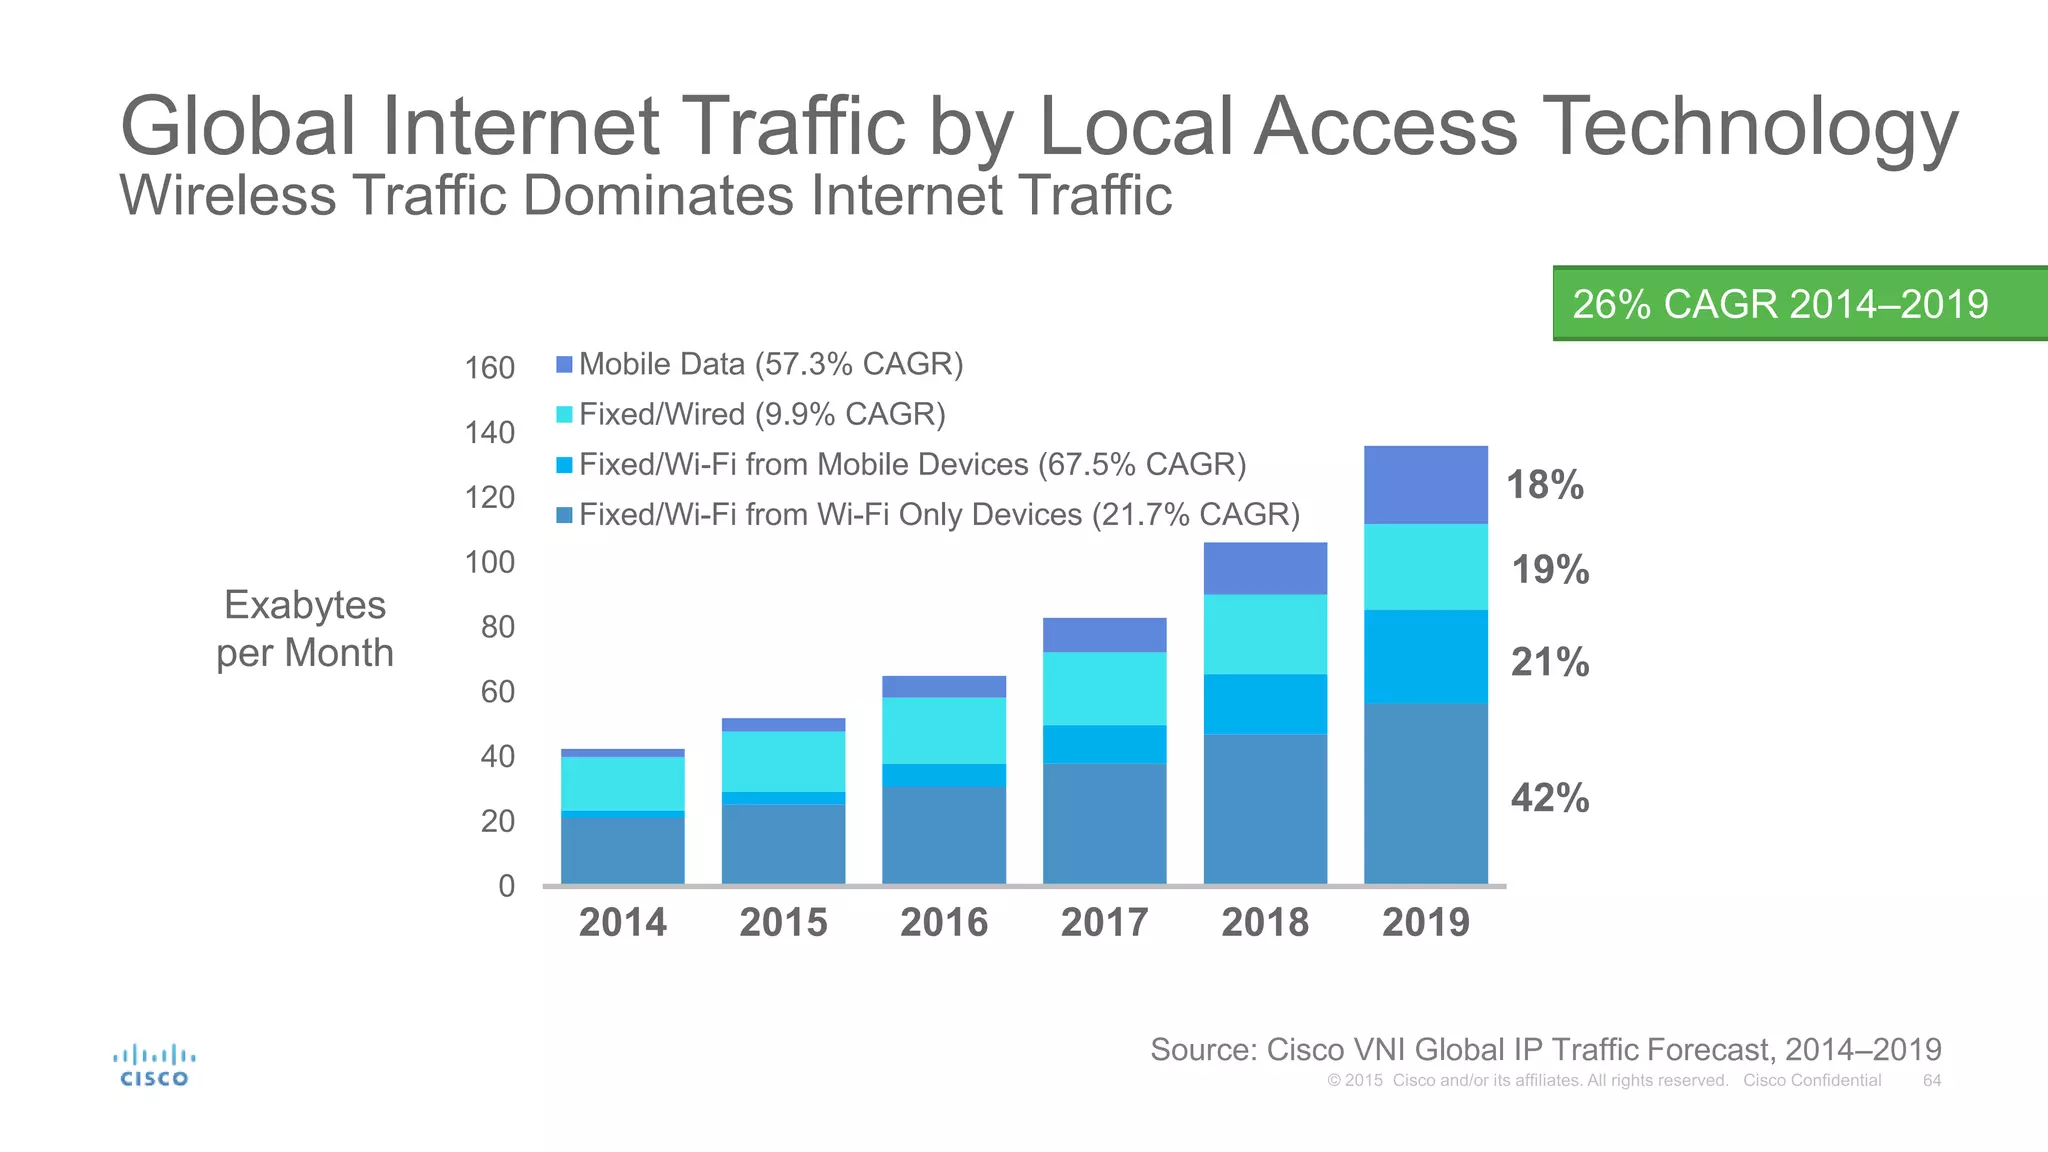
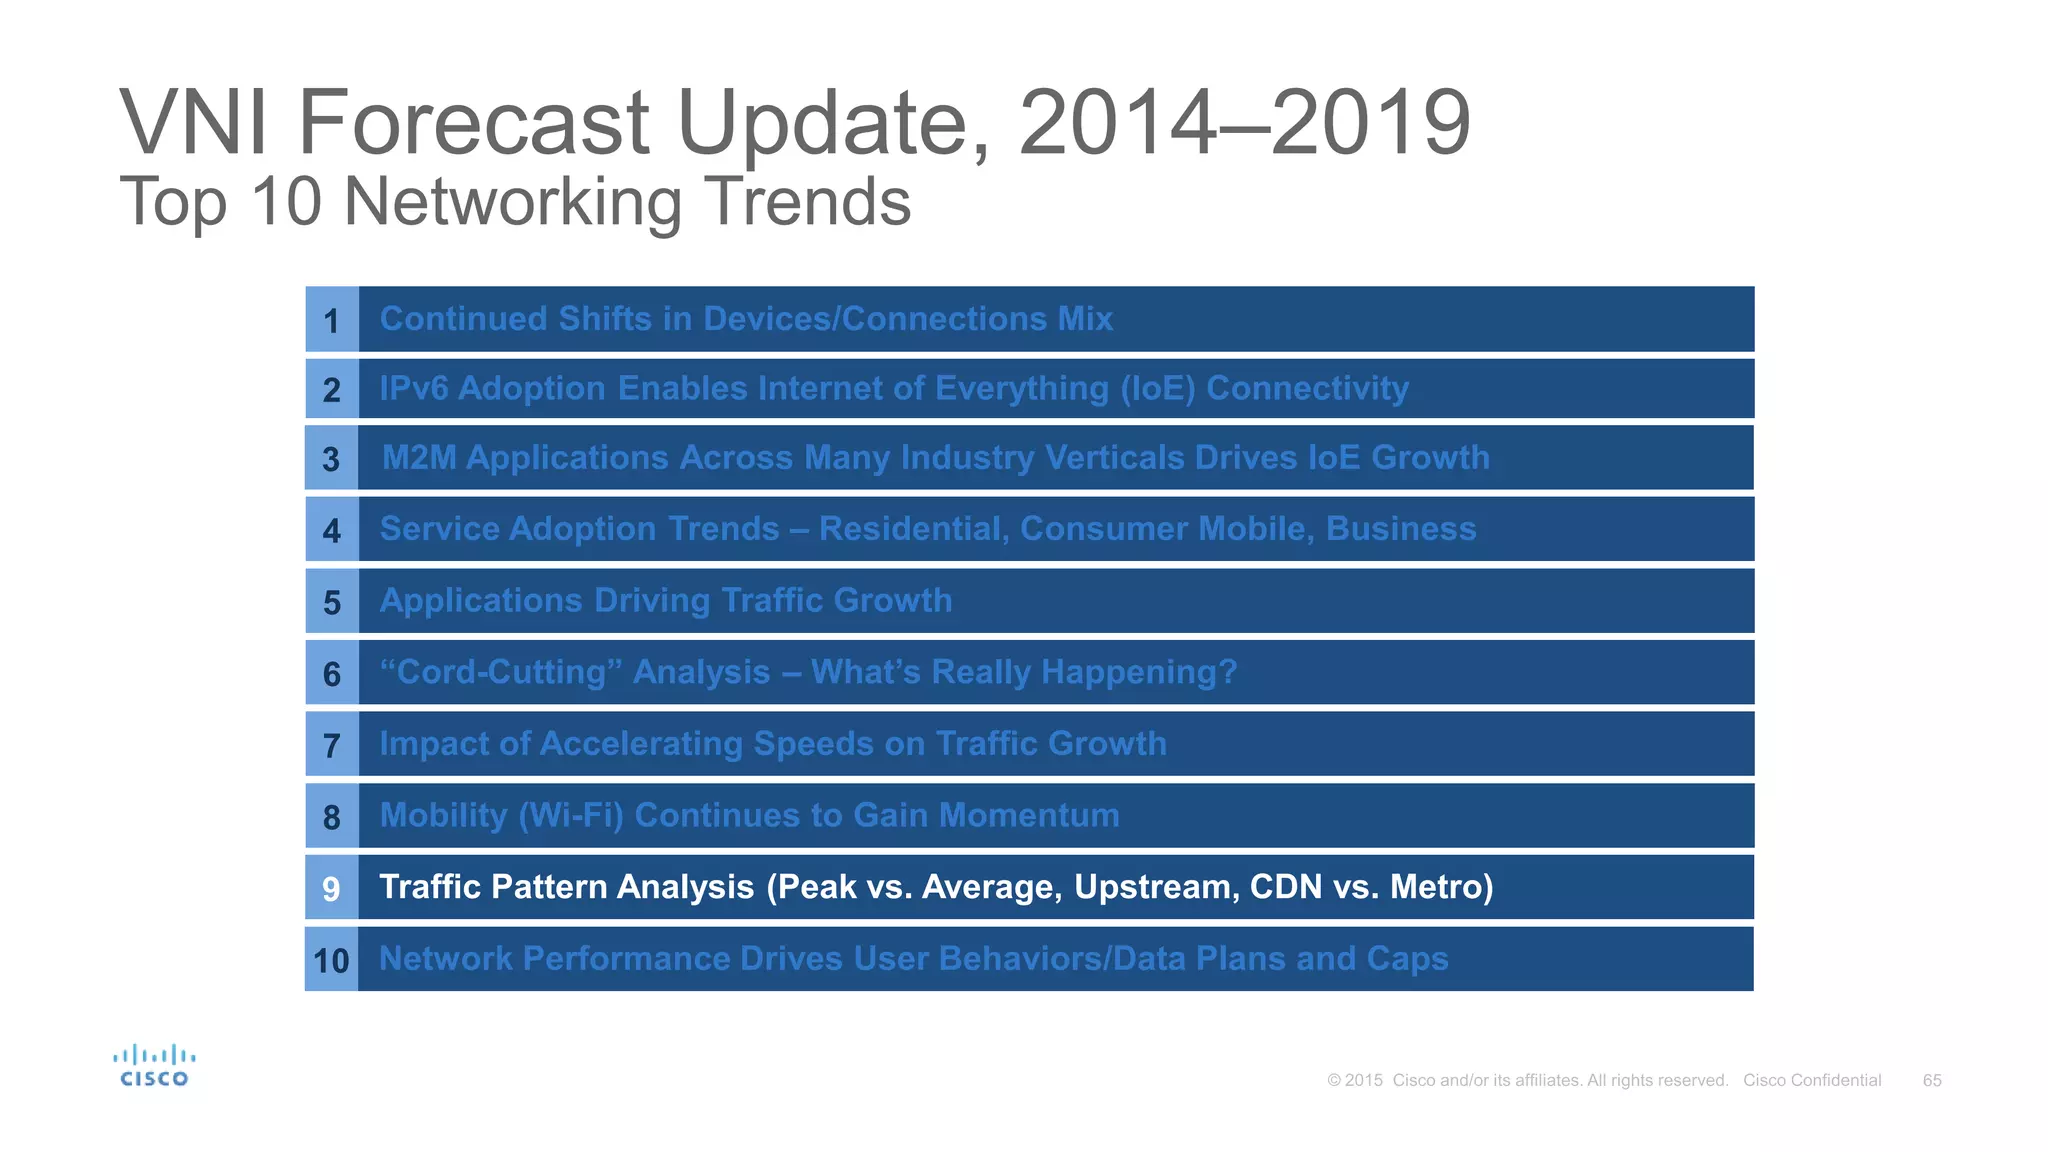
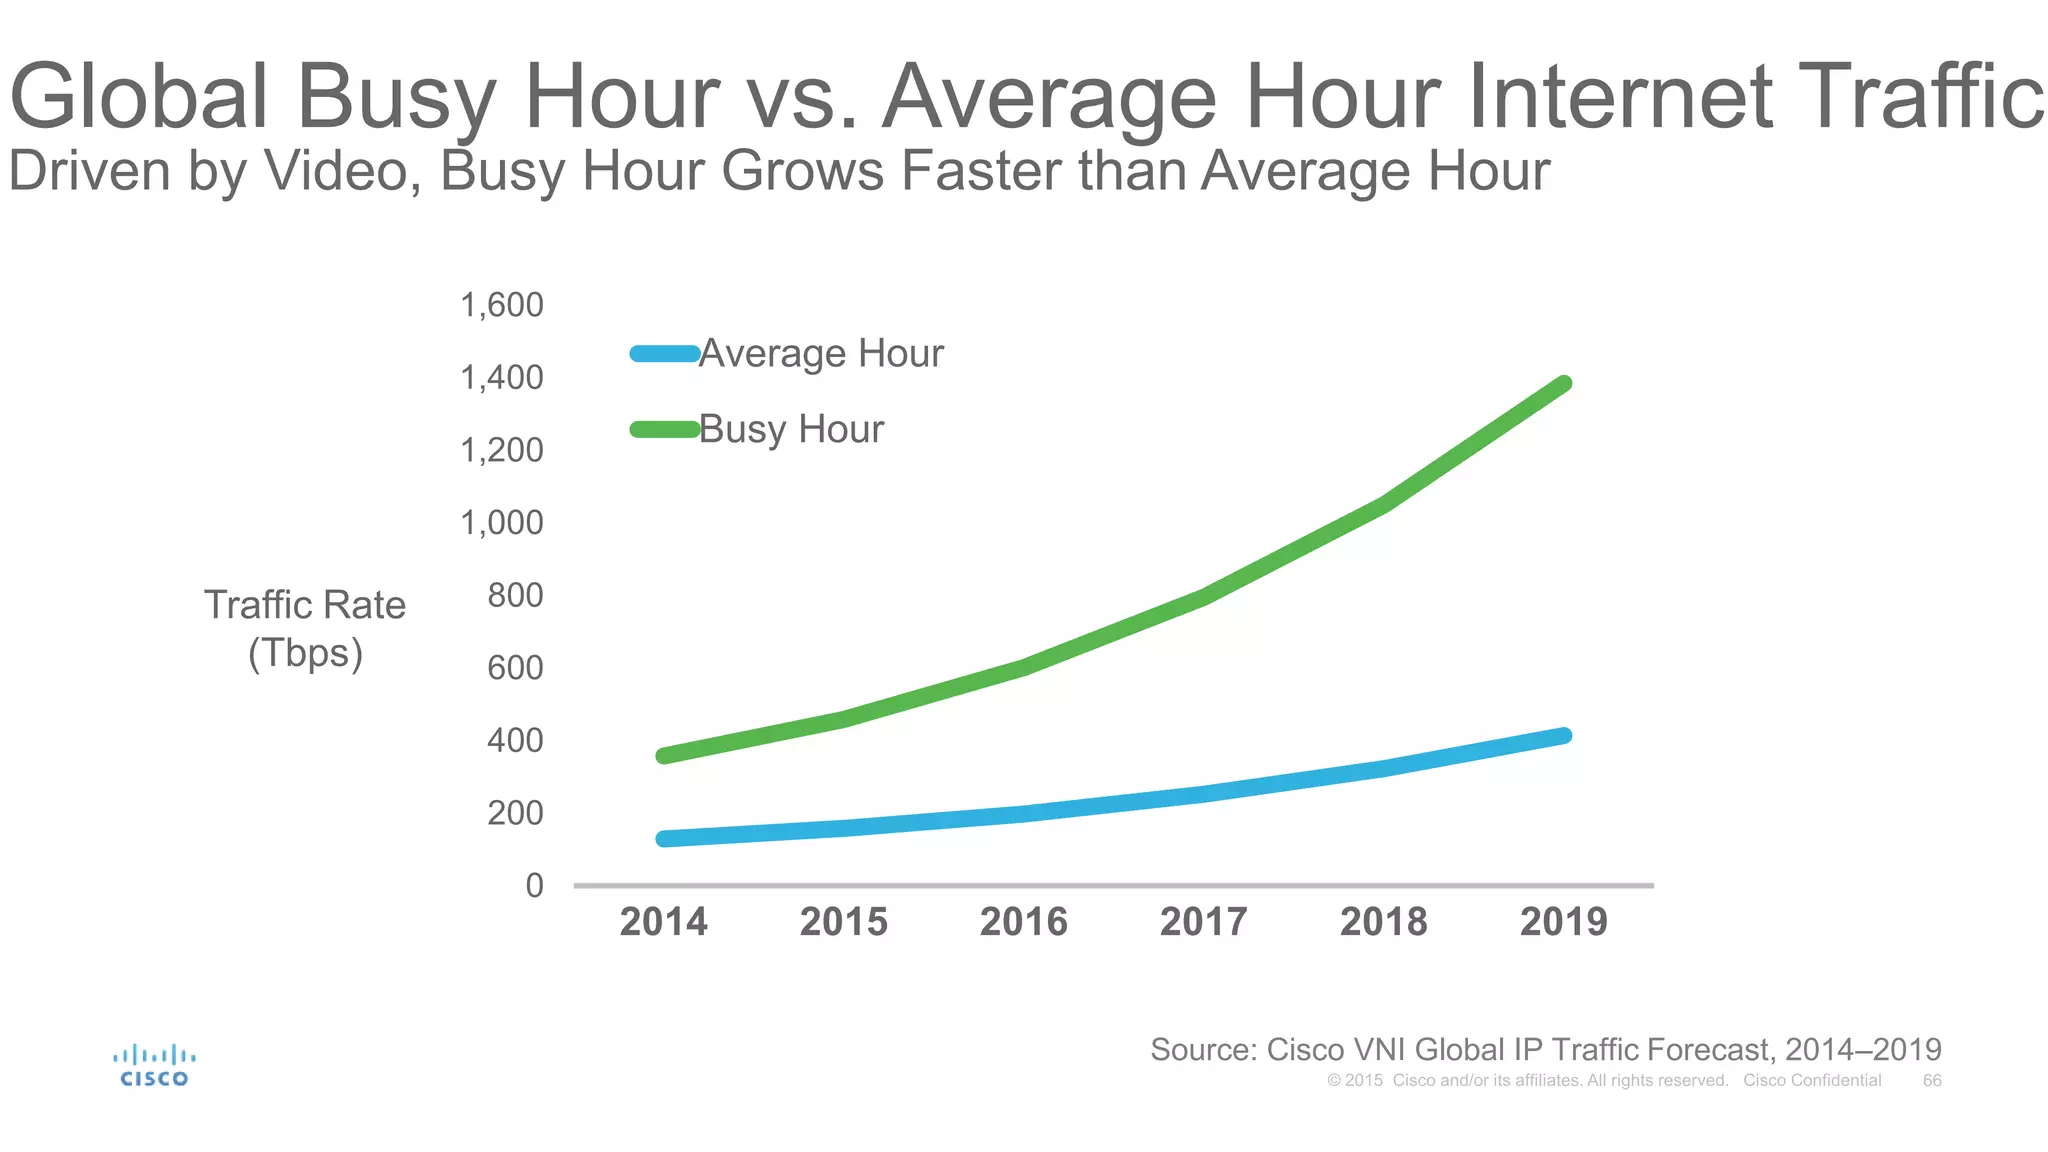
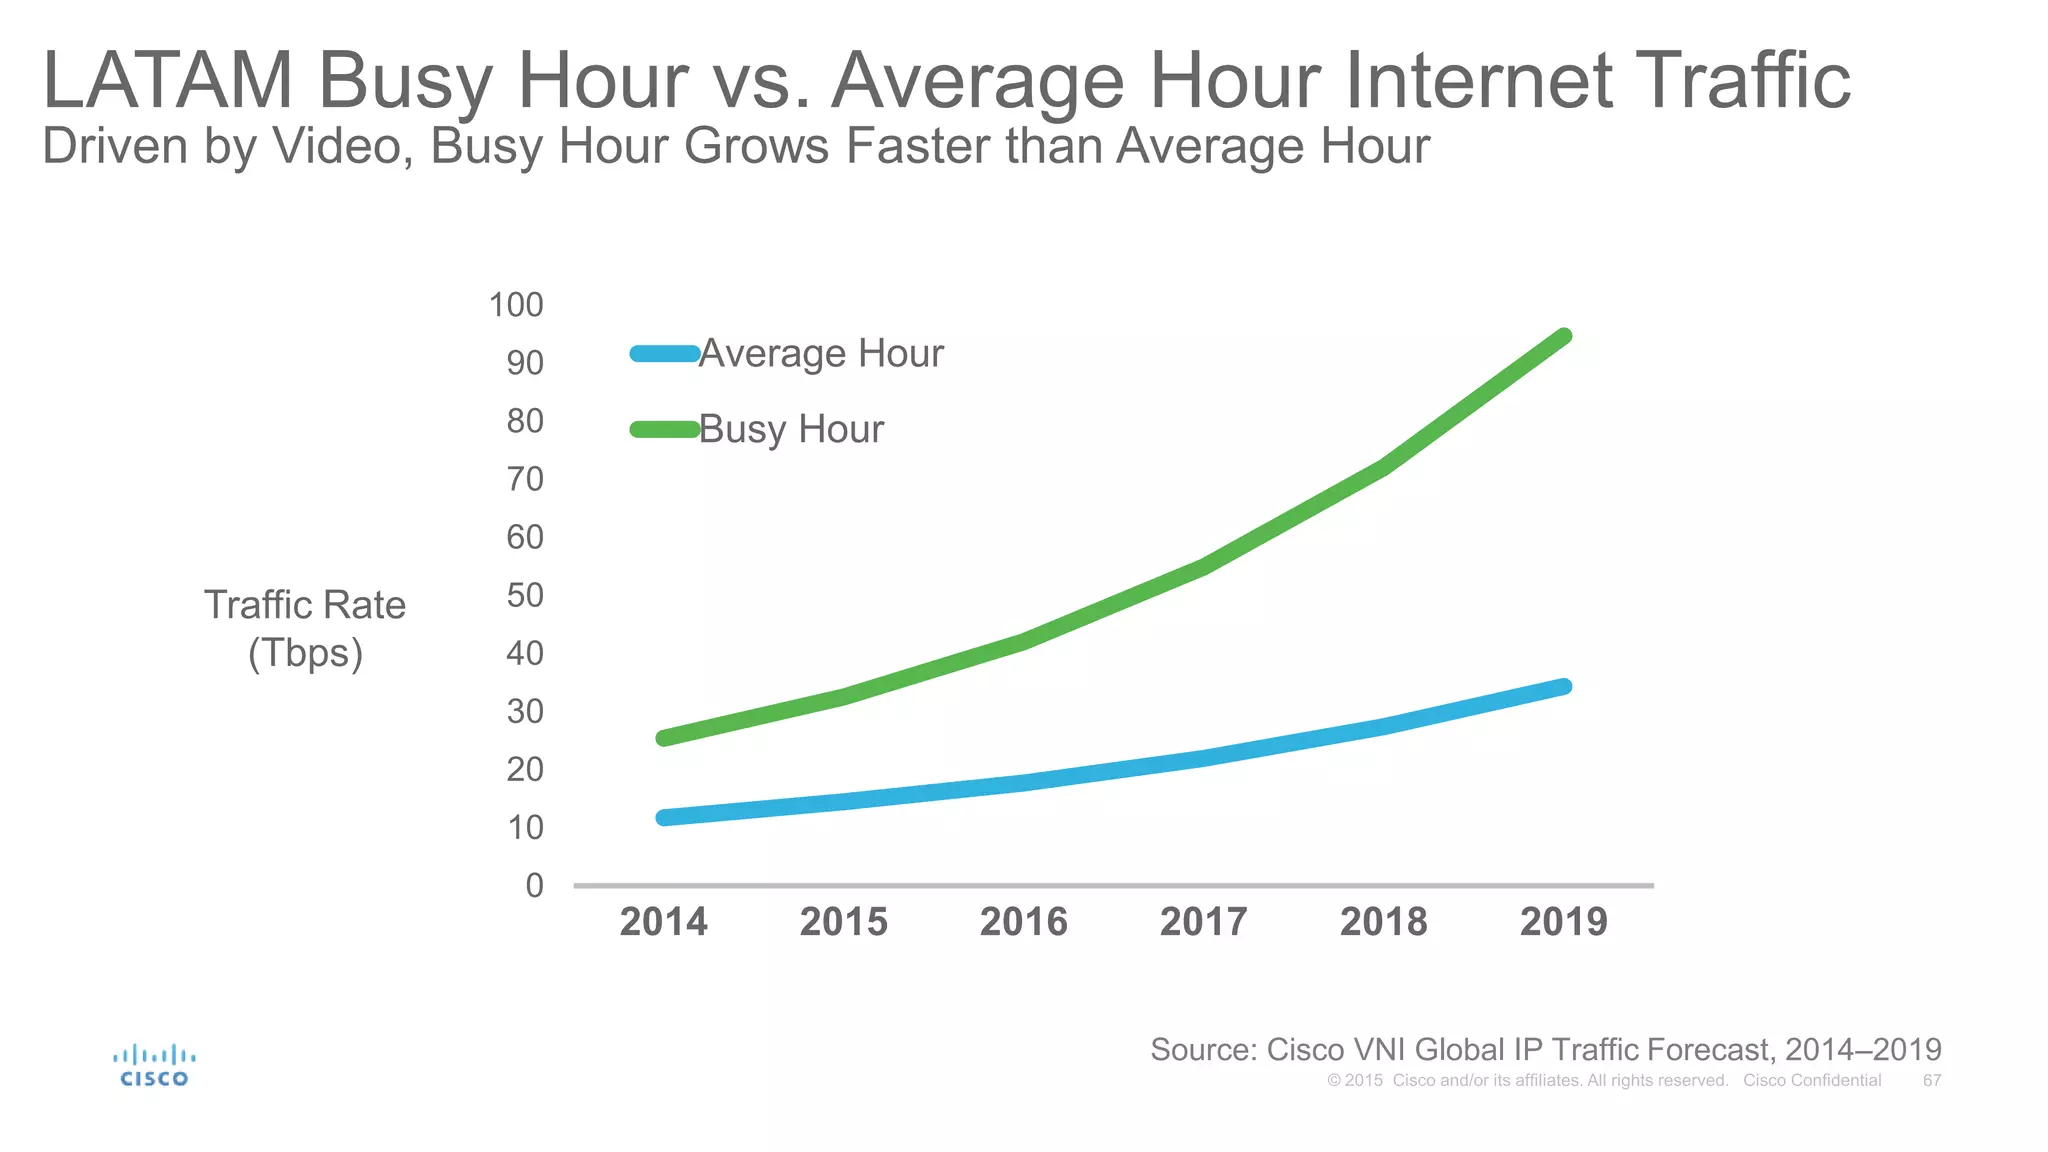
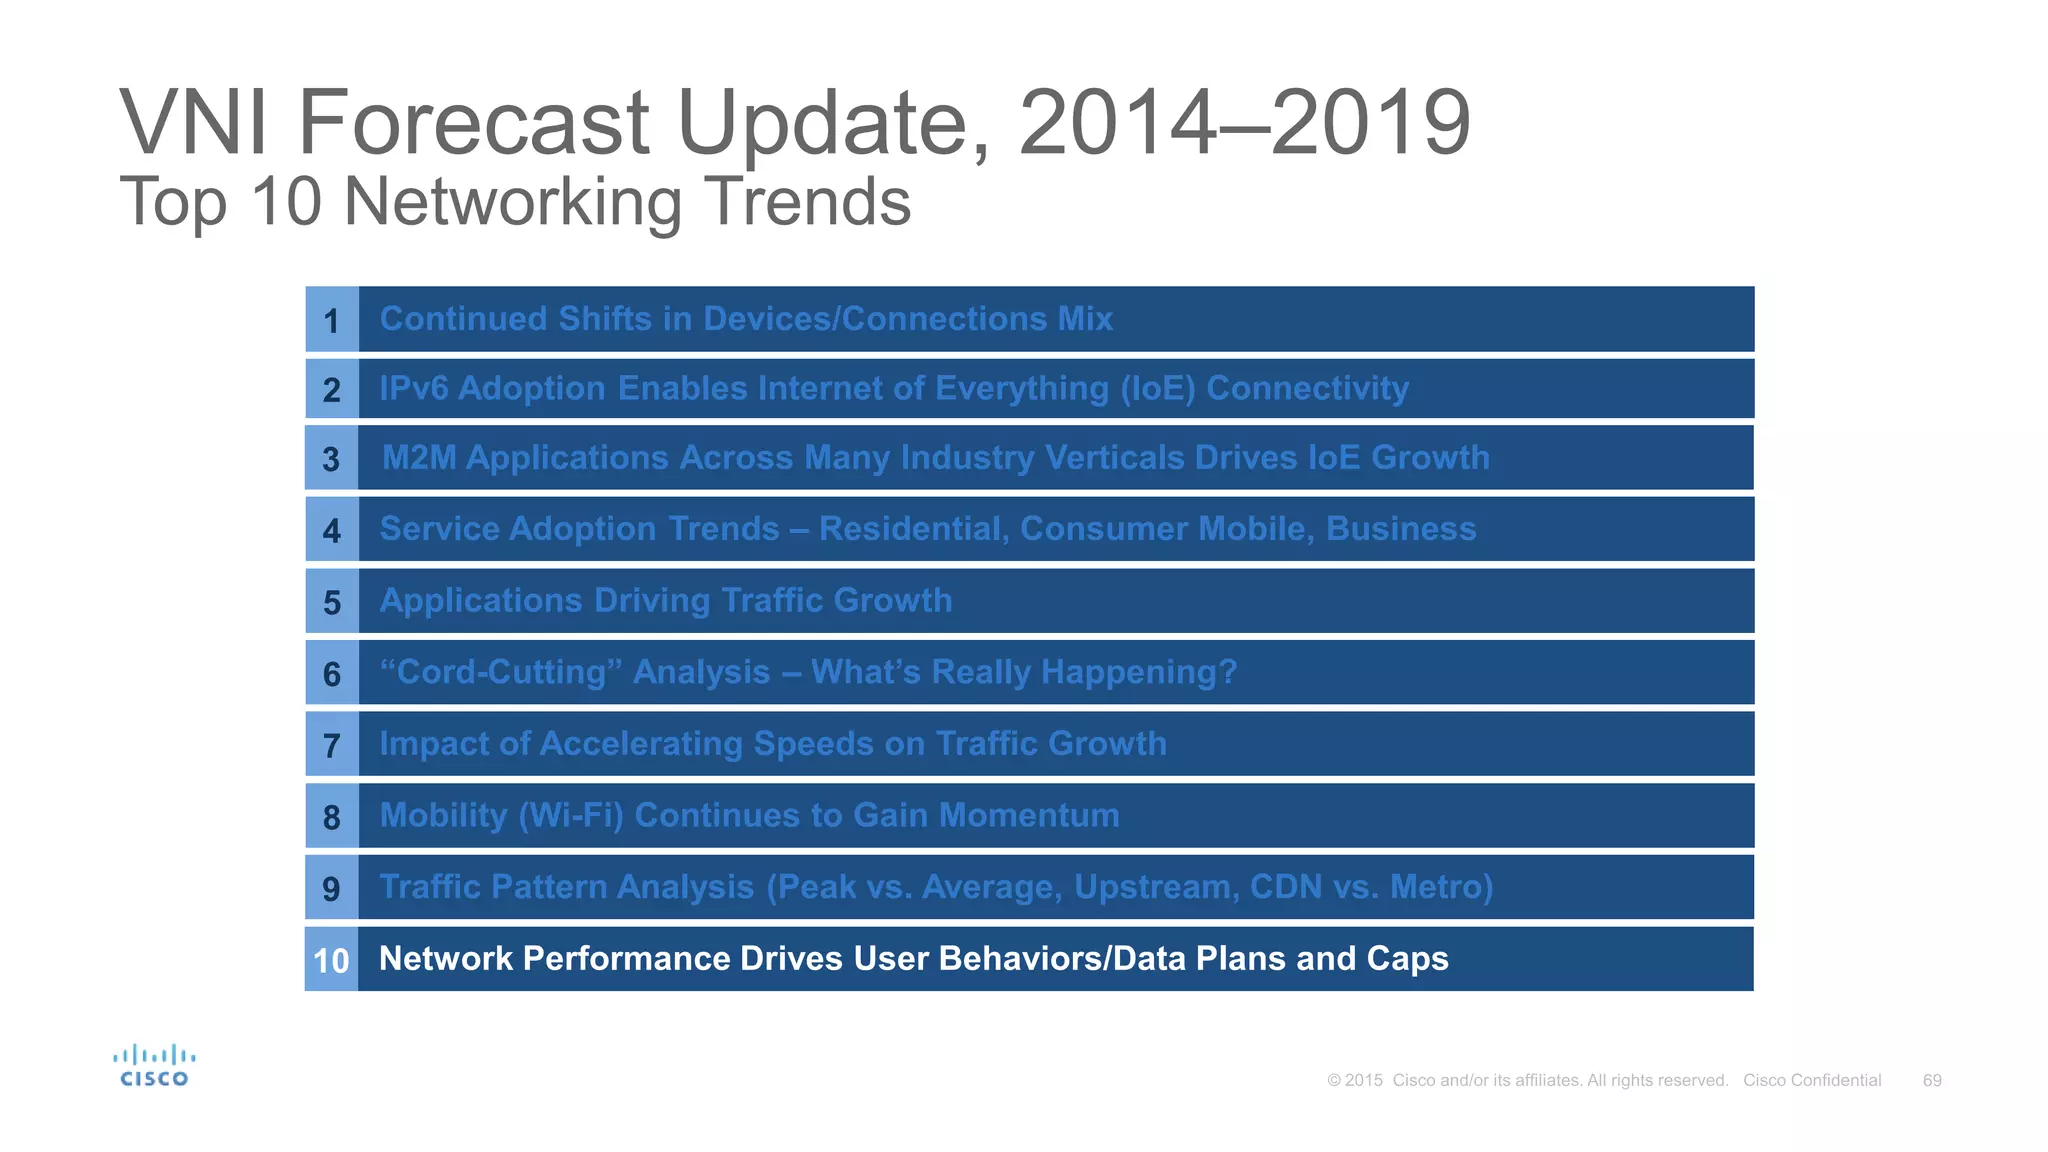


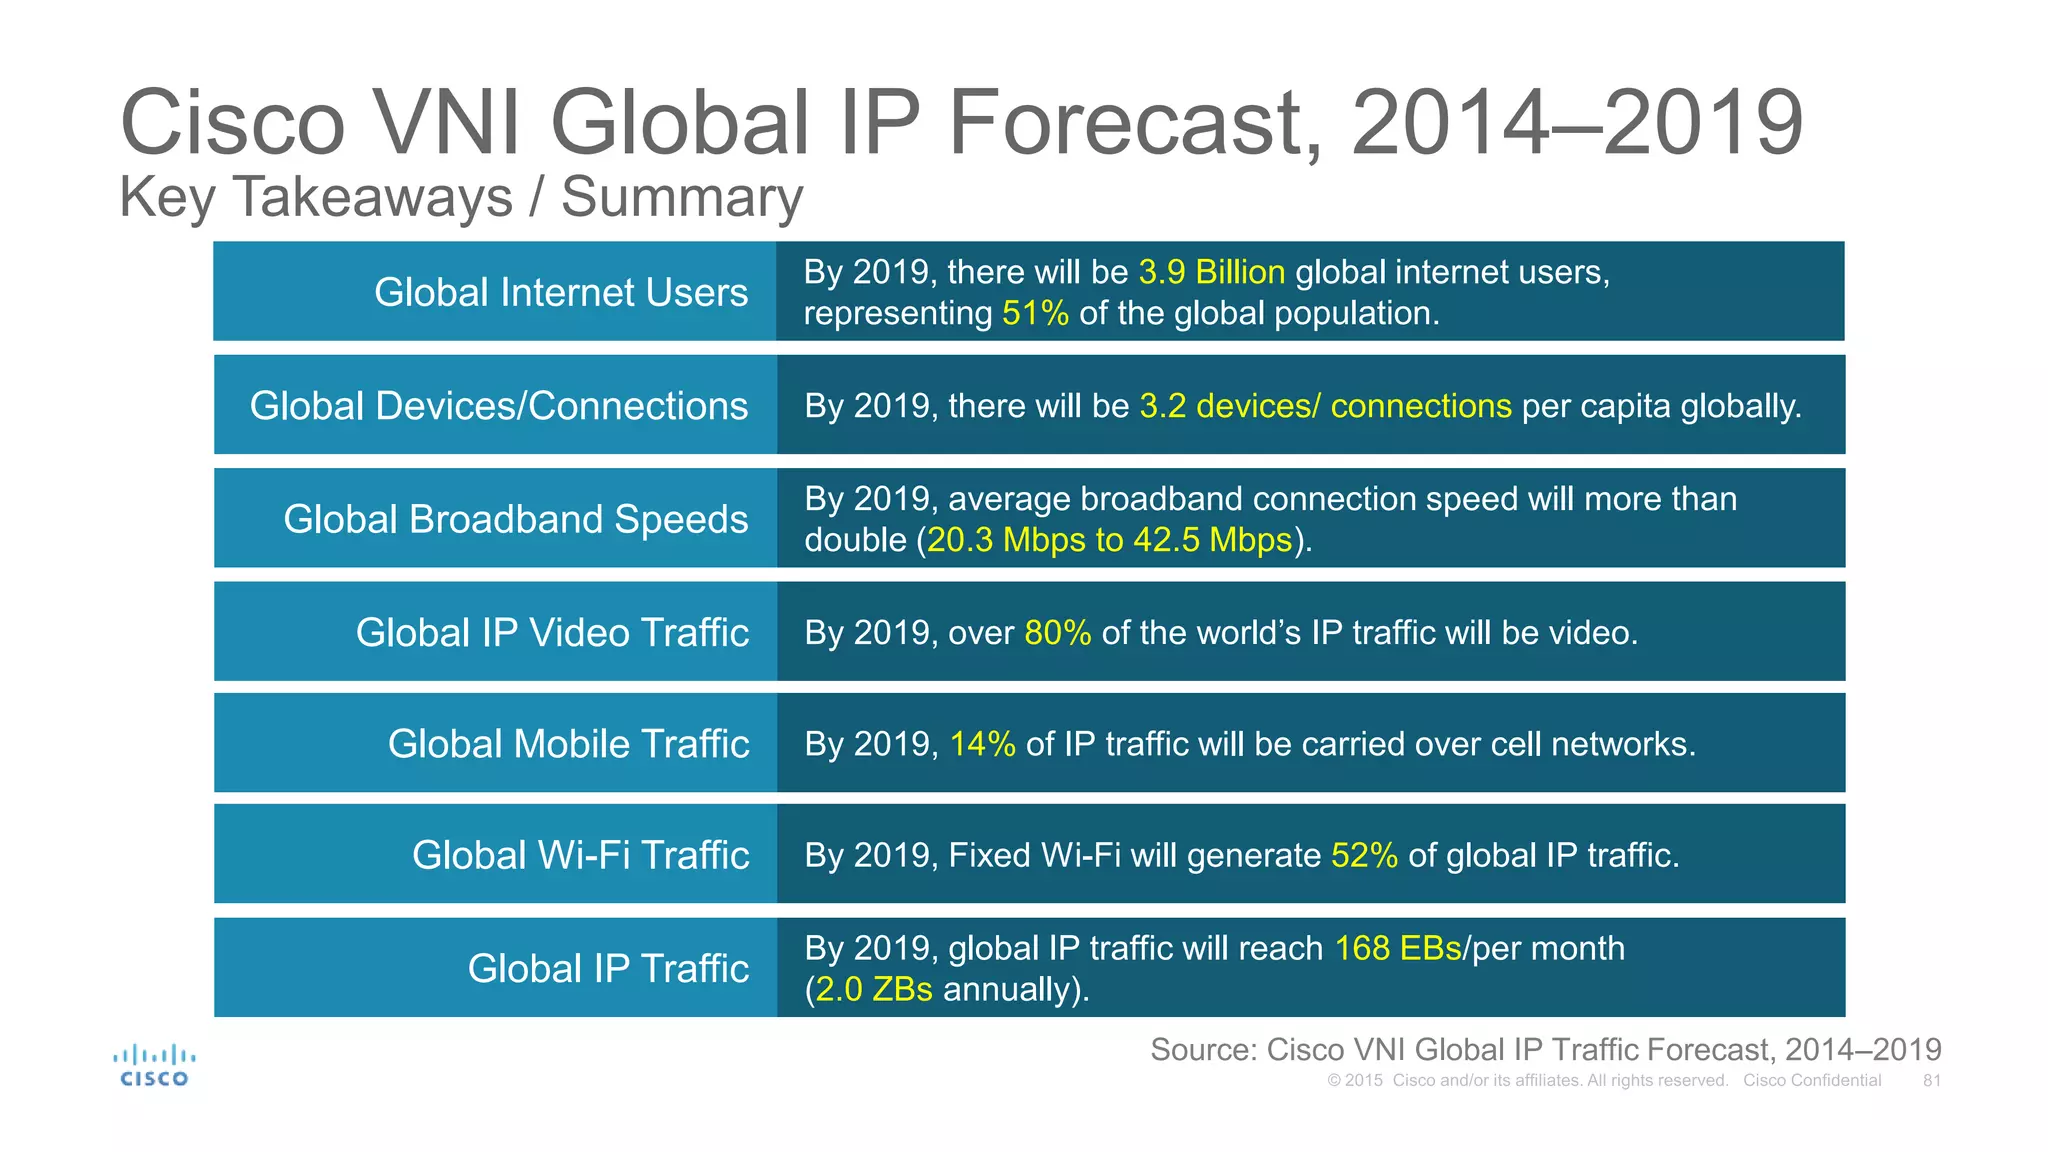
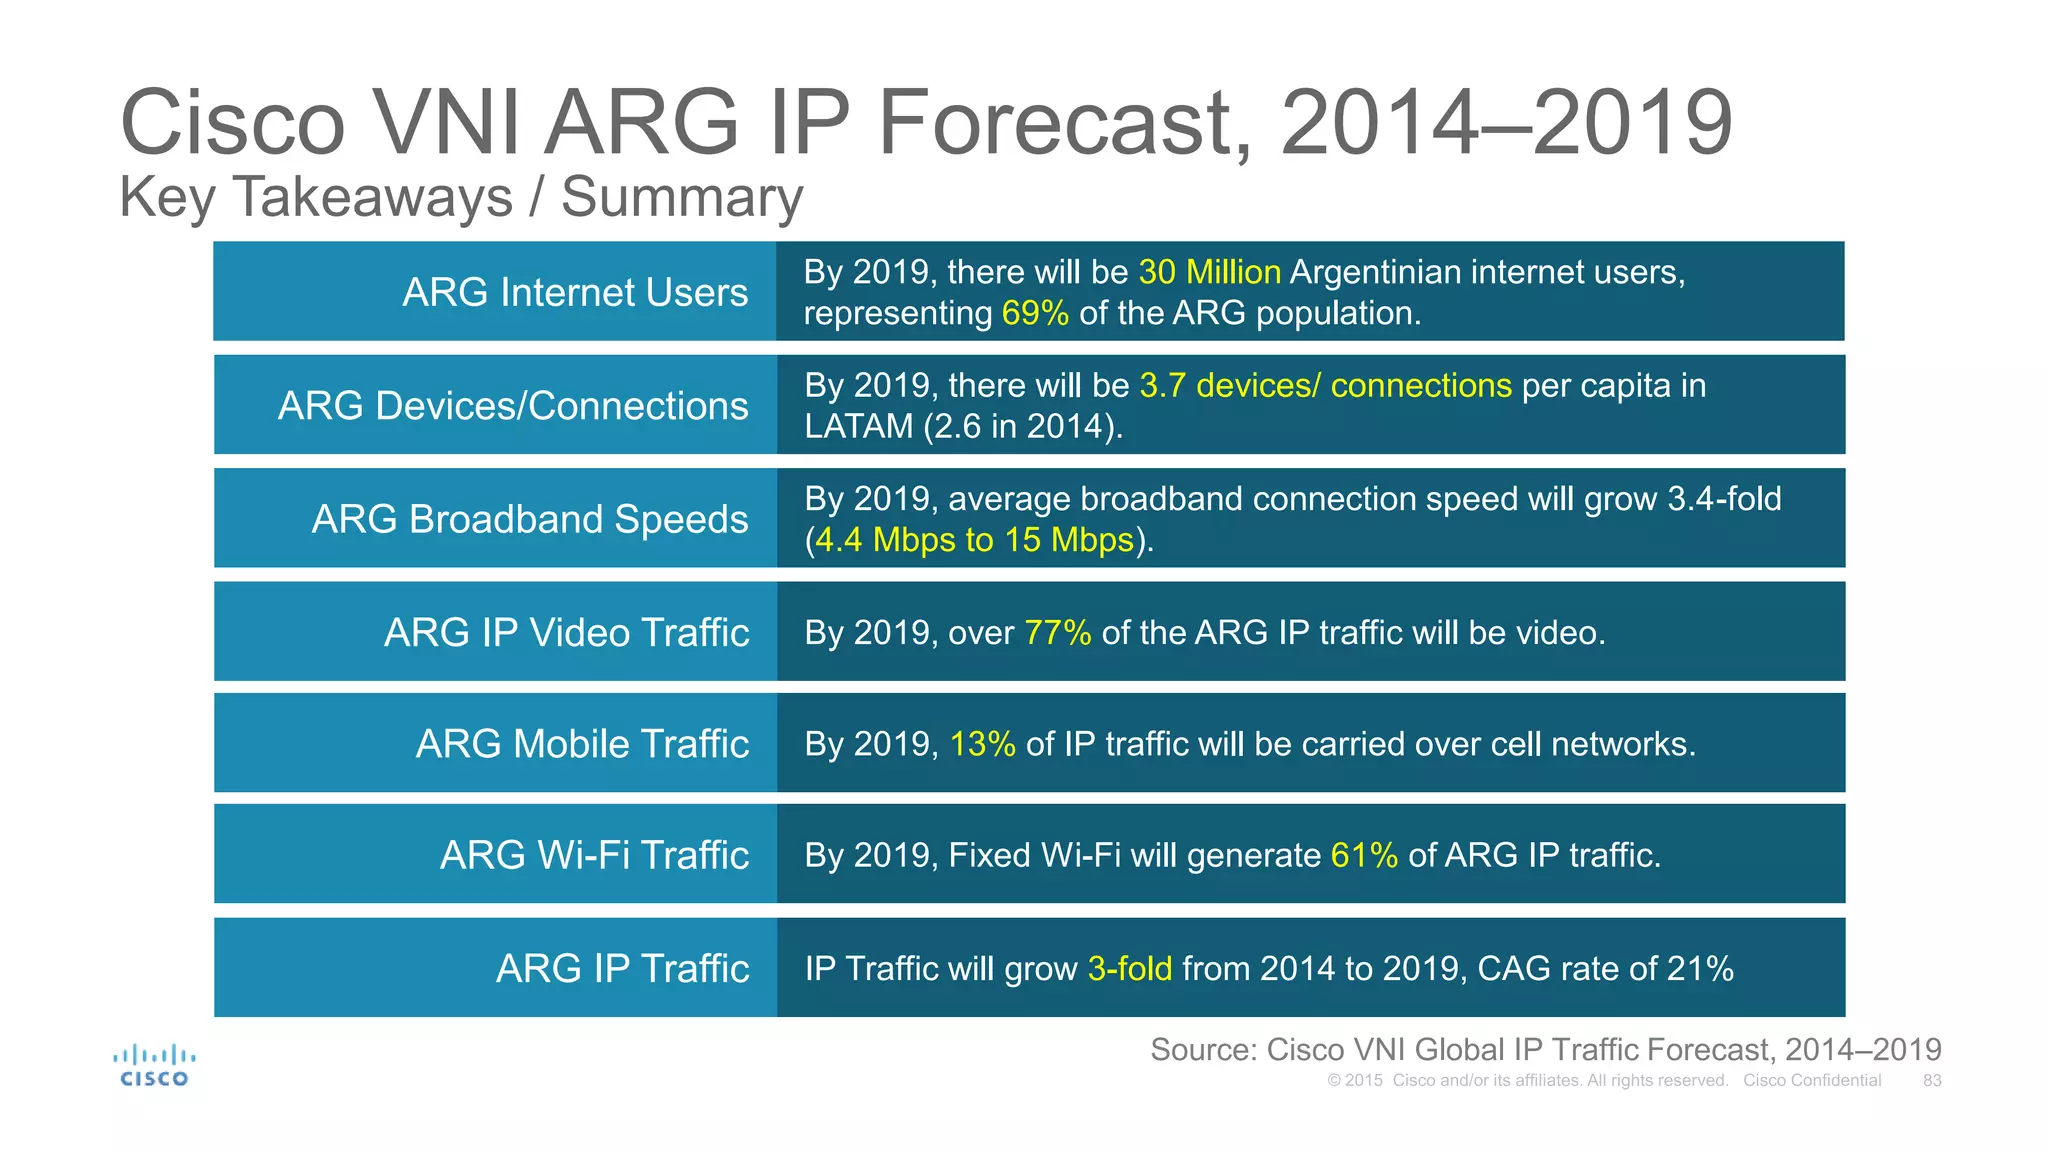


The Cisco Visual Networking Index (VNI) report forecasts significant growth in global IP traffic and service adoption from 2014 to 2019, predicting a tripling of global IP traffic with a compound annual growth rate (CAGR) of 23%. By 2019, video is expected to account for 80% of IP traffic, driven by an increase in connected devices and faster broadband speeds. The report highlights trends such as the rise of machine-to-machine (M2M) connections, which will contribute significantly to the overall growth in traffic.


