1. Molecular Cell, Vol. 10, 871–882, October, 2002, Copyright 2002 by Cell Press
Interplay of TBP Inhibitors in
Global Transcriptional Control
characterized interactions in yeast: TBP/NC2, TBP/
TAF1, and TBP dimerization.
NC2 is a heterodimer of two histone-fold subunits
Carmelata Chitikila,1,4
Kathryn L. Huisinga,1
Jordan D. Irvin,1
Andrew D. Basehoar,2
and B. Franklin Pugh1,3
(Bur6/DRAP1 and NC2/DR1). NC2 binds to and stabi-1
Department of Biochemistry and Molecular Biology
lizes TBP/TATA complexes in mobility shift assays, com-2
Graduate Program in Statistics
petitively inhibiting the association of TFIIA and TFIIBPennsylvania State University
(Cang et al., 1999; Goppelt and Meisterernst, 1996; KimUniversity Park, Pennsylvania 16803
et al., 1997; Mermelstein et al., 1996). NC2 occupies a
region just under the TBP/TATA interface (see Figure
1A) contacting DNA on both sides of TBP (Kamada et
Summary al., 2001). A domain of NC2 reaches up and contacts
residues along the convex surface of TBP and contrib-
The TATA binding protein (TBP) is required for the utes to the steric occlusion of TFIIB. A yeast TBP muta-
expression of nearly all genes and is highly regulated tion (F182V) along this interface disrupts TBP/NC2 inter-
both positively and negatively. Here, we use DNA mi- actions in vitro and causes increased expression of a
croarrays to explore the genome-wide interplay of sev- number of enhancerless genes in vivo (Cang et al., 1999).
eral TBP-interacting inhibitors in the yeast Saccharo- NC2 overexpression selectively suppresses phenotypes
myces cerevisiae. Our findings suggest the following: associated with this mutation, providing further evi-
The NC2 inhibitor turns down, but not off, highly active dence that TBP (F182V) is primarily defective in NC2
genes. Autoinhibition of TBP through dimerization interactions. In addition to acting as an inhibitor, NC2
contributes to transcriptional repression, even at re- plays a positive role in transcription, although its basis
pressive subtelomeric regions. The TAND domain of is not understood (Cang et al., 1999; Geisberg et al.,
TAF1 plays a primary inhibitory role at very few genes, 2001; Willy et al., 2000).
but its function becomes widespread when other TBP TAF1 inhibits TBP/TATA interactions (Banik et al.,
interactions are compromised. These findings reveal 2001; Kokubo et al., 1998; Nishikawa et al., 1997). NMR
that transcriptional output is limited in part by a collab- analysis of the Drosophila TAF1 amino-terminal domain
oration of different combinations of TBP inhibitory I (TAND I) indicates that it engages in molecular mimicry
mechanisms. of the TATA box (see Figure 1A), occluding the concave
DNA binding surface of TBP (Liu et al., 1998). The yeast
TAND I region is smaller, poorly conserved, and func-
Introduction
tionally dependent upon an adjacent TAND II region
(Kokubo et al., 1998; Kotani et al., 1998). Although yeast
Transcriptional control of gene expression involves a
TAND I also appears to interact with the concave surface
dynamic interplay of positively and negatively acting
of TBP (Kokubo et al., 1998), the TBP residues involved
factors, with the relative dominance of one over the other
in binding have not been fully identified. Deletion of the
dictating transcriptional output. Negative regulation is
yeast TAND domain is expected to derepress transcrip-
generally associated with promoter inaccessibility due
tion in vivo. Except in certain artificial situations (Cheng
to chromatin structure (reviewed in Struhl, 1999). How-
et al., 2002), this has not been observed. Therefore, it
ever, loss of chromatin components, including histone remains unresolved as to whether TAND is a negative
H4, Tup1, or Sir3, has surprisingly modest effects on regulator in vivo.
transcription (DeRisi et al., 1997; Wyrick et al., 1999). In the absence of DNA, the conserved core of TBP
Since promoter regions are often intrinsically accessible crystallizes as a dimer (see Figure 1A), which occludes
to nuclear proteins (Mai et al., 2000, and references its DNA binding surface (Chasman et al., 1993; Nikolov
therein), there are likely to be additional general mecha- et al., 1992). In vitro, this interaction appears to be
nisms, not based solely on chromatin structure, that weaker in yeast TBP than in human TBP (Campbell et
negatively regulate transcription complex assembly. al., 2000; Coleman and Pugh, 1997; Coleman et al.,
Direct interactions of negative regulators with the gen- 1995). The physiological relevance of TBP self-associa-
eral transcription machinery might contribute to tran- tion in both yeast and humans is supported by in vivo
scriptional control. In particular, several factors target crosslinking experiments and mutational studies (Jack-
the TATA binding protein (TBP) in all eukaryotes, includ- son-Fisher et al., 1999; Taggart and Pugh, 1996). Muta-
ing NC2, TAF1 (formerly TAFII145/130 in yeast and tions along the crystallographic concave DNA binding
TAFII250/230 in metazoans), TBP itself, Mot1, Spt3, and and dimerization surface (TBPEB
series) inhibit TBP self-
the Not-Ccr4 complex. How these factors interrelate to association to varying extents, while TATA binding is
regulate transcription through TBP is not known. To equally impaired (Jackson-Fisher et al., 1999). A strong
begin understanding the regulatory network by which correlation exists between dimer instability measured
these factors function, we first focused on three well- in vitro and elevated basal (EB) transcription in yeast,
as measured by -galactosidase activity from a lacZ
reporter gene. Consistent with the notion of autorepres-3
Correspondence: bfp2@psu.edu
sion, overexpression of wild-type TBP does not lead4
Present address: Johnson and Johnson Pharmaceutical Re-
search & Development, 1000 Route 202, Raritan, New Jersey 08869. to elevated basal transcription. Moreover, in a dose-
2. Molecular Cell
872
dependent manner, TBP overexpression suppresses the Results
elevated basal transcription caused by the dimerization-
impaired TBPEB
mutants, perhaps by driving unfavorable Yeast TBP/TAND and TBP Dimers Have Overlapping
dimer formation with the TBPEB
mutants via mass action but Distinct Interfaces
(Jackson-Fisher et al., 1999). While TBP is subjected to Amino acids V69, V71, and V161 are located in a tight
autoinhibition in vivo, it is not known how broadly this cluster along the concave surface of TBP, forming part
mechanism is utilized genome-wide in the context of of the overlapping interfaces with TATA DNA, the TAF1
the NC2 and TAND inhibitory mechanisms discussed TAND I domain, and a second molecule of TBP, as de-
above. fined by crystallography and NMR (see Figure 1A). Using
Since the concave surface of TBP has the potential a GST pull-down assay, we previously measured the
to engage in multiple positive and negative interactions, relative effect of six individual mutations of these amino
such as with TATA, TBP, and the TAF1 TAND domain, acids (collectively designated “EB”) on TBP dimer stabil-
mutations along the concave surface could affect more ity (Jackson-Fisher et al., 1999). The following trend for
than one interaction. However, each of these interfaces dimer stability was observed: (WT, V71E) Ͼ V161E Ͼ
of TBP with its target are chemically distinct and there- N69S Ͼ (V71R, V161R, N69R). The trend agreed well with
fore could elicit characteristic phenotypes in response the dimer crystal structure, in which the bulky charged
to a series of TBP mutations along the concave surface. arginine substitutions are expected to disrupt dimeriza-
It might be possible to correlate specific patterns of tion the most.
gene expression with specific interactions defined bio- To compare the relative affinities of the TAF1 TAND
chemically. domain for the same mutant TBPs, a GST-TAND pull-
To investigate the potential involvement of different down assay was performed using amino acids 10–88 of
repression mechanisms functioning through the con- scTAF1 (Kotani et al., 1998). As shown in Figure 1B,
cave surface of TBP, we first examined whether the TAND (10–88), but not a mutant version (F23K, D66K),
previously characterized “EB” mutations in this region retained wild-type TBP, as previously reported (Kokubo
affect binding to the TAF1 TAND domain. Next, we initi- et al., 1998). A single point mutation (D66K) had an inter-
ated a genome-wide study to examine the interplay of mediate effect. A range of affinities of GST-TAND for
factors that interact with TBP’s concave surface (DNA, the TBP mutants was observed, having the following
TAND, TBP homodimerization, and possibly others) to trend: (WT, V71R, N69S) Ͼ V161E Ͼ N69R Ͼ (V71E,
regulate transcription. Their relationship with NC2 was V161R).
also examined. TAND contribution was assessed by Previously, we reported a tight negative correlation
comparing strains containing and lacking the TAND do- between the relative stability of TBPEB
dimers in vitro
main. Contributions from DNA binding and TBP dimer- and the level of basal transcription of a reporter gene
ization were examined through use of the EB mutants. in vivo (Jackson-Fisher et al., 1999). In contrast, less of
These factors are distinguishable in that DNA plays a a correlation was observed for TBPEB
/TAND stability.
positive role and dimerization plays a negative role in For example, although V71E destabilized TAND binding
regulating gene expression. NC2 was examined using in vitro, and V71R did not, V71R showed substantially
a TBP mutation (F182V) that abolishes NC2 interactions. higher levels of basal transcription in vivo than V71E.
Through microarray analysis, we find that expression Therefore, the previously observed elevated basal tran-
of approximately 40% of the yeast genome is sensitive scription is unlikely to be attributed to a loss of TBP/
to either mutations along TBP’s concave surface or a TAND interactions. This conclusion is confirmed by the
mutation that affects NC2 binding, particularly when the
observation that deletion of the TAND domain did not
TAND domain of TAF1 is absent. The affected genes
significantly enhance basal transcription of the same
cluster into four major groups, which show distinct sen-
reporter gene (data not shown). As shown below, the
sitivities to the various mutations. The first group of
TBPEB
mutants lead to transcription derepression even
genes is highly expressed and appears to be sensitive
in the absence of the TAF1 TAND domain. Moreover,
to TBP/DNA stability. Interestingly, expression of this
the TBPEB
mutants (except V71E) were generally not
group appears to be attenuated primarily by NC2 and
defective in coimmunoprecipitation of TAF1 in whole
partially by the TAF1 TAND domain. The second group
cell extracts (see Supplemental Figure S1 at http://
is positively regulated by TAND, particularly when TBP/
www.molecule.org/cgi/content/full/10/4/871/DC1).
DNA interactions are compromised. The third group is
negatively regulated by at least two seemingly redun-
TBPEB
Mutations Are Synthetically Toxic withdant factors: the TAF1 TAND domain and an unidentified
a Deletion of the TAF1 TAND Domainactivity. The fourth group of genes is largely repressed.
TBP is inhibited by a variety of factors, including NC2,TBP dimerization and the TAF1 TAND domain contribute
the TAF1 TAND domain, and homodimerization. The in-to their repression, with TBP dimerization playing the
teraction of these factors along TBP’s surface has beenmore predominant role. These repressed genes are
defined by structural and genetic methods. To examinefound throughout the genome, but are particularly prev-
how the function of these various repressors relate toalent in the repressive subtelomeric environment. The
each other, we sought to selectively eliminate individu-findings presented here suggest that a large portion of
ally and in combination their interaction with TBPthe yeast genome is negatively regulated through TBP
through targeted mutagenesis. The TBPEB
mutationsby a collaboration of different combinations of factors,
were used to examine TBP’s positive interactions withincluding NC2, TAF1, TBP dimerization, and others.
DNA and negative interactions through homodimeriza-Which combination is used might be dependent upon
the expression level of the gene. tion (and potentially TAND interactions). TAND function
3. Multiple TBP Inhibitory Mechanisms
873
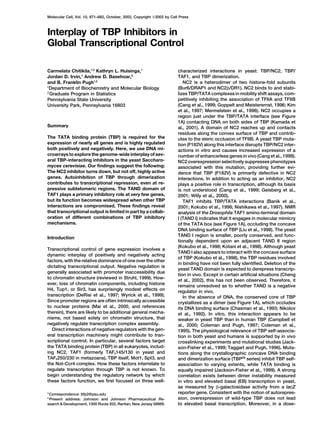
Figure 1. Interaction of TBP with Regulatory Factors
(A) Structures of TBP interactions relevant to this study. Shown is the core of yeast TBP interacting with itself (Chasman et al., 1993; Nikolov
et al., 1992), the Drosophila TAND I domain (Liu et al., 1998), and TATA DNA plus human NC2 (Kamada et al., 2001). The TFIIA•TBP•TATA•TFIIB
structure is a composite of two structures (Nikolov et al., 1995; Tan et al., 1996). All views are from the same vantage point: upstream of the
TATA box looking downstream. Selected amino acids are shown as stick diagrams. The relative affinity of each negative regulator (shown in
red) for the relevant TBP mutants is shown below each diagram. Those in parentheses are not significantly different from each other.
(B) TBP’s interaction surface with the yeast TAF1 TAND domain. Purified recombinant GST-scTAF1 (10–88) (denoted as TAND), GST-scTAF1(10–
88, D66K), or GST-scTAF1(10–88, F23K, D66K) were immobilized on glutathione agarose in the presence of purified his-tagged TBP mutants,
as indicated. The resins were washed, and proteins were analyzed for TBP and GST by SDS-PAGE and immunoblotting. 15% of the input
material was loaded where indicated. Relative pull down represents the average of at least three repeats.
was explicitly tested by deleting this domain. NC2 func- basal transcription (Jackson-Fisher et al., 1999). There-
fore, the TBP mutants were expressed in the context oftion was probed through use of the TBP F182V mutation.
As an initial indicator of important interactions, we ex- the wild-type chromosomal TBP (SPT15) gene. Since
some of TBPEB
mutants are rapidly degraded in vivoamined the growth properties of cells harboring these
mutations. (Jackson-Fisher et al., 1999), and we wished to express
them at or near endogenous wild-type levels, they wereThe TBPEB
mutants are unable to support cell growth
on their own, but function dominantly to wild-type TBP placed under the control of the highly active inducible
GAL10 promoter on a CEN/ARS plasmid and grown onby inhibiting activated transcription and stimulating
4. Molecular Cell
874
Figure 2. TBPEB
Mutants in Combination with
⌬TAND Display Dominant Synthetic Toxicity
Cultures ([A], wild-type; [B], ⌬TAND), de-
scribed in Figure 3, were spotted onto solid
media containing 2% galactose and incu-
bated at 30ЊC for several days. “Dominant
synthetic toxicity” indicates that the pheno-
type was observed in the presence of wild-
type TBP and that the growth phenotypes
were severe in the ⌬TAND strain but minor in
the isogenic wild-type strain. The term “toxic-
ity” is used since the cells do not die, but do
stop growing. Growth was restored when the
arrested mutants were transferred to media
containing glucose, and it was again inhibited
upon plating on galactose. Similar synthetic
growth defects have been observed for sev-
eral mild TBP mutants that support cell viabil-
ity in the absence of wild-type TBP (Koba-
yashi et al., 2001).
galactose media. In addition to the mutants, wild-type galactose (Figure 3A). This short window of time was
intended to minimize potential indirect effects, whereand null controls were used. The null mutant is the same
as wild-type except that the first codon was mutated to any initial changes in gene expression lead to subse-
quent changes in the expression of other genes. Sincea stop codon.
In galactose media, all the TBPEB
mutants except all strains harbor a chromosomal copy of the wild-type
SPT15 (TBP) gene, only dominant effects will be ob-V161E partially inhibited cell growth in the context of
wild-type TAF1 (Figure 2A). Deletion of the TAND domain served.
Approximately 2400 genes (%04ف of the genome)alone resulted in slow growth and was suppressed by
overexpression of wild-type TBP (Figure 2B, compare changed expression significantly in at least one mutant
(see Supplemental Table S1 at http://www.molecule.“null” and “WT”), as previously observed (Bai et al.,
1997; Kotani et al., 1998). Strikingly, complete growth org/cgi/content/full/10/4/871/DC1) when we applied a
series of statistical filters described in the Experimentalinhibition was observed for all TBPEB
mutants, except
V161E, when TAND was deleted. Further examination Procedures. The significantly affected genes were clus-
tered into four groups by using a K-means algorithm.of V161E revealed that its growth was significantly
slower than wild-type, but not eliminated. Consistent These four groups reflect distinct transcriptional re-
sponses to the TBP and TAF1 mutations (Figure 3B, andwith an earlier report (Kobayashi et al., 2001), these
results suggest that TBP’s concave surface and the see Supplemental Table S2 at http://www.molecule.org/
cgi/content/full/10/4/871/DC1). Many of the mutationsTAF1 TAND domain serve an overlapping but distinct
caused both an increase and a decrease in transcription.function. Only upon loss of both activities is a severe
However, F182V (column 20) caused primarily an in-phenotype detected.
crease, while V161E (column 1) caused primarily a de-The basis for the synthetic toxicity is not clear. Since
crease. In total, the pattern of responses suggests thata greater or equal number of wild-type TBP molecules
some of the mutations affect multiple functions of TBP,also are present in the same cell (data presented below),
while others are selective.it is unlikely that the TBP mutants are titrating out an
An important concern when interpreting gene expres-important factor that would otherwise work with wild-
sion data is assessing indirect effects. Indirect effectstype TBP. However, since the mutants do cause tran-
are presumed to arise, in this case, when a mutationscriptional derepression (with V161E being the least ef-
directly affects the expression of arbitrary transcrip-fective), it is possible that toxicity is due to inappropriate
tional activators and repressors, which subsequentlyexpression of genes.
cause increased and decreased expression of other
genes that might not have been directly affected by
Genome-Wide Effects of ⌬TAND and TBP Mutations the mutation. Simultaneous increases and decreases in
As the next step in examining the functional relation- gene expression were not observed for a number of
ships among TBP regulatory interactions, we performed mutants, particularly F182V and V161E, indicating that
DNA microarray analysis of TBP mutants in strains har- the expression patterns are likely to be due to direct
boring either wild-type TAF1 or a ⌬TAND derivative. The effects. Chromatin immunoprecipitation and LexA-
strategy involved growing yeast cells in noninducing fusion studies of similar mutations along TBP’s concave
raffinose media and then briefly (45 min) inducing an surface have provided further evidence that these mu-
tants are acting directly on target promoters and engag-HA-tagged version of the TBP mutants by addition of
5. Multiple TBP Inhibitory Mechanisms
875
Figure 3. Microarray Analysis of TBP Mutants in Wild-Type and ⌬TAND Strains
(A) Strains harbored either wild-type or TAF1(⌬TAND), and the indicated HA-tagged TBP derivatives under control of the GAL10 promoter.
TBP expression was induced for 45 min, and equivalent numbers of cells were analyzed for TBP by immunoblotting (Jackson-Fisher et al.,
1999). Purified recombinant his-TBP standards are shown.
(B) Cluster analysis of gene expression profiles. Cluster and Treeview (Eisen et al., 1998) were used to cluster 2358 significant changes in
gene expression (defined in Experimental Procedures) initially into five clusters, using the K-means algorithm. Five clusters were initially
chosen since clusters greater than five were visually redundant. Upon subsequent analysis, it became evident that two of the clusters
represented similar mechanisms and so were merged to form group 1. Group 1 was then sorted by the values in the F182V column. Each
column represents gene expression changes in the strain designated above each column. Names are colored to signify related mutations.
Strains indicated by ⌬TAND contained a deletion of the TAF1 TAND domain, while the remainder were isogenic wild-types. Each row
corresponds to an expression ratio for a single gene (red ϭ increased expression, green ϭ decreased expression, black ϭ no change, gray ϭ
missing data). The intensity of color correlates to the magnitude of change. The collection of columns were subjected to hierarchical clustering
using Cluster and Treeview, and the resulting dendrogram is shown above the list of mutants.
Several experiments provide a frame of reference. (1) Two independent reference versus reference data sets (null TBP in a wild-type TAF1
strain, columns 18 and 19) are indicative of no change. (2) To assess the full reproducibility of the experiments, the V161R experiments (in
both wild-type TAF1 and ⌬TAND strains) were repeated approximately a year apart by different persons (V161RK versus V161RL, columns 4,
5, 11, and 12). Of the typically Ͼ5700 genes that passed filtering criteria 1 (see Experimental Procedures), correlation coefficients of 0.9 and
0.8 for wild-type and ⌬TAND, respectively, were obtained, indicating a high degree of reproducibility.
(C) Dendrograms derived from hierarchical clustering of mutants in groups 1 and 4. Portions of the dendrogram that encompass the TBPEB
arginine mutants are boxed in yellow. “⌬” indicates ⌬TAND.
ing the transcription machinery (Geisberg and Struhl, made from Figure 3B. First, the large number of genes
affected by the TBP mutations indicates that a substan-2000). Further assessment of indirect effects is pre-
sented in the supplemental material at http://www. tial amount of global gene regulation occurs via regula-
tion of TBP. Second, the TBPEB
mutants behaved simi-molecule.org/cgi/content/full/10/4/871/DC1.
Several general observations and inferences can be larly but not identically, indicating that mutations along
6. Molecular Cell
876
Figure 4. Dependency of Selected Groups of Genes on the TAF1 TAND Domain
For the indicated groups of genes, log2 ratios of fold changes in gene expression for the indicated mutants in the ⌬TAND strain were plotted
as a function of the same mutants in the corresponding wild-type strain. Two groups were plotted in each panel. TAND effects are reflected
as deviations of the data points from the red diagonal.
TBP’s concave surface alter certain interactions but not genes in each group. Models to aid in the discussion of
the groups are shown in Figure 7. For simplicity, theseothers. Third, since some TBPEB
mutations caused both
increased and decreased expression, TBP’s concave models do not include other components of the tran-
scription machinery, and they make no inference aboutsurface is likely to be engaged in both positive and
negative interactions. Fourth, deletion of the TAND do- TAF occupancy at the promoters.
main had very modest effects on transcription (column
15), unless coupled to defects along TBP’s concave
surface (columns 8–14). This type of behavior is indica-
tive of functional redundancy between the TAND domain
and other factors that interact with the concave surface
of TBP. Fifth, overexpression of wild-type TBP (column
17) caused Ͻ0.5% of the genome to significantly change
expression. The concentration of TBP, per se, therefore
is not limiting for gene expression. Additional genome-
wide comparisons of the mutants can be found in Sup-
plemental Figure S4 at http://www.molecule.org/cgi/
content/full/10/4/871/DC1.
Distinct Gene Expression Groups Reveal
Combinatorial Interactions of TBP Regulators
Since the four expression groups shown in Figure 3B
reflect distinct response patterns to the mutations, we
investigated their underlying mechanisms by examining
them separately. The data were examined in a number
of ways, as shown in Figures 3C, 4, 5, and Supplemental
Figure S5 (at http://www.molecule.org/cgi/content/full/
10/4/871/DC1). First, the mutants in each group were
reclustered separately using a hierarchical method. If
Figure 5. Expression Level of Various Gene Groups
multiple factors interact along TBP’s surfaces, then TBP
Fold changes in gene expression (log2 ratio) for representative mu-
mutations that disrupt certain interactions but not others
tants in each indicated group of genes were plotted as a function
might generate a characteristic transcriptional re- of log10 expression intensity in the reference state (null TBP in a
sponse. Comparison of this pattern with patterns of in wild-type TAF1 strain). Intensities represent an average from 12
reference hybridizations. The entire nullL dataset is plotted in blackvitro interactions of the mutants might shed light on
to provide a frame of reference for the distribution of gene expres-the underlying mechanism. Second, the specific TAND
sion intensities. Group 1, represented by the V161RK mutant in thedependency of representative mutants from each group
wild-type TAF1 strain, is plotted in the lower half of the panel (green).
was examined quantitatively to assess the influence of
Group 4, represented by the V161RK mutant in the ⌬TAND strain, is
TAND on gene expression. Third, to examine whether plotted in the upper half of the panel (red). Plots of other groups can
particular regulatory mechanisms direct absolute output be found in Supplemental Figure S6 at http://www.molecule.org/cgi/
content/full/10/4/871/DC1.levels, we examined the absolute expression level of
7. Multiple TBP Inhibitory Mechanisms
877
Group 1 genes decreased in expression upon muta- in group 3), suggesting that positive TBP/DNA interac-
tion of the concave surface of TBP (Figure 3B, columns tions are not rate limiting for these genes. TAND nega-
1–7 of group 1). Hierarchical clustering of the mutants tively regulated this group only in the presence of the
(columns) in group 1 indicated that all TBPEB
mutations TBPEB
mutants, as evidenced by a leftward deviation
in the wild-type TAF1 strain had equivalent negative from the diagonal of group 3 genes in Figure 4A (shown
effects on TBP function (Figure 3C, group 1). Previously, in red). All the TBPEB
data sets derived from the ⌬TAND
we had shown that all six of these TBPEB
mutants are strain appeared to be very similar (reflected by the shal-
similarly impaired for TATA binding in vitro, but show low dendrogram branches in Supplemental Figure S5,
large differentials in dimerization and TAND binding group 3, at http://www.molecule.org/cgi/content/full/
(Jackson-Fisher et al., 1999) (Figure 1B). Therefore, ex- 10/4/871/DC1). This is not the behavior expected from
pression of this group of genes correlated best with impaired TBP dimerization. V161R, N69R, and V71R dis-
TBP/DNA stability. play severe dimerization defects when compared to the
Deletion of the TAF1 TAND domain by itself had little other EB mutants (V161E, N69S, and V71E), and thus
effect on group 1 expression (Figure 3B, column 15 in they should cluster separately from them. Since this was
group 1) but partially suppressed the decreased tran- not observed, we suspect that an additional unidentified
scription caused by the TBPEB
mutations (Figure 4A, negative regulator that interacts with TBP’s concave
shown as a deviation of the green data points from the surface might be in play (Figure 7, model 3), although
diagonal). Thus, the TAF1 TAND domain might play a other interpretations are not excluded.
negative role at group 1 genes, but this only becomes Group 4 genes clustered furthest to the left in the
detectable when TBP’s positive function (i.e., DNA bind- intensity profiles (Figure 5, group 4 shown in red). The
ing) is compromised. median expression level of this group was 20% of the
Strikingly, most of the genes in group 1 appear to be group 1 level, and thus appeared to be generally re-
negatively regulated by NC2, since the F182V mutation pressed or only weakly active. Mutations along the con-
leads to increased expression (Figure 3B, column 20 in cave surface of TBP lead to increased transcription in
group 1). Inhibition by NC2 is detectable in the presence both the wild-type and ⌬TAND TAF1 strains (Figure 3B,
of TAND, whereas the reciprocal is not true (column group 4). Therefore, positive TBP/DNA interactions do
20 versus 15). Therefore, NC2 appears to be a more not appear to be rate limiting for these genes. Like group
predominant inhibitor than TAND at these genes. Inter- 3, deletion of the TAND domain exacerbated the in-
estingly, group 1 genes that are the most sensitive to creased transcription of group 4 (Figures 3B and 4B,
the F182V mutation tended to be less sensitive to the red), indicating that TAND is playing an inhibitory role.
TBPEB
mutations. This suggests that NC2 stabilizes TBP The transcriptional response from the V161R, V71R, and
at many group 1 promoters, despite playing a negative N69R mutants clustered very tightly (Figure 3C, group
role. 4, and see Supplemental Figure S5 at http://www.
We next looked at the absolute expression level of molecule.org/cgi/content/full/10/4/871/DC1), regard-
group 1 genes in the reference state (wild-type TAND, less of whether TAND was present, and showed a much
“null” TBP overexpression). Fold changes in gene ex- greater transcriptional effect than V161E, V71E, and
pression for a representative group 1 mutant (V161R) N69S. The pattern of response is very similar to the
were plotted as a function of absolute expression inten- pattern of impaired dimerization displayed by these mu-
sity (Figure 5, green). As a guide for comparison, the tants in vitro (Jackson-Fisher et al., 1999). Therefore, we
distribution of expression intensities for all genes in a suspect that TBP dimerization is contributing signifi-
null mutant were also plotted (black). Of the four groups,
cantly to the repression of group 4 genes (Figure 7,
group 1 represented the most highly expressed set,
model 4).
clustering to the far right of the expression intensity
profile and having a median expression level %05ف
Repressive Subtelomeric Regions Are Intrinsicallyhigher than the next highest group (see Supplemental
Accessible to the General Transcription MachineryFigure S6 at http://www.molecule.org/cgi/content/full/
Subtelomeric regions as far as 15 kb from chromosomal10/4/871/DC1). Together, the group 1 data suggest that
ends tend to be quite repressive for resident genesNC2 is an inhibitor of highly expressed genes (Figure 7,
(Aparicio et al., 1991; Grunstein, 1998; Kurtz and Shore,model 1).
1991; Kyrion et al., 1993; Loo and Rine, 1995; Zakian,Group 2 genes were also highly active (see Supple-
1996). Sir proteins direct subtelomeric silencing out tomental Figure S6 at http://www.molecule.org/cgi/
about 3–4 kb, but in regions out to 51ف kb, histone H4content/full/10/4/871/DC1). The genes in this group
and presumably other histones direct Sir-independentwere equivalently sensitive to mutations along TBP’s
repression (Hecht et al., 1996; Wyrick et al., 1999). How-DNA binding surface (see Supplemental Figure S5 at
ever, Ͻ10% of telomere-proximal genes are dere-http://www.molecule.org/cgi/content/full/10/4/871/
pressed upon deletion of SIR3, and Ͻ50% are dere-DC1).Unlike group 1 genes, TAND functioned positively
pressed upon depletion of histone H4 (Wyrick et al.,on group 2 genes (Figures 3B and 4B), particularly when
1999). Therefore, many telomere-proximal genes mightthe DNA binding surface of TBP was compromised (Fig-
be subjected to other modes of repression.ure 7, model 2).
Genes that belong to groups 3 and 4 appear to beGroup 3 genes appeared to be less active than those
weakly active or repressed and are sensitive to TBPin groups 1 and 2 (see Supplemental Figure S6 at http://
inhibition, rather than being sensitive exclusively towww.molecule.org/cgi/content/full/10/ 4/871/DC1).
chromatin structure. Therefore, we expected that genesMutations along the concave surface of TBP, in general,
lead to increased transcription (Figure 3B, columns 1–14 in these two groups would not be found in presumably
8. Molecular Cell
878
(TAND), we also examined the TBP mutants in strains
lacking the TAND domain.
The microarray data are interpreted within the context
of established properties of these regulators. Thus, ac-
tive genes generally have TBP bound to their promoters;
inactive genes generally do not (Kuras and Struhl, 1999;
Li et al., 1999). Therefore, transcriptional output gener-
ally can be interpreted as a reflection of TBP occupancy.
When TBP is bound to active RNA polymerase II promot-
ers, where tested, it invariably also has NC2 bound
(Geisberg et al., 2001). NC2 stabilizes TBP/TATA interac-
tions in vitro and competitively inhibits TFIIB and TFIIA
binding (Cang et al., 1999; Goppelt and Meisterernst,
1996; Kim et al., 1997; Mermelstein et al., 1996). When
TBP is not bound to DNA, evidence suggests that its
DNA binding surface is complexed with inhibitors, such
as the TAND domain of TAF1 (Banik et al., 2001; Kokubo
et al., 1998; Nishikawa et al., 1997) or a second molecule
of TBP (Coleman and Pugh, 1997; Jackson-Fisher et al.,
1999). All of these observations are well supported by
crystallographic or NMR structures of these interactions
(Figure 1A), and these physical structures have been
Figure 6. Subtelomeric Frequency Profile of Group 3 and 4 Genes
validated using mutagenesis and interaction assays in
Shown is a composite profile of all 32 subtelomeric regions. The
vitro and in vivo.frequencies of nonrepetitive genes that increased in expression in
The main conclusion of this work is that expressiona 50 gene window, tiled every 10 genes, were plotted as a function
of a substantial portion of the yeast genome is regulatedof their average distance from the telomere (Wyrick et al., 1999).
Group 3 is shown in blue and group 4 in red. Also plotted (open in part by the concerted action of a variety of TBP inhibi-
circles) is the percentage of genes in the same 50 gene window tors (Figure 7). In particular, we find that NC2 attenuates
that are in the lowest tenth percentile of genome-wide expression
transcriptionally active genes. The TAND domain of
levels.
TAF1 has both positive and negative functions, but the
cell does not fully depend upon these functions unless
other TBP interactions are compromised. For repressedchromatin-repressed subtelomeric regions. To address
or lowly expressed genes, our results suggest that TBPthis, the frequency of group 3 and 4 genes was plotted
dimerization plays a substantial repressive role. TBPas a function of distance from chromosomal ends (Fig-
self-association might keep an otherwise monomericure 6). As a measure of the boundary of the repressive
TBP from binding to repressed genes located withinsubtelomeric region, the frequency of genes in the low-
accessible chromatin (including the normally repressiveest tenth percentile of genome-wide expression inten-
subtelomeric environment). Our results also indicatesity was also plotted. The weakly expressed genes of
that an unidentified activity that functions through TBP’sgroup 3 appeared to be generally absent from subtelo-
concave surface also inhibits TBP, particularly whenmeric regions, as expected. Surprisingly, group 4 genes
TAND function is absent.were quite prevalent and were as frequent as the lowest
tenth percentile of expressed genes throughout the ge-
nome. Expression of as much as 30% of the genes in NC2 Attenuates Highly Active Genes
NC2 plays both a negative and positive role in transcrip-the subtelomeres appeared to be sensitive to negative
interactions along TBP’s concave surface. These find- tion (Cang et al., 1999; Geisberg et al., 2001; Willy et al.,
2000). Its histone fold domain binds to the bent DNAings indicate that the repressive subtelomeric environ-
ment is intrinsically accessible to the general transcrip- beneath the TBP/TATA complex (Kamada et al., 2001)
and is required for NC2’s positive and negative functiontion machinery.
(Willy et al., 2000). Alpha helices H4 and H5 protrude
from the core of NC2 (see Figure 1A) and are requiredDiscussion
for NC2’s inhibitory activity (Willy et al., 2000). The H5
helix binds TBP’s convex surface and interacts withThe Yeast Genome Is Negatively Regulated in Part
by a Variety of TBP Inhibitors amino acid F182 on TBP, positioning H4 to block TFIIB
access (Kamada et al., 2001). Consistent with the inhibi-To investigate how TBP interactions contribute to the
global gene regulatory network in yeast, we have cre- tory function of H5, mutation of F182 to valine disrupts
NC2 binding and causes an increase in transcription.ated a number of mutations in TBP that differentially
affect TBP binding to DNA, NC2, the TAF1 TAND domain, The properties of NC2 raise a number of questions
about seemingly paradoxical behavior. First, as a re-and a second molecule of TBP. These mutants were
briefly expressed in an otherwise wild-type TBP strain, pressor, NC2 might be expected to operate at lowly
expressed or repressed genes, not at highly activeand effects on the expression of individual genes
throughout the genome were examined using DNA mi- genes. If NC2 prevents essential transcription factors
like TFIIA and TFIIB from assembling at a promoter, thencroarrays. To more directly examine the potentially sub-
tle contribution of TAF1’s N-terminal inhibitory domain how can genes that have NC2 bound at their promoters
9. Multiple TBP Inhibitory Mechanisms
879
Figure 7. Models for the Interplay of TBP Effectors in Regulating the Four Groups of Genes Identified in This Study
Positively acting functions are shown in green, and negatively acting functions are shown in red. The thickness of the black equilibrium arrows
reflects the tendency of one interaction to dominate over another.
be actively transcribed? Second, how can a factor act Multiple Inhibitory Interactions along TBP’s Concave
Surface Provide Redundant Mechanisms fornegatively on one hand and positively on the other, par-
ticularly if the same structural interactions are involved in Preventing Unregulated Transcription
In contrast to NC2’s modulation of the accessibility andboth? The latter question is of general interest because
many transcription factors, including TBP, TAF1, and stability of the TBP/DNA complex, TBP dimerization ap-
pears to serve a repressive role by keeping TBP off ofNC2, play both positive and negative roles in tran-
scription. the DNA (Figure 7, model 4). Genes that have accessible
promoter regions are susceptible to being turned onThese apparent contradictions might be reconciled in
the context of a model where transcriptional output is when the dimerization function of TBP is eliminated
through mutation, or by the positive action of transcrip-dictated not by an all-or-none binding of factors, but by
the net effect of a dynamic and continuous interplay of tional activators. The buffering effect of dimerization
provides one explanation as to why overexpression ofpositively and negatively acting factors. While compo-
nents of the transcription machinery may be making wild-type TBP does not lead to increased gene ex-
pression.similar interactions regardless of gene expression lev-
els, the relative stability of these interactions may limit The TAND domain of TAF1 exhibits limited inhibitory
effects on transcription, which might be attributed to atranscriptional output. In particular, dynamic competi-
tion between negatively acting NC2 and positively acting number of mechanisms. First, some genes might not be
regulated by TAF1 (i.e., are TAF independent), and thusTFIIA and/or TFIIB (and hence RNA polymerase II holo-
enzyme) for binding to a TBP/DNA complex might limit they are not sensitive to deletion of the TAND domain.
Second, TBP must first dissociate from DNA beforetranscriptional output at highly active genes. For other
genes, where weak TBP/DNA interactions might be lim- TAND I can bind TBP (Banik et al., 2001; Kokubo et al.,
1998). If TFIIA, TFIIB, and other factors stabilize TBP/iting transcriptional output, NC2 could make a net posi-
tive contribution by stabilizing the binding of TBP to DNA binding, particularly at highly active promoters,
then the TAND domain cannot inhibit TBP binding. Muta-DNA (in addition to being antagonistic to TFIIA/B in a
non rate-limiting way). Indeed, NC2 plays a positive role tions along the concave DNA binding surface of TBP
that destabilize TBP/DNA interactions could lead to in-at TATA-less promoters (Willy et al., 2000). Interestingly,
we find that highly expressed genes that are inhibited creased dissociation of TBP (manifested as a decrease
in transcription) and increased susceptibility to the in-by NC2 tend to be less sensitive to mutations along
TBP’s DNA binding surface, which suggests that NC2 hibitory action of the TAND domain (Figure 7, models
1, 3, and 4). Thus, for group 1 genes, deletion of themight be stabilizing TBP/DNA interactions while none-
theless inhibiting the expression of these genes. If NC2’s TAND domain partially suppresses mutations that impair
TBP/DNA interactions (Figure 3B). A third explanationpositive and negative contributions are mutually off-
setting at some promoters, then NC2 might not appear for a lack of a dominant TAND effect is applicable to
group 3 and 4 genes. For these genes, alternative TBPto regulate these promoters despite being bound to
them. Consistent with this, NC2 appears to be bound repressors (an unknown factor for group 3, and possibly
dimerization for group 4) might dominate the repressionto all mRNA promoters tested that are also occupied
by TBP (Geisberg et al., 2001). While TFIIB also appears of TBP that is not bound to DNA. Only in the context of
mutations that destabilize these inhibitory interactionsto be bound at the same promoters, the two might not
be bound at the same time and could be in dynamic does the inhibitory function of the TAND domain affect
transcriptional output. Thus, TAND’s potential as a neg-competition.
10. Molecular Cell
880
ative regulator may be widespread, but largely redun- Coleman et al., 1999; Kamada et al., 2001; Kim et al.,
1997; Kokubo et al., 1998; Kotani et al., 2000; Mer-dant with other TBP inhibitors.
melstein et al., 1996). Activators might also play a direct
role in alleviating TBP repression. For example, c-junThe Repressive Subtelomeric Environment Is
interacts with the TAND domain of hsTAF1 to alleviateAccessible to the General Transcription Machinery
transcriptional repression (Lively et al., 2001). In thisHistones and other chromosomal proteins are important
study, we have described the interplay of several inhibi-negative regulators of gene expression. Subtelomeric
tors of TBP. There are likely to be multiple inhibitors atregions are particularly repressive (Aparicio et al., 1991;
all stages of the gene activation process. Peeling backGrunstein, 1998; Kurtz and Shore, 1991; Kyrion et al.,
each layer of this complex network of regulation should1993; Loo and Rine, 1995; Zakian, 1996). Active genes
help illuminate some of the underlying mechanisms gov-placed within these regions are often silenced. Silencing
erning gene regulation.is due in part to Sir proteins, which are thought to gener-
ate an inaccessible heterochromatin structure emanat-
Experimental Proceduresing from the telomeres and extending inward about 3–4
kb along the chromosome (Hecht et al., 1996; Wyrick et
GST Pull-Down Assays
al., 1999). Less than 10% of the telomere-proximal genes Pull-down assays were performed as described (Kotani et al., 1998),
fall under Sir regulation (Wyrick et al., 1999). Sir-indepen- using 300 nM of the following purified recombinant proteins: GST-
dent nucleosomal repression extends to about 15 kb TAF1(10–88), GST-TAF1(10–88, F23K, D66K), GST-TAF1(10–88,
D66K), or GST, and his-yTBP derivatives. TBP derivatives were puri-and is much more prevalent (Wyrick et al., 1999). Consis-
fied as described (Jackson-Fisher et al., 1999). Reactions containedtent with this, we find that as many as 40% of the nonre-
150 mM KCl, 20 mM Tris-Cl (pH 8.3), 12.5 mM MgCl2, 10% glycerol,
petitive genes near the telomeres are in the lowest tenth
50 g/ml bovine serum albumin, and 1 mM dithiothreitol in 100 l;
percentile of genome-wide expression levels. resins were washed three times, each with 500 l of reaction buffer.
Surprisingly, as many as 30% of the genes in regions TBP was probed by immunoblotting and detected by enhanced
close to the telomeres were classified as group 4. Group chemiluminescence. All reactions were performed at least three
times, and representative data are shown. TBP was quantitated by4 genes are characterized as being repressed or lowly
densitometric scanning of autoradiograms. Relative pull down wasexpressed due in part to inhibition of TBP. The frequency
determined by subtracting local background and normalizing to a
of occurrence of group 4 genes within subtelomeric re-
wild-type TBP pull down present on the same gel.
gions is four times higher than the genome-wide average
of 7% and is about the same as the frequency of the Assay for Synthetic Toxicity
lowest tenth percentile of genome-wide expression. The yeast plasmid shuffle strain Y13.2 (MAT␣ ura3-52 trp1-⌬63
This suggests that many repressed promoters in leu2,3-112 his3-609 ⌬taf145 pYN1/TAFII145), and plasmids pRS314/
TAFII145(WT) and pRS314/TAFII145 (⌬10–73) were a gift from T. Ko-subtelomeric regions and throughout the genome are
kubo (NIST, Japan) (Kokubo et al., 1998). Plasmid shuffling was usedaccessible to TBP/TFIID and the general transcription
to exchange the endogenous pYN1/TAFII145 plasmid with either the
machinery. If repressive nucleosomes nevertheless re-
wild-type or ⌬TAND TAF1 plasmids. Plasmids expressing various
side at these promoters, then accessibility might also TBP derivatives under control of the GAL10 promoter have been
require chromatin remodeling activities associated with described (Jackson-Fisher et al., 1999) and were transformed into
TFIID and/or the general transcription machinery. We both wild-type and ⌬TAND TAF1 strains. Transformants were se-
lected on CSM-Leu-Trp plus 2% glucose, and subsequently grownfind that lowly expressed genes of groups 3 and 4 show
in CSM-Leu-Trp plus 2% raffinose liquid media. At OD600 ϭ 1.0, 10a general sensitivity toward deletion of the TAF1 TAND
l of washed cells, or serial 10-fold dilutions, were plated onto CSM-
domain, which might reflect a requirement for TFIID in
Leu-Trp plus 2% galactose agar.
delivering TBP to their promoters. Alternatively, if the
core promoters are intrinsically accessible, then the re-
Microarray Analysis
pressive nature of the subtelomeres might be directed Amplification of 6188 open reading frames (99.4% coverage) of S.
at steps upstream of TBP/TFIID recruitment, such as cerevisiae strain S288C was performed as described at http://
cmgm.stanford.edu/pbrown/. All PCR products were confirmed topreventing key gene-specific activator proteins from
be the correct size by gel electrophoresis. Microarray fabricationbinding.
was performed on aminosilane glass slides at the Penn State Univer-One study has suggested that the Sir-repressed
sity Microarray facility.
HMRa1 promoter is occupied by TBP and is repressed
All experiments were performed in derivatives of S. cerevisiae
downstream of TBP recruitment (Sekinger and Gross, strain Y13.2 (described above). The reference strain for all experi-
2001). We find that the HMRa1 gene is unaffected by ments contained wild-type TAF1 and a galactose-inducible null de-
rivative of TBP (having a stop codon at position 1): pCALF-T(M1stop)any of our TBP mutants, which is consistent with the
(GAL). Strains were grown in CSM-Leu-Trp plus 3% raffinose atnotion that this promoter and many others are not regu-
30ЊC to an OD600 ϭ .8.0ف Galactose (2%) was then added for 45lated at the point of TBP access. However, our data do
min. Samples for immunoblotting were taken before and after induc-
not distinguish whether HMRa1 is regulated before or
tion, and equivalent numbers of cells were analyzed (equivalent to
after TBP recruitment. 0.5 ml of OD 1.0). The remainder of the culture was harvested by
Ultimately, sequence-specific activators control the centrifugation at room temperature, washed, and frozen in liquid
nitrogen over a period of 15 min. Total RNA was extracted by theexpression of most genes. They do so by regulating
hot acidic phenol method (Holstege et al., 1998). Poly(A)ϩ RNA waspromoter accessibility, factor recruitment, and competi-
isolated using Oligotex resin (Qiagen) according to the manufactur-tion between positive and negative regulators. Part of
er’s instructions. It was then treated with DNase I as described
the activation process involves removal of TBP inhibi-
(Ausubel et al., 1994) and stored in water at Ϫ80ЊC. Poly(A)ϩ RNA
tors. Indeed, TFIIA counteracts TBP dimerization and (2 g) was then reverse-transcribed with aminoallyl-dUTP, followed
TBP/TAND, TBP/Mot1, and TBP/NC2 interactions (Au- by incorporation of Cy3 or Cy5. Microarrays were scanned and
quantitated with a GenePix 4000A scanner and GenePix 3.0 softwareble et al., 1994; Cang et al., 1999; Chicca et al., 1998;
11. Multiple TBP Inhibitory Mechanisms
881
(Axon Instruments). All experiments were performed in duplicate Auble, D.T., Hansen, K.E., Mueller, C.G., Lane, W.S., Thorner, J.,
and Hahn, S. (1994). Mot1, a global repressor of RNA polymerasefrom independent transformants in which the dyes for the reference
and test samples were swapped. Additional details can be found in II transcription, inhibits TBP binding to DNA by an ATP-dependent
mechanism. Genes Dev. 8, 1920–1934.the supplemental material at http://www.molecule.org/cgi/content/
full/10/4/871/DC1. Ausubel, F.M., Brent, R., Kingston, R.E., Moore, D.D., Seidman, J.G.,
Smith, J.A., and Struhl, K. (1994). Current Protocols in Molecular
Statistical Filtering Biology (New York: John Wiley & Sons).
All gene expression ratios from a single array of test versus reference Bai, Y., Perez, G.M., Beechem, J.M., and Weil, P.A. (1997). Structure-
were normalized by mode centering, which sets the peak of a function analysis of TAF130: identification and characterization of
smoothed frequency histogram of the log2 ratios to zero. This a high-affinity TATA-binding protein interaction domain in the N
method of normalization assumes that the most frequent ratios re- terminus of yeast TAF(II)130. Mol. Cell. Biol. 17, 3081–3093.
flect an unchanging population of mRNAs. Unlike the more common
Banik, U., Beechem, J.M., Klebanow, E., Schroeder, S., and Weil,
method of normalizing to total signal, mode centering is insensitive
P.A. (2001). Fluorescence-based analyses of the effects of full-
to changes in gene expression. This includes asymmetric changes
length recombinant TAF130p on the interaction of TATA box-binding
where only increases or decreases in gene expression are observed.
protein with TATA box DNA. J. Biol. Chem. 276, 49100–49109.
Normalization by mode centering was validated in every experiment
Campbell, K.M., Ranallo, R.T., Stargell, L.A., and Lumb, K.J. (2000).by taking an equal number of test and reference cells (measured
Reevaluation of transcriptional regulation by TATA-binding proteinby OD600) and spiking in equal amounts of externally generated poly-
oligomerization: predominance of monomers. Biochemistry 39,adenylated unique mRNAs (B. subtilis LysA, PheB, ThrC, TrpE,
2633–2638.DapB) (Holstege et al., 1998). The spiked controls were processed
Cang, Y., Auble, D.T., and Prelich, G. (1999). A new regulatory do-along with the total yeast mRNA and hybridized to cognate features
main on the TATA-binding protein. EMBO J. 18, 6662–6671.on the arrays. The Cy3/Cy5 ratios of the spiking controls were nor-
malized using the same factor used to normalize the yeast mRNA Chasman, D.I., Flaherty, K.M., Sharp, P.A., and Kornberg, R.D.
data. In all cases, their ratios were within 10% of 1.0, which validates (1993). Crystal structure of yeast TATA-binding protein and model
the assumption that the most frequent ratios reflect an unchanging for interaction with DNA. Proc. Natl. Acad. Sci. USA 90, 8174–8178.
population of mRNAs.
Cheng, J.X., Nevado, J., Lu, Z., and Ptashne, M. (2002). The TBP-
To assess the intrinsic error from all sources in the microarray
inhibitory domain of TAF145 limits the effects of nonclassical tran-
experiments, we used 13 independently derived reference versus
scriptional activators. Curr. Biol. 12, 934–937.
reference hybridizations to assess gene-specific and overall varia-
Chicca, J.J., 2nd, Auble, D.T., and Pugh, B.F. (1998). Cloning andtion when no changes were taking place. Typical results from a
biochemical characterization of TAF-172, a human homolog of yeastsingle hybridization are shown in Supplemental Figure S2 at http://
Mot1. Mol. Cell. Biol. 18, 1701–1710.www.molecule.org/cgi/content/full/10/4/871/DC1. The standard
Coleman, R.A., and Pugh, B.F. (1997). Slow dimer dissociation ofdeviation was uniform ()%01ف throughout the entire dynamic range
the TATA binding protein dictates the kinetics of DNA binding. Proc.of all homotypic hybridizations. The greater value of either the gene-
Natl. Acad. Sci. USA 94, 7221–7226.specific or overall standard deviation was used to filter each gene for
significant changes in expression. Typically, in any one experiment, Coleman, R.A., Taggart, A.K., Benjamin, L.R., and Pugh, B.F. (1995).
Ͼ5700 genes gave measurable transcriptional output (passing crite- Dimerization of the TATA binding protein. J. Biol. Chem. 270, 13842–
rion 1, below). Fold changes in gene expression were considered 13849.
significant if they met all of the following filtering criteria: (1) raw Coleman, R.A., Taggart, A.K., Burma, S., Chicca, J.J., 2nd, and Pugh,
gene expression intensities were greater than one standard devia- B.F. (1999). TFIIA regulates TBP and TFIID dimers. Mol. Cell 4,
tion above local background in both the test and reference samples 451–457.
in both replicates; (2) ratios changed in the same direction in each
DeRisi, J.L., Iyer, V.R., and Brown, P.O. (1997). Exploring the meta-
replicate; (3) ratios in each replicate were greater than two standard
bolic and genetic control of gene expression on a genomic scale.
deviations above 1.0; (4) p values of the arithmetic average of the
Science 278, 680–686.
log2 ratios were Ͻ0.005; and (5) fold changes in gene expression
Eisen, M.B., Spellman, P.T., Brown, P.O., and Botstein, D. (1998).were Ͼ1.5. We chose to use an arithmetic average of log values so
Cluster analysis and display of genome-wide expression patterns.as to blunt the effect of any potential large variations between the
Proc. Natl. Acad. Sci. USA 95, 14863–14868.two replicate experiments. Applying these filters to independently
Geisberg, J.V., and Struhl, K. (2000). TATA-binding protein mutantsderived homotypic hybridizations typically resulted in no genes be-
that increase transcription from enhancerless and repressed pro-ing reported as falsely significant. The p value cut-off of 0.005 was
moters in vivo. Mol. Cell. Biol. 20, 1478–1488.assigned arbitrarily and conservatively. To examine the percentage
of the genome that changes as a function of p value, see Supplemen- Geisberg, J.V., Holstege, F.C., Young, R.A., and Struhl, K. (2001).
tal Figure S3 at http://www.molecule.org/cgi/content/full/10/4/871/ Yeast NC2 associates with the RNA polymerase II preinitiation com-
DC1. plex and selectively affects transcription in vivo. Mol. Cell. Biol. 21,
2736–2742.
Acknowledgments Goppelt, A., and Meisterernst, M. (1996). Characterization of the
basal inhibitor of class II transcription NC2 from Saccharomyces
We thank J. Chicca, J. Szot, F. Chiaromonte, and members of the cerevisiae. Nucleic Acids Res. 24, 4450–4455.
Pugh Laboratory for assistance in developing and interpreting the
Grunstein, M. (1998). Yeast heterochromatin: regulation of its as-
microarrays; T. Kokubo for providing strains and plasmids; J. Reese
sembly and inheritance by histones. Cell 93, 325–328.
for providing antibodies and advice; S. Tan for providing images for
Hecht, A., Strahl-Bolsinger, S., and Grunstein, M. (1996). SpreadingFigure 1A; and D. Gilmour, P. Mitchell, J. Reese, and S. Tan for
of transcriptional repressor SIR3 from telomeric heterochromatin.comments on the manuscript. This work was supported by NIH
Nature 383, 92–96.grant GM59055.
Holstege, F.C., Jennings, E.G., Wyrick, J.J., Lee, T.I., Hengartner,
C.J., Green, M.R., Golub, T.R., Lander, E.S., and Young, R.A. (1998).Received: September 28, 2001
Dissecting the regulatory circuitry of a eukaryotic genome. Cell 95,Revised: August 16, 2002
717–728.
Jackson-Fisher, A.J., Chitikila, C., Mitra, M., and Pugh, B.F. (1999).References
A role for TBP dimerization in preventing unregulated gene expres-
sion. Mol. Cell 3, 717–727.Aparicio, O.M., Billington, B.L., and Gottschling, D.E. (1991). Modifi-
ers of position effect are shared between telomeric and silent mat- Kamada, K., Shu, F., Chen, H., Malik, S., Stelzer, G., Roeder, R.G.,
Meisterernst, M., and Burley, S.K. (2001). Crystal structure of nega-ing-type loci in S. cerevisiae. Cell 66, 1279–1287.
12. Molecular Cell
882
tive cofactor 2 recognizing the TBP-DNA transcription complex. Cell Taggart, A.K., and Pugh, B.F. (1996). Dimerization of TFIID when
not bound to DNA. Science 272, 1331–1333.106, 71–81.
Tan, S., Hunziker, Y., Sargent, D.F., and Richmond, T.J. (1996). Crys-Kim, S., Na, J.G., Hampsey, M., and Reinberg, D. (1997). The Dr1/
tal structure of a yeast TFIIA/TBP/DNA complex. Nature 381,DRAP1 heterodimer is a global repressor of transcription in vivo.
127–151.Proc. Natl. Acad. Sci. USA 94, 820–825.
Willy, P.J., Kobayashi, R., and Kadonaga, J.T. (2000). A basal tran-Kobayashi, A., Miyake, T., Ohyama, Y., Kawaichi, M., and Kokubo,
scription factor that activates or represses transcription. ScienceT. (2001). Mutations in the TATA-binding protein, affecting transcrip-
290, 982–985.tional activation, show synthetic lethality with the TAF145 gene lack-
ing the TAF N-terminal domain in Saccharomyces cerevisiae. J. Biol. Wyrick, J.J., Holstege, F.C., Jennings, E.G., Causton, H.C., Shore, D.,
Chem. 276, 395–405. Grunstein, M., Lander, E.S., and Young, R.A. (1999). Chromosomal
landscape of nucleosome-dependent gene expression and silenc-Kokubo, T., Swanson, M.J., Nishikawa, J.I., Hinnebusch, A.G., and
ing in yeast. Nature 402, 418–421.Nakatani, Y. (1998). The yeast TAF145 inhibitory domain and TFIIA
competitively bind to TATA-binding protein. Mol. Cell. Biol. 18, 1003– Zakian, V.A. (1996). Structure, function, and replication of Saccharo-
1012. myces cerevisiae telomeres. Annu. Rev. Genet. 30, 141–172.
Kotani, T., Miyake, T., Tsukihashi, Y., Hinnebusch, A.G., Nakatani,
Y., Kawaichi, M., and Kokubo, T. (1998). Identification of highly con-
served amino-terminal segments of dTAFII230 and yTAFII145 that
are functionally interchangeable for inhibiting TBP-DNA interactions
in vitro and in promoting yeast cell growth in vivo. J. Biol. Chem.
273, 32254–32264.
Kotani, T., Banno, K., Ikura, M., Hinnebusch, A.G., Nakatani, Y.,
Kawaichi, M., and Kokubo, T. (2000). A role of transcriptional activa-
tors as antirepressors for the autoinhibitory activity of TATA box
binding of transcription factor IID. Proc. Natl. Acad. Sci. USA 97,
7178–7183.
Kuras, L., and Struhl, K. (1999). Binding of TBP to promoters in vivo
is stimulated by activators and requires Pol II holoenzyme. Nature
399, 609–613.
Kurtz, S., and Shore, D. (1991). RAP1 protein activates and silences
transcription of mating-type genes in yeast. Genes Dev. 5, 616–628.
Kyrion, G., Liu, K., Liu, C., and Lustig, A.J. (1993). RAP1 and telomere
structure regulate telomere position effects in Saccharomyces cere-
visiae. Genes Dev. 7, 1146–1159.
Li, X.-Y., Virbasius, A., Zhu, X., and Green, M. (1999). Enhancement
of TBP binding by activators and general transcription factors. Na-
ture 399, 605–609.
Liu, D., Ishima, R., Tong, K.I., Bagby, S., Kokubo, T., Muhandiram,
D.R., Kay, L.E., Nakatani, Y., and Ikura, M. (1998). Solution structure
of a TBP-TAF(II)230 complex: protein mimicry of the minor groove
surface of the TATA box unwound by TBP. Cell 94, 573–583.
Lively, T.N., Ferguson, H.A., Galasinski, S.K., Seto, A.G., and Good-
rich, J.A. (2001). c-Jun binds the N terminus of human TAF(II)250 to
derepress RNA polymerase II transcription in vitro. J. Biol. Chem.
276, 25582–25588.
Loo, S., and Rine, J. (1995). Silencing and heritable domains of gene
expression. Annu. Rev. Cell Dev. Biol. 11, 519–548.
Mai, X., Chou, S., and Struhl, K. (2000). Preferential accessibility of
the yeast his3 promoter is determined by a general property of
the DNA sequence, not by specific elements. Mol. Cell. Biol. 20,
6668–6676.
Mermelstein, F., Yeung, K., Cao, J., Inostroza, J.A., Erdjument-Bro-
mage, H., Eagelson, K., Landsman, D., Levitt, P., Tempst, P., and
Reinberg, D. (1996). Requirement of a corepressor for Dr1-mediated
repression of transcription. Genes Dev. 10, 1033–1048.
Nikolov, D.B., Hu, S.H., Lin, J., Gasch, A., Hoffmann, A., Horikoshi,
M., Chua, N.H., Roeder, R.G., and Burley, S.K. (1992). Crystal struc-
ture of TFIID TATA-box binding protein. Nature 360, 40–46.
Nikolov, D.B., Chen, H., Halay, E.D., Usheva, A.A., Hisatake, K., Lee,
D.K., Roeder, R.G., and Burley, S.K. (1995). Crystal structure of a
TFIIB-TBP-TATA-element ternary complex. Nature 377, 119–128.
Nishikawa, J., Kokubo, T., Horikoshi, M., Roeder, R.G., and Nakatani,
Y. (1997). Drosophila TAF(II)230 and the transcriptional activator
VP16 bind competitively to the TATA box-binding domain of the
TATA box-binding protein. Proc. Natl. Acad. Sci. USA 94, 85–90.
Sekinger, E.A., and Gross, D.S. (2001). Silenced chromatin is permis-
sive to activator binding and PIC recruitment. Cell 105, 403–414.
Struhl, K. (1999). Fundamentally different logic of gene regulation
in eukaryotes and prokaryotes. Cell 98, 1–4.