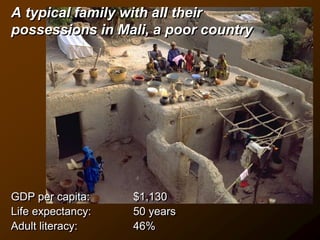
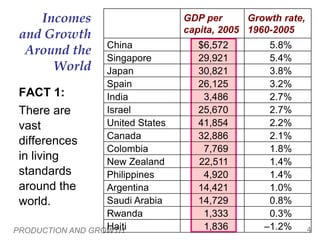
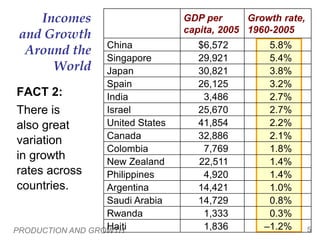
This document discusses differences in living standards and economic growth rates around the world. It begins by showing data on GDP per capita and other indicators for families in the UK, Mexico, and Mali to illustrate vast differences in living standards globally. Tables then show data on GDP per capita and growth rates for various countries from 1960-2005, demonstrating both differences in incomes and variation in growth rates. The document poses questions about why some countries are richer and grow faster than others and what policies may help raise growth rates and living standards. It then discusses various determinants of productivity that influence economic growth and living standards.
Speaking to a crowd of more than 1,000 students and other members of the University of Texas at Austin community, Dean Tom Gilligan used colorful charts and detailed graphs to explore trends in prosperity and poverty around the world. He explained how gross domestic product (GDP) is used as a measurement tool, how “real GDP” and “GDP per capita” are calculated, and how these figures are used to compare economies across regions, across populations and across the world.
ECON3501
CARIBBEAN ECONOMIC
DEVELOPMENT
UNIT 4 – ECONOMIC GROWTH
RESOURCE MATERIALS
Levitt, Kari; Witter, Michael (1996). The Critical Tradition of Caribbean Political
Economy: The Legacy of George Beckford. Kingston. Ian Randle Publishers
Beckford; George (2000) Persistent Poverty; Underdevelopment in the Plantation
Economies of the Third World. UWI Press.
Todaro Michael & Smith Stephen; C. (2011) 11th Ed. Economic Development. Pearson
Education & Addison-Wesley
Bhagwati Jagdish (2004). In Defence of Globalization, Oxford University Press
Blackman; Courtney. (2005). The Practice of Economic Management: Caribbean
Perspective Kingston: Ian Randle Publishers
United Nations- UNDP, Human Development Report. World Bank-World
Development Report
2
ECONOMIC GROWTH
Economic growth has two meanings.
Firstly, and most commonly, growth is defined as an increase in the
output that an economy produces over a period of time based on per
capita. That is, an increase in GDP or GNI per capita.
The second meaning of economic growth is an increase in what an
economy can produce if it is using all its scarce resources.
An increase in an economy’s productive potential can be shown by an
outward shift in the economy’s production possibility frontier (PPF).
3
PER CAPITA STATISTICS
Per Capita is used to refer to a unit or each
person within a population.
A country’s economic growth and comparison
of living standards among countries can be
expressed using GDP per capita or GNI per
capita information.
Per capita GDP or GNP is simply a country’s
GDP or GNP divided by its population.
Using per capita statistics is a better measure
of the well-being for the average person.
Bahamas, The
2019 34,863.70
Puerto Rico
2019 32,873.70
Turks and Caicos Islands
2019 31,353.30
St. Kitts and Nevis
2019 19,935.00
Curacao
2019 19,689.10
Barbados
2019 18,148.20
Trinidad and Tobago
2019 17,398.00
Antigua and Barbuda 2019 17,112.80
Uruguay
2019 16,190.10
Panama
2019 15,731.00
Top 10 countries in the Latin America and Caribbean
region for 2019 based on figures from Worldbank.org
4
https://data.worldbank.org/indicator/NY.GDP.PCAP.CD?locations=ZJ-BS
https://data.worldbank.org/indicator/NY.GDP.PCAP.CD?locations=ZJ-PR
https://data.worldbank.org/indicator/NY.GDP.PCAP.CD?locations=ZJ-TC
https://data.worldbank.org/indicator/NY.GDP.PCAP.CD?locations=ZJ-KN
https://data.worldbank.org/indicator/NY.GDP.PCAP.CD?locations=ZJ-CW
https://data.worldbank.org/indicator/NY.GDP.PCAP.CD?locations=ZJ-BB
https://data.worldbank.org/indicator/NY.GDP.PCAP.CD?locations=ZJ-TT
https://data.worldbank.org/indicator/NY.GDP.PCAP.CD?locations=ZJ-AG
https://data.worldbank.org/indicator/NY.GDP.PCAP.CD?locations=ZJ-UY
https://data.worldbank.org/indicator/NY.GDP.PCAP.CD?locations=ZJ-PA
THE PRODUCTION POSSIBILITY FRONTIER
(PPF)
Q
u
a
n
ti
ty
o
f
C
o
m
p
u
te
rs
P
ro
d
u
c
e
d
Quantity of Cars Produced
3,000
1,000
2 ...
My slides for JISC's Greening ICT Programme Meeting. There are notes from slide 26 onwards.
See: http://www.jisc.ac.uk/fundingopportunities/funding_calls/2009/09/0909greenict.aspx
And more at: http://joss.blogs.lincoln.ac.uk/tag/resilienteducation/
Presentación de la Ministra Nathalie Cely en el Simposio Global de Inversiones “Caminos a la Prosperidad”, organizado por el Club Harvard de Nueva York. 20 de septiembre de 2011
Speaking to a crowd of more than 1,000 students and other members of the University of Texas at Austin community, Dean Tom Gilligan used colorful charts and detailed graphs to explore trends in prosperity and poverty around the world. He explained how gross domestic product (GDP) is used as a measurement tool, how “real GDP” and “GDP per capita” are calculated, and how these figures are used to compare economies across regions, across populations and across the world.
BYD SWOT Analysis and In-Depth Insights 2024.pptxmikemetalprod
Indepth analysis of the BYD 2024
BYD (Build Your Dreams) is a Chinese automaker and battery manufacturer that has snowballed over the past two decades to become a significant player in electric vehicles and global clean energy technology.
This SWOT analysis examines BYD's strengths, weaknesses, opportunities, and threats as it competes in the fast-changing automotive and energy storage industries.
Founded in 1995 and headquartered in Shenzhen, BYD started as a battery company before expanding into automobiles in the early 2000s.
Initially manufacturing gasoline-powered vehicles, BYD focused on plug-in hybrid and fully electric vehicles, leveraging its expertise in battery technology.
Today, BYD is the world’s largest electric vehicle manufacturer, delivering over 1.2 million electric cars globally. The company also produces electric buses, trucks, forklifts, and rail transit.
On the energy side, BYD is a major supplier of rechargeable batteries for cell phones, laptops, electric vehicles, and energy storage systems.
^%$Zone1:+971)581248768’][* Legit & Safe #Abortion #Pills #For #Sale In #Duba...mayaclinic18
Whatsapp (+971581248768) Buy Abortion Pills In Dubai/ Qatar/Kuwait/Doha/Abu Dhabi/Alain/RAK City/Satwa/Al Ain/Abortion Pills For Sale In Qatar, Doha. Abu az Zuluf. Abu Thaylah. Ad Dawhah al Jadidah. Al Arish, Al Bida ash Sharqiyah, Al Ghanim, Al Ghuwariyah, Qatari, Abu Dhabi, Dubai.. WHATSAPP +971)581248768 Abortion Pills / Cytotec Tablets Available in Dubai, Sharjah, Abudhabi, Ajman, Alain, Fujeira, Ras Al Khaima, Umm Al Quwain., UAE, buy cytotec in Dubai– Where I can buy abortion pills in Dubai,+971582071918where I can buy abortion pills in Abudhabi +971)581248768 , where I can buy abortion pills in Sharjah,+97158207191 8where I can buy abortion pills in Ajman, +971)581248768 where I can buy abortion pills in Umm al Quwain +971)581248768 , where I can buy abortion pills in Fujairah +971)581248768 , where I can buy abortion pills in Ras al Khaimah +971)581248768 , where I can buy abortion pills in Alain+971)581248768 , where I can buy abortion pills in UAE +971)581248768 we are providing cytotec 200mg abortion pill in dubai, uae.Medication abortion offers an alternative to Surgical Abortion for women in the early weeks of pregnancy. Zone1:+971)581248768’][* Legit & Safe #Abortion #Pills #For #Sale In #Dubai Abu Dhabi Sharjah Deira Ajman Fujairah Ras Al Khaimah%^^%$Zone1:+971)581248768’][* Legit & Safe #Abortion #Pills #For #Sale In #Dubai Abu Dhabi Sharjah Deira Ajman Fujairah Ras Al Khaimah%^^%$Zone1:+971)581248768’][* Legit & Safe #Abortion #Pills #For #Sale In #Dubai Abu Dhabi Sharjah Deira Ajman Fujairah Ras Al Khaimah%^^%$Zone1:+971)581248768’][* Legit & Safe #Abortion #Pills #For #Sale In #Dubai Abu Dhabi Sharjah Deira Ajman Fujairah Ras Al Khaimah%^^%$Zone1:+971)581248768’][* Legit & Safe #Abortion #Pills #For #Sale In #Dubai Abu Dhabi Sharjah Deira Ajman Fujairah Ras Al Khaimah%^^%$Zone1:+971)581248768’][* Legit & Safe #Abortion #Pills #For #Sale In #Dubai Abu Dhabi Sharjah Deira Ajman Fujairah Ras Al Khaimah%^^%$Zone1:+971)581248768’][* Legit & Safe #Abortion #Pills #For #Sale In #Dubai Abu Dhabi Sharjah Deira Ajman Fujairah Ras Al Khaimah%^^%$Zone1:+971)581248768’][* Legit & Safe #Abortion #Pills #For #Sale In #Dubai Abu Dhabi Sharjah Deira Ajman Fujairah Ras Al Khaimah%^^%$Zone1:+971)581248768’][* Legit & Safe #Abortion #Pills #For #Sale In #Dubai Abu Dhabi Sharjah Deira Ajman Fujairah Ras Al Khaimah%^^%$Zone1:+971)581248768’][* Legit & Safe #Abortion #Pills #For #Sale In #Dubai Abu Dhabi Sharjah Deira Ajman Fujairah Ras Al Khaimah%^^%$Zone1:+971)581248768’][* Legit & Safe #Abortion #Pills #For #Sale In #Dubai Abu Dhabi Sharjah Deira Ajman Fujairah Ras Al Khaimah%^^%$Zone1:+971)581248768’][* Legit & Safe #Abortion #Pills #For #Sale In #Dubai Abu Dhabi Sharjah Deira Ajman Fujairah Ras Al Khaimah%^^%$Zone1:+971)581248768’][* Legit & Safe #Abortion #Pills #For #Sale In #Dubai Abu Dhabi Sharjah Deira Ajman Fujairah Ras Al Khaimah%^^%$Zone1:+971)581248768’][* Legit & Safe #Abortion #Pills #For #Sale In #Dubai Abu Dhabi Sharjah Deira Ajman
how to sell pi coins in South Korea profitably.DOT TECH
Yes. You can sell your pi network coins in South Korea or any other country, by finding a verified pi merchant
What is a verified pi merchant?
Since pi network is not launched yet on any exchange, the only way you can sell pi coins is by selling to a verified pi merchant, and this is because pi network is not launched yet on any exchange and no pre-sale or ico offerings Is done on pi.
Since there is no pre-sale, the only way exchanges can get pi is by buying from miners. So a pi merchant facilitates these transactions by acting as a bridge for both transactions.
How can i find a pi vendor/merchant?
Well for those who haven't traded with a pi merchant or who don't already have one. I will leave the what'sapp number of my personal pi merchant who i trade pi with.
Message: +12349014282 VIA Whatsapp.
#pi #sell #nigeria #pinetwork #picoins #sellpi #Nigerian #tradepi #pinetworkcoins #sellmypi
What website can I sell pi coins securely.DOT TECH
Currently there are no website or exchange that allow buying or selling of pi coins..
But you can still easily sell pi coins, by reselling it to exchanges/crypto whales interested in holding thousands of pi coins before the mainnet launch.
Who is a pi merchant?
A pi merchant is someone who buys pi coins from miners and resell to these crypto whales and holders of pi..
This is because pi network is not doing any pre-sale. The only way exchanges can get pi is by buying from miners and pi merchants stands in between the miners and the exchanges.
How can I sell my pi coins?
Selling pi coins is really easy, but first you need to migrate to mainnet wallet before you can do that. I will leave the what'sapp contact of my personal pi merchant to trade with.
+12349014282
Turin Startup Ecosystem 2024 - Ricerca sulle Startup e il Sistema dell'Innov...Quotidiano Piemontese
Turin Startup Ecosystem 2024
Una ricerca de il Club degli Investitori, in collaborazione con ToTeM Torino Tech Map e con il supporto della ESCP Business School e di Growth Capital
STREETONOMICS: Exploring the Uncharted Territories of Informal Markets throug...sameer shah
Delve into the world of STREETONOMICS, where a team of 7 enthusiasts embarks on a journey to understand unorganized markets. By engaging with a coffee street vendor and crafting questionnaires, this project uncovers valuable insights into consumer behavior and market dynamics in informal settings."
Abhay Bhutada Leads Poonawalla Fincorp To Record Low NPA And Unprecedented Gr...Vighnesh Shashtri
Under the leadership of Abhay Bhutada, Poonawalla Fincorp has achieved record-low Non-Performing Assets (NPA) and witnessed unprecedented growth. Bhutada's strategic vision and effective management have significantly enhanced the company's financial health, showcasing a robust performance in the financial sector. This achievement underscores the company's resilience and ability to thrive in a competitive market, setting a new benchmark for operational excellence in the industry.
where can I find a legit pi merchant onlineDOT TECH
Yes. This is very easy what you need is a recommendation from someone who has successfully traded pi coins before with a merchant.
Who is a pi merchant?
A pi merchant is someone who buys pi network coins and resell them to Investors looking forward to hold thousands of pi coins before the open mainnet.
I will leave the what'sapp contact of my personal pi merchant to trade with
+12349014282
when will pi network coin be available on crypto exchange.DOT TECH
There is no set date for when Pi coins will enter the market.
However, the developers are working hard to get them released as soon as possible.
Once they are available, users will be able to exchange other cryptocurrencies for Pi coins on designated exchanges.
But for now the only way to sell your pi coins is through verified pi vendor.
Here is the what'sapp contact of my personal pi vendor
+12349014282
how to swap pi coins to foreign currency withdrawable.DOT TECH
As of my last update, Pi is still in the testing phase and is not tradable on any exchanges.
However, Pi Network has announced plans to launch its Testnet and Mainnet in the future, which may include listing Pi on exchanges.
The current method for selling pi coins involves exchanging them with a pi vendor who purchases pi coins for investment reasons.
If you want to sell your pi coins, reach out to a pi vendor and sell them to anyone looking to sell pi coins from any country around the globe.
Below is the what'sapp information for my personal pi vendor.
+12349014282
1. Elemental Economics - Introduction to mining.pdfNeal Brewster
After this first you should: Understand the nature of mining; have an awareness of the industry’s boundaries, corporate structure and size; appreciation the complex motivations and objectives of the industries’ various participants; know how mineral reserves are defined and estimated, and how they evolve over time.
The secret way to sell pi coins effortlessly.DOT TECH
Well as we all know pi isn't launched yet. But you can still sell your pi coins effortlessly because some whales in China are interested in holding massive pi coins. And they are willing to pay good money for it. If you are interested in selling I will leave a contact for you. Just what'sapp this number below. I sold about 3000 pi coins to him and he paid me immediately.
+12349014282
2. A typical family with all their possessions
in the U.K., an advanced economy
GDP per capita: $35,580
Life expectancy: 79 years
Adult literacy: 99%
3. A typical family with all their possessions
in Mexico, a middle income country
GDP per capita: $11,410
Life expectancy: 76 years
Adult literacy: 92%
4. A typical family with all their
possessions in Mali, a poor country
GDP per capita: $1,130
Life expectancy: 50 years
Adult literacy: 46%
5. PRODUCTION AND GROWTH 4
GDP per
capita, 2005
Growth rate,
1960-2005
China $6,572 5.8%
Singapore 29,921 5.4%
Japan 30,821 3.8%
Spain 26,125 3.2%
India 3,486 2.7%
Israel 25,670 2.7%
United States 41,854 2.2%
Canada 32,886 2.1%
Colombia 7,769 1.8%
New Zealand 22,511 1.4%
Philippines 4,920 1.4%
Argentina 14,421 1.0%
Saudi Arabia 14,729 0.8%
Rwanda 1,333 0.3%
Haiti 1,836 –1.2%
Incomes
and Growth
Around the
World
FACT 1:
There are
vast
differences
in living
standards
around the
world.
6. PRODUCTION AND GROWTH 5
GDP per
capita, 2005
Growth rate,
1960-2005
China $6,572 5.8%
Singapore 29,921 5.4%
Japan 30,821 3.8%
Spain 26,125 3.2%
India 3,486 2.7%
Israel 25,670 2.7%
United States 41,854 2.2%
Canada 32,886 2.1%
Colombia 7,769 1.8%
New Zealand 22,511 1.4%
Philippines 4,920 1.4%
Argentina 14,421 1.0%
Saudi Arabia 14,729 0.8%
Rwanda 1,333 0.3%
Haiti 1,836 –1.2%
Incomes
and Growth
Around the
World
FACT 2:
There is
also great
variation
in growth
rates across
countries.
7. PRODUCTION AND GROWTH 6
Incomes and Growth Around the World
Since growth rates vary, the country rankings can
change over time:
Poor countries are not necessarily doomed to
poverty forever – e.g., Singapore, incomes were
low in 1960 and are quite high now.
Rich countries can’t take their status for granted:
They may be overtaken by poorer but
faster-growing countries.
8. PRODUCTION AND GROWTH 7
Incomes and Growth Around the World
Questions:
Why are some countries richer than others?
Why do some countries grow quickly while others
seem stuck in a poverty trap?
What policies may help raise growth rates and
long-run living standards?
9. PRODUCTION AND GROWTH 8
Productivity
Recall one of the Ten Principles from Chap. 1:
A country’s standard of living depends
on its ability to produce g&s.
This ability depends on
productivity, the average quantity of g&s
produced per unit of labor input.
Y = real GDP = quantity of output produced
L = quantity of labor
so productivity = Y/L (output per worker)
10. PRODUCTION AND GROWTH 9
Why Productivity Is So Important
When a nation’s workers are very productive,
real GDP is large and incomes are high.
When productivity grows rapidly, so do living
standards.
What, then, determines productivity and its
growth rate?
11. PRODUCTION AND GROWTH 10
Physical Capital Per Worker
Recall: The stock of equipment and structures
used to produce g&s is called [physical] capital,
denoted K.
K/L = capital per worker.
Productivity is higher when the average worker
has more capital (machines, equipment, etc.).
i.e.,
an increase in K/L causes an increase in Y/L.
12. PRODUCTION AND GROWTH 11
Human Capital Per Worker
Human capital (H):
the knowledge and skills workers acquire through
education, training, and experience
H/L = the average worker’s human capital
Productivity is higher when the average worker
has more human capital (education, skills, etc.).
i.e.,
an increase in H/L causes an increase in Y/L.
13. PRODUCTION AND GROWTH 12
Natural Resources Per Worker
Natural resources (N): the inputs into production
that nature provides, e.g., land, mineral deposits
Other things equal,
more N allows a country to produce more Y.
In per-worker terms,
an increase in N/L causes an increase in Y/L.
Some countries are rich because they have
abundant natural resources
(e.g., Saudi Arabia has lots of oil).
But countries need not have much N to be rich
(e.g., Japan imports the N it needs).
14. PRODUCTION AND GROWTH 13
Technological Knowledge
Technological knowledge: society’s
understanding of the best ways to produce g&s
Technological progress does not only mean
a faster computer, a higher-definition TV,
or a smaller cell phone.
It means any advance in knowledge that boosts
productivity (allows society to get more output
from its resources).
E.g., Henry Ford and the assembly line.
15. PRODUCTION AND GROWTH 14
Tech. Knowledge vs. Human Capital
Technological knowledge refers to society’s
understanding of how to produce g&s.
Human capital results from the effort people
expend to acquire this knowledge.
Both are important for productivity.
16. PRODUCTION AND GROWTH 15
The Production Function
The production function is a graph or equation
showing the relation between output and inputs:
Y = A F(L, K, H, N)
F( ) – a function that shows how inputs are
combined to produce output
“A” – the level of technology
“A” multiplies the function F( ),
so improvements in technology (increases in “A”)
allow more output (Y) to be produced from any
given combination of inputs.
17. PRODUCTION AND GROWTH 16
The Production Function
The production function has the property
constant returns to scale: Changing all inputs
by the same percentage causes output to change
by that percentage. For example,
Doubling all inputs (multiplying each by 2)
causes output to double:
Y = A F(L, K, H, N)
2Y = A F(2L, 2K, 2H, 2N)
Increasing all inputs 10% (multiplying each by 1.1)
causes output to increase by 10%:
1.1Y = A F(1.1L, 1.1K, 1.1H, 1.1N)
18. PRODUCTION AND GROWTH 17
The Production Function
If we multiply each input by 1/L, then
output is multiplied by 1/L:
Y/L = A F(1, K/L, H/L, N/L)
This equation shows that productivity
(output per worker) depends on:
the level of technology (A)
physical capital per worker
human capital per worker
natural resources per worker
Y = A F(L, K, H, N)
19. Which of the following policies do you think would
be most effective at boosting growth and living
standards in a poor country over the long run?
a. Offer tax incentives for investment by local firms
b. ” ” ” ” ” by foreign firms
c. Give cash payments for good school attendance
d. Crack down on govt corruption
e. Restrict imports to protect domestic industries
f. Allow free trade
g. Give away condoms
Discussion Question
18
20. PRODUCTION AND GROWTH 19
ECONOMIC GROWTH
AND PUBLIC POLICY
Next, we look at the ways
public policy can affect
long-run growth in productivity
and living standards.
21. PRODUCTION AND GROWTH 20
Saving and Investment
We can boost productivity by increasing K,
which requires investment.
Since resources scarce, producing more capital
requires producing fewer consumption goods.
Reducing consumption = increasing saving.
This extra saving funds the production of
investment goods. (More details in the next chapter.)
Hence, a tradeoff between current and future
consumption.
22. PRODUCTION AND GROWTH 21
Diminishing Returns and the Catch-Up Effect
The govt can implement policies that raise saving
and investment. (Details in next chapter.)
Then K will rise, causing productivity and living
standards to rise.
But this faster growth is temporary,
due to diminishing returns to capital:
As K rises, the extra output from an additional
unit of K falls….
23. PRODUCTION AND GROWTH 22
Output per
worker
(productivity)
The Production Function & Diminishing Returns
K/L
Y/L
Capital per worker
If workers
have little K,
giving them more
increases their
productivity a lot.
If workers already
have a lot of K,
giving them more
increases
productivity
fairly little.
24. PRODUCTION AND GROWTH 23
the property whereby poor
countries tend to grow more rapidly than rich ones
The catch-up effect:
K/L
Y/L
Poor country
starts here Rich country starts here
Poor country’s
growth
Rich country’s
growth
25. PRODUCTION AND GROWTH 24
Example of the Catch-Up Effect
Over 1960-1990, the U.S. and S. Korea devoted
a similar share of GDP to investment, so you
might expect they would have similar growth
performance.
But growth was >6% in Korea and only 2% in the
U.S.
Explanation: the catch-up effect.
In 1960, K/L was far smaller in Korea than
in the U.S., hence Korea grew faster.
26. PRODUCTION AND GROWTH 25
Investment from Abroad
To raise K/L and hence productivity, wages, and
living standards, the govt can also encourage
foreign direct investment:
a capital investment (e.g., factory) that is
owned & operated by a foreign entity
foreign portfolio investment:
a capital investment financed with foreign
money but operated by domestic residents
Some of the returns from these investments
flow back to the foreign countries that supplied
the funds.
27. PRODUCTION AND GROWTH 26
Investment from Abroad
Especially beneficial in poor countries that cannot
generate enough saving to fund investment
projects themselves.
Also helps poor countries learn state-of-the-art
technologies developed in other countries.
28. PRODUCTION AND GROWTH 27
Education
Govt can increase productivity by promoting
education–investment in human capital (H).
Public schools, subsidized loans for college
Education has significant effects: In the U.S., each
year of schooling raises a worker’s wage by 10%.
But investing in H also involves a tradeoff
between the present & future:
Spending a year in school requires sacrificing
a year’s wages now to have higher wages later.
29. PRODUCTION AND GROWTH 28
Health and Nutrition
Health care expenditure is a type of investment in
human capital – healthier workers are more
productive.
In countries with significant malnourishment, raising
workers’ caloric intake raises productivity:
Over 1962-95, caloric consumption rose 44% in
S. Korea, and economic growth was spectacular.
Nobel winner Robert Fogel:
30% of Great Britain’s growth from 1790-1980
was due to improved nutrition.
30. PRODUCTION AND GROWTH 29
Property Rights and Political Stability
Recall:
Markets are usually a good
way to organize economic activity.
The price system allocates resources
to their most efficient uses.
This requires respect for property rights, the
ability of people to exercise authority over the
resources they own.
31. PRODUCTION AND GROWTH 30
Property Rights and Political Stability
In many poor countries, the justice system
doesn’t work very well:
Contracts aren’t always enforced
Fraud, corruption often go unpunished
In some, firms must bribe govt officials for
permits
Political instability (e.g., frequent coups) creates
uncertainty over whether property rights will be
protected in the future.
32. PRODUCTION AND GROWTH 31
Property Rights and Political Stability
When people fear their capital may be stolen by
criminals or confiscated by a corrupt govt,
there is less investment, including from abroad,
and the economy functions less efficiently.
Result: lower living standards.
Economic stability, efficiency, and healthy growth
require law enforcement, effective courts,
a stable constitution, and honest govt officials.
33. PRODUCTION AND GROWTH 32
Free Trade
Inward-oriented policies
(e.g., tariffs, limits on investment from abroad)
aim to raise living standards by avoiding
interaction with other countries.
Outward-oriented policies (e.g., the elimination
of restrictions on trade or foreign investment)
promote integration with the world economy.
34. PRODUCTION AND GROWTH 33
Free Trade
Recall: Trade can make everyone better off.
Trade has similar effects as discovering new
technologies – it improves productivity and living
standards.
Countries with inward-oriented policies have
generally failed to create growth.
E.g., Argentina during the 20th century.
Countries with outward-oriented policies have
often succeeded.
E.g., South Korea, Singapore, Taiwan after 1960.
35. PRODUCTION AND GROWTH 34
Research and Development
Technological progress is the main reason why
living standards rise over the long run.
One reason is that knowledge is a public good:
Ideas can be shared freely, increasing the
productivity of many.
Policies to promote tech. progress:
Patent laws
Tax incentives or direct support for
private sector R&D
Grants for basic research at universities
36. PRODUCTION AND GROWTH 35
Population Growth
…may affect living standards in 3 different ways:
1. Stretching natural resources
200 years ago, Malthus argued that pop. growth
would strain society’s ability to provide for itself.
Since then, the world population has increased
sixfold. If Malthus was right, living standards would
have fallen. Instead, they’ve risen.
Malthus failed to account for technological
progress and productivity growth.
37. PRODUCTION AND GROWTH 36
Population Growth
2. Diluting the capital stock
Bigger population = higher L = lower K/L
= lower productivity & living standards.
This applies to H as well as K:
fast pop. growth = more children
= greater strain on educational system.
Countries with fast pop. growth tend to have lower
educational attainment.
38. PRODUCTION AND GROWTH 37
Population Growth
To combat this, many developing countries use
policy to control population growth.
China’s one child per family laws
Contraception education & availability
Promote female literacy to raise opportunity cost of
having babies
2. Diluting the capital stock
39. PRODUCTION AND GROWTH 38
Population Growth
3. Promoting tech. progress
More people
= more scientists, inventors, engineers
= more frequent discoveries
= faster tech. progress & economic growth
Evidence from Michael Kremer:
Over the course of human history,
growth rates increased as the world’s
population increased
more populated regions grew faster than
less populated ones
40. List the determinants of productivity.
List three policies that attempt to raise living
standards by increasing one of the determinants
of productivity.
Review productivity concepts
39
41. Determinants of productivity:
K/L, physical capital per worker
H/L, human capital per worker
N/L, natural resources per worker
A, technological knowledge
Policies to boost productivity:
Encourage saving and investment, to raise K/L
Encourage investment from abroad, to raise K/L
Provide public education, to raise H/L
Answers
40
42. Determinants of productivity:
K/L, physical capital per worker
H/L, human capital per worker
N/L, natural resources per worker
A, technological knowledge
Policies to boost productivity:
Patent laws or grants, to increase A
Control population growth, to increase K/L
Answers
41
43. PRODUCTION AND GROWTH 42
Are Natural Resources a Limit to Growth?
Some argue that population growth is depleting the
Earth’s non-renewable resources, and thus will limit
growth in living standards.
But technological progress often yields ways to avoid
these limits:
Hybrid cars use less gas.
Better insulation in homes reduces the energy
required to heat or cool them.
As a resource becomes scarcer, its market price
rises, which increases the incentive to conserve it
and develop alternatives.