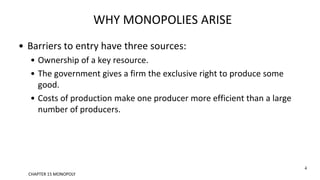
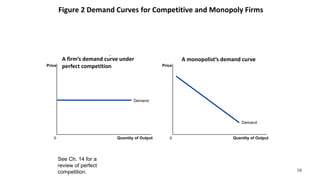
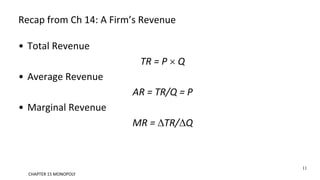
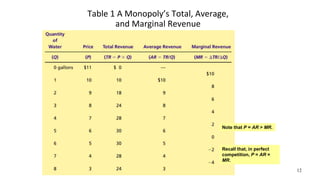
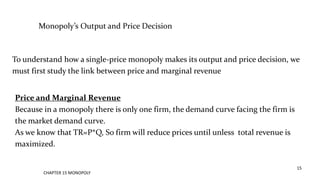
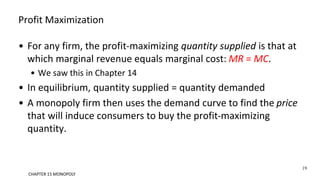
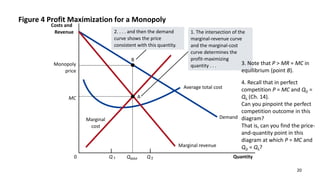
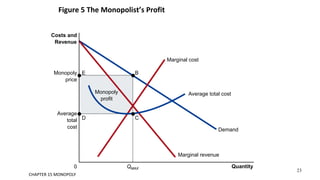
15
Monopoly
Monopoly
• A firm is a monopoly if . . .
• it is the only seller of its product, and
• its product does not have close substitutes.
2
CHAPTER 15 MONOPOLY
WHY MONOPOLIES ARISE
• The fundamental cause of monopoly is the existence of barriers
to entry.
3
CHAPTER 15 MONOPOLY
WHY MONOPOLIES ARISE
• Barriers to entry have three sources:
• Ownership of a key resource.
• The government gives a firm the exclusive right to produce some
good.
• Costs of production make one producer more efficient than a large
number of producers.
4
CHAPTER 15 MONOPOLY
Monopoly Resources
• Although exclusive ownership of a key resource is a potential
source of monopoly, in practice monopolies rarely arise for this
reason.
• Example: The DeBeers Diamond Monopoly
CHAPTER 15 MONOPOLY
5
Government-Created Monopolies
• Governments may restrict entry by giving one firm the exclusive
right to sell a particular good in certain markets.
• Example: Patent and copyright laws are two important examples of
how governments create monopoly to serve the public interest.
6
CHAPTER 15 MONOPOLY
Natural Monopolies
• A natural monopoly exists in a particular market if
a single firm can serve that market at lower cost than any
combination of two or more ...
Example: delivery of electricity, phone service, tap water, etc.
• Economies of scale as a cause of monopoly
• Large Fixed Costs. A natural monopoly has extraordinarily large fixed costs. ...
• Low Marginal Costs. ...
• Long Economies of Scale. ...
• Competition is Undesirable.
7
CHAPTER 15 MONOPOLY
Natural Monopolies
• A natural monopoly
arises when there are
economies of scale over
the relevant range of
output.
Quantity of Output
Average
total
cost
0
Cost
8
CHAPTER 15 MONOPOLY
HOW MONOPOLIES MAKE PRODUCTION AND PRICING DECISIONS
• Monopoly versus Competition
• Monopoly
• Is the sole producer
• Faces a downward-sloping demand curve
• Is a price maker
• Can reduce its sales to increase price
• Competitive Firm
• Is one of many producers
• Faces a horizontal demand curve
• Is a price taker
• Sells as much or as little as it wants at market price
9
CHAPTER 15 MONOPOLY
Figure 2 Demand Curves for Competitive and Monopoly Firms
Quantity of Output
Demand
’
0
Price
Quantity of Output
0
Price
Demand
See Ch. 14 for a
review of perfect
competition. 10
A firm’s demand curve under
perfect competition
A monopolist’s demand curve
Recap from Ch 14: A Firm’s Revenue
• Total Revenue
TR = P  Q
• Average Revenue
AR = TR/Q = P
• Marginal Revenue
MR = DTR/DQ
11
CHAPTER 15 MONOPOLY
Table 1 A Monopoly’s Total, Average,
and Marginal Revenue
Note that P = AR > MR.
Recall that, in perfect
competition, P = AR =
MR.
12
Why is MR < P?
When Q = 3, P = 8 but MR = 6.
Why is MR < P?
Output Effect: When the 3rd unit
is sold, the firm earns an
additional $8 for it. So, TR
increases by $8, which is P.
Price Effect: But to sell the 3rd
unit, the price had to be
reduced from $9 to $8. So, the
total revenue from the first two
units -- which would have been
$18 if only 2 units were sold --
decreases to $16 when 3 units
are sold. Thus, TR also decreases
by $2 when the 3rd unit is sold.
Therefore, the increase in total
revenue is $8 - $2 = $6, which is
less than P. In other words, MR
< P.
Figure 3 Demand and Marginal-Revenue Curves for a Monopoly
Quantity of Water
Price
$11
10
9
8
7
6
5
4
3
2
1
0
–1
–2
–3
–4
Demand
(average
revenue)
Marginal
revenue
1 2 3 4 5 6 7 8
Note that P = AR > MR
at all quantities.
14
CHAPTER 15 MONOPOLY
CHAPTER 15 MONOPOLY
15
Monopoly’s Output and Price Decision
To understand how a single-price monopoly makes its output and price decision, we
must first study the link between price and marginal revenue
Price and Marginal Revenue
Because in a monopoly there is only one firm, the demand curve facing the firm is
the market demand curve.
As we know that TR=P*Q, So firm will reduce prices until unless total revenue is
maximized.
CHAPTER 15 MONOPOLY
16
CHAPTER 15 MONOPOLY
18
Profit Maximization
• For any firm, the profit-maximizing quantity supplied is that at
which marginal revenue equals marginal cost: MR = MC.
• We saw this in Chapter 14
• In equilibrium, quantity supplied = quantity demanded
• A monopoly firm then uses the demand curve to find the price
that will induce consumers to buy the profit-maximizing
quantity.
19
CHAPTER 15 MONOPOLY
Figure 4 Profit Maximization for a Monopoly
20
Quantity
Q Q
0
Costs and
Revenue
Demand
Average total cost
Marginal revenue
Marginal
cost
Monopoly
price
QMAX
B
1. The intersection of the
marginal-revenue curve
and the marginal-cost
curve determines the
profit-maximizing
quantity . . .
A
2. . . . and then the demand
curve shows the price
consistent with this quantity.
MC
3. Note that P > MR = MC in
equilibrium (point B).
4. Recall that in perfect
competition P = MC and QD =
QS (Ch. 14).
Can you pinpoint the perfect
competition outcome in this
diagram?
That is, can you find the price-
and-quantity point in this
diagram at which P = MC and
QD = QS?
Figure 5 The Monopolist’s Profit
Monopoly
profit
Average
total
cost
Quantity
Monopoly
price
QMAX
0
Costs and
Revenue
Demand
Marginal cost
Marginal revenue
Average total cost
B
C
E
D
23
CHAPTER 15 MONOPOLY

chapter15,,,, (3) (1).pptxjsj hehehshkwkssh

  • 1.
  • 2.
    Monopoly • A firmis a monopoly if . . . • it is the only seller of its product, and • its product does not have close substitutes. 2 CHAPTER 15 MONOPOLY
  • 3.
    WHY MONOPOLIES ARISE •The fundamental cause of monopoly is the existence of barriers to entry. 3 CHAPTER 15 MONOPOLY
  • 4.
    WHY MONOPOLIES ARISE •Barriers to entry have three sources: • Ownership of a key resource. • The government gives a firm the exclusive right to produce some good. • Costs of production make one producer more efficient than a large number of producers. 4 CHAPTER 15 MONOPOLY
  • 5.
    Monopoly Resources • Althoughexclusive ownership of a key resource is a potential source of monopoly, in practice monopolies rarely arise for this reason. • Example: The DeBeers Diamond Monopoly CHAPTER 15 MONOPOLY 5
  • 6.
    Government-Created Monopolies • Governmentsmay restrict entry by giving one firm the exclusive right to sell a particular good in certain markets. • Example: Patent and copyright laws are two important examples of how governments create monopoly to serve the public interest. 6 CHAPTER 15 MONOPOLY
  • 7.
    Natural Monopolies • Anatural monopoly exists in a particular market if a single firm can serve that market at lower cost than any combination of two or more ... Example: delivery of electricity, phone service, tap water, etc. • Economies of scale as a cause of monopoly • Large Fixed Costs. A natural monopoly has extraordinarily large fixed costs. ... • Low Marginal Costs. ... • Long Economies of Scale. ... • Competition is Undesirable. 7 CHAPTER 15 MONOPOLY
  • 8.
    Natural Monopolies • Anatural monopoly arises when there are economies of scale over the relevant range of output. Quantity of Output Average total cost 0 Cost 8 CHAPTER 15 MONOPOLY
  • 9.
    HOW MONOPOLIES MAKEPRODUCTION AND PRICING DECISIONS • Monopoly versus Competition • Monopoly • Is the sole producer • Faces a downward-sloping demand curve • Is a price maker • Can reduce its sales to increase price • Competitive Firm • Is one of many producers • Faces a horizontal demand curve • Is a price taker • Sells as much or as little as it wants at market price 9 CHAPTER 15 MONOPOLY
  • 10.
    Figure 2 DemandCurves for Competitive and Monopoly Firms Quantity of Output Demand ’ 0 Price Quantity of Output 0 Price Demand See Ch. 14 for a review of perfect competition. 10 A firm’s demand curve under perfect competition A monopolist’s demand curve
  • 11.
    Recap from Ch14: A Firm’s Revenue • Total Revenue TR = P  Q • Average Revenue AR = TR/Q = P • Marginal Revenue MR = DTR/DQ 11 CHAPTER 15 MONOPOLY
  • 12.
    Table 1 AMonopoly’s Total, Average, and Marginal Revenue Note that P = AR > MR. Recall that, in perfect competition, P = AR = MR. 12
  • 13.
    Why is MR< P? When Q = 3, P = 8 but MR = 6. Why is MR < P? Output Effect: When the 3rd unit is sold, the firm earns an additional $8 for it. So, TR increases by $8, which is P. Price Effect: But to sell the 3rd unit, the price had to be reduced from $9 to $8. So, the total revenue from the first two units -- which would have been $18 if only 2 units were sold -- decreases to $16 when 3 units are sold. Thus, TR also decreases by $2 when the 3rd unit is sold. Therefore, the increase in total revenue is $8 - $2 = $6, which is less than P. In other words, MR < P.
  • 14.
    Figure 3 Demandand Marginal-Revenue Curves for a Monopoly Quantity of Water Price $11 10 9 8 7 6 5 4 3 2 1 0 –1 –2 –3 –4 Demand (average revenue) Marginal revenue 1 2 3 4 5 6 7 8 Note that P = AR > MR at all quantities. 14 CHAPTER 15 MONOPOLY
  • 15.
    CHAPTER 15 MONOPOLY 15 Monopoly’sOutput and Price Decision To understand how a single-price monopoly makes its output and price decision, we must first study the link between price and marginal revenue Price and Marginal Revenue Because in a monopoly there is only one firm, the demand curve facing the firm is the market demand curve. As we know that TR=P*Q, So firm will reduce prices until unless total revenue is maximized.
  • 16.
  • 17.
  • 18.
    Profit Maximization • Forany firm, the profit-maximizing quantity supplied is that at which marginal revenue equals marginal cost: MR = MC. • We saw this in Chapter 14 • In equilibrium, quantity supplied = quantity demanded • A monopoly firm then uses the demand curve to find the price that will induce consumers to buy the profit-maximizing quantity. 19 CHAPTER 15 MONOPOLY
  • 19.
    Figure 4 ProfitMaximization for a Monopoly 20 Quantity Q Q 0 Costs and Revenue Demand Average total cost Marginal revenue Marginal cost Monopoly price QMAX B 1. The intersection of the marginal-revenue curve and the marginal-cost curve determines the profit-maximizing quantity . . . A 2. . . . and then the demand curve shows the price consistent with this quantity. MC 3. Note that P > MR = MC in equilibrium (point B). 4. Recall that in perfect competition P = MC and QD = QS (Ch. 14). Can you pinpoint the perfect competition outcome in this diagram? That is, can you find the price- and-quantity point in this diagram at which P = MC and QD = QS?
  • 20.
    Figure 5 TheMonopolist’s Profit Monopoly profit Average total cost Quantity Monopoly price QMAX 0 Costs and Revenue Demand Marginal cost Marginal revenue Average total cost B C E D 23 CHAPTER 15 MONOPOLY

Editor's Notes

  • #21 The average total cost and marginal cost curves were discussed in Chapter 13.