Chapter 8
Cost of Capital
Associated Press
Learning Objectives
A�er studying this chapter, you should be able to:
Show how the discount rate is calculated and used.
Explain how the weighted average cost of capital is calculated, and outline the significance of its components.
Describe how to es�mate the discount rate for individual projects and how risk factors into the process.
Processing math: 0%
Ch. 8 Introduction
Chapter 6 described the various capital budge�ng techniques employed by corporate managers. Among the techniques, net present value (NPV) emerges as the best measure
of a project's contribu�on to shareholder wealth. In NPV analysis, the present value of a project's expected future cash flows is compared to the ini�al investment, and the
project is accepted if the present value exceeds the ini�al investment. Calcula�on of NPV requires the analyst to es�mate cash flows and an appropriate discount rate.
Techniques for es�ma�ng cash flows were covered in Chapter 6. In this chapter, you will learn how to es�mate the discount rate. The same es�mates of cash flows and
discount rate are also used in internal rate of return analysis. Used in IRR, the discount rate becomes a hurdle rate against which to compare the project's IRR.
Processing math: 0%
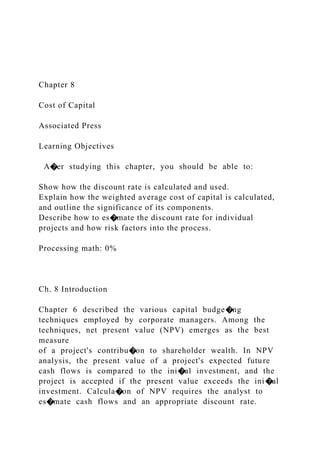
Financing mix and cash flows for the Pogo harness project.
8.1 Estimating the Discount Rate
To illustrate the calcula�on and use of the discount rate, we elaborate on the Chapter 6 example of Pacific Offshore Ltd. (POL). Recall the NPV of POL's Pogo harness project
is $9,110, which was found by discoun�ng the project's net cash flows by 12.5% (the required rate of return). The project's internal rate of return of 17.2% is greater than
the 12.5% required rate of return on the harness project; therefore, whether we use NPV or IRR, the harness project appears to be acceptable because it meets the
respec�ve decision criteria. Had the required return been 20%, for example, the project would have been rejected using either criterion. Table 8.1 reviews the details of
POL's Pogo harness project from Chapter 6.
Table 8.1: Review of POL's Pogo harness project details
Data Category Value
Project cost $64,384
Required rate of return 12.5%
Internal rate of return 17.2%
Net present value $9,110
We have referred to the 12.5% as the harness project's required rate of return. To be more specific, 12.5% is the weighted average return demanded by the company's
investors. The weigh�ngs reflect the propor�onal values of their investments. From Chapter 6, the cost of the harness project is $64,384, meaning that Paula Bauer must
raise that amount from her inves ...
Learning ObjectivesUpon completion of Chapter 10, you will.docxSHIVA101531
Learning Objectives
Upon completion of Chapter 10, you will be able to:
• Understand the meaning of the weighted average cost of capital (WACC).
• Be able to estimate the weights in the WACC.
• Be able to estimate the cost of debt and how it is affected by taxes.
• Be able to estimate the cost of preferred stock.
• Know three approaches for estimating the cost of equity.
• Understand flotation costs and how they affect the WACC.
• Know when the WACC is the appropriate approach for estimating the required return for a project.
• Know an alternative approach for estimating a project’s required return when the WACC is not
the appropriate measure.
Cost of Capital
10
Nina Mourier/Getty Images
byr80656_10_c10_245-270.indd 245 3/28/13 3:35 PM
CHAPTER 10Section 10.1 Estimating the Discount Rate
Corporate managers use various capital budgeting techniques. Among these tech-niques, net present value (NPV) emerges as the best measure of a project’s con-tribution to shareholder wealth. In NPV analysis, the present value of a project’s
expected future cash flows is compared to the initial investment, and the project is accepted
if the present value exceeds the initial investment. Calculation of NPV requires the analyst
to estimate cash flows and an appropriate discount rate. Techniques for estimating cash
flows were covered in Chapter 6. In this chapter you will learn how to estimate the dis-
count rate. The same estimates of cash flows and discount rate are also used in internal
rate of return analysis. Used in IRR, the discount rate becomes a hurdle rate against which
to compare the project’s IRR.
10.1 Estimating the Discount Rate
To illustrate the calculation and use of the discount rate, we introduce a case study of Pacific Offshore Ltd. (POL). POL is considering the manufacture and sale of har-nesses to be used by sailors who must be tethered to their boats in the high seas.
The harnesses can save the lives of sailors who are washed overboard in rough water and
storms. The NPV of POL’s harness project is $9,110, which was found by discounting the
project’s net cash flows by 12.5%. The project’s internal rate of return of 17.2% is greater
than the 12.5% required rate of return on the harness project. Therefore, whether we use
NPV or IRR, the harness project appears to be acceptable because it meets the respective
decision criteria. Had the required return been 20%, for example, the project would have
been rejected using either criterion.
We have referred to the 12.5% as the harness project’s required rate of return. To be more
specific, 12.5% is the weighted average return demanded by the company’s investors. The
weightings reflect the proportional values of their investments. The cost of the harness
project is $64,384, meaning that the owners must raise that amount from their investors
to fund tools, equipment, and working capital and to pay the cost of reconfiguring the
plant. The owners decided to fund futu ...
Sheet4Assignment 1 LASA # 2—Capital Budgeting Techniques
Sheet1
Solution
:-A) Computation of WACC:-Cost of equity (Ke) will be calculated using dividend discount model which is as under:-Price of share (P0) = D1/(Ke-g)Ke = (D1/(P0*(1-f))) + gWhere,D1 = D0*(1+g)F = Flotation costKe = ((2.50*(1+6%))/(50*(1-10%))) + 6%Ke = 11.89%i) Equity financing and debt financing are two different sources of financing being used by the organizations to procure funds. Equity and debt are two different sources of financing, equity financing represents internal source of finance whereas debt financing represent external source of finance. Mixture of both is always used by the business organizations to procure funds and is most commonly known as target ratio or capital structure ratio. This ration varies from industry to industry and company and company depending upon various circumstances, equity financing can be raised only through issuing shares in market by the help of initial public offer whereas debt financing can be raise from many sources such as bonds, long term loans, money market instruments etc.Equity Financing has following advantages:1. The total cash flows generated can be used solely for investment purpose, rather than paying back the investors.2. Funds can be raised in shorter time as compared to other sources of funds.However, in equity financing, dilution of ownership easily occurs and more investors can lead to loss of Control.Cost of debt (Kd) will be calculated as follows:-Kd = Market rate of deb*(1-tax rate)Kd = 5%*(1-35%)Kd = 3.25%Debt is a more common source of finance used by most of the organizations, the reason for the same is as follows:-a. Debt is cheaper source of finance as compared to equity the reason being the cost associated with issuing the common stock like. Underwriters commission, legal expenses, various registration charges, issuing of prospectus, printing of various documents etc.b. Debt financing provide leverage to the company which will increase the Earning per Share (EPS) which in turn leads to increase in market value of share, this helps organization to maximize its market capitalization.However, if the expansion venture does not work in favour of the company, then these obligations of repayment of principal and interest may turnout to be a burden to the company. WACC = (Ke*We) + (Kd*Wd)WACC = (11.89%*70%) + (3.25%*30%)WACC = 9.30%B) Computation of NPV of project A:-Depreciation = Cost of the asset – salvage value Life of the asset = 1,500,000/ 3 = 500,000Calculation of cash flows:Revenue – 1,200,000Less Cost – 600,000Less Depreciation – 500,000Profit - 100,000Less taxes (35%) 35,000Profit after taxes .
Chapter 4 focuses on describing how to estimate and calculate Weighted Average Cost of Capital, answering the following questions:
How is the WACC calculated?
What is the Cost of Debt, Cost of Equity and Beta?
What is the Market Risk Premium and Country Risk Premium?
What is the periodicity of WACC calculation?
AgendaComprehending risk when modeling investment (project) de.docxgalerussel59292
Agenda
Comprehending risk when modeling investment (project) decisions
Standalone Risk
Market Risk
1
1
Project Risk
Standalone Risk: Risk based on uncertainty of a projects cash flows
Sensitivity
Scenarios
Breakeven
Simulations
Market Risk: Risk of the project as seen by a well diversified investor
Beta
2
Sensitivity, Scenario, and Break-Even
Each allows us to look behind the NPV number to see how stable our estimates are.
Breakeven: sales required to breakeven
Accounting break-even: sales volume at which net income = 0
Cash break-even: sales volume at which operating cash flow = 0
Financial break-even: sales volume at which net present value = 0
Sensitivity: how sensitive a particular NPV calculation is to changes in an input variable holding all other assumptions are held constant
Scenario: examine impact on NPV given a confluence of factors
When working with spreadsheets, try to build your model so that you can adjust variables in a single cell and have the NPV calculations update accordingly.
3
3
Monte Carlo Simulation
A more sophisticated variation of the scenario analysis is Monte Carlo simulation.
In a Monte Carlo simulation, analysts specify a range or a distribution of potential outcomes for each of the model’s assumptions.
Pick a probability distribution for each input variable (units, price, variable costs, etc).
The computer program will pick a random value from each input variable, calculate the NPV and store the result. This is a trial.
Repeat the process many times, saving the input variables and the output (NPV).
End result: Probability distribution of NPV based on sample of simulated values.
4
Example
5
6
When a firm with both debt and equity invests in an asset similar to its existing assets (business), the WACC is the appropriate discount rate to use in NPV calculations.
In conglomerates, the WACC reflects the return that the firm must earn on average across all its assets to satisfy investors, but using the WACC to discount cash flows of a particular investment leads to mistakes.
Any project’s cost of capital depends on the use to which the capital is being put—not the source.
Therefore, it depends on the risk of the project and not the risk of the company.
When a firm invests in an asset that is different from its existing assets, it should look for pure-play firms to find the right discount rate.
6
Finding the Right Discount Rate
6
You are a financial analyst at General Electric and are preparing a cost of equity estimate for a project analysis using NPV:
CAPM = Risk Free Rate + Beta * Market Risk Premium
9.5% = 3.0% + 1.1 * 5.9%
Lines of Business
Financial Services
Power Generation
Aviation
Transportation
Health Care
Consumer Goods
When evaluating a new power generation investment for GE, which cost of capital should be used?
Capital Budgeting & Project Risk
7
Beta
1.8
0.6
1.2
1.3
0.8
1.1
7
17
Capital Budgeti.
Option #2Researching a Leader Complete preliminary rese.docxmccormicknadine86
Option #2:
Researching a Leader
Complete preliminary research on the Internet and/or using online library databases. Compose a 1 PAGE summary of sources and an overview of each source.
Post any questions or comments about the content or requirements of the Portfolio Project to the questions thread in the Discussion Forum.
.
Option 1 ImperialismThe exploitation of colonial resources.docxmccormicknadine86
Option 1: Imperialism
The exploitation of colonial resources and indigenous labor was one of the key elements in the success of imperialism. Such exploitation was a result of the prevalent ethnocentrism of the time and was justified by the unscientific concept of social Darwinism, which praised the characteristics of white Europeans and inaccurately ascribed negative characteristics to indigenous peoples. A famous poem of the time by Rudyard Kipling, "White Man's Burden," called on imperial powers, and particularly the U.S., at whom the poem was directed, to take up the mission of civilizing these "savage" peoples.
Read the poem at the following link:
Link (website):
White Man's Burden (Links to an external site.)
(Rudyard Kipling)
After reading the poem, address the following in a case study analysis:
Select a specific part of the world (a country), and examine imperialism in that country. What was the relationship between the invading country and the native people? You can select from these examples or choose your own:
Belgium & Africa
Britain & India
Germany & Africa
France & Africa
Apply social Darwinism to this specific case.
Analyze the motivations of the invading country?
How did ethnocentrism manifest in their interactions?
How does Kipling's poem apply to your specific example? You can quote lines for comparison.
.
More Related Content
Similar to Chapter 8Cost of CapitalAssociated PressLearning O.docx
Sheet4Assignment 1 LASA # 2—Capital Budgeting Techniques
Sheet1
Solution
:-A) Computation of WACC:-Cost of equity (Ke) will be calculated using dividend discount model which is as under:-Price of share (P0) = D1/(Ke-g)Ke = (D1/(P0*(1-f))) + gWhere,D1 = D0*(1+g)F = Flotation costKe = ((2.50*(1+6%))/(50*(1-10%))) + 6%Ke = 11.89%i) Equity financing and debt financing are two different sources of financing being used by the organizations to procure funds. Equity and debt are two different sources of financing, equity financing represents internal source of finance whereas debt financing represent external source of finance. Mixture of both is always used by the business organizations to procure funds and is most commonly known as target ratio or capital structure ratio. This ration varies from industry to industry and company and company depending upon various circumstances, equity financing can be raised only through issuing shares in market by the help of initial public offer whereas debt financing can be raise from many sources such as bonds, long term loans, money market instruments etc.Equity Financing has following advantages:1. The total cash flows generated can be used solely for investment purpose, rather than paying back the investors.2. Funds can be raised in shorter time as compared to other sources of funds.However, in equity financing, dilution of ownership easily occurs and more investors can lead to loss of Control.Cost of debt (Kd) will be calculated as follows:-Kd = Market rate of deb*(1-tax rate)Kd = 5%*(1-35%)Kd = 3.25%Debt is a more common source of finance used by most of the organizations, the reason for the same is as follows:-a. Debt is cheaper source of finance as compared to equity the reason being the cost associated with issuing the common stock like. Underwriters commission, legal expenses, various registration charges, issuing of prospectus, printing of various documents etc.b. Debt financing provide leverage to the company which will increase the Earning per Share (EPS) which in turn leads to increase in market value of share, this helps organization to maximize its market capitalization.However, if the expansion venture does not work in favour of the company, then these obligations of repayment of principal and interest may turnout to be a burden to the company. WACC = (Ke*We) + (Kd*Wd)WACC = (11.89%*70%) + (3.25%*30%)WACC = 9.30%B) Computation of NPV of project A:-Depreciation = Cost of the asset – salvage value Life of the asset = 1,500,000/ 3 = 500,000Calculation of cash flows:Revenue – 1,200,000Less Cost – 600,000Less Depreciation – 500,000Profit - 100,000Less taxes (35%) 35,000Profit after taxes .
Chapter 4 focuses on describing how to estimate and calculate Weighted Average Cost of Capital, answering the following questions:
How is the WACC calculated?
What is the Cost of Debt, Cost of Equity and Beta?
What is the Market Risk Premium and Country Risk Premium?
What is the periodicity of WACC calculation?
AgendaComprehending risk when modeling investment (project) de.docxgalerussel59292
Agenda
Comprehending risk when modeling investment (project) decisions
Standalone Risk
Market Risk
1
1
Project Risk
Standalone Risk: Risk based on uncertainty of a projects cash flows
Sensitivity
Scenarios
Breakeven
Simulations
Market Risk: Risk of the project as seen by a well diversified investor
Beta
2
Sensitivity, Scenario, and Break-Even
Each allows us to look behind the NPV number to see how stable our estimates are.
Breakeven: sales required to breakeven
Accounting break-even: sales volume at which net income = 0
Cash break-even: sales volume at which operating cash flow = 0
Financial break-even: sales volume at which net present value = 0
Sensitivity: how sensitive a particular NPV calculation is to changes in an input variable holding all other assumptions are held constant
Scenario: examine impact on NPV given a confluence of factors
When working with spreadsheets, try to build your model so that you can adjust variables in a single cell and have the NPV calculations update accordingly.
3
3
Monte Carlo Simulation
A more sophisticated variation of the scenario analysis is Monte Carlo simulation.
In a Monte Carlo simulation, analysts specify a range or a distribution of potential outcomes for each of the model’s assumptions.
Pick a probability distribution for each input variable (units, price, variable costs, etc).
The computer program will pick a random value from each input variable, calculate the NPV and store the result. This is a trial.
Repeat the process many times, saving the input variables and the output (NPV).
End result: Probability distribution of NPV based on sample of simulated values.
4
Example
5
6
When a firm with both debt and equity invests in an asset similar to its existing assets (business), the WACC is the appropriate discount rate to use in NPV calculations.
In conglomerates, the WACC reflects the return that the firm must earn on average across all its assets to satisfy investors, but using the WACC to discount cash flows of a particular investment leads to mistakes.
Any project’s cost of capital depends on the use to which the capital is being put—not the source.
Therefore, it depends on the risk of the project and not the risk of the company.
When a firm invests in an asset that is different from its existing assets, it should look for pure-play firms to find the right discount rate.
6
Finding the Right Discount Rate
6
You are a financial analyst at General Electric and are preparing a cost of equity estimate for a project analysis using NPV:
CAPM = Risk Free Rate + Beta * Market Risk Premium
9.5% = 3.0% + 1.1 * 5.9%
Lines of Business
Financial Services
Power Generation
Aviation
Transportation
Health Care
Consumer Goods
When evaluating a new power generation investment for GE, which cost of capital should be used?
Capital Budgeting & Project Risk
7
Beta
1.8
0.6
1.2
1.3
0.8
1.1
7
17
Capital Budgeti.
Option #2Researching a Leader Complete preliminary rese.docxmccormicknadine86
Option #2:
Researching a Leader
Complete preliminary research on the Internet and/or using online library databases. Compose a 1 PAGE summary of sources and an overview of each source.
Post any questions or comments about the content or requirements of the Portfolio Project to the questions thread in the Discussion Forum.
.
Option 1 ImperialismThe exploitation of colonial resources.docxmccormicknadine86
Option 1: Imperialism
The exploitation of colonial resources and indigenous labor was one of the key elements in the success of imperialism. Such exploitation was a result of the prevalent ethnocentrism of the time and was justified by the unscientific concept of social Darwinism, which praised the characteristics of white Europeans and inaccurately ascribed negative characteristics to indigenous peoples. A famous poem of the time by Rudyard Kipling, "White Man's Burden," called on imperial powers, and particularly the U.S., at whom the poem was directed, to take up the mission of civilizing these "savage" peoples.
Read the poem at the following link:
Link (website):
White Man's Burden (Links to an external site.)
(Rudyard Kipling)
After reading the poem, address the following in a case study analysis:
Select a specific part of the world (a country), and examine imperialism in that country. What was the relationship between the invading country and the native people? You can select from these examples or choose your own:
Belgium & Africa
Britain & India
Germany & Africa
France & Africa
Apply social Darwinism to this specific case.
Analyze the motivations of the invading country?
How did ethnocentrism manifest in their interactions?
How does Kipling's poem apply to your specific example? You can quote lines for comparison.
.
Option Wireless LTD v. OpenPeak, Inc.Be sure to save an elec.docxmccormicknadine86
Option Wireless LTD v. OpenPeak, Inc.
Be sure to save an electronic copy of your answers before submitting it to Ashworth College for grading. Unless otherwise stated, you should answer in complete sentences, and be sure to use correct English, spelling, and grammar. Sources must be cited in APA format.
Your response should be a minimum of four (4) double-spaced pages; refer to the Length and Formatting instructions below for additional details.
In complete sentences respond to the following prompts:
Summarize the facts of the case;
Identify the parties and explain each party’s position;
Outline the case’s procedural history including any appeals;
What is the legal issue in question in this case?
How did the court rule on the legal issue of this case?
What facts did the court find to be most important in making its decision?
Respond to the following questions:
Are there any situations in which it might be a good idea to include additional or different terms in the “acceptance” without making the acceptance expressly conditional on assent to the additional or different terms?
Under what conditions can a contract be formed by the parties’ conduct? Why wasn’t the conduct of the parties here used as the basis for a contract?
Do you agree or disagree with the court’s decision? Provide an explanation for your reasoning either agree or disagree.
UNITED STATES DISTRICT COURT SOUTHERN DISTRICT OF FLORIDA CASE NO. 12-80165-CIV-MARRA
OPTION WIRELESS, LTD., an Irish limited liability company, Plaintiff, v. OPENPEAK, INC., a Delaware corporation, Defendant. ______________________________/
OPINION AND ORDER
THIS CAUSE is before the Court upon Plaintiff/Counter-Defendant’s Motion to Dismiss Defendant/Counter-Plaintiff’s Counterclaim (DE 6). Counter-Plaintiff OpenPeak Inc. filed its 1 Memorandum in Opposition (DE 8). Counter-Defendant Option Wireless, Ltd, replied. (DE 12). The Court has carefully considered the briefs ofthe parties and is otherwise fully advised in the premises. I. Introduction2 In July 2010, Counter-Plaintiff OpenPeak Inc. was producing a computer tablet product for AT&T. (DE 4 ¶ 5). Seeking embedded wireless data modules for the tablet, Counter-Plaintiff submitted a purchase order to Counter-Defendant Option Wireless, Ltd, for 12,300 units of the modules at the price of $848,700.00. (DE 4 ¶ 4). Section 9 of the purchase order, labeled “BUYER’S TERMS AND CONDITIONS,” provided that [a]ll purchase orders and sales are made only upon these terms and conditions and those on the front of this document. This document, and not any quotation, invoice, or other Seller document (which, if construed to be an offer is hereby rejected), will Option Wireless, Ltd. v. OpenPeak, Inc. Doc. 19 Dockets.Justia.com 2 be deemed an offer or an appropriate counter-offer and is a rejection of any other terms or conditions. Seller, byaccepting any orders or deliverin.
Option A Land SharkWhen is a shark just a shark Consider the.docxmccormicknadine86
Option A: Land Shark
When is a shark just a shark? Consider the movie
Jaws
. What could the shark symbolize in our culture, society, or collective human mythology other than a man-eating fish? Why? Support your answer.
Next, think about a theatrical staging of
Jaws
. Describe the artistic choices you would make to bring
Jaws
the movie to Broadway. What genre would you choose? Describe at least three other elements of production and how you would approach them in your staging of
Jaws
as a stage play or musical.
Create
a response to these concepts in one of the following formats:
350- to 700-word paper
Apply
appropriate APA formatting.
.
Option 3 Discuss your thoughts on drugs and deviance. Do you think .docxmccormicknadine86
Option 3: Discuss your thoughts on drugs and deviance. Do you think using drugs is deviant behavior? Why do you think alcohol and tobacco are legal drugs and their use is not considered deviant when they are addictive, physically harmful, and socially disruptive?
No quotes or references needed.
.
OPTION 2 Can we make the changes we need to make After the pandemi.docxmccormicknadine86
OPTION 2: Can we make the changes we need to make? After the pandemic, we are in a time of significant upheaval and transition. We are all more keenly aware that economic shifts and transformations can happen suddenly and dramatically. As the World shut itself down in March 2020, it makes us all aware that we can change behavior globally and as a matter of will. In the U.S., people began to quarantine themselves ahead of government action more often than as a result of government mandates. Write a cohesive 1-2 page single-spaced document that answers the following questions.
2a. Reflecting on the profound changes we have all seen in the past year, how does that change your views regarding what might be possible with regard to energy use, carbon reductions, or other major transformations that might be needed to impact the type of climate change Earth has been experiencing.
2b. Reflect on the type of transformations that would be involved to address global warming. Now that you have seen the recent major transformations, does this make you believe that global warming threats can prompt the type of major economic and industrial changes needed to reduce the impacts that have been anticipated with increasing climate changes?
2c. What are the "experts" saying about the possibility of these transformations in light of what they have seen during the pandemic? Are researchers more or less optimistic about our global ability to reduce green house gases and control climate change after seeing the impact of the pandemic? Be sure to include REFERENCES both at the end of the text and in the text, like (Author, year)
.
Option 1 You will create a PowerPoint (or equivalent) of your p.docxmccormicknadine86
Option 1: You will create a PowerPoint (or equivalent) of your presentation and add voice over.
Option 2: If you are unable to add voice over to your PowerPoint, you will create a PowerPoint (or equivalent) of your presentation. Next, you will use
Screencast-o-
Matic
(or a similar program) to create a video recording of your screen and voice as your present the information. Third, you will upload the video presentation to
YouTube
so your instructor can view it. If you choose this option, you will submit your article as well as the PowerPoint (or equivalent) file and the link to the YouTube presentation to complete this assignment.
Guidelines:
The presentation must include both audio (your voice explaining the information) and visual (PowerPoint presentation including text and/or images). Videos should not be used within the presentation.
The presentation should include the following three aspects:
An overview of your specific topic and its importance and application in current society. Include historical information as appropriate to understand your topic.
Identification, discussion, and
critical evaluation
of the most frequently used assessment instruments related to your topic. Include the typical settings and purposes for which assessment instruments are used.
Discussion of the ethical, cultural, and societal issues concerning the use of psychological tests and assessment as related to your topic.
The presentation must be 15 minutes long (no more than 20).
The presentation must include information from at least 10 scholarly sources (if used, the course textbook does not count as one of these 10 sources).
APA style citations should be used within the presentation. A reference section (in APA style) should appear at the end of the presentation.
Resources:
.
Option A Description of Dance StylesSelect two styles of danc.docxmccormicknadine86
Option A: Description of Dance Styles
Select
two styles of dance, such as ballet, modern dance, or folk dance.
Describe
each style of dance, and
include
the following:
History and development of the style
Discussion of your understanding of the use of line, form, repetition, and rhythm in each piece
Description of what the movements of both styles communicate to you in terms of mood
Description of how artistic choice can affect the viewer in the selected style
Submit
your assignment in one of the following formats:
700- to 1,050-word paper
.
Option #2Provide several slides that explain the key section.docxmccormicknadine86
Option #2
Provide several slides that explain the key sections of your strategy you will use in the final Portfolio Project. Provide section headers and a brief description of each.
FINAL PROJECT GUIDE
In a 6- to 10-page paper, as the local Union President, design a managing union handbook for union relationship building and a process that favors union employees as well as identifying key components of the bargaining process that can easily be sold to your union members. Apply theory and design systems and policies throughout your work covering:
Contextual factors (historical and legislative) that have impacted and still impact the union environment;
policies that create a more sustainable union model;
management strategy for union collective bargaining that includes: innovative wage, benefit, and non-wage factors; and
employee engagement and involvement strategies that take into consideration the diverse and changing labor force.
.
Option 2 Slavery vs. Indentured ServitudeExplain how and wh.docxmccormicknadine86
Option 2: Slavery vs. Indentured Servitude
Explain how and why slavery developed in the American colonies.
Describe in what ways the practice of slavery was different between each colonial region in British North America.
Analyze the differences between slaves and indentured servants.
Writing Requirements (APA format)
Length: 1-2 pages (not including title page or references page)
Use standard essay writing process by including an introduction, body paragraphs, and a conclusion.
1-inch margins
Double spaced
12-point Times New Roman font
Title page
References page (minimum of 1 scholarly source)
No abstract is required
In-text citations that correspond with your end references
.
Option 2 ArtSelect any 2 of works of art about the Holocaus.docxmccormicknadine86
Option 2: Art
Select any 2 of works of art about the Holocaust. You can select from the following list or conduct additional research on Holocaust art. Make sure to get approval from your instructor if you are selecting something not on the list. Click on the link to see the list:
Link: List of Artists/Artworks
Write an analysis of each artwork, including the following information:
Identify the title, artist, date completed, and medium used.
Explain the content of the artwork - what do the images show?
How does the artwork relate to the bigger picture of the Holocaust?
How effective is the artwork in relating the Holocaust to viewers?
LIST OF ARTISTS AND ARTWORK
Morris Kestelman:
Lama Sabachthani [Why Have You Forsaken Me?]
George Mayer-Marton:
Women with Boudlers
Bill Spira:
Prisoners Carrying Cement
Jan Hartman:
Death March (Czechowice-Bielsko, January 1945)
Edgar Ainsworth:
Belsen
Leslie Cole:
One of the Death Pits, Belsen. SS Guards Collecting Bodies
Doris Zinkeisen:
Human Laundry, Belsen: April 1945
Eric Taylor:
A Young Boy from Belsen Concentration Camp
Mary Kessell:
Notes from Belsen Camp
Edith Birkin:
The Death Cart - Lodz Ghetto
Shmuel Dresner:
Benjamin
Roman Halter:
Mother with Babies
Leo Breuer:
Path Between the Barracks, Gurs Camp
Leo (Lev) Haas:
Transport Arrival, Theresienstadt Ghetto
Jacob Lipschitz:
Beaten (My Brother Gedalyahu)
Norbert Troller:
Terezin
Anselm Kiefer:
Sternenfall
.
Option #1 Stanford University Prison Experiment Causality, C.docxmccormicknadine86
Option #1:
Stanford University Prison Experiment: Causality, Controlling Patterns, and Growth Mode
Revisit Philip Zimbardo's (1971) Stanford University Prison Experiment. Analyze the experiment in terms of causality, controlling patterns, and its growth mode.
What lessons can be learned from this experiment that can be generalized to business social systems, such as organizational design/organizational structures?
Your well-written paper should meet the following requirements:
· Be 5 pages in length.
· Be formatted according to APA
· Include at least five scholarly or peer-reviewed articles
· Include a title page, section headers, introduction, conclusion, and references page.
Reference:
Revisiting the Stanford Prison Experiment: a Lesson in the Power of Situation
~~~~~~~~
BY THE 1970s, psychologists had done a series of studies establishing the social power of groups. They showed, for example, that groups of strangers could persuade people to believe statements that were obviously false. Psychologists had also found that research participants were often willing to obey authority figures even when doing so violated their personal beliefs. The Yale studies by Stanley Milgram in 1963 demonstrated that a majority of ordinary citizens would continually shock an innocent man, even up to near-lethal levels, if commanded to do so by someone acting as an authority. The "authority" figure in this case was merely a high-school biology teacher who wore a lab coat and acted in an official manner. The majority of people shocked their victims over and over again despite increasingly desperate pleas to stop.
In my own work, I wanted to explore the fictional notion from William Golding's Lord of the Flies about the power of anonymity to unleash violent behavior. In one experiment from 1969, female students who were made to feel anonymous and given permission for aggression became significantly more hostile than students with their identities intact. Those and a host of other social-psychological studies were showing that human nature was more pliable than previously imagined and more responsive to situational pressures than we cared to acknowledge. In sum, these studies challenged the sacrosanct view that inner determinants of behavior--personality traits, morality, and religious upbringing--directed good people down righteous paths.
Missing from the body of social-science research at the time was the direct confrontation of good versus evil, of good people pitted against the forces inherent in bad situations. It was evident from everyday life that smart people made dumb decisions when they were engaged in mindless groupthink, as in the disastrous Bay of Pigs invasion by the smart guys in President John F. Kennedy's cabinet. It was also clear that smart people surrounding President Richard M. Nixon, like Henry A. Kissinger and Robert S. McNamara, escalated the Vietnam War when they knew, and later admitted, it was not winnable. They were .
Option A Gender CrimesCriminal acts occur against individu.docxmccormicknadine86
Option A: Gender Crimes
Criminal acts occur against individuals because of gender – some of these are labeled as hate crimes in the U.S. (consider cases of violence against transgendered and homosexual individuals) and others occur across cultures. Choose two other types of “gender crimes” and discuss what these acts reveal about deep-seated cultural values and beliefs. One possibility is to examine bride burning or dowry death in India.
Submit a paper (750-1250 words) that explores gender crimes. Provide at least three references cited within the text and listed in the references section.
.
opic 4 Discussion Question 1 May students express religious bel.docxmccormicknadine86
opic 4: Discussion Question 1
May students express religious beliefs in class discussion or assignments or engage in prayer in the classroom? What are some limitations? Support your position with examples from case law, the U.S. Constitution, or other readings.
Topic 4: Discussion Question 2
Do all student-led religious groups have an absolute right to meet at K-12 schools? If not, discuss one limitation under the Equal Access Act. May a teacher be a sponsor of the club? Can the teacher participate in its activities? Why or why not? Support your position with examples from case law, the U.S. Constitution, or other readings.
.
Option 1Choose a philosopher who interests you. Research that p.docxmccormicknadine86
Option 1:
Choose a philosopher who interests you. Research that philosopher, detailing how they developed their ideas and the importance of those ideas to the progress of philosophy and human understanding. Keep in mind that you should be focusing on their philosophy, not simply their biography, although some basic details of their life not related to philosophy may be needed, especially when it involves experiences that influenced their thinking.
Option 2:
Look at a specific Philosophical movement. Explain the ideas important to that movement (such as existentialism and positivism) and the influence they had. I am pretty flexible on what you can do with this one, so if you have an idea, don’t hesitate to ask!
Requirements
The typed body of your paper must be a minimum of 1500 words.
It should be typed, 12 point, double spaced. A minimum of three sources must be used,
.
Option #1The Stanford University Prison Experiment Structu.docxmccormicknadine86
Option #1:
The Stanford University Prison Experiment: Structure, Behavior, and Results
Philip Zimbardo’s Stanford University Prison Experiment could be described as a system whose systemic properties enabled the behaviors of the system's actors, leading to disturbing results.
Analyze the situation. What were the key elements of the system? How did the system operate? Why did the participants behave as they did? What lessons can be learned from this experiment about systems in relation to management?
Your well-written paper should meet the following requirements:
Be six pages in length.
Be formatted according to the APA
Include at least seven scholarly or peer-reviewed articles.
Include a title page, section headers, introduction, conclusion, and references page.
Reference:
Zimbardo, P. G. (2007).
Revisiting the Stanford prison experiment: A lesson in the power of situation (Links to an external site.)
.
Chronicle of Higher Education, 53(
30), B6.
BY THE 1970s, psychologists had done a series of studies establishing the social power of groups. They showed, for example, that groups of strangers could persuade people to believe statements that were obviously false. Psychologists had also found that research participants were often willing to obey authority figures even when doing so violated their personal beliefs. The Yale studies by Stanley Milgram in 1963 demonstrated that a majority of ordinary citizens would continually shock an innocent man, even up to near-lethal levels, if commanded to do so by someone acting as an authority. The "authority" figure in this case was merely a high-school biology teacher who wore a lab coat and acted in an official manner. The majority of people shocked their victims over and over again despite increasingly desperate pleas to stop.
In my own work, I wanted to explore the fictional notion from William Golding's Lord of the Flies about the power of anonymity to unleash violent behavior. In one experiment from 1969, female students who were made to feel anonymous and given permission for aggression became significantly more hostile than students with their identities intact. Those and a host of other social-psychological studies were showing that human nature was more pliable than previously imagined and more responsive to situational pressures than we cared to acknowledge. In sum, these studies challenged the sacrosanct view that inner determinants of behavior--personality traits, morality, and religious upbringing--directed good people down righteous paths.
Missing from the body of social-science research at the time was the direct confrontation of good versus evil, of good people pitted against the forces inherent in bad situations. It was evident from everyday life that smart people made dumb decisions when they were engaged in mindless groupthink, as in the disastrous Bay of Pigs invasion by the smart guys in President John F. Kennedy's cabinet. It was also clear that smart people su.
Open the file (Undergrad Reqt_Individual In-Depth Case Study) for in.docxmccormicknadine86
Open the file (Undergrad Reqt_Individual In-Depth Case Study) for instruction which is
blue highlighted
and I already
highlighted yellow
for the section that you need to answer which is
SECTION 2.
I
uploaded 2 articles that you need to read to answer the questions
and Pay attention to (Individual In-Depth Case Study Rubric).
.
onsider whether you think means-tested programs, such as the Tem.docxmccormicknadine86
onsider whether you think means-tested programs, such as the Temporary Assistance for Needy Families (TANF), Supplemental Nutrition Assistance Program (SNAP), and Supplemental Security Income (SSI), create dependency among its recipients. Then, think about how the potential perception of dependency might contribute to the stigma surrounding welfare programs. Finally, reflect on the perceptions you might have regarding individuals who receive means-tested welfare and how that perception might affect your work with clients.
By Day 4
Post
an explanation of whether means-tested programs (TANF, SNAP, and SSI) create dependency. Then, explain how the potential perception of dependency might contribute to the stigma surrounding welfare programs. Finally, explain the perceptions you have regarding people who receive means-tested welfare and how that perception might affect your work with clients.
Support your post with specific references to the resources. Be sure to provide full APA citations for
.
Operations security - PPT should cover below questions (chapter 1 to 6)
Compare & Contrast access control in relations to risk, threat and vulnerability.
Research and discuss how different auditing and monitoring techniques are used to identify & protect the system against network attacks.
Explain the relationship between access control and its impact on CIA (maintaining network confidentiality, integrity and availability).
Describe access control and its level of importance within operations security.
Argue the need for organizations to implement access controls in relations to maintaining confidentiality, integrity and availability (e.g., Is it a risky practice to store customer information for repeat visits?)
Describe the necessary components within an organization's access control metric.
Power Point Presentation
7 - 10 slides total (
does not include title or summary slide
)
Try using the 6×6 rule to keep your content concise and clean looking. The 6×6 rule means a maximum of six bullet points per slide and six words per bullet point
Keep the colors simple
Use charts where applicable
Use notes section of slide
Include transitions
Include use of graphics / animations
.
The French Revolution, which began in 1789, was a period of radical social and political upheaval in France. It marked the decline of absolute monarchies, the rise of secular and democratic republics, and the eventual rise of Napoleon Bonaparte. This revolutionary period is crucial in understanding the transition from feudalism to modernity in Europe.
For more information, visit-www.vavaclasses.com
Francesca Gottschalk - How can education support child empowerment.pptxEduSkills OECD
Francesca Gottschalk from the OECD’s Centre for Educational Research and Innovation presents at the Ask an Expert Webinar: How can education support child empowerment?
Unit 8 - Information and Communication Technology (Paper I).pdfThiyagu K
This slides describes the basic concepts of ICT, basics of Email, Emerging Technology and Digital Initiatives in Education. This presentations aligns with the UGC Paper I syllabus.
Introduction to AI for Nonprofits with Tapp NetworkTechSoup
Dive into the world of AI! Experts Jon Hill and Tareq Monaur will guide you through AI's role in enhancing nonprofit websites and basic marketing strategies, making it easy to understand and apply.
Embracing GenAI - A Strategic ImperativePeter Windle
Artificial Intelligence (AI) technologies such as Generative AI, Image Generators and Large Language Models have had a dramatic impact on teaching, learning and assessment over the past 18 months. The most immediate threat AI posed was to Academic Integrity with Higher Education Institutes (HEIs) focusing their efforts on combating the use of GenAI in assessment. Guidelines were developed for staff and students, policies put in place too. Innovative educators have forged paths in the use of Generative AI for teaching, learning and assessments leading to pockets of transformation springing up across HEIs, often with little or no top-down guidance, support or direction.
This Gasta posits a strategic approach to integrating AI into HEIs to prepare staff, students and the curriculum for an evolving world and workplace. We will highlight the advantages of working with these technologies beyond the realm of teaching, learning and assessment by considering prompt engineering skills, industry impact, curriculum changes, and the need for staff upskilling. In contrast, not engaging strategically with Generative AI poses risks, including falling behind peers, missed opportunities and failing to ensure our graduates remain employable. The rapid evolution of AI technologies necessitates a proactive and strategic approach if we are to remain relevant.
Biological screening of herbal drugs: Introduction and Need for
Phyto-Pharmacological Screening, New Strategies for evaluating
Natural Products, In vitro evaluation techniques for Antioxidants, Antimicrobial and Anticancer drugs. In vivo evaluation techniques
for Anti-inflammatory, Antiulcer, Anticancer, Wound healing, Antidiabetic, Hepatoprotective, Cardio protective, Diuretics and
Antifertility, Toxicity studies as per OECD guidelines
2024.06.01 Introducing a competency framework for languag learning materials ...Sandy Millin
http://sandymillin.wordpress.com/iateflwebinar2024
Published classroom materials form the basis of syllabuses, drive teacher professional development, and have a potentially huge influence on learners, teachers and education systems. All teachers also create their own materials, whether a few sentences on a blackboard, a highly-structured fully-realised online course, or anything in between. Despite this, the knowledge and skills needed to create effective language learning materials are rarely part of teacher training, and are mostly learnt by trial and error.
Knowledge and skills frameworks, generally called competency frameworks, for ELT teachers, trainers and managers have existed for a few years now. However, until I created one for my MA dissertation, there wasn’t one drawing together what we need to know and do to be able to effectively produce language learning materials.
This webinar will introduce you to my framework, highlighting the key competencies I identified from my research. It will also show how anybody involved in language teaching (any language, not just English!), teacher training, managing schools or developing language learning materials can benefit from using the framework.
Honest Reviews of Tim Han LMA Course Program.pptxtimhan337
Personal development courses are widely available today, with each one promising life-changing outcomes. Tim Han’s Life Mastery Achievers (LMA) Course has drawn a lot of interest. In addition to offering my frank assessment of Success Insider’s LMA Course, this piece examines the course’s effects via a variety of Tim Han LMA course reviews and Success Insider comments.
Operation “Blue Star” is the only event in the history of Independent India where the state went into war with its own people. Even after about 40 years it is not clear if it was culmination of states anger over people of the region, a political game of power or start of dictatorial chapter in the democratic setup.
The people of Punjab felt alienated from main stream due to denial of their just demands during a long democratic struggle since independence. As it happen all over the word, it led to militant struggle with great loss of lives of military, police and civilian personnel. Killing of Indira Gandhi and massacre of innocent Sikhs in Delhi and other India cities was also associated with this movement.
Chapter 8Cost of CapitalAssociated PressLearning O.docx
1. Chapter 8
Cost of Capital
Associated Press
Learning Objectives
A�er studying this chapter, you should be able to:
Show how the discount rate is calculated and used.
Explain how the weighted average cost of capital is calculated,
and outline the significance of its components.
Describe how to es�mate the discount rate for individual
projects and how risk factors into the process.
Processing math: 0%
Ch. 8 Introduction
Chapter 6 described the various capital budge�ng
techniques employed by corporate managers. Among the
techniques, net present value (NPV) emerges as the best
measure
of a project's contribu�on to shareholder wealth. In NPV
analysis, the present value of a project's expected future
cash flows is compared to the ini�al investment, and the
project is accepted if the present value exceeds the ini�al
investment. Calcula�on of NPV requires the analyst to
es�mate cash flows and an appropriate discount rate.
2. Techniques for es�ma�ng cash flows were covered in
Chapter 6. In this chapter, you will learn how to es�mate
the discount rate. The same es�mates of cash flows and
discount rate are also used in internal rate of return
analysis. Used in IRR, the discount rate becomes a hurdle
rate against which to compare the project's IRR.
Processing math: 0%
Financing mix and cash flows for the Pogo harness
project.
8.1 Estimating the Discount Rate
To illustrate the calcula�on and use of the discount rate,
we elaborate on the Chapter 6 example of Pacific
Offshore Ltd. (POL). Recall the NPV of POL's Pogo
harness project
is $9,110, which was found by discoun�ng the project's
net cash flows by 12.5% (the required rate of return). The
project's internal rate of return of 17.2% is greater than
the 12.5% required rate of return on the harness project;
therefore, whether we use NPV or IRR, the harness
project appears to be acceptable because it meets the
respec�ve decision criteria. Had the required return been
20%, for example, the project would have been rejected
using either criterion. Table 8.1 reviews the details of
POL's Pogo harness project from Chapter 6.
Table 8.1: Review of POL's Pogo harness project details
Data Category Value
Project cost $64,384
3. Required rate of return 12.5%
Internal rate of return 17.2%
Net present value $9,110
We have referred to the 12.5% as the harness project's
required rate of return. To be more specific, 12.5% is the
weighted average return demanded by the company's
investors. The weigh�ngs reflect the propor�onal values
of their investments. From Chapter 6, the cost of the
harness project is $64,384, meaning that Paula Bauer must
raise that amount from her investors to fund tools,
equipment, and working capital and to pay the cost of
reconfiguring the plant. Paula has decided to fund future
projects
using the firm's current propor�onal mix of debt and
preferred and common stock. POL's current capital mix is
28% debt, 7.8% preferred stock, and 64.2% common stock.
POL, therefore, will raise about $18,000 in debt and about
$5,000 in preferred stock. The balance of the funding will
come from residual cash flows that belong to the firm's
shareholders. Table 8.2 shows how POL's capital mix will
fund the Pogo harness project. Later, in Sec�on 8.2, we
will show you how Paula came up with these numbers.
Table 8.2: POL's capital mix
Capital component Propor�on Cash Value
Debt 28% $18,028
Preferred stock 7.8% $5,022
Common stock 64.2% $41,334
4. Cash from the harness project will flow to these investors
in order of the priority of their claims: first to
bondholders, then to preferred stockholders, and finally to
common
stockholders. Figure 8.1 illustrates the flow of capital and
cash flows, assuming that the harness project produces its
expected cash flows.
Figure 8.1: Pogo harness project
POL raises capital by selling these securi�es to investors,
who expect to receive a return on their investment. Any
investor purchasing POL's securi�es must expect that the
returns will be at least equal to, and preferably greater
than, the required return on an investment having the
same risk as the harness project. If expected returns were
lower than required, investors would look elsewhere, or
they may be persuaded to buy POL's securi�es at a
discount, which would increase their expected returns.
Thus,
Paula must be confident that the discount rate she uses to
value the project will provide the required return to each
class of POL's investors. This discount rate is known as
the cost of capital for the project because the returns
investors require are the cost, like rent, that is paid for
the use of the capital.
Industrial Policy
Processing math: 0%
Dr. Bruce Sco� argues that the U.S. has a higher cost of
capital than any
5. other country, which influences our economic system.
Many companies are
harves�ng their businesses, allowing their market share to
decline. Do you
agree with Dr. Sco�? If so, how would this impact your
decision-making as a
financial manager?
Processing math: 0%
Cost of capital includes the rent a company pays in order
to use its
capital. What other expenses could be included in cost of
capital?
Associated Press
8.2 The Weighted Average Cost of Capital
The cost of capital is a weighted average of the required
returns for each capital source. In this sec�on, we will
show you how to calculate the weighted average cost of
capital and its components.
Calculating the Weighted Average Cost of Capital
For the Pogo harness project, the weighted average cost of
capital (WACC) is the a�er-tax required returns
(interest on bonds or other types of debt is tax
deduc�ble; thus, it lowers the effec�ve cost of debt to
the
firm) on POL's bonds, preferred stock, and common
6. equity, weighted by their propor�onal contribu�on to the
project. As you can see in Table 8.3, of the $64,384
being raised, the bondholders contribute $18,028 (28%),
the preferred stockholders contribute $5,022 (7.8%), and
the common stockholders contribute the remaining
$41,334 (64.2%) in residual cash flows.
Later we will explain how Paula es�mated the costs of
debt, preferred stock, and common equity. First, though,
we present her worksheet for compu�ng POL's cost of
capital. Table 8.3 shows that she mul�plied the
propor�on of each capital source by its a�er-tax required
return. She then summed these results to arrive at
the 12.5% cost of capital (or the project's required rate of
return).
Table 8.3: Worksheet for compu�ng POL's cost of capital
Capital component A
Targeted propor�on
or weight
B
Project cost
A × B
Dollars raised
D
A�er-tax
required returns
A × D
Weighted Average
Debt (bonds) 28% $64,384 $18,028 6.93% 1.94%
7. Preferred stock 7.8% $64,384 $5,032 11.96% 0.93%
Common equity 64.2% $64,384 $41,334 15% 9.63%
Total 100% $64,384 12.5%
Paula's worksheet may be summarized by a formula for
the weighted average cost of capital.
(8.1) WACC = (Wd)(a�er-tax cost of debt) + (Wpfd)(cost
of preferred stock) + (We)(cost of common equity)
where
Wd = the desired propor�on of financing provided by
debt
Wpfd = the desired propor�on of financing provided by
preferred stock
We = the desired propor�on of financing provided by
common equity
This formula is adaptable to any combina�on of financing
sources. For example, if preferred stock were not used,
then Wpfd = 0, and preferred stock would drop out of the
formula. Some companies borrow from many sources, and
they may have several bond issues and perhaps long-term
loans from banks or insurance companies. The only
source of capital that is common to all companies is
common equity. The WACC formula for a company with
no preferred stock, but with two types of debt, might
look like
this:
8. (8.2) WACC = (WB)(a�er-tax cost of bonds) + (WL)(a�er-
tax cost of loan) + (We)(cost of
equity)
No ma�er how many sources of capital there are, the
weights always sum to 1 (WB + WL + We = 1). This
ensures that all capital sources have been included in the
calcula�on of WACC.
Discoun�ng expected cash flows by the weighted average
cost of capital gives Paula the informa�on she needs to
make her investment decision on the Pogo harness project.
If the NPV = 0, then the project should provide all
investors with their required returns but with nothing more.
This is the minimally acceptable outcome. The harness
project
is expected to do be�er than that, meaning that it should
add value because its NPV is $9,110.
To summarize, discoun�ng project cash flows at the
WACC ensures that the minimal needs of each class of
investor are met. The WACC is the appropriate discount
rate for
the harness project if its risk is similar to that of the
en�re company, and it is being financed with a mix of
debt and equity similar to that of the company's financing.
We may rewrite the NPV and IRR equa�ons from Chapter
6 to include WACC.
Recall Equa�on (6.1), the NPV equa�on, from Chapter 6:
where
Processing math: 0%
9. II = ini�al investment
OCFt = opera�ng cash flows in year t
TCF = terminal cash flows
t = year
n = life span of the project (in years)
r = required rate of return
Rewri�en to include WACC, the NPV equa�on becomes
where
CFt = total net cash flow for period t
The company should accept projects with NPV > 0.
Rewri�en to accommodate WACC, the IRR equa�on
becomes
The company should accept projects with IRR > WACC
because such projects have expected returns (IRRs) greater
than the investor's required return (WACC).
Next, we explain how Paula es�mated the cost of each
capital component.
The Cost of Debt
The cost of debt, or Kd, is the current yield to maturity
10. on the company's bonds or other long-term debt securi�es.
Cost of debt = Yield to maturity
or
Kd = YTM
YTM reflects current credit market condi�ons and
investors' expecta�ons, and therefore it is the best
indicator of returns investors require on the sale of new
bonds. Recall
from Chapter 4 that YTM is the discount rate applied to
the expected cash flows from a bond. This discount rate
is the cost of debt for the project.
Let's assume the current market price of POL's bonds is
$1,003. The bonds mature in 6 years, bear a 9.5% coupon
rate, make coupon payments semiannually, and their par
value is $1,000. Given this informa�on, Kd is found by
solving for YTM in the following equa�on, which sets
the price of the bonds equal to the present value of
future cash
flows. We may think of the YTM as the internal rate of
return of a bond.
Note that each coupon payment, $47.50, equals one-half of
the coupon rate (9.5%) �mes par value ($1,000) because
the bond pays coupons semiannually [(0.095)($1,000)/2
= $47.50]. There are 12 payments because the bonds
mature in 6 years and pay interest twice per year
(semiannually). Similar to IRR, a financial calculator or
computer will
be needed to solve for YTM, but we will save you the
work on this equa�on: The YTM on these bonds equals
11. 4.72% semiannually, or 9.44% on an annual basis.
Because interest on debt is tax deduc�ble, the YTM must
be adjusted for the tax effect. The tax deduc�on lowers
the effec�ve cost of debt to the company. We adjust
YTM
for taxes by mul�plying YTM by (1 – t), where t is the
firm's marginal tax rate. Subs�tu�ng Kd for YTM gives
us Equa�on (8.6):
The Cost of Preferred Stock
As you recall from Chapter 4, preferred stock combines
features of debt and equity. Preferred dividends are fixed,
like bond interest, but also have an infinite life, like
common stock dividends. We recognize this as a
perpetuity (a perpetual annuity), which greatly simplifies
the calcula�on. The cost of preferred stock, or Kpfd,
equals its
required rate of return, which is its annual dividend
divided by its current market price.
Cost of preferred stock = Required rate of return =
Annual dividend /Current market price
Again, let's assume the dividend on POL's preferred stock
is $2.50 and its current market price is $21.50 per share.
As Equa�on (8.7) shows, the required return on the stock
is 11.63%.
No tax adjustment is necessary for preferred stock because
dividends are paid with a�er-tax cash flows.
The Cost of Common Equity, Ke
12. The cost of common equity, or Ke, is the most difficult of
the component costs to es�mate. Chapter 7 presented the
capital asset pricing model (CAPM) as one means of
es�ma�ng investors' required return for risky assets.
Although this risk-return model is the most frequently
used method for es�ma�ng returns to common stock,
other
models may also be used, most notably the discounted
cash flow model introduced in Chapter 4. As a general
rule, the analyst should approach the problem of
es�ma�ngProcessing math: 0%
Websites like Yahoo! are useful for obtaining beta
informa�on.
What benefit is there to obtaining the informa�on this
way versus
calcula�ng it yourself?
Associated Press
common stock returns from several direc�ons and hope to
generate a consensus es�mate from these varying
approaches. Here, we will cover three approaches: CAPM,
the
discounted cash flow model, and the equity-debt risk
premium.
The CAPM Approach to Ke
Chapter 7 built on por�olio theory to show the
rela�onship between required returns on investments and
their market risk. The CAPM states that the required
13. return on a
risky investment equals the risk-free rate plus the product
of the asset's beta and the market risk premium.
Required return on risky investment = Risk-free rate +
Asset's beta
(Market risk premium)
Represented as an equa�on, the CAPM is
where
R(r)i = required return for asset i
Rf = risk-free rate of return
βi = beta of asset i
Now, let's look at the individual components of the
equa�on to find the informa�on needed to solve the
CAPM.
First, we examine the risk-free return. Although no asset
is totally free of risk, U.S. government T-bonds are
considered nearly riskless. Thus, T-bonds are a widely
used proxy for the true risk-free rate. T-bond returns are
widely available in print and on the Web.
Next, we need an es�mate of the equity beta. Brokerage
and other investment service firms es�mate betas for
many publicly traded stocks. Betas may be obtained on
the Web and in print from Value Line, Standard &
Poor's, Yahoo!, and Bloomberg. As we saw in Chapter 7,
we may also es�mate beta ourselves using data on
past returns.
14. In place of market risk premium, we use the historical
market risk premium. This is found by calcula�ng the
average amount by which the market return has exceeded
T-bond returns. For example, the difference between
the S&P 500 return and the T-bond return for years 1931
through 2011 could be averaged and used as the
historical market risk premium. In that 80-year period, the
market risk premium has averaged about 7.6% per
year (Damodaran, 2011). There are many other es�mates
of the markets risk premium (or equity risk
premium). For more informa�on, please see the Web
Resources sec�on at the end of the chapter.
For POL, Paula gathered es�mates for the risk-free return,
POL's beta, and the market risk premium. These can be
found in Table 8.4.
Table 8.4: POL's cost of equity es�mates using the
CAPM
CAPM component Value
Risk-free return (T-bonds) rf = 5%
BetaPOL (from POL's investment banker) βPOL = 1.2
Market risk premium (historical equity market risk
premium) 7.6%
If we plug these numbers into Equa�on (8.8), Paula's
CAPM es�mate is
R(r)POL = rf + βPOL[market risk premium]
= 5% + 1.2(7.6%)
15. = 14.12%
The CAPM approach is the most popular among companies
for determining their cost of equity.
The Discounted Cash Flow Approach to Ke
In Chapter 4, the constant dividend growth model for
valuing common stock was introduced. To find the cost of
equity, we use a form of that constant growth formula.
where
P0 = today's price of the stock
Ke = the required return on equity, also known as the
cost of equityProcessing math: 0%
gn = the normal, constant growth rate of dividends
D1 = the next dividend that the firm is expected to pay
The current price equals next year's dividend divided by
the difference between equity's required return and the
long-run dividend growth rate.
This equa�on may also be adapted to allow us to solve
for Ke:
The dividend growth model for es�ma�ng the required
return on common stock reflects the discounted cash flow
approach to valua�on, as do the YTM for debt and the
preferred stock perpetuity model.
16. This approach requires a current market price, an es�mate
of next year's dividend per share, and an es�mate of the
long-run dividend growth rate. Prices for traded firms'
stock are easily obtained. Value Line and many brokerage
firms forecast dividends and dividend growth rates for
large and ac�vely traded companies. For smaller
companies,
such as POL, published forecasts are generally not
available, so we must rely on our own resources.
Forecasts should begin by looking at a company's dividend
history. If we
have enough data, we can calculate historical growth rates.
The historical growth rate is the compound rate that
equates a dividend paid several years ago with a recent
dividend payment. This process is nothing more than an
applica�on of the future value of a single cash flow
formula, as given in Chapter 3.
FVn = PV0 (1 + r)
n
where
FVn = the future value at the end of n �me periods
PV0 = the present value of the cash flow
r = the periodic interest rate
The difference is that rather than looking forward, we are
looking back. To use the model, we must change the
defini�on of its components. FVn becomes the most
recent
dividend, D0. PV0 becomes the beginning historical
dividend, D–n ("–n" refers to n periods in the past).
17. Finally, the rate of return, r, becomes the compound
growth rate, gn.
Equa�on (8.11) shows us what the new formula looks
like:
where
D0 = the most recent dividend
D–n = the beginning historical dividend
gn = the compound growth rate
Fortunately, POL has paid a dividend for five years, so
we are able to calculate a growth rate. The dividend five
years ago (D–5,) was $0.60 and the most recent dividend
(D0)
was $0.84. Now, let's solve for gn.
Now that we have solved for the compound growth rate,
we can plug it into the constant growth formula. The
current market price of POL's common stock is $11.25.
Next
year's dividend, D1, should equal D0 (1 + gn). D1 =
$0.84(1.07) = $0.90. Now, we may solve for Ke.
Having es�mated Ke using the constant growth formula,
we must remember that this formula assumes a constant
growth rate into perpetuity. Therefore, this method may
not be appropriate for firms whose growth is unstable or
unsustainable. Cyclical firms, such as lumber companies,
o�en have earnings that fluctuate drama�cally with the
business cycle. Excep�onally high ini�al growth rates of
18. start-up companies will eventually fall to more sustainable
levels as the industry matures. For these types of firms,
the constant growth assump�on is quite difficult to apply.
In prac�ce, companies appear to favor the CAPM
approach to the discounted cash flow approach for
determining
their cost of equity.
The Equity-Debt Risk Premium Approach to Ke
The final method for es�ma�ng the cost of equity is to
add a risk premium to the cost of debt. Because equity is
a residual claim with a lower priority than debt, equity is
riskier than debt; therefore, investors require that Ke
exceed Kd. The difference between Ke and Kd is the equity-
debt risk premium.
The risk premium, RP, is generally in the range of 3% to
6%. The method is ad hoc but works fairly well as a
benchmark because the necessary data are easily obtained.
Es�mates of Ke, using CAPM and discounted cash flow
models, that fall outside the range [Kd + (3% to 6%)]
should prompt the analyst to revisit her es�mates. For
POL, the
equity-debt risk premium approach yields the following
range for Ke.
(Kd + 3%) < Ke < (Kd + 6%)
(9.4% + 3%) < Ke < (9.4% + 6%)
12.4% < Ke < 15.4%Processing math: 0%
19. Facebook is one of many promising companies that
venture capital
firms invested in. Do you think venture capital is a
beneficial way
for small companies to obtain the capital they need?
Associated Press
Recall that Paula's es�mates of Ke using the CAPM were
14.12%, and her discounted cash flow method produced a
15% cost of equity. Those es�mates are within the range
prescribed by the equity-debt risk premium, which more or
less confirms Paula's es�mates. Weighing the results of
the three approaches to es�ma�ng Ke, Paula elected 15%
as POL's cost of equity. As with preferred stock, no tax
adjustment is necessary because dividends are not a tax-
deductable expense.
The Cost of Selling Securities
The cost of capital reflects returns required by investors
who are supplying capital to the firm. These returns
reflect the amount the investors paid for their respec�ve
securi�es. However, when a company raises funds by
selling securi�es, it usually employs a company to assist
it in marke�ng its securi�es. Companies that specialize in
selling new securi�es issues, called investment banks, take
a cut for marke�ng and underwri�ng the issue. A
securi�es issue is underwri�en when the investment bank
buys
securi�es from the company and resells them to investors
for a higher price. The difference between the price paid
to the company and the sale price is called the
20. underwri�ng spread. Of course, the sale price must
approximate the security's market value. For example, let's
assume that POL is selling bonds to pay for the harness
project. Investors will buy the bonds for their current
market price, $1,003. However, the underwri�ng spread
reduces POL's proceeds from the bond sale and raises
POL's
effec�ve cost of debt above the 9.44% YTM.
Costs associated with selling securi�es are called flota�on
costs. Aside from the underwri�ng spread, flota�on
costs include fees paid to the investment banker for
consulta�on, document prepara�on, and so on. They also
include costs of filing with regulators such as the
Securi�es and Exchange Commission, as well as legal and
accoun�ng fees. Here is a list of common features of
flota�on costs:
They make up a greater percentage of the value of the securi�es
issues for equity than those for debt,
reflec�ng the increased risk of underwri�ng stocks.
They are propor�onally greater for issues of small dollar value.
There are significant scale economies to securi�es issues.
Some fees and other costs are rela�vely fixed.
With the high cost of issuing securi�es for smaller
companies, it would seem that small firms might have a
tough �me raising outside capital. Historically, this has
been the case with small firms having to rely largely on
private sources of capital. However, the rapid development
and dissemina�on of technology, and the
deregula�on of financial services, of transporta�on, and of
telecommunica�ons have bolstered entrepreneurial
ac�vity in the United States, crea�ng new investment
opportuni�es. As evidence, venture capital firms have
sprung up by the hundreds to supply early financing to
21. promising companies. One such company was
Facebook, which went public in May of 2012.
Unfortunately, the IPO was something of a flop for
investors,
though the investment bankers reportedly made over $170
million of fees plus possibly another $100 million trading
the shares the first weeks a�er the IPO
(venturebeat.com, 2012)!
Flota�on costs siphon money from the securi�es issue,
raising the effec�ve cost of capital. Therefore, the cost to
the company is greater than the return to the investor.
This
means that the cost of each component must be adjusted
to reflect flota�on costs. Net proceeds to the company
equal the sale price to the investors minus flota�on costs.
Net proceeds to company = Sale price – Flota�on costs
or
Virtually all financing with bonds and preferred stock
represents new issues and therefore includes flota�on
costs. Common equity financing may be done through
stock
sales, but more o�en it comes from retained earnings,
which carry no flota�on costs. In the case of POL, the
company is selling bonds and preferred stock to finance
the
harness project. Common equity financing comes from
retained earnings. POL's investment banker es�mates that
flota�on costs will be $20 for every bond sold and $0.60
for
each share of preferred stock. Paula adjusts the cost of
debt and preferred stock to reflect these flota�on costs.
Let's look at each of these in turn.
22. Adjus�ng cost of POL's debt (bonds) to reflect flota�on
costs:
Based on the Pnet of $983, we recalculate YTM:
Now we have calculated four numbers masquerading as the
cost of debt for POL. Table 8.5 shows costs before and
a�er the tax adjustment, and with and without flota�on
costs.
Table 8.5: POL's cost of debt es�mates before and a�er
flota�on costs
Floata�on costs Before tax A�er tax
Excluded 9.44% 6.61%
Included 9.88% 6.93%
As Table 8.5 shows, the actual YTM of the bonds is
9.44%, but a�er adjus�ng for taxes and flota�on, the
cost of debt to POL is 6.93%. The tax savings reduces
the cost of
debt, but flota�on costs take back some of that savings.
Now, let's look at preferred stock.
Adjus�ng cost of POL's preferred stock to reflect
flota�on costs:
Because there are no flota�on costs associated with
retained earnings, POL's cost of common equity remains at
15%.
Processing math: 0%
23. Kre tearn = 15%
For the record, the following equa�on shows how
flota�on costs would affect the cost of a new stock issue.
The effect of flota�on cost is most easily illustrated with
the
constant dividend growth model. As with the preferred
stock adjustment, we reduce the stock price by the amount
of the flota�on costs, which raises the cost of equity to
the company.
where
Pnet = P – (flota�on costs)
Note that POL's a�er-tax cost of debt (6.93%), the cost
of preferred (11.96%), and the cost of equity (15%) are
the component costs that Paula used in her WACC
worksheet,
Table 8.3. Using Equa�on (8.1), she mul�plied these
component costs by their desired propor�ons to derive the
WACC. Next, we describe how Paula selected the mix
outlined in Table 8.2 of common equity, preferred stock,
and bonds to finance the harness project.
The Financing Mix and Weights in the WACC
The financing mix is called capital structure. Capital refers
to long-term financing, such as that used to fund POL's
Pogo harness project. Determining the best capital
structure for a company raises some rather complicated
issues, which we leave for Chapter 9.
The weights in the WACC formula could reflect any
target or desired financing mix. Paula has chosen to
24. finance the harness project using POL's current mix of
capital: 28%
debt, 7.8% preferred stock, and 64.2% common stock.
Generally, firms that are sa�sfied with their current
capital mix will a�empt to maintain those propor�ons.
The exis�ng mix of capital can be determined by
examining the right-hand side of the financial balance
sheet. Recall that the financial balance sheet reflects
market values,
unlike the accoun�ng balance sheet's book values. Current
market values are certainly closer to actual values than
are historical accoun�ng values. A company's common
stock with a book value of $5 may have a current market
value of $100. If it decides to sell stock to finance an
investment, it will surely not sell new shares for $5.
Paula determined the current financing mix by es�ma�ng
the market values for each of POL's capital sources. First,
she obtained the current prices for the company's bonds,
preferred stock, and common stock. Next, she mul�plied
these prices by the number of bonds or shares of stock
outstanding to compute the market value of each
component. Summing these market values gave her the
total market value of POL's capital. These calcula�ons are
shown in Table 8.6.
Table 8.6: Calcula�ng market weigh�ngs of each capital
source
Capital component Price/unit Number outstanding Total
market value of
component
Propor�on
25. Debt (bonds) $1,003.00 1,537 $1,541,611 28%
Preferred stock $21.50 20,068 $431,462 7.8%
Equity (retained cash) $11.25 313,867 $3,531,004 64.2%
Total $5,504,077 100%
Paula calculated the propor�on for each component by
dividing its market value by the total market value of
capital, $5,504,077.
Paula intends to finance the harness project using capital
from these three sources in these propor�ons. As we saw
in Table 8.3, the WACC for the harness project is 12.5%.
We may confirm this with the WACC formula:
Glancing at Equa�on (8.16), you may wonder why Paula
doesn't finance the en�re project with debt and discount it
at the a�er tax cost of debt. The a�er-tax cost of debt
is
only (9.9%) (1 – 0.30) = 6.93%. Discoun�ng at 6.93%
rather than 12.5% would certainly raise the harness
project's NPV. The problem with this scheme is that POL
must
maintain some balance between debt and equity. If debt
were used this year, equity may have to be used next
year to achieve the desired balance. If POL financed next
year's project with equity, then to be consistent, it would
discount that project at the 15% cost of equity. In this
case, projects considered in years when debt financing is
used have a great advantage over those being evaluated in
years when equity financing is used. More projects would
be rejected, for example, in equity-financed years even
though they may actually be superior projects if all
projects were consistently evaluated. This illustrates why it
26. is important to discount all projects at the cost of capital
and
not at the cost of debt one �me and the cost of equity
the next �me, regardless of how a par�cular project is
financed. We separate the investment decision from the
financing decision; that is, we evaluate investment
decisions like the Pogo harness project using the long-term
mix of debt and equity that we expect over the project's
life,
not the specific type of securi�es (debt, preferred stock,
or common stock) that were most recently issued.
WACC reflects the firm's long-term capital mix. A firm
that finances a project with either debt or equity will
temporarily unbalance its capital structure and, we can
assume,
will a�empt to rebalance it the next �me around. Firms
o�en unbalance their capital structure temporarily to take
advantage of scale economies of large securi�es issues. In
reality, POL would never fund such a small project by
selling both preferred stock and bonds because flota�on
costs would be prohibi�ve. This project would probably
be
funded en�rely from retained earnings, meaning that POL
would temporarily unbalance its capital structure.
Field Trip: Cost of Capital Data
Ibbotson provides financial data for commercial and
academic use.
Visit the Ibbotson Cost of Capital Resources Center:
h�p://corporate.morningstar.com/ib/asp/subject.aspx?xmlfile=5
532.xml
(h�p://corporate.morningstar.com/ib/asp/subject.aspx?xmlfile=
5532.xml)Processing math: 0%
27. http://corporate.morningstar.com/ib/asp/subject.aspx?xmlfile=5
532.xml
and the Ibbotson Cost of Capital Yearbook:
h�p://corporate.morningstar.com/ib/asp/subject.aspx?xmlfile=1
420.xml
(h�p://corporate.morningstar.com/ib/asp/subject.aspx?xmlfile=
1420.xml)
Reflec�on Ques�ons
1. Why do you think clients would be willing to pay for this
informa�on? What might they use it for?
2. Look at the module overviews on the Cost of Capital
Resources Center. Is there more focus on cost of debt or cost of
equity? Why do you think this is?
Processing math: 0%
http://corporate.morningstar.com/ib/asp/subject.aspx?xmlfile=1
420.xml
Project and company risk can differ significantly. Do you
think a
Campbell's Soup cafe would be a successful venture for
the
company?
Associated Press
8.3 Estimating the Discount Rate for Individual Projects
28. For many projects, the appropriate discount rate to use in
the NPV calcula�on is the firm's WACC, as outlined in
the previous sec�on. However, there are circumstances in
which WACC is not the appropriate discount rate. Every
company is risky, and this risk is reflected in its WACC.
Investors in a par�cularly risky company demand higher
returns on their securi�es, which increases the company's
WACC. In project analysis, we are actually interested in
the risk of the par�cular project rather than the company
as a whole, and we would like the discount rate to
reflect the risk of the project. When we discount a
project by the company's WACC, we implicitly assume
that project risk
and company risk are iden�cal. If they are not, then we
should adjust the project discount rate up or down
accordingly. For example, if a company increases its risk
by
inves�ng in high-risk projects, investors expect a higher
return; therefore, these risky projects should carry a higher
discount rate.
In POL's case, Paula believes that the Pogo harness
project has the same risk as the company's exis�ng
business. Paula reasons that the harness is simply another
product to
add to POL's exis�ng line of hardware and sailing gear.
Therefore, the business risk of the Pogo harness project is
essen�ally iden�cal to that of the company's exis�ng
products. Of course, she understands that there are
uncertain�es in producing a new product, but no more
than in the normal course of extending and upgrading an
exis�ng
line of products. Paula also realizes that the relevant risk
for es�ma�ng required returns is the market-wide or
nondiversifiable risks of the business (as discussed in
Chapter
29. 7). The new harness is probably about as sensi�ve to
market-wide forces as are POL's current products. All are
sensi�ve to economic recession (in which case sales of
discre�onary products will decline), changing tastes,
changes in tax codes, and so on.
Why a Project's Risk May Differ From the Company's Overall
Risk
While the harness fits neatly into POL's exis�ng product
line, there are many occasions when this is not the
case. In such instances, we must es�mate a discount rate
that reflects the project's risk. Here, we explain why
differences in risk might arise and how discount rates for
individual projects might be es�mated. Consider
Campbell Soup. The company has a dominant posi�on in
its industry and produces a product for which there is
fairly constant demand. Thus, we would expect that
Campbell Soup has average or slightly below-average risk.
Now suppose that Campbell's managers propose two
hypothe�cal projects. The first is a tomato soup with a
spicy Mexican taste. The second proposal is to start a
chain of small soup cafes—tenta�vely called "17 Flavors
Soup Cafes." The cafes would feature 17 flavors (hence
the name) of Campbell's soups ready for immediate
serving.
Do these two proposals have the same risk? Let's consider
them both individually. The spicy Mexican soup is a
standard Campbell's product. Campbell Soup has enormous
experience evalua�ng, producing, marke�ng, and
distribu�ng such products. By contrast, a chain of fast-
food restaurants differs markedly from any of Campbell's
other businesses. The fast-food industry is very
compe��ve, with several dominant chains vying for
market
30. share. Campbell's managers have li�le experience in this
industry. Also, the two projects will probably respond
differently to economy-wide risk factors. For example, in
a recession individuals tend to eat out less but may
consume more canned soup at home.
Campbell's managers may reasonably conclude that the new
soup flavor project should be discounted at the company's
WACC. The new soup is analogous to POL's Pogo
harness project. On the other hand, Campbell's managers
would judge that the soup cafes add risk to company, and
therefore should take a higher discount rate.
Estimating a Risk-Adjusted Discount Rate for NPV Analysis
Chapter 7 introduced the capital asset pricing model and
the idea that the capital markets price only market risk.
This follows from the no�on that unique risk is generally
absent from well-diversified por�olios. Projects also
contain mostly market risk; therefore, we may use the
CAPM to determine a project's discount rate.
(8.17) Required return on a project = Risk-free rate +
Project beta (Market risk premium)
The project beta, commonly called an asset beta, is not
the same as the common stock beta. As introduced in
Chapter 7, asset beta measures the project's market risk.
Next,
we discuss how to es�mate a beta that is appropriate for
evalua�ng the Campbell Soup "17 Flavors Soup Cafes"
ini�a�ve.
Estimating a Project's Beta
Recall from Chapter 7 that beta is a measure of the
31. extent to which the returns on a stock move with changes
in the returns of a market por�olio, such as the S&P
500. One
widely used technique for es�ma�ng a project's cost of
capital is the pure-play method. A pure-play is a publicly
traded firm that engages primarily in the same line of
business as the project being considered. If the pure-play
firm has close to the same financing mix as the project,
then the beta of this pure-play's assets may then be found
and used as a proxy for the project's beta. The pure-
play's beta can be used as the beta in the CAPM to
es�mate the appropriate risk-adjusted discount rate (RADR)
for the
project.
Iden�fying a publicly traded pure-play firm is seldom
easy. For the soup cafes, Campbell's managers may begin
with small chains of specialized fast-food restaurants.
Another
chain of soup cafes would be ideal, but what if none
exist? We would then look to other small chain
restaurants that fit the profile. Wendy's would likely be a
be�er proxy
than McDonald's because of size. Perhaps Baskin-Robbins
would be be�er yet: Baskin-Robbins is not too large, and
has a specialized menu, and ice cream is somewhat
seasonal, as is soup. Ideally, several publicly traded pure-
play firms would be iden�fied.
Aside from iden�fying appropriate business lines for the
pure-play firms, Campbell's managers must also consider
their capital mix. We said that to use the pure-play
company's beta directly, the pure-play's risk and financing
must be close to that of the project. Financing is an issue
because the equity betas of companies with the same
business risk (same asset beta) will differ according to
32. how much debt each company has. The more debt a
company has, the higher the equity beta will be. The
intui�on
behind this result (more debt, higher beta, all else being
equal) is that the risk of the assets is fixed, so as low-
risk debt replaces equity in a company's financing mix
that
Processing math: 0%
asset risk has to go somewhere. If the debt is safe
because of priority payments and contractual obliga�ons,
then the equity absorbs more and more of the risk
producing a
higher beta.
To avoid the effect of leverage on beta, the best choice
for a pure-play comparison firm is an all equity-financed
firm. The beta of an all equity-financed firm is iden�cal
to its
asset beta. If a pure-play can be found with no debt, the
project's required return may be es�mated directly using
the CAPM. The project's required return could then be
used as the discount rate for NPV or as the hurdle rate
for IRR. Suppose, for example, there exists a chain of
soup cafes that is all equity financed, and the beta for
this
company is 1.3. This beta may then be transferred to
Campbell's cafe project, and a RADR could then be
es�mated.
We will assume rf = 4% and the market risk premium is
9%
33. If the capital structure of the pure-play firm includes
debt, we may es�mate the asset beta using the Hamada
(1972) equa�on:
where
βequity = beta of the pure-play's common stock
t = the pure-play's tax rate
D/E = ra�o of the firm's debt to equity, both at market
value
If we find a pure-play with debt of $1 million and equity
worth $2 million, a tax rate of 30%, and βequity equal to
1.5, we can es�mate its asset beta as follows:
This beta could then be plugged into Equa�on (8.18) and
used to es�mate the project's appropriate discount rate.
RADR = 4% + 1.11(9%) = 13.99% or 14%
Of course, for many projects a pure-play cannot be found.
The methods for es�ma�ng the RADR under such
circumstances range from ad hoc techniques (like adding
or
subtrac�ng a few percentage points to the firm's exis�ng
WACC) to developing betas based on accoun�ng
informa�on. Ad hoc es�mates require careful judgment on
the part
of the analyst. Should Campbell Soup, for example, add
2% to its current WACC to reflect the added risk of the
cafes, or should it add 5%? Other new projects may be
perceived as being less risky than exis�ng lines of
business, so a few percentage points would be subtracted
from the current WACC. The difficul�es encountered
34. using this
method are obvious, but at �mes there is no choice.
Accoun�ng betas are found by measuring the co-movement
of an accoun�ng-based standard of performance for a
pure-
play firm with a benchmark performance standard from a
broad sample of other firms. This technique is beyond the
scope of this text but is useful when a pure-play firm
does not have publicly traded stock.
Ideally, each project will have its own discount rate
reflec�ng its risk. In prac�ce, large companies use
divisional hurdle rates, so that, for example, projects in a
home
appliances division carry a different RADR than do
projects in broadcas�ng division.
Use and Misuse of Risk-Adjusted Discount Rates
The risk-adjusted discount rate calcula�on depends on
iden�fying pure-play companies. Because such companies
are illusory, the calcula�on is subject to second-guessing
and cri�cism, especially by those units in the company
that are assigned a high RADR. Unit managers may cry
foul and claim that the calcula�on is unreliable and
discriminatory. The only defense against such charges is
to make explicit the assump�ons and calcula�ons used to
generate the RADR. Although the process is inevitably
flawed, it must be shown to be as free of bias as
possible. Top managers may also use arbitrary RADRs as
a pretext for altering the alloca�on of resources within
the
company. In this case, the distrust of the technique by
unit managers is fully jus�fied.
Cri�cal Thinking Ques�ons
35. 1. Why do you think managers con�nue to use RADR, despite
its flaws?
2. What kind of informa�on would you include in your defense
of a high RADR?
Processing math: 0%
Ch. 8 Conclusion
Choosing the correct rate at which to discount project
cash flows is crucial to valuing a capital project. The
discount rate is the weighted average of the required
return for
each class of investor. The principal investor classes are
the bondholders, preferred stockholders, and common
stockholders. Each of these investor classes contributes
capital
to the firm as a whole, rather than to individual projects,
and each is compensated for the risk that it incurs by
inves�ng in the firm. The discount rate that provides each
investor class with its required rate of return is the
weighted average cost of capital (WACC).
The WACC is the appropriate discount rate for a project
whose risk is equal to that of the firm as a whole.
However, the cash flows of projects that increase firm
risk—and,
therefore, the risk of its investors—should be discounted
at a rate greater than the WACC. In the same way, cash
flows of projects that reduce firm risk should be
discounted
at a rate less than the WACC. The rate that reflects
project-specific risk is the risk-adjusted discount rate
36. (RADR).
Processing math: 0%
Ch. 8 Learning Resources
Key Ideas
The required return on an investment is the weighted average of
the returns demanded by the company's investors.
The basic discount rate for capital investments is the company's
cost of capital.
The weighted average cost of capital (WACC) is the weighted
average of the required returns for each capital source.
Weigh�ngs are the propor�onal contribu�ons from
each capital source.
Discoun�ng project cash flows by the WACC means that
projects will be accepted only if they are expected to provide at
least the required returns to all investors.
The cost of debt is the yield to maturity (YTM) on the
company's bonds or other long-term debt securi�es.
The cost of preferred stock is its annual dividend divided by its
current market price.
The cost of common equity may be es�mated using the CAPM,
a discounted cash flow (dividend growth) model, or an equity-
debt risk premium.
The difference between returns to equity and returns to debt is
the equity-debt risk premium.
Investment banks assist companies in marke�ng new securi�es
offerings. When an investment bank buys securi�es from the
issuing company and resells them to investors,
it is underwri�ng the securi�es offering. The difference
between the price paid to the company and sale price to
investors is the underwri�ng spread.
37. Venture capital firms supply high-risk capital to small firms
prior to an ini�al public offering of stock.
Capital structure is the mix of debt, preferred equity, and
common equity. Short-term financing is excluded. When
possible, the propor�ons of each component in the
capital structure should be calculated using market rather than
book weights.
A project should be discounted at the WACC, rather than at the
costs of individual capital components, regardless of how the
project is financed. WACC is the appropriate
discount rate for projects whose risk is about equal to the risk
of the company as a whole.
A pure-play is a publicly traded firm that engages primarily in
the same line of business as the project being considered. The
Hamada equa�on may be used to convert the
equity beta of a pure-play firm into an asset beta.
The risk-adjusted discount rate (RADR) applies to projects
whose risk is substan�ally different from company risk.
Key Equa�ons
Cri�cal Thinking Ques�ons
1. A fellow student comments that if a project has an NPV equal
to zero, then the project will generate no cash flows for the
common stockholders. You argue that it will
produce such cash flows. What is your argument? (By the way,
you are correct. It will produce cash for the common
stockholders.)
2. Accoun�ng balance sheets reflect the book values of claims,
based on the historical contribu�ons of capital suppliers.
Suppose a firm raised its ini�al capital 10 years ago, and
its accoun�ng statements currently reflect a capital mix of half
debt and half equity. No more debt has been issued since the
original bonds were sold. Interest rates have not
38. changed, but the firm has been excep�onally successful.
a. Do you think common stockholders would be willing to sell
their stock today for its book value?
b. Interest rates have not changed, but the firm's bonds are
selling at a premium, above their book values. Why?
c. If the firm has been wildly successful, and given your
answers to parts (a) and (b), what do you think has happened to
the total market value of the firm? Is it above or
below its total book value?
d. How do you think the firm's capital mix, based on market
values, compares to the 50–50 mix reflected on the accoun�ng
balance sheet?
3. Explain why (1 – t) does not appear in the cost of preferred
and the cost of common equity formulas.
4. Suppose a firm uses all equity financing, but half that
financing is internal equity and half is external equity.
a. Name the capital components for the firm.
b. What will be the weights for each component?
c. Write the firm's WACC formula.
5. A project with an NPV = 0 provides all corporate investors
with their required return; therefore all investors are sa�sfied.
Do you agree or disagree with this statement?
Explain.
6. There are three methods of es�ma�ng the cost of corporate
equity. Name or briefly describe these methods.
Key Terms
Click on each key term to see the defini�on.
39. SLIDE 1 OF 13
Processing math: 0%
asset beta
(h�p://content.thuzelearning.com/books/AUBUS650.13.1/sec�o
ns/front_ma�er/books/AUBUS650.13.1/sec�ons/front_ma�er/b
ooks/AUBUS650.13.1/sec�ons/front_ma�er/books/AUBUS650.
13.1/sec�ons/fro
Refers to the systema�c or market risk of an investment
asset.
capital structure
(h�p://content.thuzelearning.com/books/AUBUS650.13.1/sec�o
ns/front_ma�er/books/AUBUS650.13.1/sec�ons/front_ma�er/b
ooks/AUBUS650.13.1/sec�ons/front_ma�er/books/AUBUS650.
13.1/sec�ons/fro
The mix of debt and preferred equity in a company's
por�olio.
cost of capital
(h�p://content.thuzelearning.com/books/AUBUS650.13.1/sec�o
ns/front_ma�er/books/AUBUS650.13.1/sec�ons/front_ma�er/b
ooks/AUBUS650.13.1/sec�ons/front_ma�er/books/AUBUS650.
13.1/sec�ons/fro
The rate of return that must be earned in order to sa�sfy
investors.
cost of common equity
(h�p://content.thuzelearning.com/books/AUBUS650.13.1/sec�o
ns/front_ma�er/books/AUBUS650.13.1/sec�ons/front_ma�er/b
40. ooks/AUBUS650.13.1/sec�ons/front_ma�er/books/AUBUS650.
13.1/sec�ons/fro
The investors' required return on common equity.
cost of debt
(h�p://content.thuzelearning.com/books/AUBUS650.13.1/sec�o
ns/front_ma�er/books/AUBUS650.13.1/sec�ons/front_ma�er/b
ooks/AUBUS650.13.1/sec�ons/front_ma�er/books/AUBUS650.
13.1/sec�ons/fro
The required return of investors in the company's bonds.
Usually, the cost of debt is measured by finding the yield
to maturity of outstanding bonds.
cost of preferred stock
(h�p://content.thuzelearning.com/books/AUBUS650.13.1/sec�o
ns/front_ma�er/books/AUBUS650.13.1/sec�ons/front_ma�er/b
ooks/AUBUS650.13.1/sec�ons/front_ma�er/books/AUBUS650.
13.1/sec�ons/fro
The investors' required return on preferred stock.
equity-debt risk premium
(h�p://content.thuzelearning.com/books/AUBUS650.13.1/sec�o
ns/front_ma�er/books/AUBUS650.13.1/sec�ons/front_ma�er/b
ooks/AUBUS650.13.1/sec�ons/front_ma�er/books/AUBUS650.
13.1/sec�ons/fro
A representa�on of the difference between returns to
equity and returns to debt.
flota�on costs
(h�p://content.thuzelearning.com/books/AUBUS650.13.1/sec�o
ns/front_ma�er/books/AUBUS650.13.1/sec�ons/front_ma�er/b
ooks/AUBUS650.13.1/sec�ons/front_ma�er/books/AUBUS650.
41. 13.1/sec�ons/fro
The transac�on costs incurred when raising capital
externally, for example, when selling newly issued stock
or bonds.
investment bank
(h�p://content.thuzelearning.com/books/AUBUS650.13.1/sec�o
ns/front_ma�er/books/AUBUS650.13.1/sec�ons/front_ma�er/b
ooks/AUBUS650.13.1/sec�ons/front_ma�er/books/AUBUS650.
13.1/sec�ons/fro
A financial services company that specializes in selling
new securi�es issues for client firms.
pure-play
(h�p://content.thuzelearning.com/books/AUBUS650.13.1/sec�o
ns/front_ma�er/books/AUBUS650.13.1/sec�ons/front_ma�er/b
ooks/AUBUS650.13.1/sec�ons/front_ma�er/books/AUBUS650.
13.1/sec�ons/fro
An ac�vely traded firm whose sole product is similar to
an investment project being analyzed. By finding the
required return for the pure-play, the appropriate return
requirement for the investment project can be es�mated.
risk-adjusted discount rate (RADR)
(h�p://content.thuzelearning.com/books/AUBUS650.13.1/sec�o
ns/front_ma�er/books/AUBUS650.13.1/sec�ons/front_ma�er/b
ooks/AUBUS650.13.1/sec�ons/front_ma�er/books/AUBUS650.
13.1/sec�ons/fro
A rate of return that has been adjusted to reflect the risk
in a new investment project vis-à-vis the risk of the
firm's exis�ng projects.
42. underwri�ng
(h�p://content.thuzelearning.com/books/AUBUS650.13.1/sec�o
ns/front_ma�er/books/AUBUS650.13.1/sec�ons/front_ma�er/b
ooks/AUBUS650.13.1/sec�ons/front_ma�er/books/AUBUS650.
13.1/sec�ons/fro
A method of selling securi�es in which the investment
bank buys the securi�es from the client firm and resells
them to investors.
underwri�ng spread
(h�p://content.thuzelearning.com/books/AUBUS650.13.1/sec�o
ns/front_ma�er/books/AUBUS650.13.1/sec�ons/front_ma�er/b
ooks/AUBUS650.13.1/sec�ons/front_ma�er/books/AUBUS650.
13.1/sec�ons/fro
The price at which the investment bank sells securi�es to
the public minus the price paid to the client firm.
venture capital firms
(h�p://content.thuzelearning.com/books/AUBUS650.13.1/sec�o
ns/front_ma�er/books/AUBUS650.13.1/sec�ons/front_ma�er/b
ooks/AUBUS650.13.1/sec�ons/front_ma�er/books/AUBUS650.
13.1/sec�ons/fro
Businesses and individuals that finance high-risk start-up
ventures, usually before an ini�al public offering of stock.
weighted average cost of capital (WACC)
(h�p://content.thuzelearning.com/books/AUBUS650.13.1/sec�o
ns/front_ma�er/books/AUBUS650.13.1/sec�ons/front_ma�er/b
ooks/AUBUS650.13.1/sec�ons/front_ma�er/books/AUBUS650.
13.1/sec�ons/fro
The discount rate that may be found by incorpora�ng the
required returns (costs) for each capital source used to
48. AUBUS650.13.1/sections/front_matter/books/AUBUS650.13.1/s
ections/front_matter/books/AUBUS650.13.1/sections/front_matt
er/books/AUBUS650.13.1/sections/front_matter/books/AUBUS6
50.13.1/sections/front_matter/books/AUBUS650.13.1/sections/f
ront_matter#
For more informa�on on other es�mates of the market's
risk premium (or equity risk premium), read Pablo
Fernandez's paper "Equity Premium: Historical, Expected,
Required and Implied." Available at SSRN:
h�p://ssrn.com/abstract=933070
(h�p://ssrn.com/abstract=933070) .
A very simple cost-of-capital calculator is available at the
following website. To test your skill, you could make up
a simple set of assump�ons and see if you and the
online
calculator get the same answer for the WACC.
h�p://www.wacccalculator.com/
(h�p://www.wacccalculator.com/)
Morningstar is a well-known financial informa�on provider
that produces cost-of-capital es�mates that are published
in an annual yearbook. These yearbooks are costly;
nevertheless, it is instruc�ve to peruse their website to
see the scope of issues and informa�on that surrounds
es�ma�ng the cost of capital.
h�p://corporate.morningstar.com/ib/asp/subject.aspx?xmlfile=5
532.xml
(h�p://corporate.morningstar.com/US/asp/home2.aspx?xmlfile=
7083.xml)
Processing math: 0%
http://ssrn.com/abstract=933070
50. b. Interpret the slope of the model.
c. Interpret the x & y -intercepts of the model.
d. Use the model to predict fossil fuel consumption in 2020.
e. Use the model to estimate the first year for which fossil fuel
consumption is less than 65%
of total energy consumption. (Write and solve a linear
inequality)
8
2. Find the domain of each function algebraically. Write the
domain using interval notation.
a.
3 4
( )
7
x
f x
x
51. c. ( )
7
x
h x
x
Chapter 7
Finding the Required Rate of Return for an Investment
Associated Press
Learning Objectives
A�er studying this chapter, you should be able to:
52. Explain the significance of required return and its components.
Describe the rela�onship between risk and return and how to
measure for both.
Iden�fy how to use required return to determine valua�on.
Processing math: 0%
Ch. 7 Introduction
Investors come in many forms. They may be individuals
who invest in corporate stocks, re�rement accounts that
invest in bonds, partnerships that invest in apartment
buildings, or corpora�ons that invest in produc�ve
projects. One thing all these investors have in common is
their desire to increase their wealth, which is done by
iden�fying
projects whose value is expected to exceed their cost. If
we invest $100 today in a project that produces cash
flows worth $125 in today's terms, then we increase our
wealth by $25. Equa�on (7.1) is the basic formula for
es�ma�ng the value of an investment, which is found by
discoun�ng the expected future cash flows back to today's
equivalent value at a rate of return that is appropriate
given the investment's risk. This fundamental formula for
assessing value was first introduced in Chapter 2 and
further
developed in Chapters 4 and 5, while Chapter 3 explored
cash flows in some detail.
One part of the formula that hasn't been covered is how
to es�mate the required return that is appropriate to use
as the discount rate in the valua�on calcula�on. Finding
the required rate of return is the topic of this chapter
(and is expanded upon in Chapter 8).
53. Processing math: 0%
Like children, who need to be bribed with the promise of
a reward
for their good behavior, investors require a worthwhile
incen�ve
before they will commit to an investment.
Beyond/SuperStock
7.1 The Building Blocks of the Required Return
In Chapter 2, we introduced the idea that investors are
assumed to be ra�onal and risk averse. Because they
are (mostly!) ra�onal, investors will give up control of
their money for a period of �me by inves�ng only if
they
expect to increase their wealth. Therefore, investors have
an almost ins�nctual return requirement as they
invest. For example, a ra�onal investor would always
want to earn at least the risk-free rate of return when
inves�ng in some security or project. Otherwise, they
would be se�ling for a return lower than what they
could be assured of by simply deposi�ng the funds in a
savings account that is guaranteed by both the bank
and the government through the Federal Deposit Insurance
Corpora�on (FDIC). The FDIC guarantees the first
$250,000 of funds deposited to an individual's bank
account. So we establish that the first building block for
assessing a required return is the risk-free interest rate.
For most investments, however, the risk-free rate is only
54. the first component of the required return. Virtually
all investments have some risk associated with them, so
investors also require what is known as a risk
premium to compensate them for this risk exposure. Recall
that we assume that investors are risk averse,
which implies that to bear risk they require compensa�on
in order to subject themselves to distasteful
uncertainty. This is a li�le like one of the authors of
this text who used to pay his children five cents if they
would eat all of their broccoli because his kids were
"broccoli averse."
Now we have the two fundamental building blocks of the
required return for an investment: the risk-free return and
a risk premium.
R(r) = Risk-free rate of return + Risk premium
Given these intui�ve building blocks, we will now take a
closer look at returns, risk, and their rela�onship to one
another in order to fully develop the methods for more
precisely es�ma�ng the required rate of return for an
investment.
Different Types of Returns
It's useful to do some thinking about different kinds of
returns that investors might discuss when they are
considering investment performance. One type of return is
the
historical return, also known as an actual or realized
return. If you buy a share of stock for $20 and a year
later you sell it for $22, you have earned a historical or
realized return equal to 10% per year ($2 gain on a $20
investment). The actual return you earned is 10%. This
may be the same or it may be quite different than the
55. expected return that you were hoping for when you
bought the stock. Perhaps your friend who is a stock
broker told you that she had calculated a target selling
price of
$30 for the stock. If you believed her forecast, then you
were expec�ng a 50% return when you decided to buy
the stock. Clearly, if you were expec�ng a 50% return
but
the actual return was only 10%, then it's likely that you
were disappointed in result. But were you sa�sfied with
the 10% that you earned? To answer that, we need to
know your required return for the stock. The es�ma�on
of the required return for an investment is the subject of
this chapter, but it is generally acknowledged that risk
contributes to one's required return. So if this was a
super risky stock, you may have had a required return
equal to 25%. In this case, you would have been pre�y
unhappy with the result. On the other hand, if the stock
was considered a low risk investment, then you might
have had a return requirement of only 8%, and you were
probably very sa�sfied with the 10% actual return, given
the stock's low risk.
Processing math: 0%
Changes in interest rates and other factors can affect rates
of return.
Investors must be aware of the risks they are taking and
understand
probabili�es and expected rate of return in their business.
At what point
would you consider a poten�al investment to be too
risky? Why must
financial managers consider the risk-return tradeoff when
56. making financial
decisions?
7.2 Risk and Return
The trade-off between risk and return is second nature to
us: We understand that if we are going to invest in a
bond issued by United Airlines, we would do so only if
we
expected to receive a rate of return greater than we would
receive if we invested in a bond issued by the U.S.
Treasury. Why? United Airlines is generally considered
riskier
than the US government. One of the great intellectual
challenges of finance over the past fi�y years was to find
a method for measuring risk, and then find a formula that
quan�fies the rela�onship between risk and return. Using
our example, we need to find a method for quan�fying
how much risk United Airlines has and then discover a
method for es�ma�ng the return that investors should
require given that level of risk.
Risk-Return Tradeoff
Measuring Return
But before delving into how to measure risk, let's look at
how to measure returns. For simplicity's sake, we will use
stocks to illustrate returns and risk. A single period's
historical return is given by the formula
(7.2) Return over a period = Rt = (Pricet – Pricet – 1 +
Dividendt)/Pricet – 1
Example: If you buy a share of stock for $40, hold it for
57. one year during which you collect a dividend of $2 a
share, and then sell the stock for $40.50, what was your
return?
The answer is ($40.50 – $40 + $2)/$40 = 2.50/40 =
0.0625 = 6.25%.
This stock formula can be generalized for any investment's
return:
(7.3) Return over a period = Rt = (Valuet – Valuet – 1 +
Cash flowt)/Valuet – 1
In words, the return for the period is equal to the change
in value of the asset during the period, plus any cash
flows paid by the asset during the period, divided by the
value of the asset at the beginning of the period.
It would be really useful to predict returns (for one thing,
you would get rich if you could consistently forecast
returns!). Unfortunately, in order to predict returns, you
would
like to know what price changes will be in the future so
these future prices can be plugged into the return formula.
But, as you learned in Chapter 2, market efficiency
implies that compe��ve market prices reflect all available
informa�on. Therefore, we cannot say what future price
changes will be and therefore what returns will be. This
is
because price changes will only reflect new informa�on,
and it's anybody's guess whether that informa�on will be
good news or bad news for the company or for the
economy. Because it is nearly impossible to predict
returns, we o�en use the historical average return as our
best es�mate of the expected future return. Take cau�on
with
58. this approach. When using an average to predict the
future, one should use a rela�vely long run average since
almost anything can happen in the short term. For
example,
between 1950 and 2010, the average annual return for the
stock market (as proxied by the S&P 500 index) has been
about 11% per year. This is considered a be�er es�mate
than, say, the five-year average stock market return
between 2007 and 2012, which averaged about zero!
Measuring Risk
We begin our discussion of risk by considering
uncertainty. We are not certain what return we will
receive in the future when we invest. With some
investments, we feel a
greater level of uncertainty than we do with others. For
example, if an investor chooses to buy a five-year
cer�ficate of deposit at an FDIC-insured bank, most
investorsProcessing math: 0%
Returns are based on returns from 3/2010 to 3/2012.
would feel there is very li�le uncertainty about how much
their deposit will be worth a�er the five-year period.
However, if the funds were invested in Facebook common
stock, there is a wide range of poten�al values that the
stock could have five years a�er the investment is made.
One might wonder, "How much riskier is Facebook stock
than a cer�ficate of deposit? Is it twice as risky? Ten
�mes as risky? Twenty �mes as risky?"
In order to answer that ques�on, we need a metric for
measuring risk. We begin by introducing the concept of
59. an investment's total risk. We will define total risk as the
variability of returns, measured by their standard
devia�on. For simplicity's sake we will be using historical
returns to measure risk because, as previously discussed,
future
returns are difficult to predict. Note that we are assuming
in this case that past risk is a good predictor of future
risk, which may be OK, but as you become a more
sophis�cated analyst, this es�mate may be adjusted up or
down depending on what you know about the prospects of
the firm or the investment that you're analyzing.
(7.4) Total risk = Standard devia�on =
Standard devia�on measures the typical distance (or
devia�on) of a return from the average (or expected)
return. So a stock that has a standard devia�on of 15%
has more
uncertainty regarding its returns than a stock with a
standard devia�on of only 10%. To see this, look at
Figure 7.1, which illustrates the distribu�on of returns for
two stocks,
Peabody Coal and Pacific Gas and Electric (PG&E). These
histograms show the frequency of weekly returns from
March 2010 un�l March 2012. No�ce that PG&E's returns
are much more �ghtly clustered, whereas Peabody's have
long tails, par�cularly a long tail to the le� of its
center. Both of these distribu�ons have about the same
average
return (0.00), but there is much more uncertainty about
the return of Peabody because the standard devia�on of
its returns is 0.068 per week while Pacific Gas and
Electric's
standard devia�on is only 0.023. Therefore, judging by
this historical data, risk-averse investors would be much
more concerned about owning Peabody because of the
60. uncertainty surrounding its returns.
Figure 7.1: Historical distribu�on of returns for Peabody Coal
and PG&E
It is important to keep in mind where the uncertainty
illustrated in Figure 7.1 actually comes from: Risk is
measured by the variability of returns, and returns are
generated
by price changes as we saw in Equa�on (7.4). Recall that
price changes are caused by the arrival to the marketplace
of new informa�on, which investors and analysts
anxiously await in order to adjust their view of the
company's or investment's worth. Risk, therefore, has at its
founda�on informa�on and the investment's sensi�vity to
that
informa�on. As an example, consider what might happen
to a company's stock value, and therefore its returns, if
the United States announced that it will impose a
significant tax on carbon emissions. The prices of oil
companies would likely fall drama�cally as one would
imagine gasoline costs increasing and demand decreasing,
lowering
oil company profits. However, a hydroelectric-based u�lity
company might see li�le change in its value since it does
not produce carbon so its cost and pricing structure
would remain unchanged—its value might actually increase
as demand for clean energy would likely rise.
The risk of adverse price movements can be decreased by
diversifica�on. For example, in the previous example,
consider what would happen to an investor's por�olio
(collec�on of investment assets) if the investor held both
oil company stocks and hydroelectric u�lity stocks. The
oil stock values would fall because of the carbon tax, but
61. this risk would be mi�gated by the posi�ve response to
the tax by hydroelectric firms. In this case, the fall in
gas stock prices is offset by the posi�ve response of the
u�lity
stocks. Risk is decreased in this case because of the
different reac�ons by the two industries to the same
informa�on. When one has investments in a variety of
companies,
there is a good chance that what affects one company
nega�vely may actually have li�le impact, or perhaps a
posi�ve impact, on the value of another stock in the
por�olio.
Processing math: 0%
Por�olio diversifica�on refers to the reduced risk to
individuals who invest
in various assets with different characteris�cs. How has
financial
globaliza�on led to more opportuni�es for por�olio
diversifica�on?
The Benefits of Financial Globaliza�on: Risk
Diversifica�on
Total risk can, therefore, be broken down into risk that
may be diversified away (called diversifiable risk) and risk
that cannot be avoided or mi�gated (called systema�c or
nondiversifiable risk). Diversifiable risk is o�en
characterized as "firm-specific" risk and "industry-specific"
risk. Nondiversifiable risk is o�en referred to as market
risk. Just so
you know all the terms you might run into, diversifiable
62. risk is also referred to as unsystema�c risk, whereas
market risk is also called systema�c risk. Investors are
primarily
concerned with nondiversifiable risk because they can
eliminate a great deal of the diversifiable risk by simply
holding a large number of different stocks. Table 7.1
breaks
down diversifiable and nondiversifiable risk.
(7.5) Total risk = Diversifiable risk + Nondiversifiable risk
(7.6) Diversifiable risk = Firm- and industry-specific risk =
Unsystema�c risk
(7.7) Nondiversifiable risk = Market risk = Systema�c risk
Table 7.1: Classifying risk
Names for risk that can be diversified away Names for
risk that cannot be diversified away
Industry- and firm-specific risk Market risk
Diversifiable risk Nondiversifiable risk
Idiosyncra�c risk Systema�c risk
Unsystema�c risk Economy-wide risk
Example: CEO quits Example: Recession
Firm-specific risk is associated with events such as a
company making a poor product decision, being sued,
having a CEO get indicted or die, having a big fire at a
factory, or
having a compe�tor develop a new product. All of these
63. would adversely affect the value of the company, but if
an investor is well-diversified, the impact will be minimal
to
the overall por�olio because such an event impacts only a
single firm. Also, with enough firms in a por�olio, there
is a good chance that when a firm-specific bad event
happens to company A, you may have another company
that experiences firm-specific good news. For example,
suppose that on the same day that Firm A losses a
lawsuit,
Firm B discovers oil, so these events would tend to offset
one another in your por�olio. Some�mes, a news event
for one company ripples through the industry. If Apple
announces a new, more powerful but less expensive iPad,
that will almost certainly affect the prospects of other
companies making tablet computers. If one airline company
has several planes grounded for safety inspec�ons, other
airlines might benefit as passengers switch their flight
plans.
Industry-specific risks are also largely avoidable via
diversifica�on because events that harm a par�cular type
of industry will not necessarily have a nega�ve effect on
other
stocks in a por�olio that represent firms in other
industries. For example, low interest rates may hurt the
profits in the banking industry, yet they actually help the
housing-
building industry. Therefore, holding a por�olio of stocks
(in other words, being diversified) enables the nega�ve
impact of low interest rates on one industry to be offset
by
the posi�ve effect these rates have on other industries
within the investor's por�olio.
Nondiversifiable risks are difficult to avoid regardless of
64. how many stocks you own, or how diversified your
investment por�olio becomes. Some events have nega�ve
effects
that pervade the en�re economy. For example,
unemployment hurts almost all companies as consumer
demand falls lowering sales and profits, and savings fall
making
capital scarce. These kinds of far-reaching events are
referred to as nondiversifiable or market risks. High
infla�on, war, economic recessions, and oil embargos all
have a
nega�ve impact on almost all of the firms in one's
por�olio, regardless of how many stocks you own!
Because much of the risk of inves�ng may be avoided
simply by diversifying one's por�olio, it is argued that
we need not concern ourselves with these diversifiable
risks. It
is, for example, just as easy to buy a mutual fund that
holds shares of 500 different companies as it is to load
up on a single firm's stock. Clearly, the mutual fund
strategy
avoids much of the risk that the investor in a single
security faces. In fact, the standard devia�on (the
variability) of a diversified por�olio's returns can easily
be reduced by
Processing math: 0%
The por�olio standard devia�on of returns decreases as
the number of randomly selected stocks in the
por�olio increases.
Luxury markets like Porsche dealerships are highly
65. suscep�ble to
the rise and fall of the economy. Do you tend to feel
more or less
inclined to invest in these companies?
Associated Press
about half compared to the average standard devia�on of
the individual stocks in the por�olio. The diversifica�on
effect of lowering risk is shown in Figure 7.2 where we
can
see that increasing the number of even randomly selected
stocks in a por�olio can drama�cally reduce the
por�olio's standard devia�on of returns.
Figure 7.2: The diversifica�on effect
Since investors can easily and inexpensively eliminate
most diversifiable risk from their por�olios, we assume
that everyone does so. Thus, the risk that is relevant to
the
investor is the nondiversifiable risk of an investment. The
ques�on becomes, how can we measure this risk? To
measure market risk, we u�lize a metric called beta. Beta
measures a firm's typical responsiveness to informa�on
that impacts the en�re market—like informa�on about
economic growth, poli�cal news, infla�onary expecta�ons,
the
balance of trade, natural disasters, and so on. By
defini�on, the average sensi�vity to this kind of
informa�on would be measured by the responsiveness of
the market
por�olio. The market por�olio theore�cally would be
totally diversified and would include virtually all
66. investment instruments including all of the stocks and
bonds that are
traded. In prac�ce, there is no such thing as a true
market por�olio so a proxy is used as an approxima�on.
Typically, the S&P 500 Index is used as that proxy. The
beta of
the market por�olio is defined as being equal to posi�ve
one.
A firm may be more sensi�ve than the average to
economic informa�on, in which case the firm's beta would
be greater than one. A company that is twice as sensi�ve
as the average firm to economic events will have a
beta of 2.00, whereas a firm that is less sensi�ve than
average will have a beta below one. Here is an example.
Take a firm that sells luxury goods, like a Porsche
automobile dealership. We might assume that when the
economy is booming, this business does really well, but
when the economy is doing poorly, luxury sports car
sales suffer dras�cally. Let's suppose that Porsche
dealership's beta is 1.70, meaning that it is 1.7 �mes as
sensi�ve as the overall market to "macroeconomic" type
events. So, if the government announces that
economic growth is very strong, we might hear that the
S&P 500 por�olio had a return of 5% that day in
response to this good economic news. But because a
Porsche dealership is more sensi�ve than average to such
informa�on, its stock would likely return around 8.5% on
the same day (found by taking the product of 1.7 ×
5% = 8.5%). If, on the other hand, the market por�olio
declines by 10% one month because of bad economic
news, then the dealership's stock would be expected to
fall by around 17%.
Of course, these are the expected returns for the Porsche
dealership and may not be equal to the firm's actual
67. returns on those days because there are always firm-
specific factors that may affect a single stock's return. For
example, on the day that the government announces strong
economic growth (good news and we expect the
8.5% return), it may be the dealership also learns that the
company is being sued, so the firm's stock could actually
fall in value on the date because of this nega�ve firm-
specific announcement.
Some businesses are less sensi�ve to market-level
informa�on than the average firm is. An example might
be an electric u�lity company, say Pacific Gas and
Electric (PG&E).
When the economy is doing well, Pacific Gas and Electric
does well because there is more demand for electricity.
When �mes are bad, demand for power falls, but it
doesn't
fall too far because, unlike Porsche sports cars, electricity
is close to being a necessity. So with this rela�vely low
sensi�vity, Pacific Gas and Electric has lower than
average
market risk, and its beta is less than one. In June 2012,
Yahoo! Finance reported PG&E's beta as 0.29. If the
country goes into a recession and the market as proxied
by the
S&P 500 declines by 10%, PG&E, with its beta of 0.29,
would see its stock price drop by only about 3% on
average.
Betas are typically es�mated using historical returns and
linear regression es�ma�on. Linear regression is a
sta�s�cal technique for es�ma�ng a best-fit line through
points
plo�ed in an x-y coordinate system like the graphs
typically used in algebra. The idea is that the slope of
68. this line will capture the average rela�onship between the
x- and
the y-variables. So if the slope is 1.5 for a regression
line, then for each unit increase in the x-value, the y-value
will (on average) increase by one and a half units.
Regression
is used to es�mate a variety of rela�onships, like the
effect that the �me spent studying has on the grade point
average of students. For our purposes, we use returns for
the
S&P 500 as our x-values, and corresponding returns for
the stock that we are interested in as our y-values. The
regression's slope, therefore, is an es�mate of the stock's
average responsiveness to market-wide returns, or its
beta.Processing math: 0%
A stock's beta is the slope of the line-of-best fit through
the sca�erplot of market returns (S&P500) and the
company's returns.
Since betas are sta�s�cal es�mates, they can vary
depending on the sample of data being used for the
es�mate. Figure 7.3 es�mates the beta for PG&E by
plo�ng the
corpora�on's returns against those of the S&P 500. As
you can see, the beta we es�mate (0.43) differs from the
beta reported by Yahoo! in June 2012 (0.29). The
difference
can be a�ributed to different data sets; Yahoo! based
their report on 36 monthly returns, whereas we have
based our es�mate on 24 weekly returns.
Figure 7.3: Es�ma�ng beta for PG&E
69. The Capital Asset Pricing Model
Now we know how to measure returns and how to
measure nondiversifiable risk (by using beta). Next we
need to learn how to u�lize these metrics to es�mate the
required
rate of return for an investment. Recall from the
beginning of the chapter that the "building blocks" of a
required return include the risk-free rate and a risk
premium. These
two elements are present in an equa�on called the capital
asset pricing model (CAPM). We need this model to
quan�fy the rela�onship between investor's required rate
of
return and the risk of an investment. Here is the CAPM
as it was originally developed:
(7.8) Required return for an investment = Rf +
Beta[E(Rmkt) – Rf]
where
Rf = the risk-free rate of return
E(Rmkt) = the expected return on the market por�olio
Beta = the stock's beta
This theore�cal rela�onship between risk and return was
one of the path breaking achievements in economics in
the 1960s, for which several academics were awarded the
Nobel Prize. Like many theories, however, there are
challenges when using the CAPM in prac�ce. For
example, no one knows what the expected return on the
market,
70. E(Rmkt), is equal to. The model also assumes there is a
single, observable risk-free rate, when in reality there is
no investment free of risk and there is more than one
possible rate that can be used as a close proxy for risk-
free. Because of these problems, most prac��oners use a
different form of the model which is given here:
(7.9) Required return for an investment = Rf + Beta(Market
risk premium)
Rf can be thought of as the rate that links the CAPM to
current market condi�ons. This is important because
interest rates are constantly changing due to changes in
infla�on, economic ac�vity, or government policies. We
use yields on outstanding debt issued by the U.S.
government as a proxy for the risk-free rate, choosing the
Treasury
bill or bond that best matches the life of the asset we
are evalua�ng. So, for stocks that have an almost
perpetual life, long-term U.S. Treasury bond yields are
o�en used for
the risk-free rate. The market risk premium (MRP) is the
amount of return yielded by the market por�olio over and
above the treasury yield. It can be thought of as the
return required for each addi�onal unit of risk as
measured by beta. O�en, the MRP is assumed to equal
its historical average, which is about 5% to 7%,
depending on
whose data you use.
Here is an example of using the CAPM. Let's es�mate
the required return for Nordstrom's (Ticker: JWN) stock
given that Nordstrom's beta is 1.58, as reported on Yahoo!
Finance in June 2012
(h�p://finance.yahoo.com/q/ks?s=JWN+Key+Sta�s�cs
71. (h�p://finance.yahoo.com/q/ks?s=JWN+Key+Sta�s�cs) ).
Nordstrom's has a fairly high beta because it is
considered a high-end or almost luxury retailer, not
dealing in necessity goods. Consequently, when �mes are
tough, some people may discon�nue shopping at
Nordstrom's
and may buy their shoes and clothing at a more
moderately priced retailer. Let's also assume that T-bonds
are yielding 4.5% per year, and that the historical average
market
risk premium (the average return of the market por�olio
over and above the risk-free return) is about 6%. Using
this informa�on, we may es�mate the required return for
Nordstrom's stock using the CAPM.
RNordstroms = Rf + BNordstroms(Market risk premium) =
0.045 + 1.58(0.06) = 0.1398 = 13.98%
Processing math: 0%
http://finance.yahoo.com/q/ks?s=JWN+Key+Statistics
A second example would be required rate of return for
PG&E's stock. Using the published beta of 0.29 and the
risk-free rate and market risk premium above we would
compute PG&E's required rate of return as:
RPG&E = Rf + BPG&E(Market risk premium) = 0.045 +
0.29(0.06) = 0.0624 = 6.24%
No�ce that the much lower beta of PG&E results in a
much lower required rate of return compared to Nordstrom.
Applying Finance: Finding Beta Using Excel
Finding an asset's beta using Excel is a two-step process:
72. first, compute returns from prices; second, use the
LINEST func�on to compute the beta (slope of a
regression
line).
We downloaded stock prices for Dow Chemical (Ticker:
DOW) from Yahoo! Finance using its historical price
feature. We then downloaded the index data for the S&P
500
(Yahoo! Ticker: ^GSPC). We use the adjusted close price
to make sure dividends are included in the price. Our
data are weekly and run from Friday, February 3, 2012,
through Friday, June 22, 2012. We compute returns using
the formula from the text:
(Change in price)/Beginning price
Since we are using adjusted prices we don't need to
explicitly include dividends in the returns equa�on. Figure
7.4 shows the spreadsheet of prices showing the price
series, the returns formulas and the LINEST formula.
Figure 7.4: DOW Chemical spreadsheet, LINEST
Figure 7.5 shows the same spreadsheet with the numerical
results shown. Using this small sample of data, Dow's beta
es�mate is 1.63.
Figure 7.5: DOW Chemical spreadsheet, numerical
Determining an Asset's Beta
Processing math: 0%
During the discussions of the Porsche dealership,
73. Nordstrom's, and PG&E, we said that it is the nature of
the products and services that are sold by a company that
determine the company's risk. Luxury goods, like sports
cars, tend to have more market risk than do necessi�es
like electricity. Demand for durable goods, items that are
long-lived and can be repaired like cars and appliances,
will fluctuate more as the economy rises and falls than
demand for food or medicine. If a company has invested
in
produc�ve assets to make luxury or durable goods, then it
is likely to have a high beta (higher than 1 or the
market average beta). Similarly, if the factories and
equipment
make food or electricity or things that are necessary (or
that have steady demand), the company will have a lower
beta (less than one). Thus, it is the assets of a company
and the products those assets make that determine the
company's beta. Companies that produce similar goods that
are sold in similar markets will have similar betas
because those companies will be impacted similarly by the
kind of macroeconomic news that creates market risk.
Assess your expecta�ons of beta by comple�ng the
exercise
in the Field Trip: Expecta�ons of Beta feature.
Field Trip: Expecta�ons of Beta
Pick three firms that you think may have low betas and
three that you think may have high betas. Visit Yahoo!
Finance or Google Finance to look up their betas.
Visit Yahoo finance: h�p://finance.yahoo.com/
(h�p://finance.yahoo.com/)
Google finance: h�p://www.google.com/finance
(h�p://www.google.com/finance)
74. Reflec�on Ques�on
Are there any surprises? Can you think of some reasons
that these betas are different from what you expected?
In theory, the asset beta of a Porsche dealership should
be very nearly the same as the asset beta of, say, a
BMW dealership. This is because they are similar
businesses
offering similar products. If both the Porsche and the
BMW dealerships had no debt financing, then both of
their asset betas would be iden�cal to the betas of their
stock.
This is because the stock would represent the only claim
against the assets, so the risk of the assets would
translate directly to the risk of the stock. In this case,
both
dealerships' stock, being in the same business, would
probably have almost iden�cal betas and both would also
have almost iden�cal required rates of return.
However, most companies use debt financing in addi�on
to equity financing. This use of debt is also known as
leverage. The use of leverage increases the risk of equity
because debt, with its priority claim, forces equity holders
to bear the risk that there will be lower cash flows
available for them a�er debt payments are made. For this
reason, the betas of stock differ even among firms in the
same industry because of the varying amount of debt that
the companies borrow. Asset betas, therefore, depend
primarily on the nature of a company's business, whereas
equity betas—the betas of inves�ng in just a company's
stock—depend on both a firm's asset beta and on its use
of leverage. A specific technique used for es�ma�ng an
asset beta, called the pure-play approach, is covered in the
75. next chapter.
Portfolio Betas
There are �mes when investors may want to es�mate the
required return for a por�olio or stocks or other
investment assets. For example, we may want to compare
the
actual, realized return on a por�olio to the required
return on that por�olio in order to assess the performance
of the manager who is in charge of the por�olio's
investments. If the realized return exceeds the required
return given the por�olio's risk, then the manager is
performing at or above expecta�ons. If, on the other
hand, the
realized return is below the required return for the
por�olio, then the manager is performing below
expecta�ons, and may find his or her posi�on in
jeopardy.
Por�olio betas are found by taking the weighted average
of the betas of the assets held in the por�olio, where the
weights are determined by the amount invested in each
asset. For example, consider the por�olio in Table 7.2.
Table 7.2: Sample por�olio
Stock Stock's beta Amount invested Weight
Acme, Inc. 1.20 $100,000 .10
XYZ Corp. 1.50 $150,000 .15
ABC Corp. 0.70 $500,000 .50
Delphi, Inc. 1.00 $250,000 .25