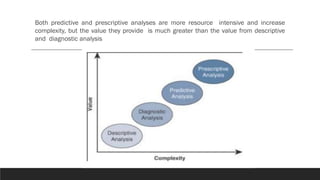
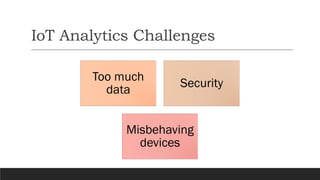
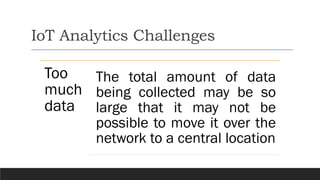
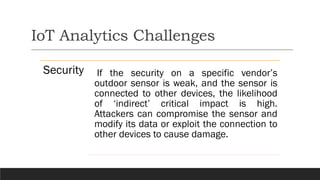
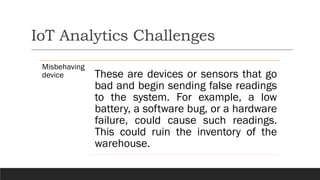
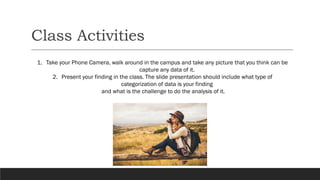
This document discusses fundamentals of IoT data analytics. It defines IoT analytics and explains challenges including dealing with large amounts of data, security issues, and misbehaving devices. It categorizes IoT data as either structured or unstructured, and as data in motion or at rest. Structured data fits a predefined model while unstructured data lacks structure. Data in motion passes through networks while data at rest is stored. Both predictive and prescriptive analytics provide more value but are more complex than descriptive or diagnostic analysis. Class activities involve capturing IoT data examples and presenting categorization and challenges.


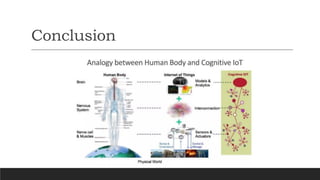
![Structured vs Unstructured Data
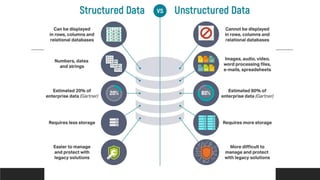
❑ According to some estimates, around 80% of a business’s data is
unstructured.
❑ Because of this fact, data analytics methods that can be applied to
unstructured data can be cognitive computing and machine learning.
[cognitive computing: hardware and/or software that mimics the functioning of the
human brain and helps to improve human decision-making]](https://image.slidesharecdn.com/chapter2-230711014303-7aeeefb4/85/Chapter-2-pdf-12-320.jpg)