Downloaded 409 times
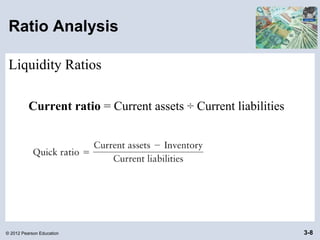
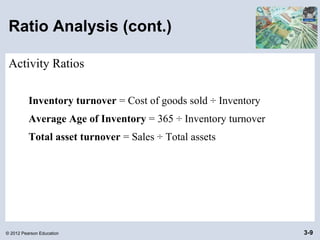
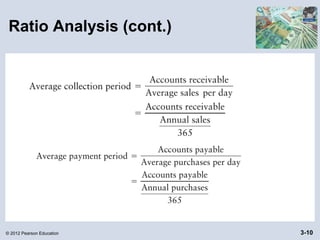
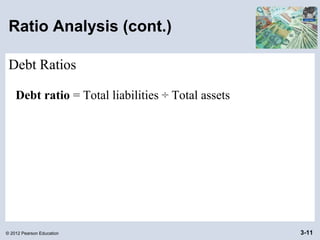
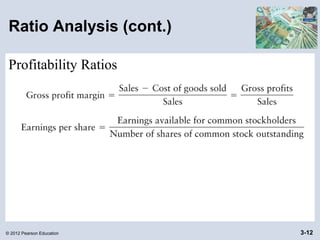
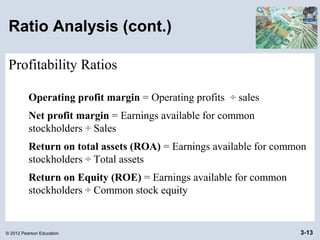

The document discusses key financial statements and ratio analysis. It describes the four main financial statements - the income statement, balance sheet, statement of retained earnings, and statement of cash flows - and what each provides. It also discusses the types of parties interested in financial ratios, such as current/prospective shareholders and creditors. Finally, it outlines different types of ratio comparisons and examples of common liquidity, activity, debt, and profitability ratios used in financial analysis.