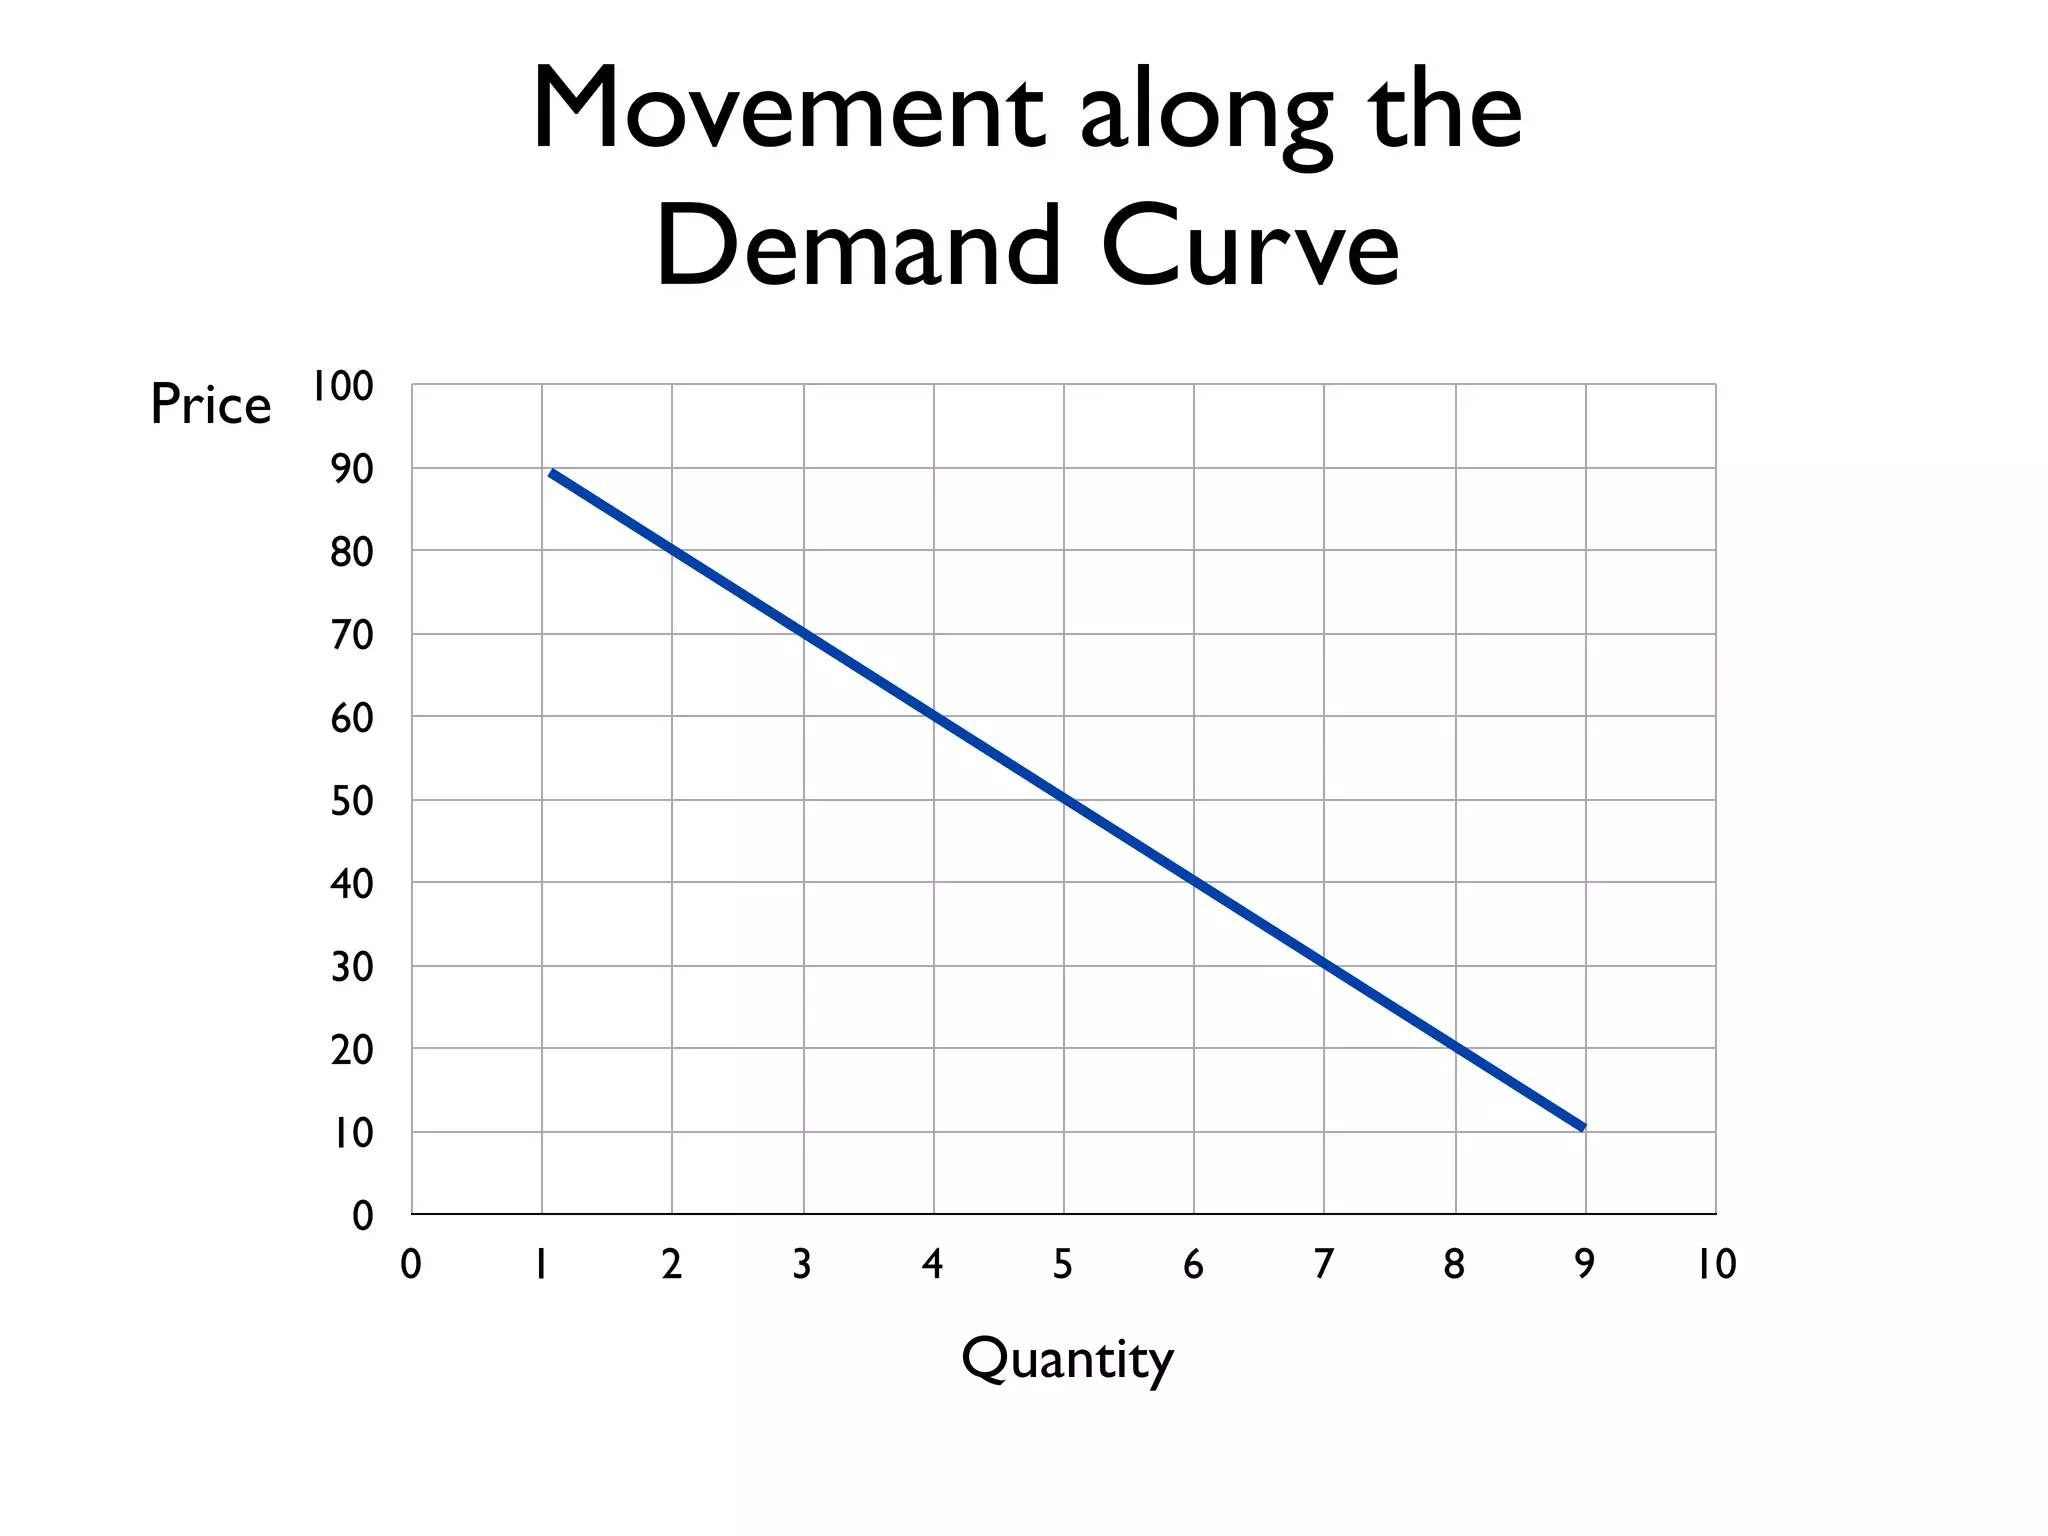
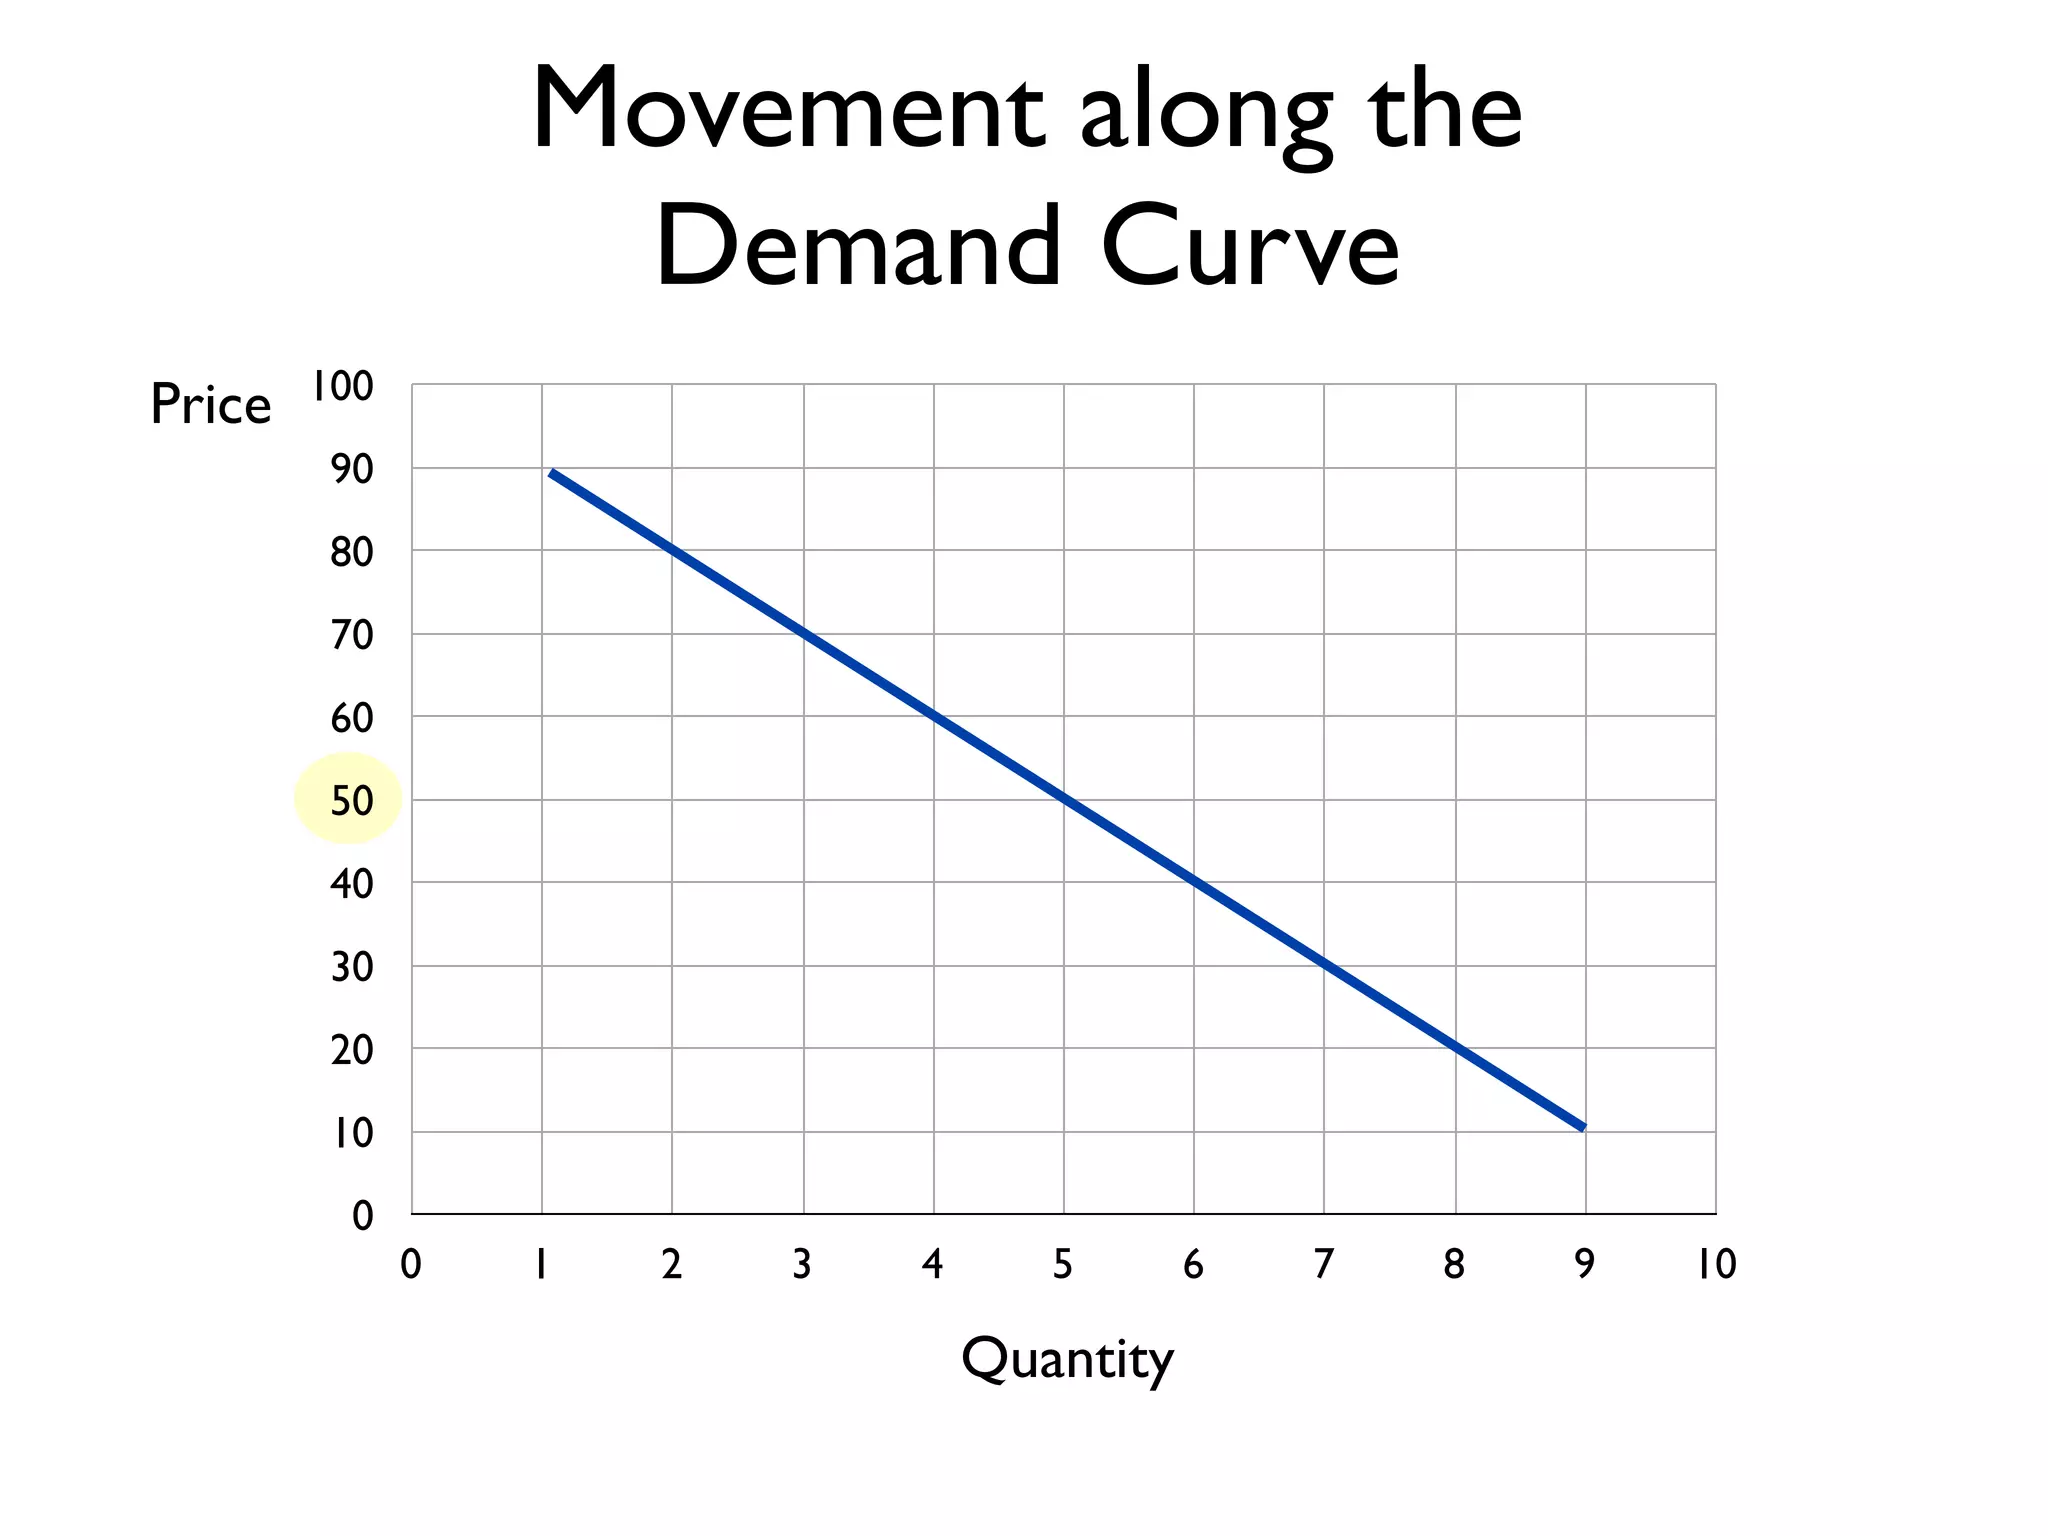
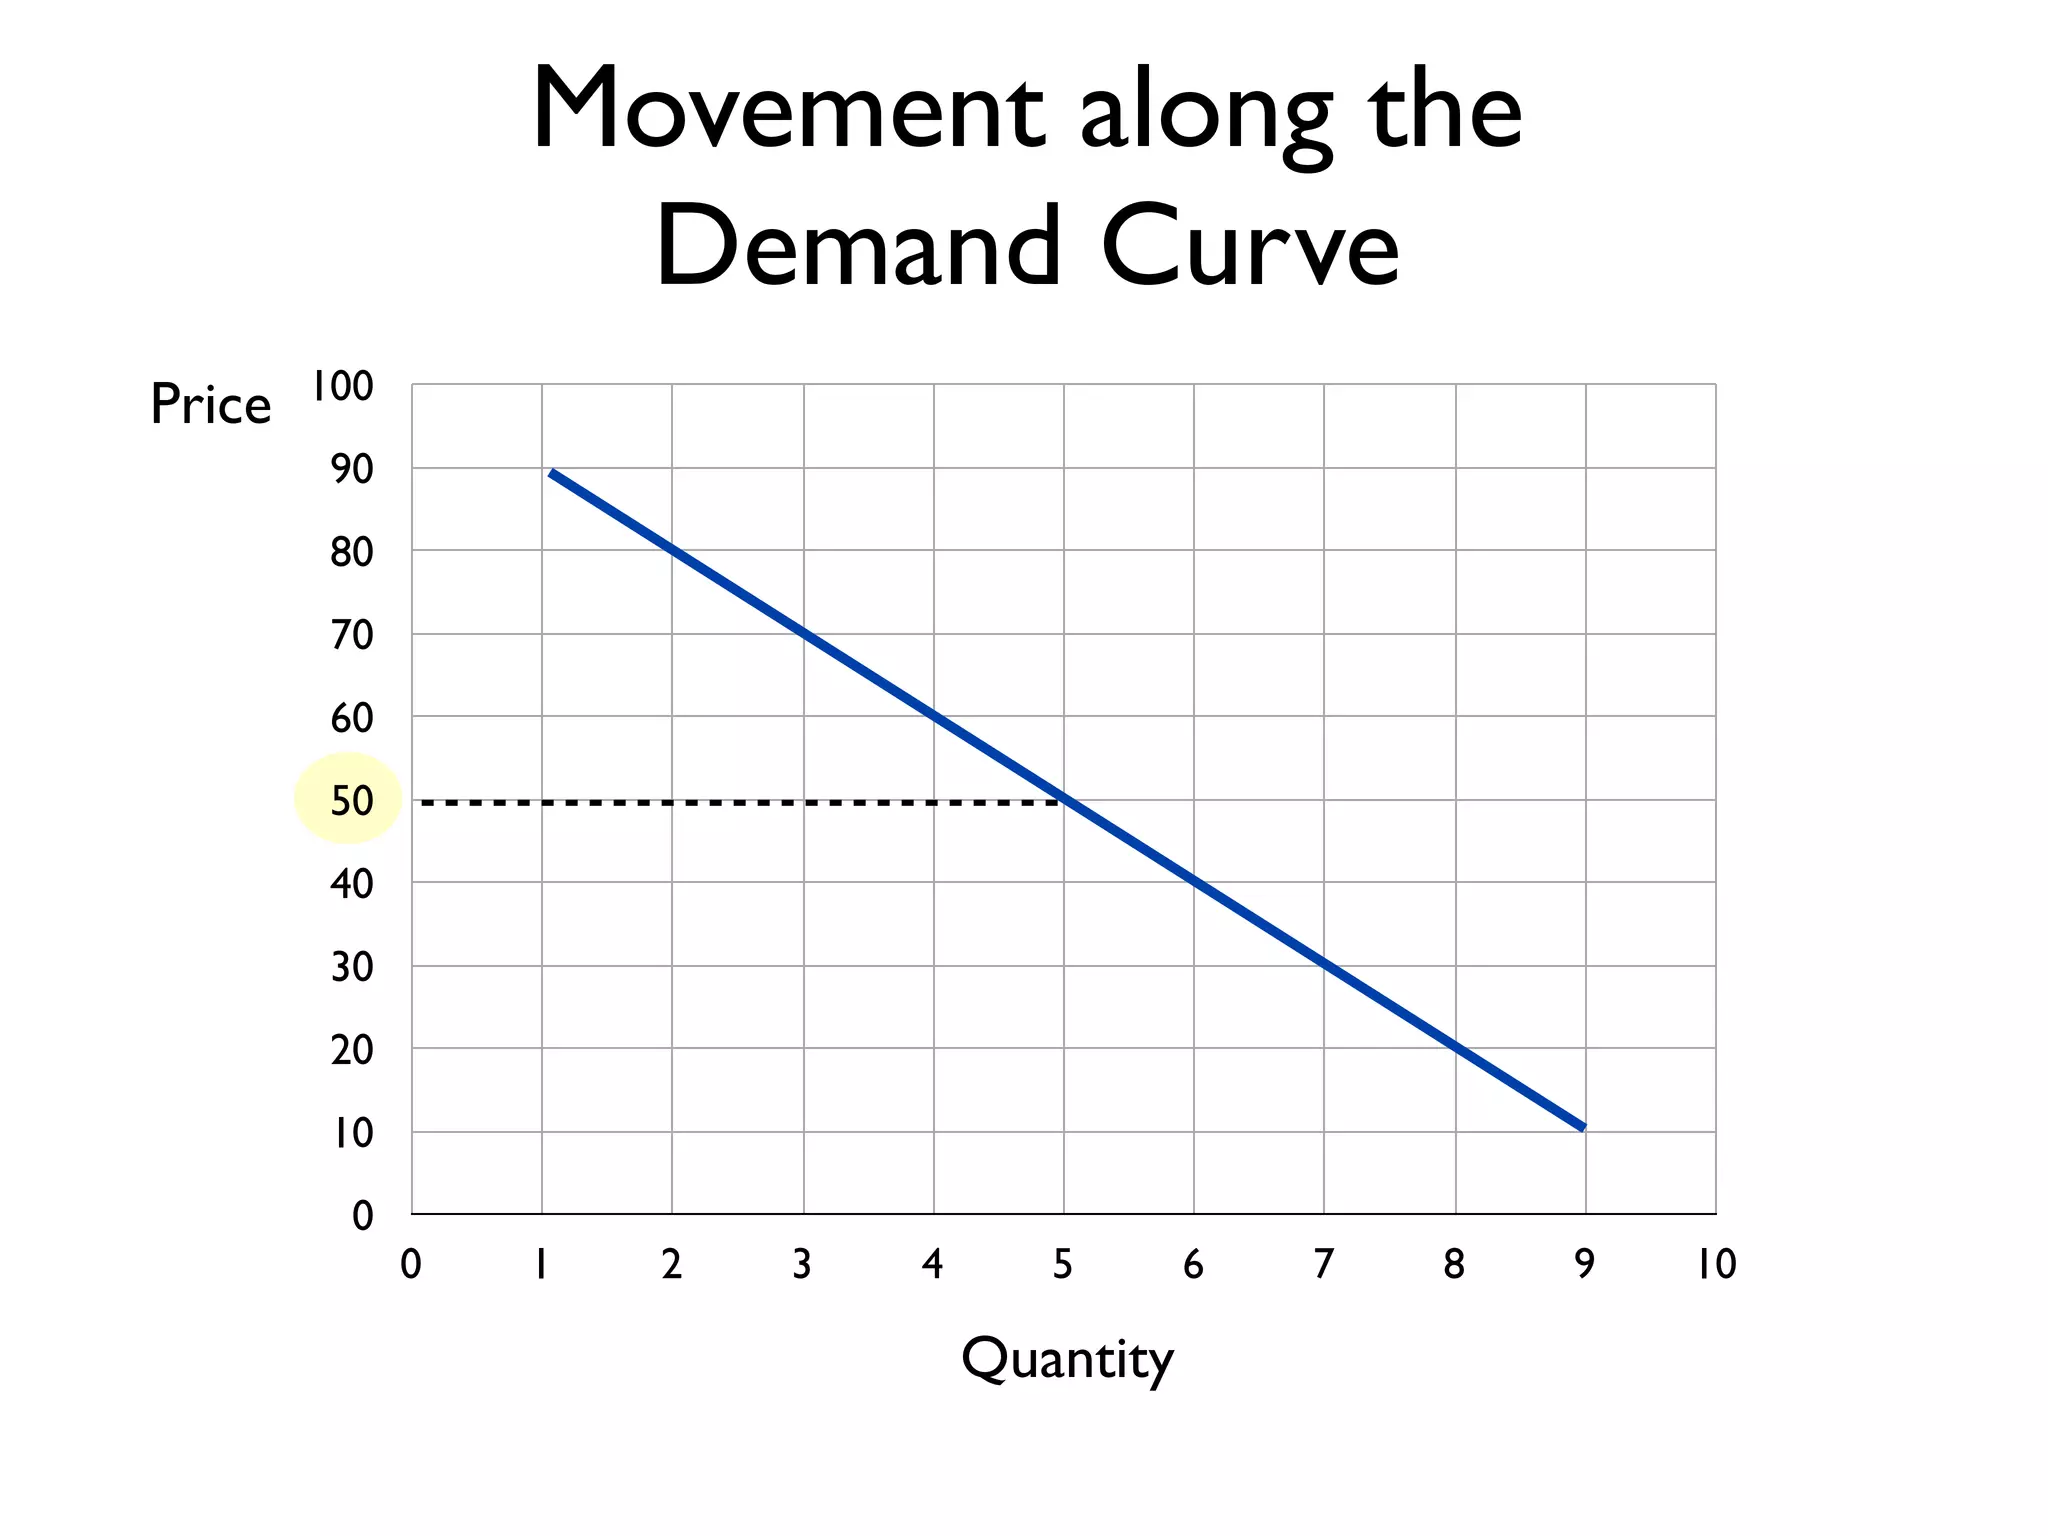
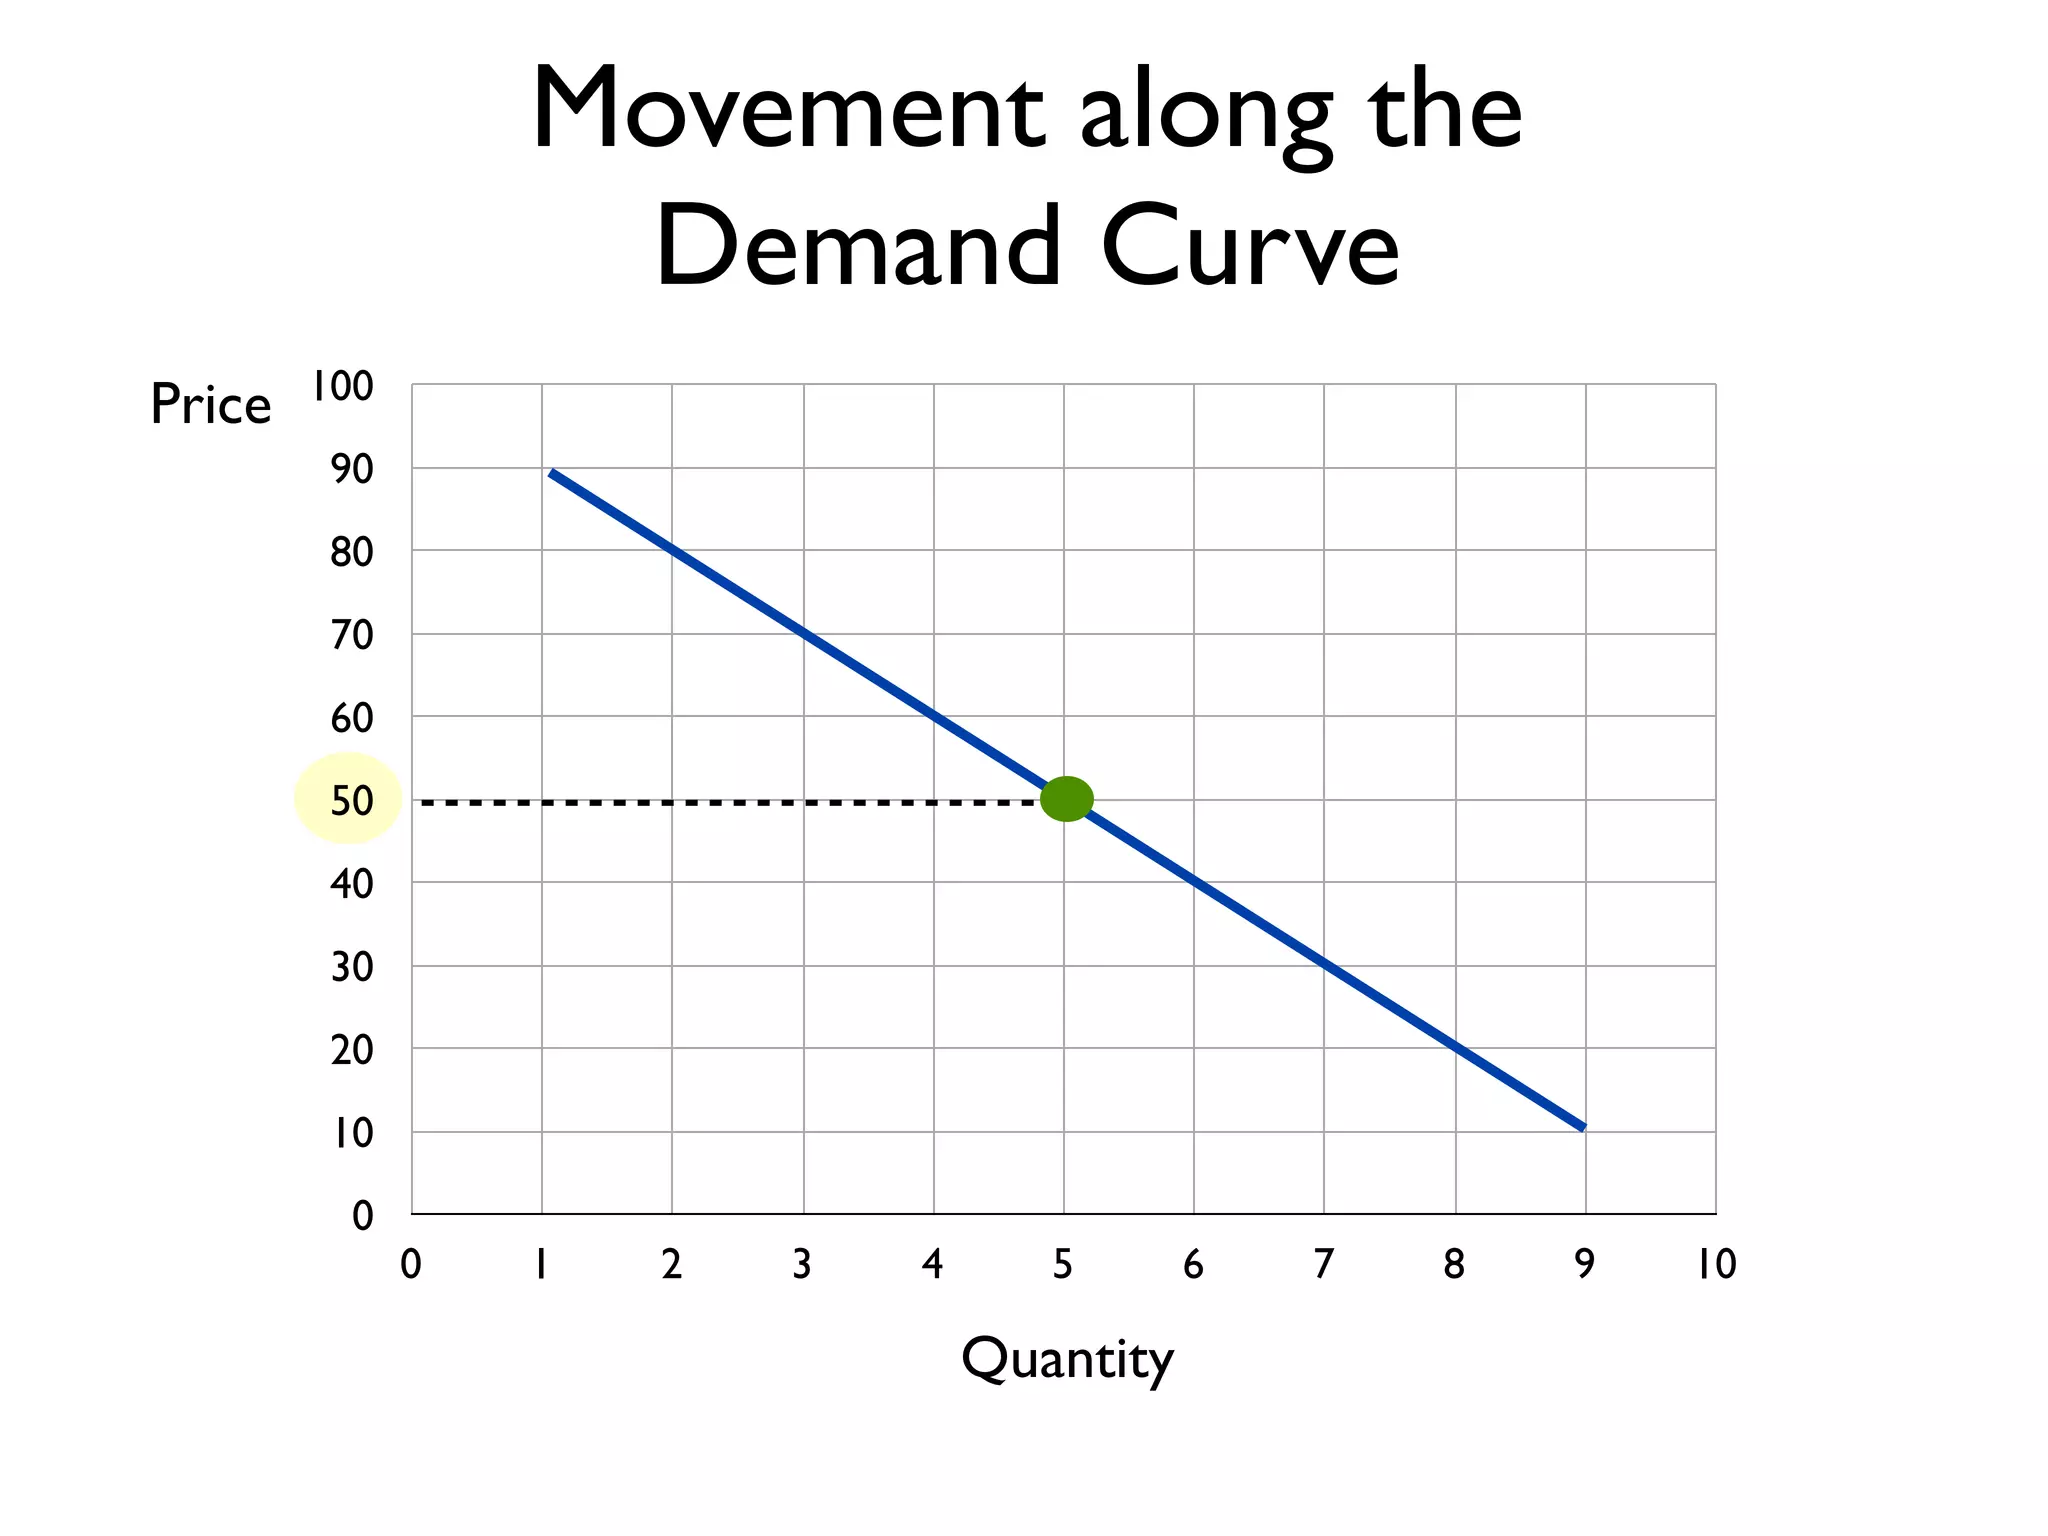
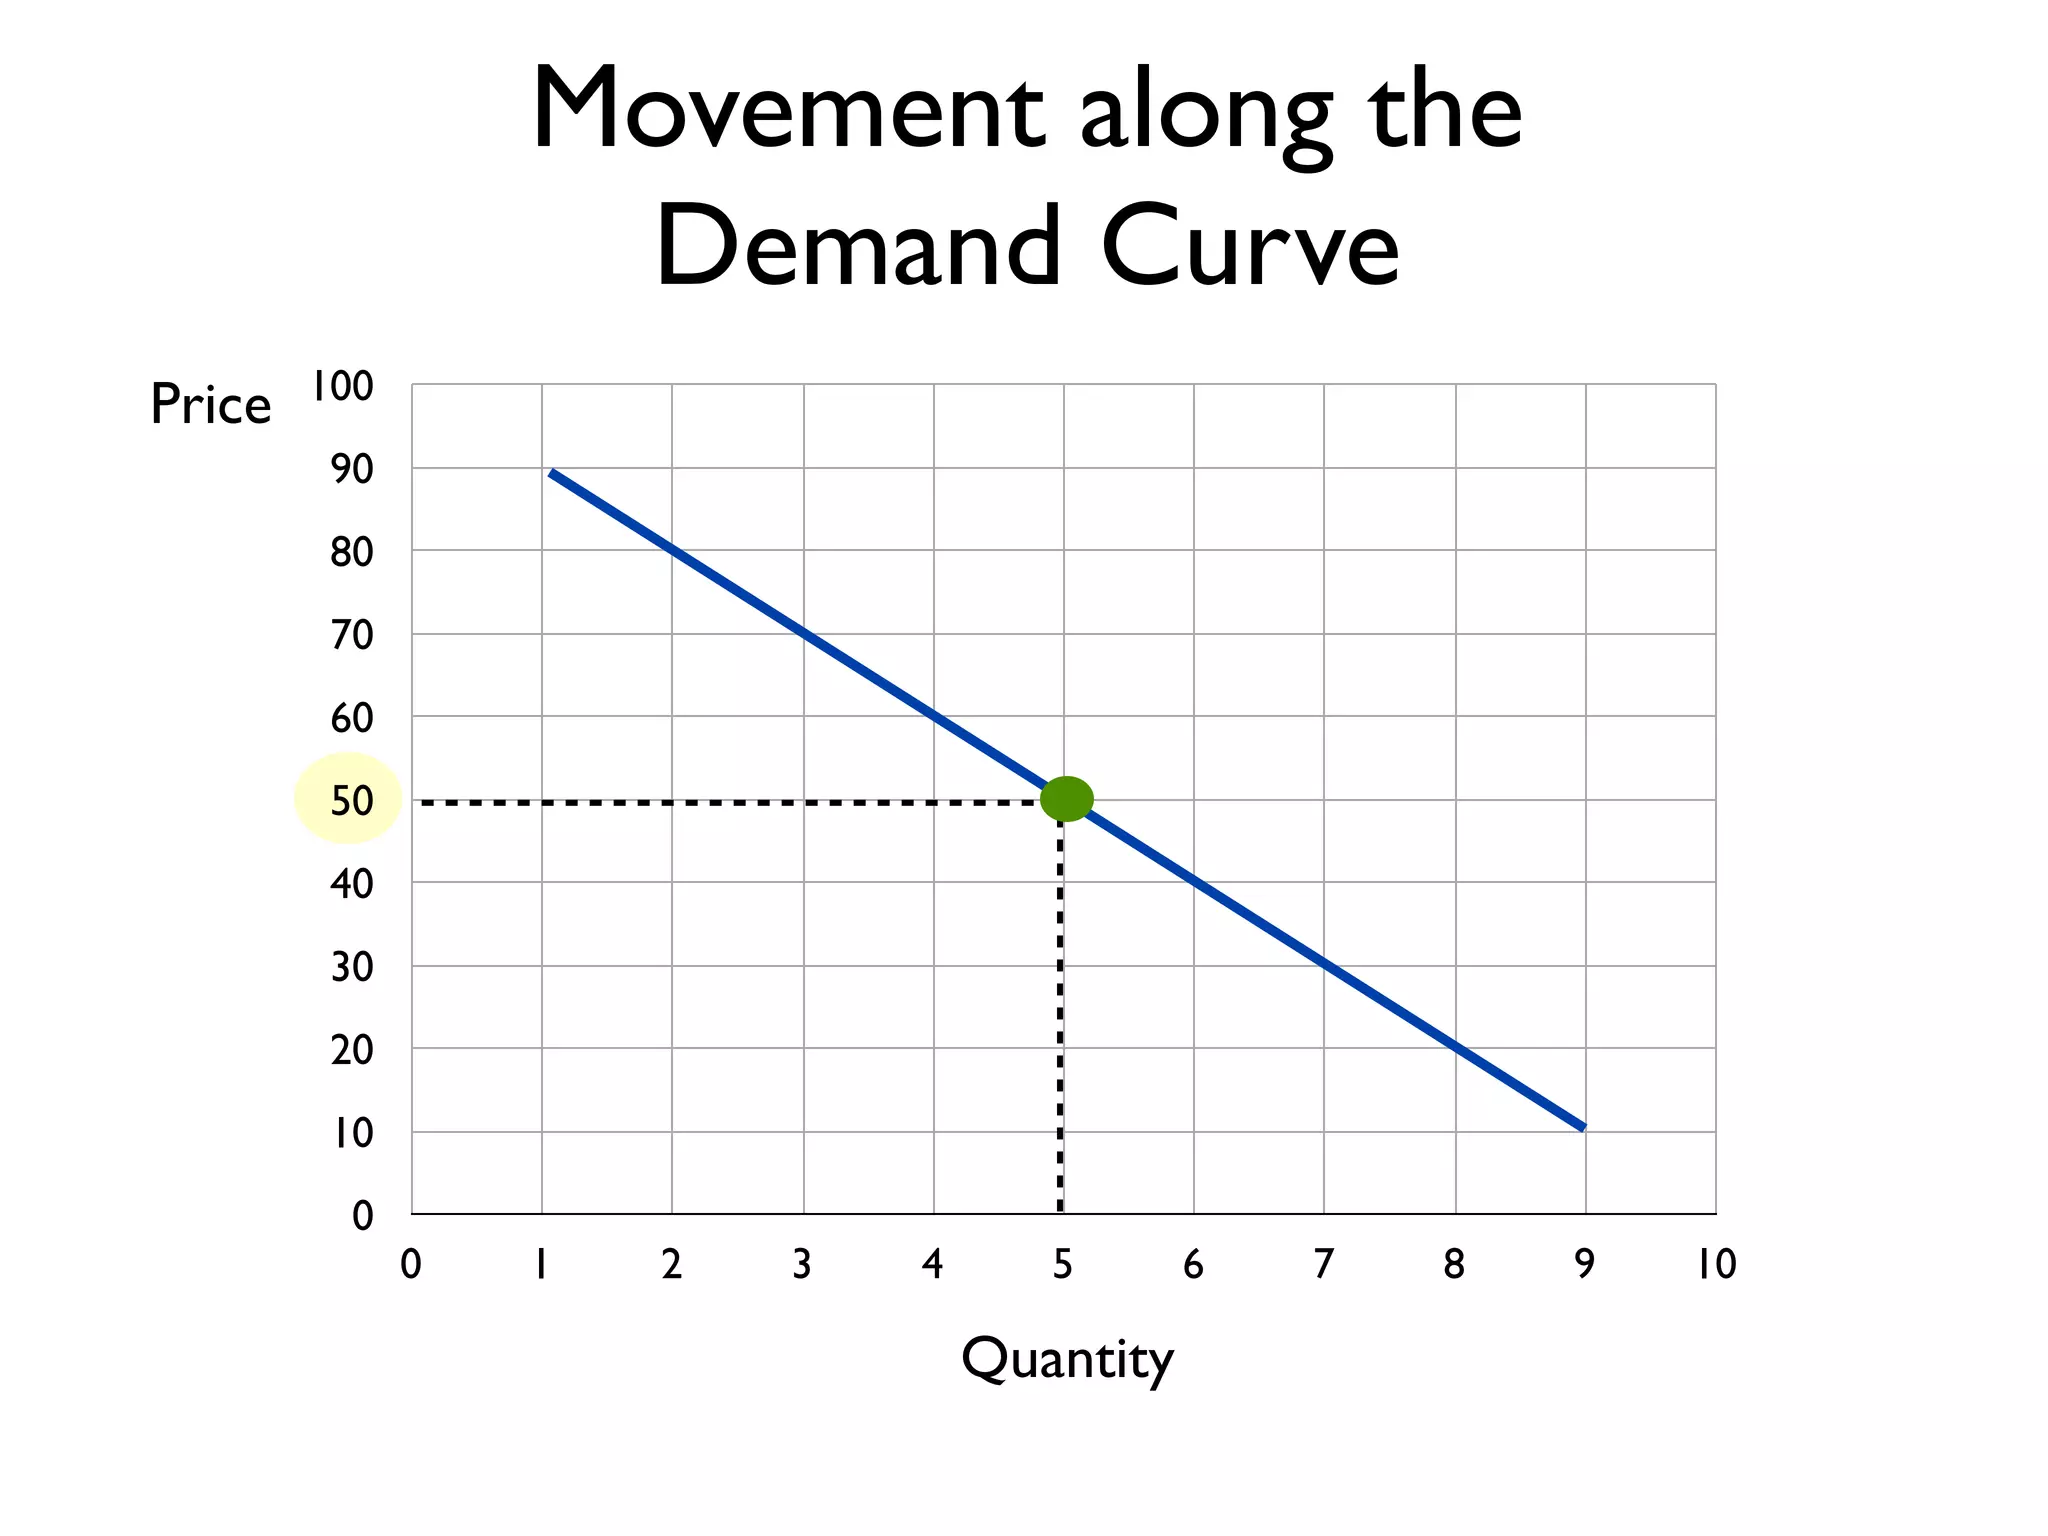
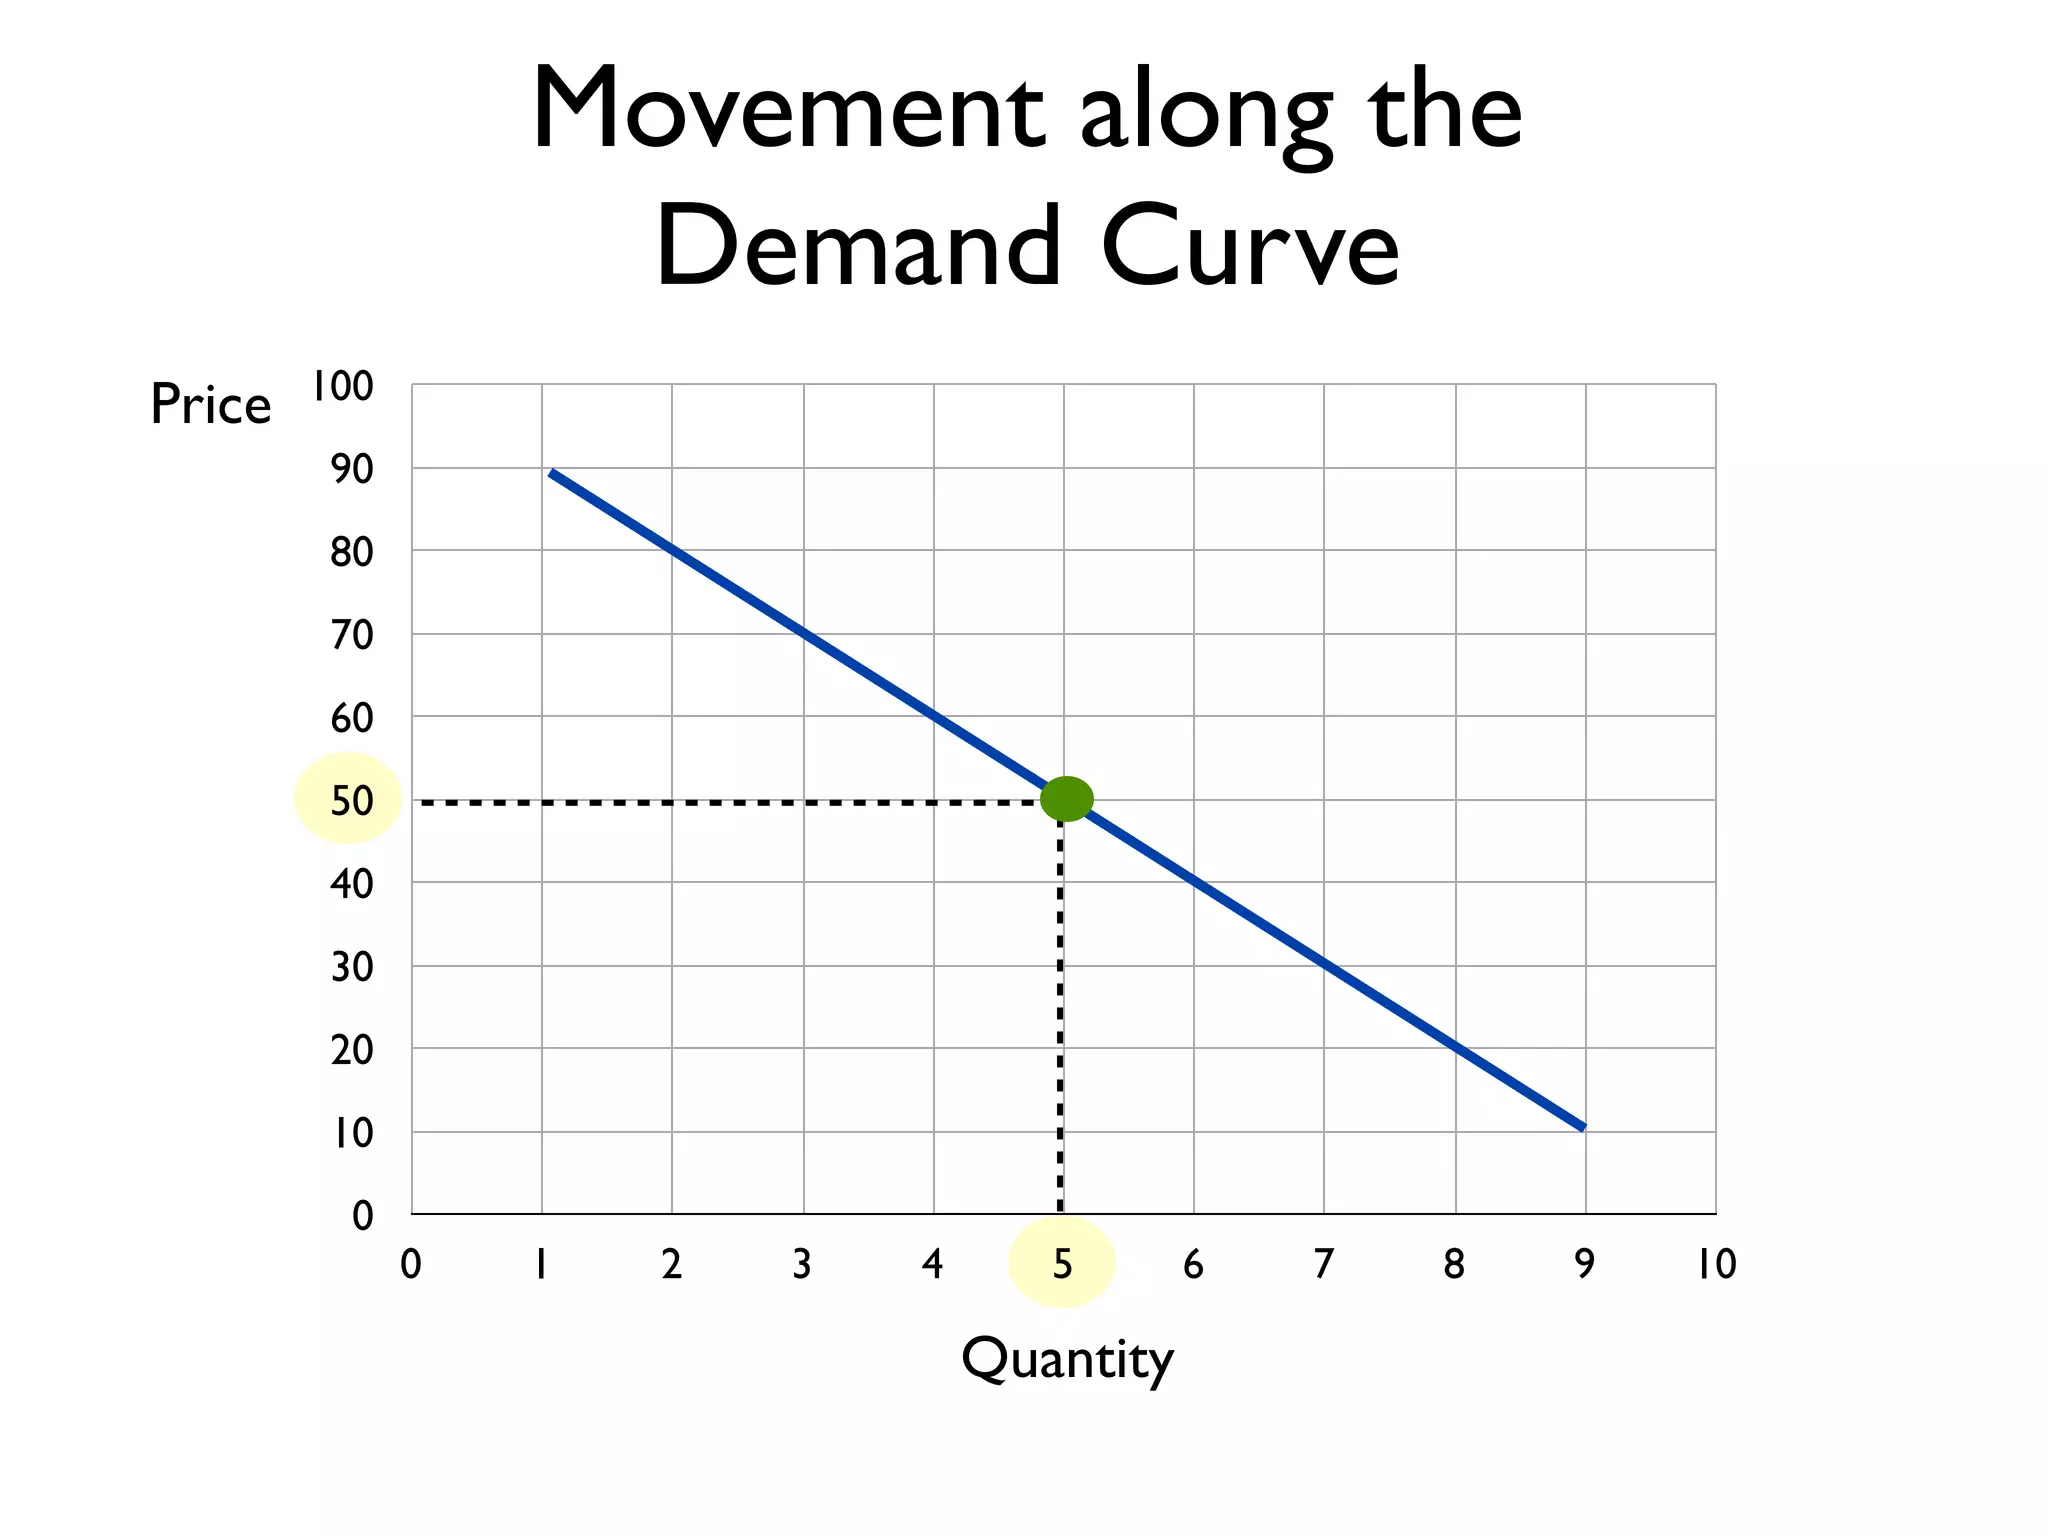
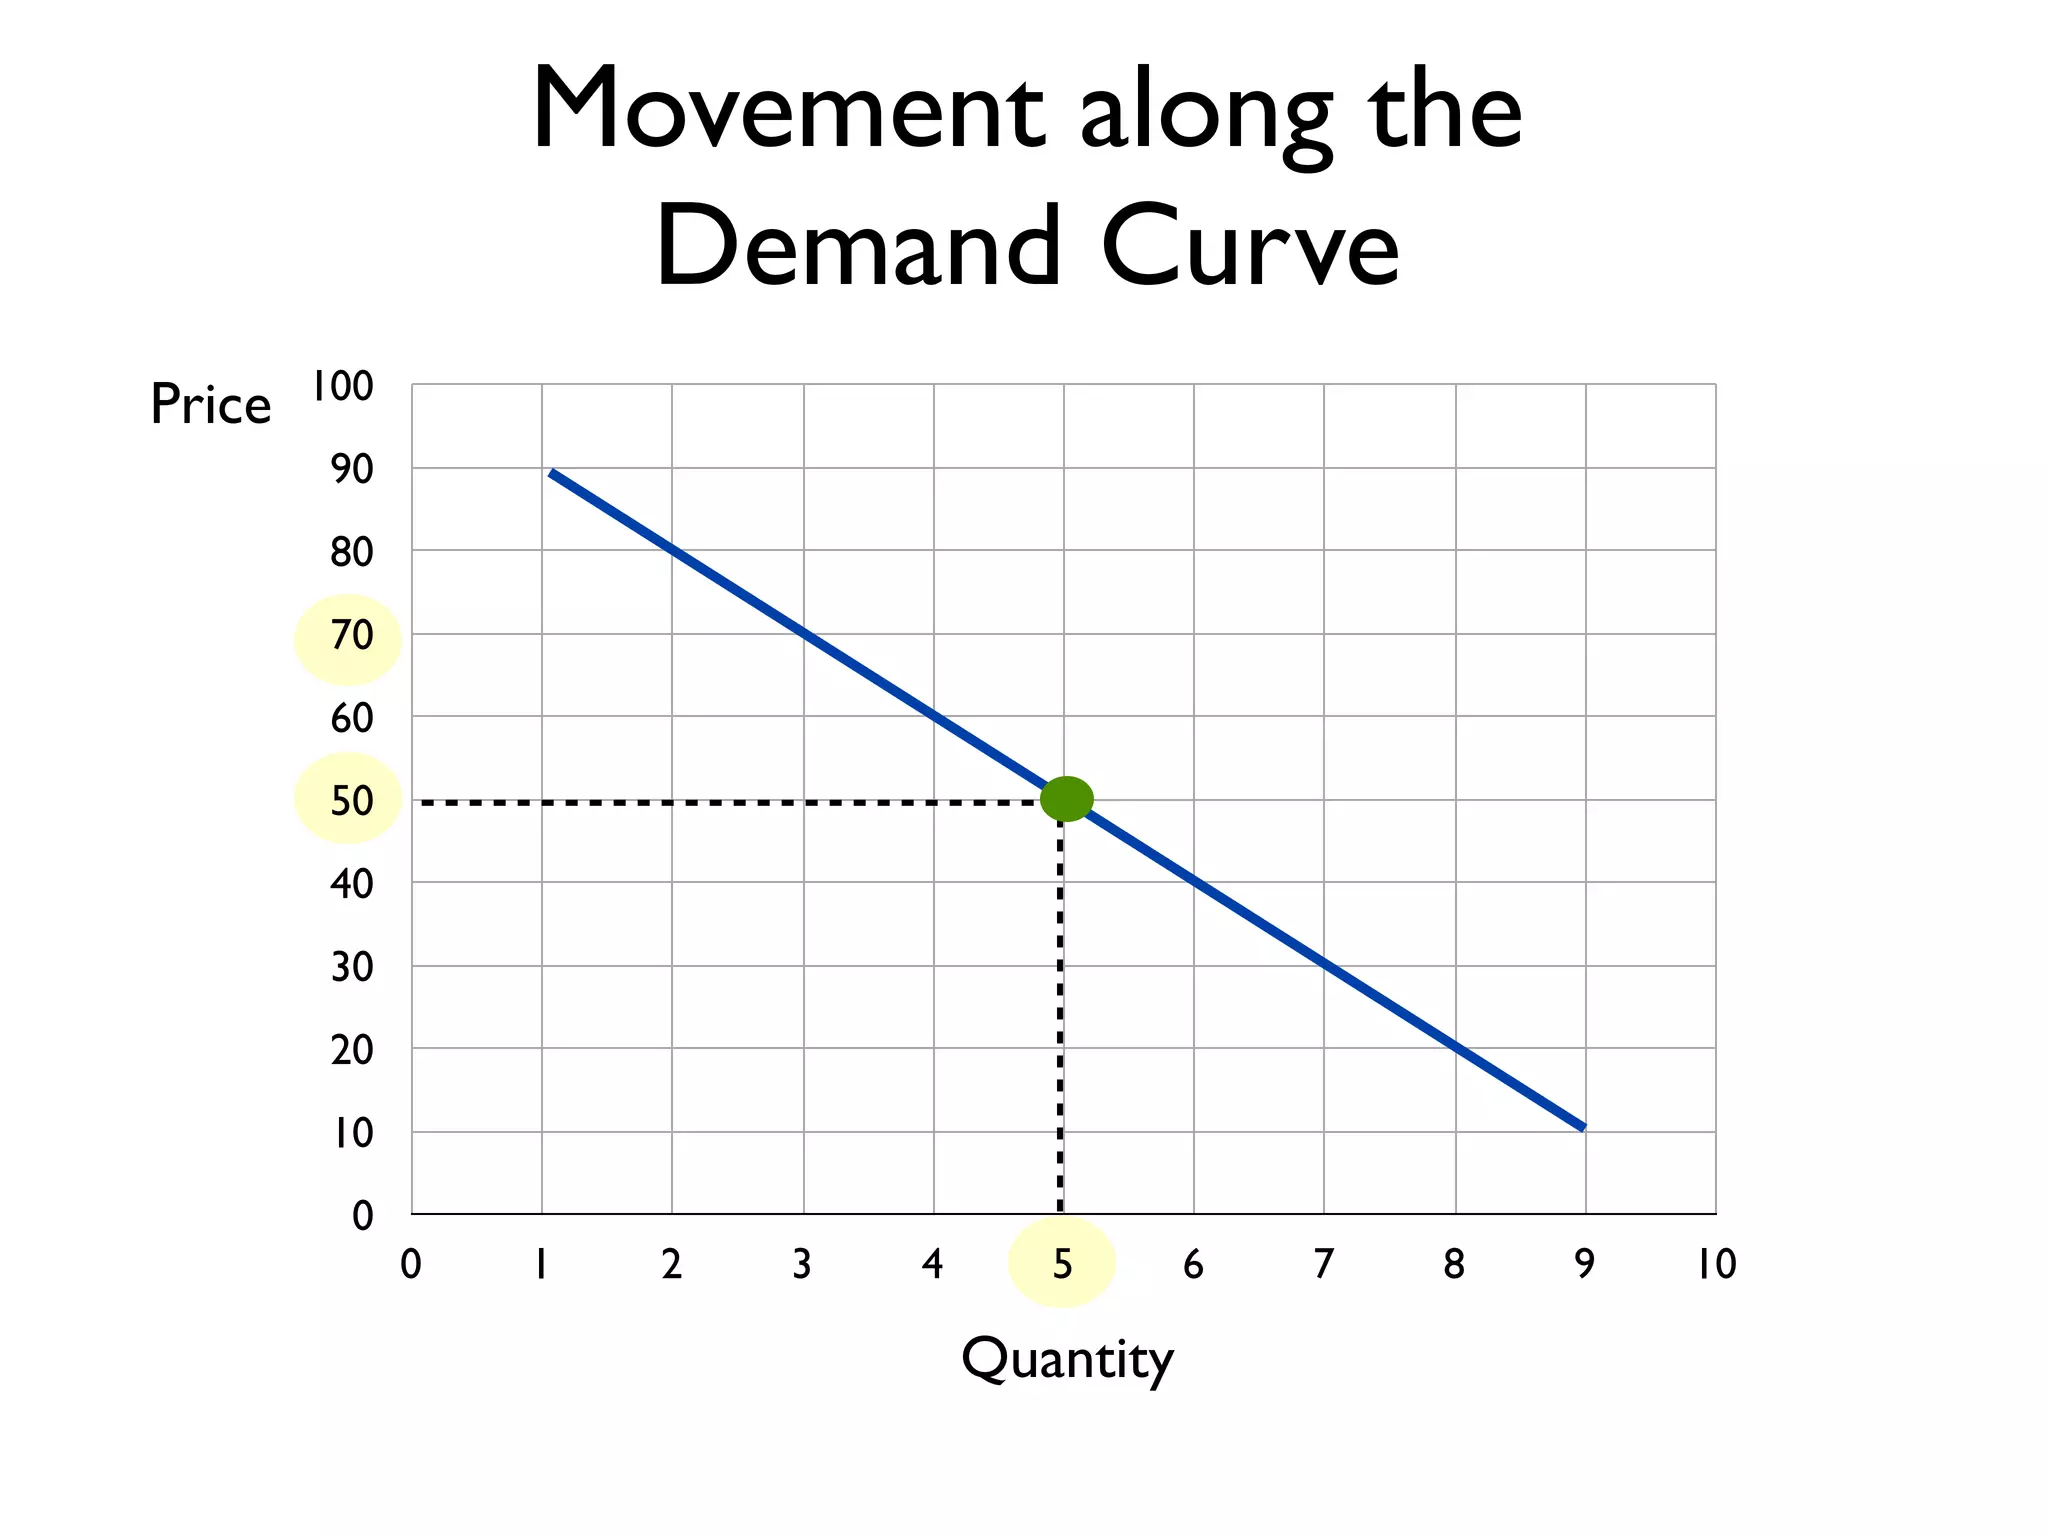
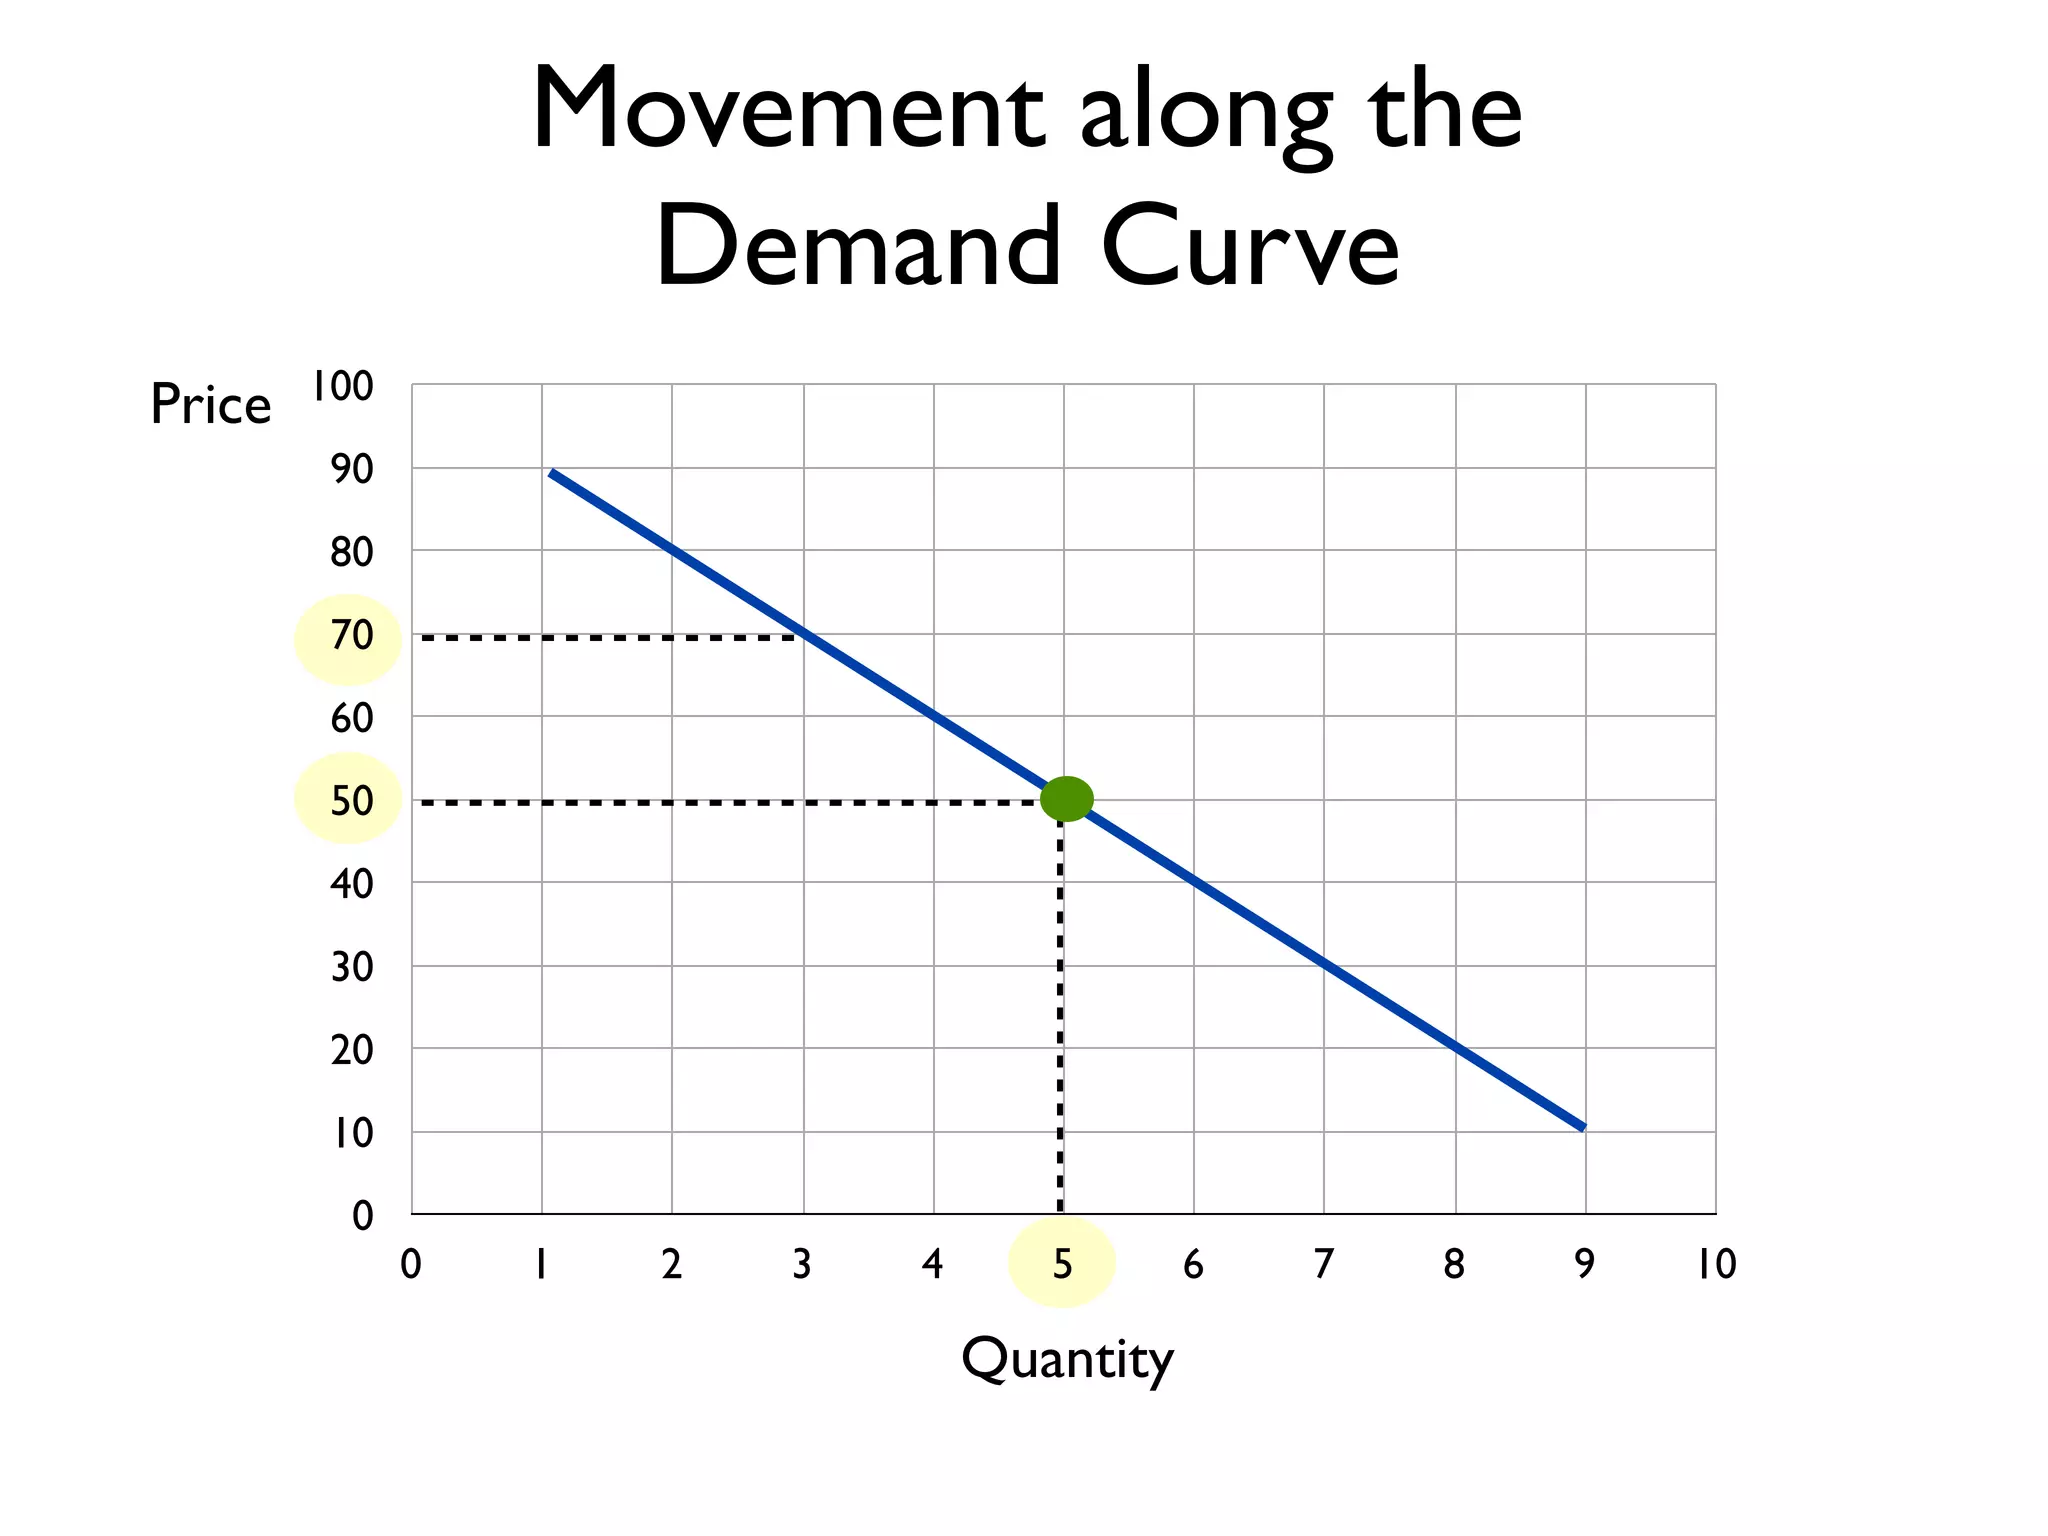
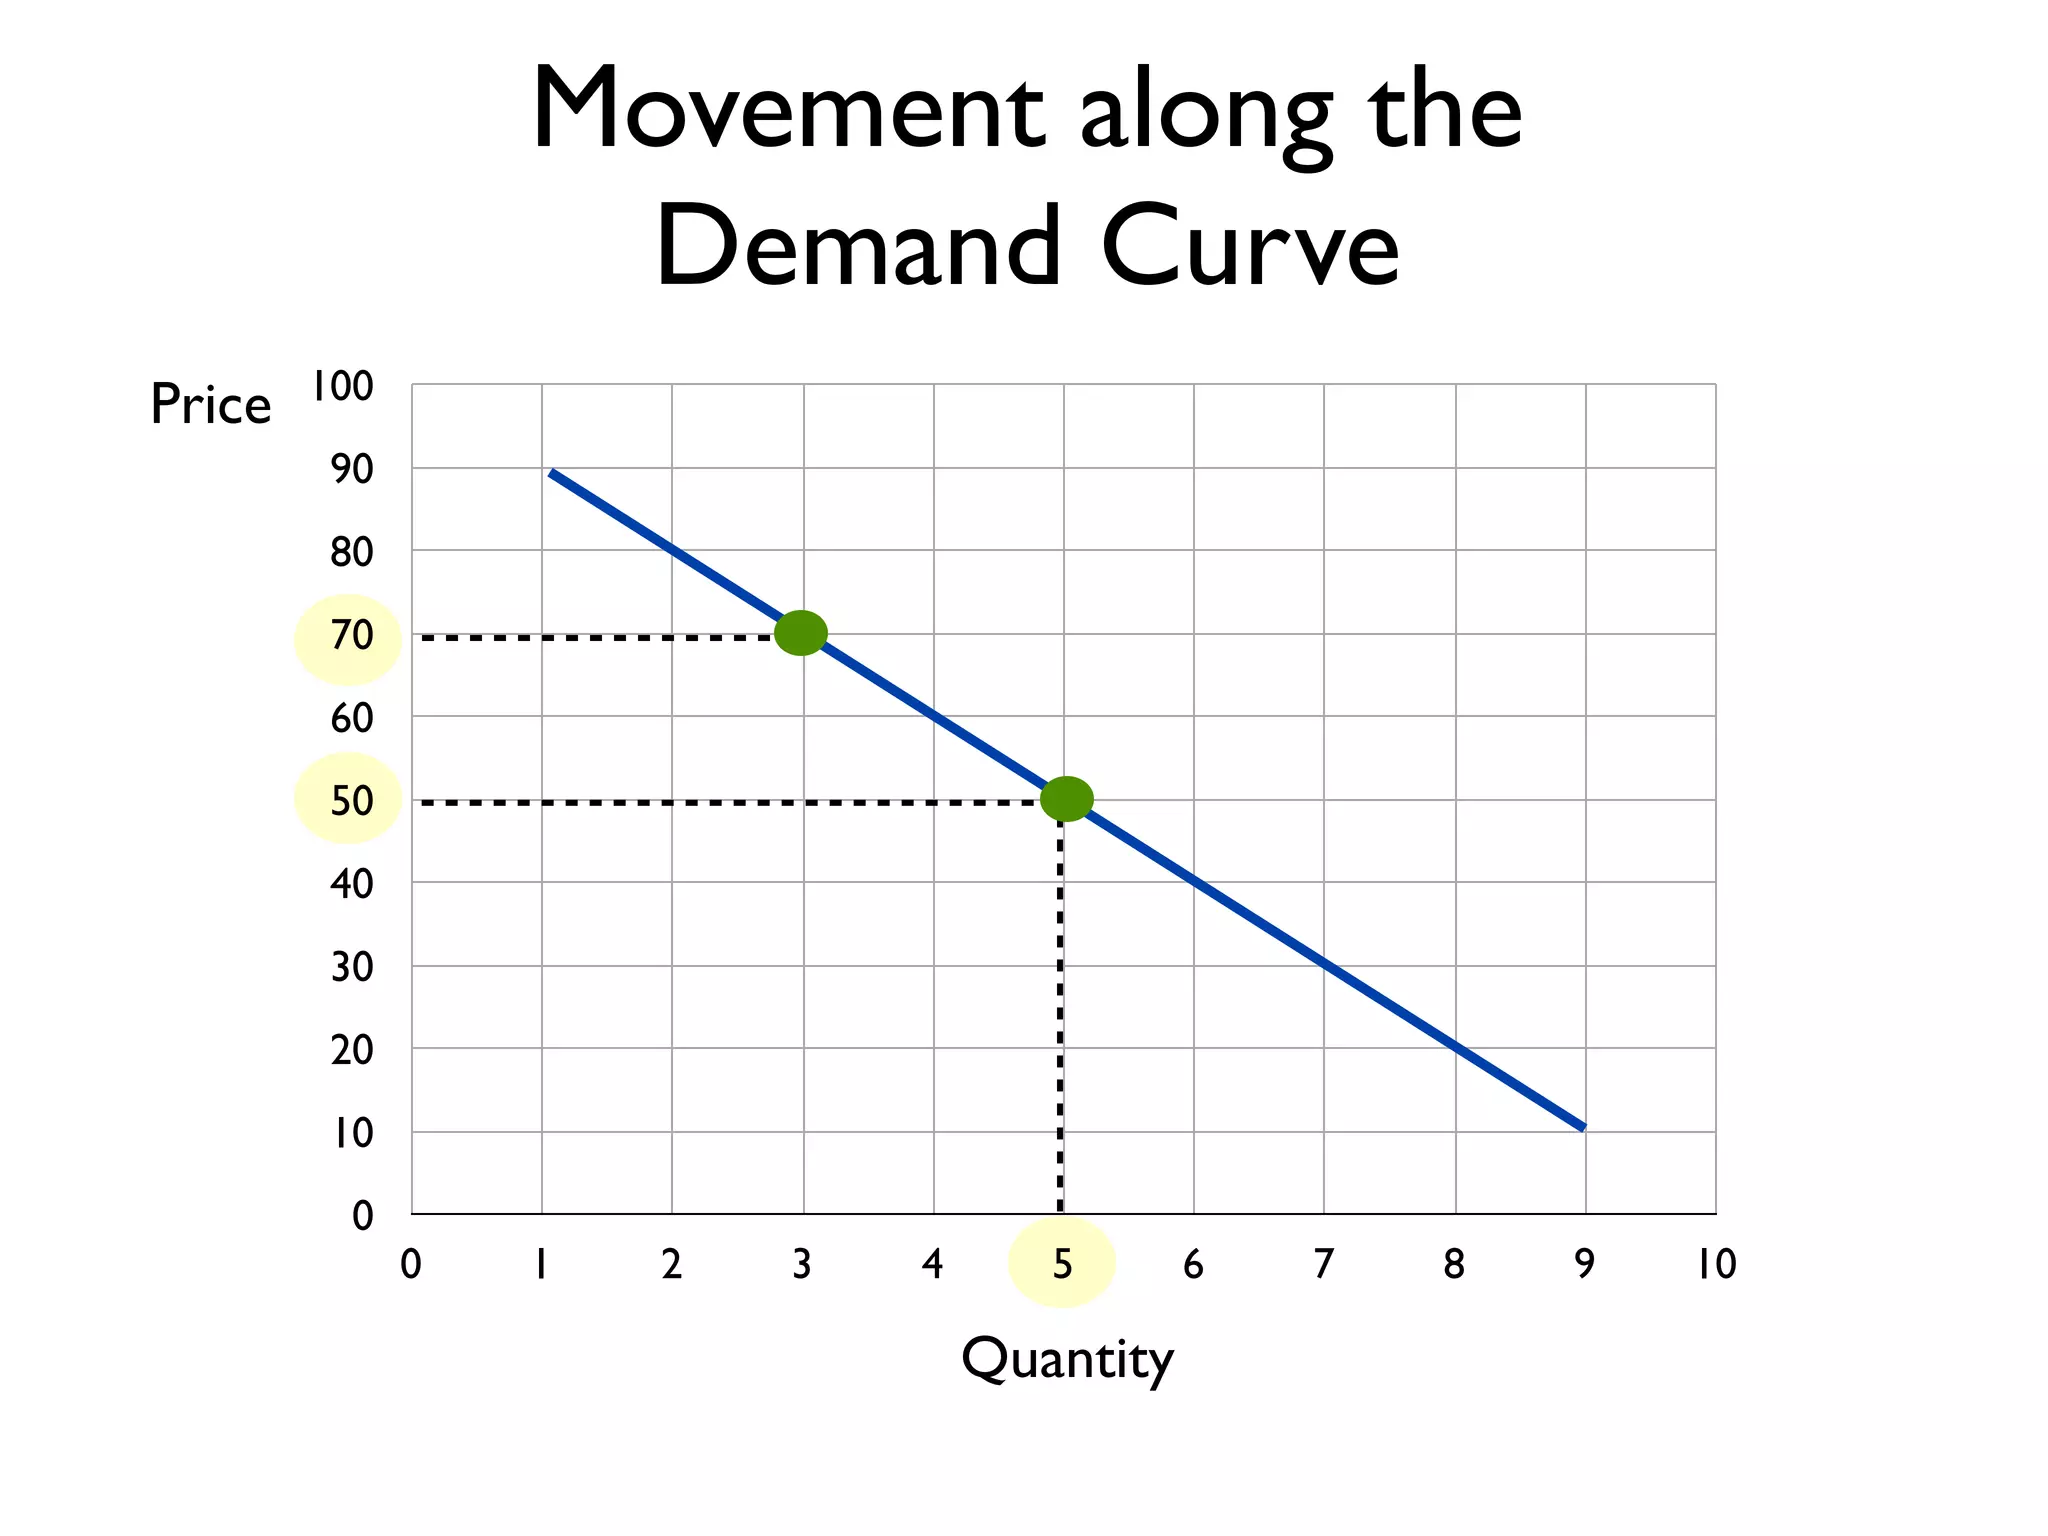
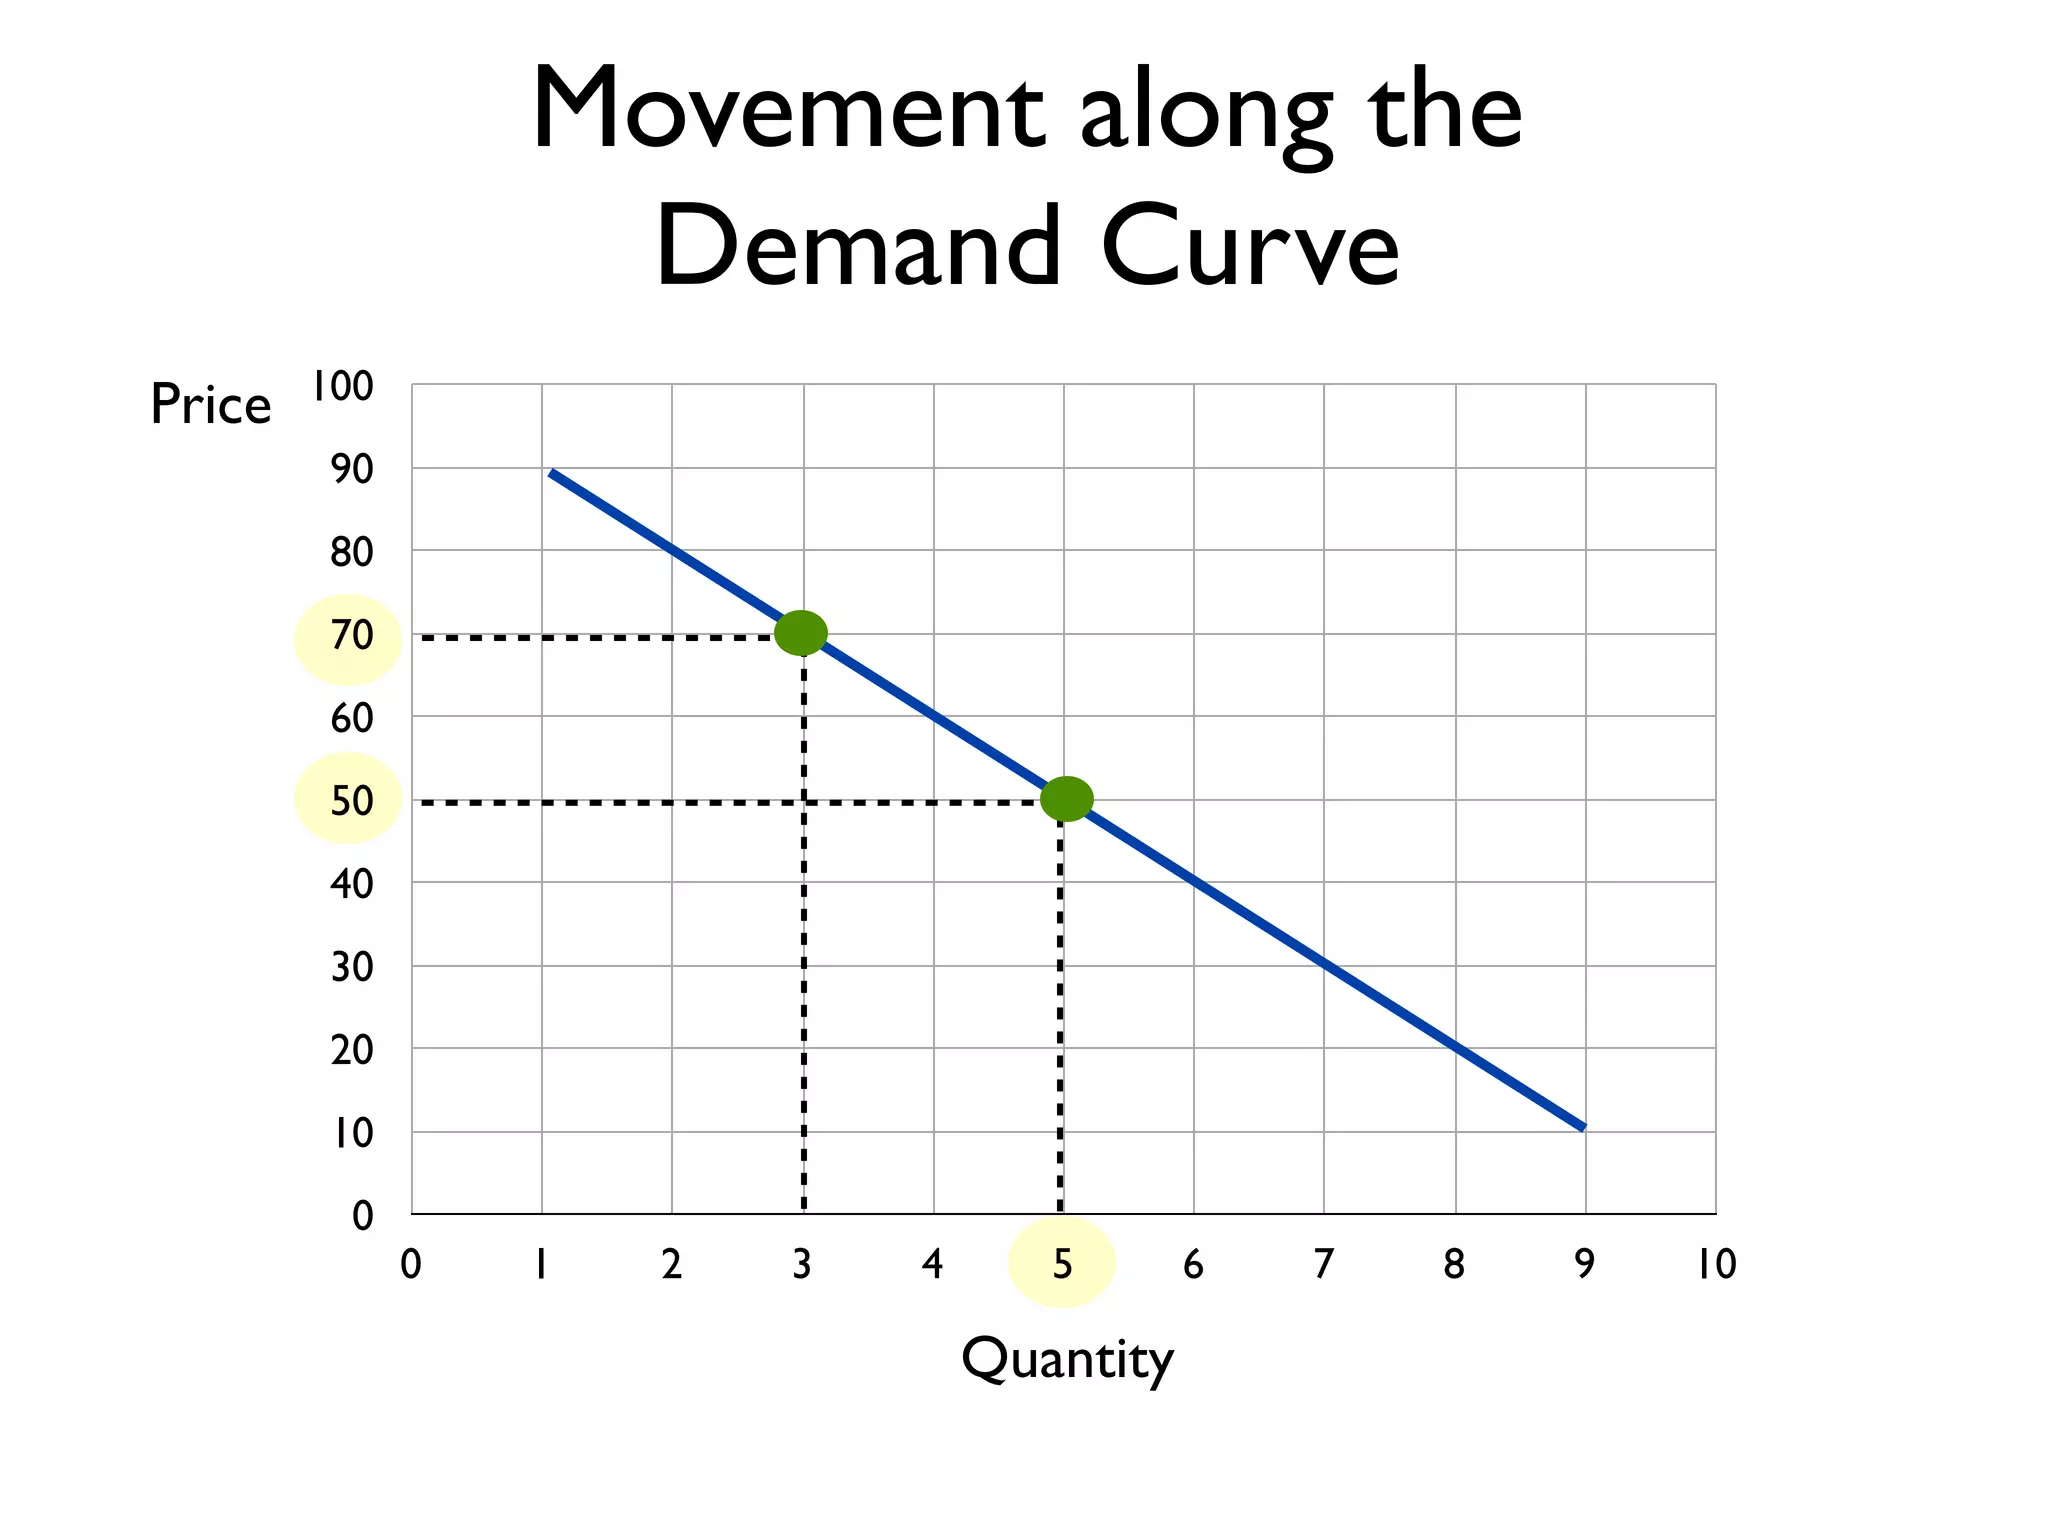
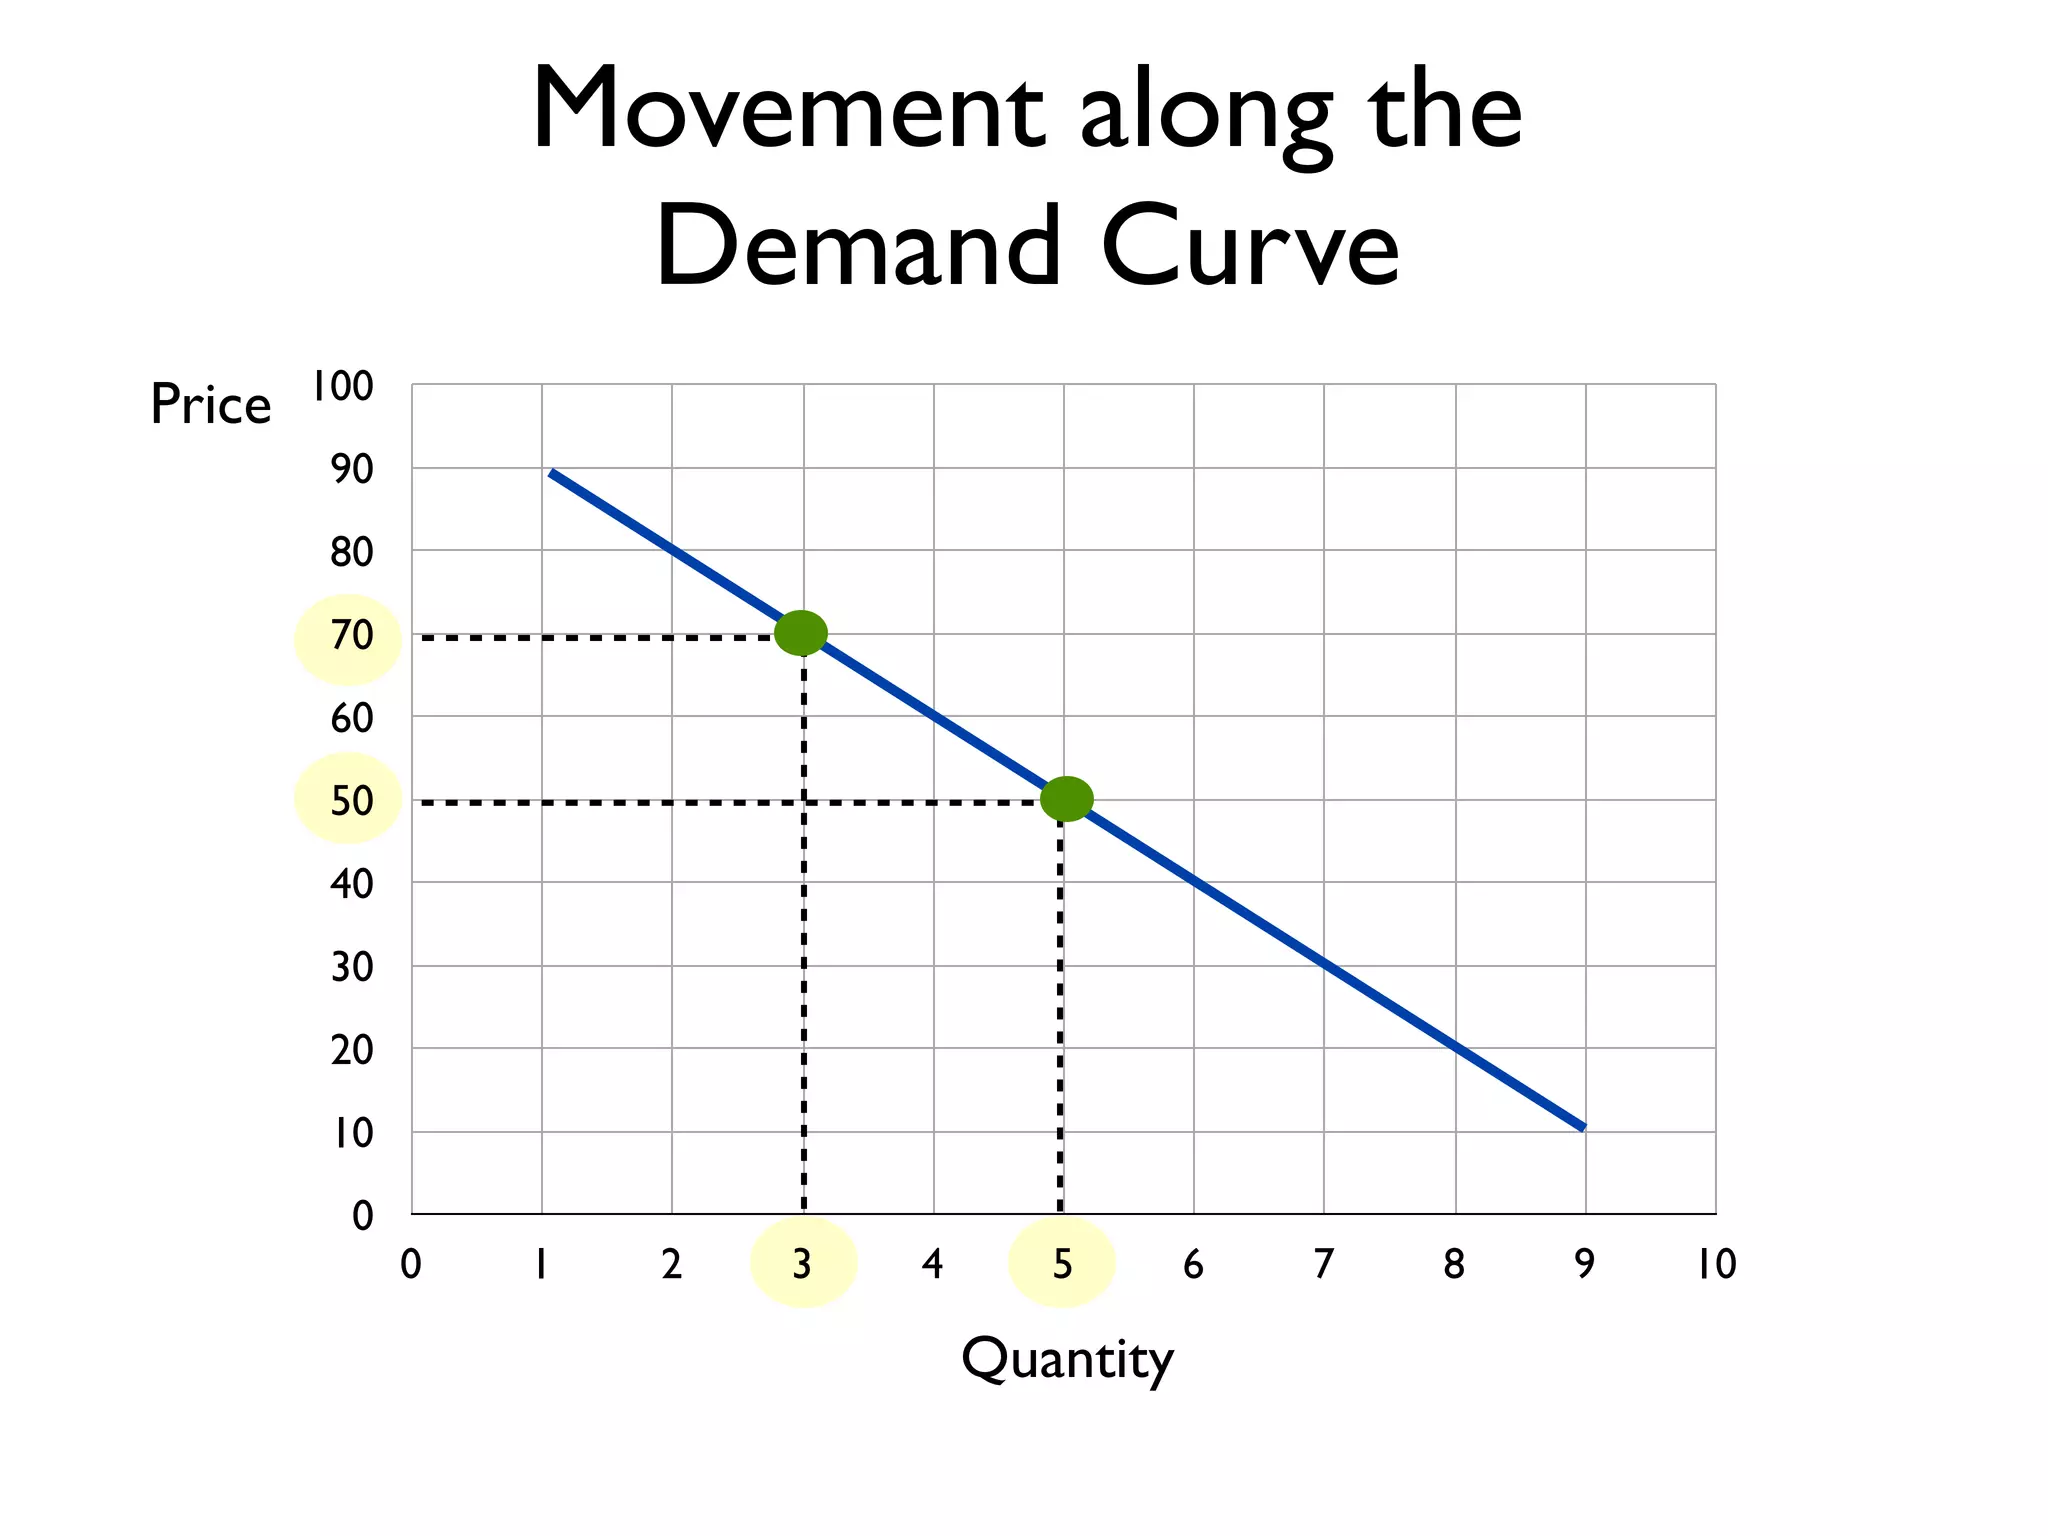
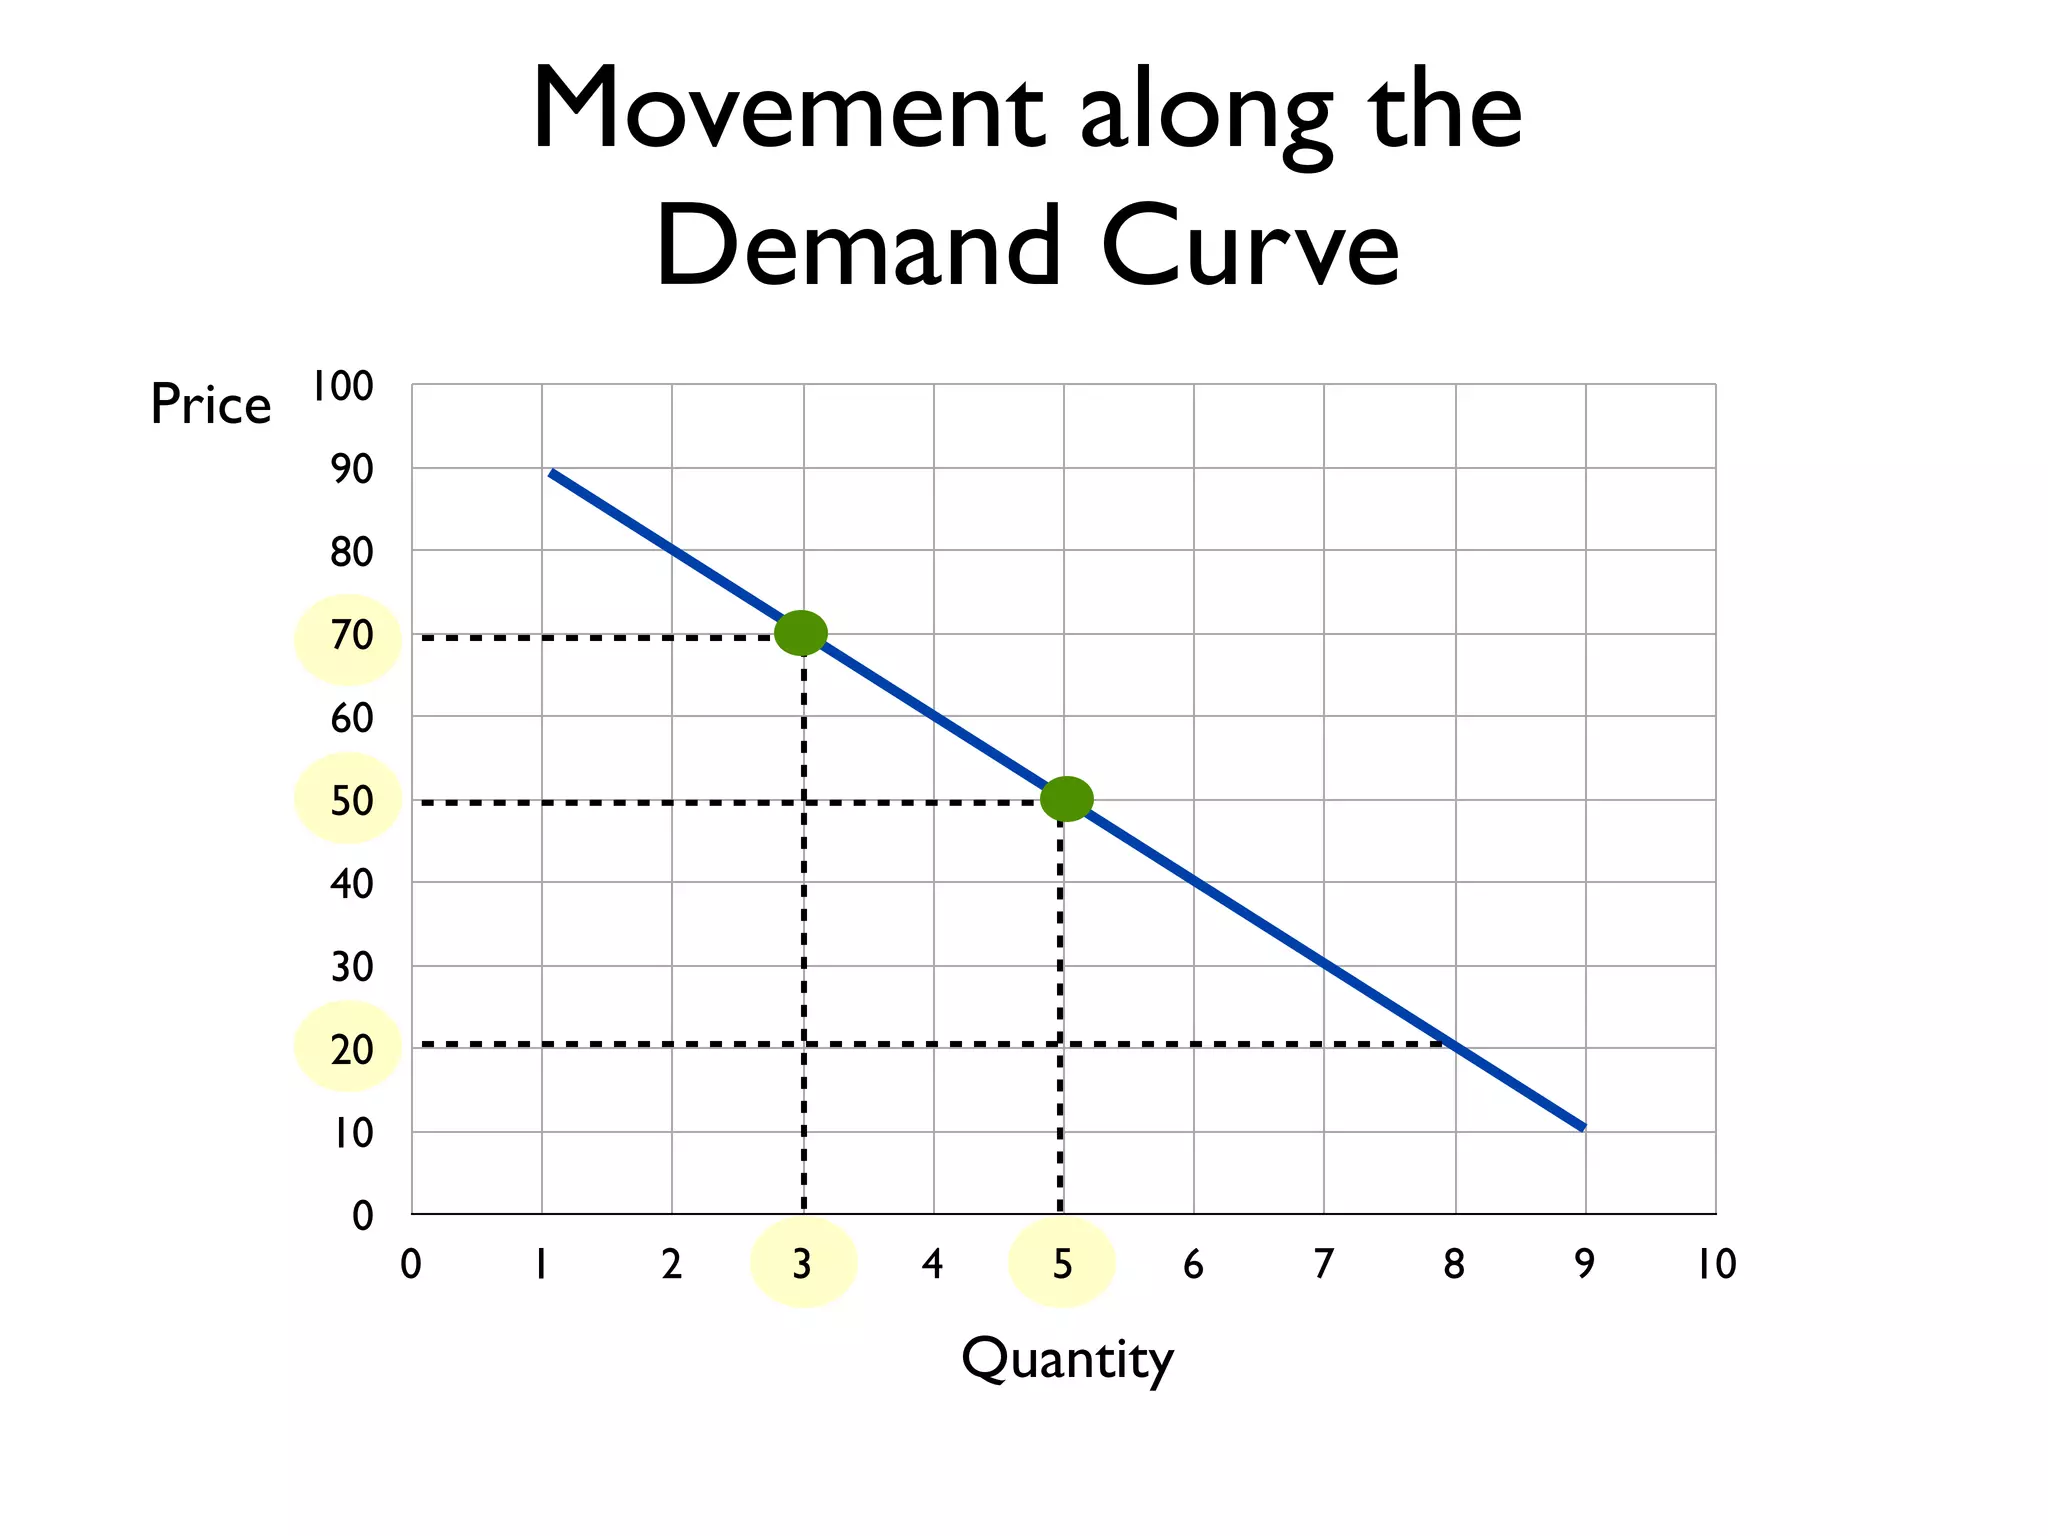
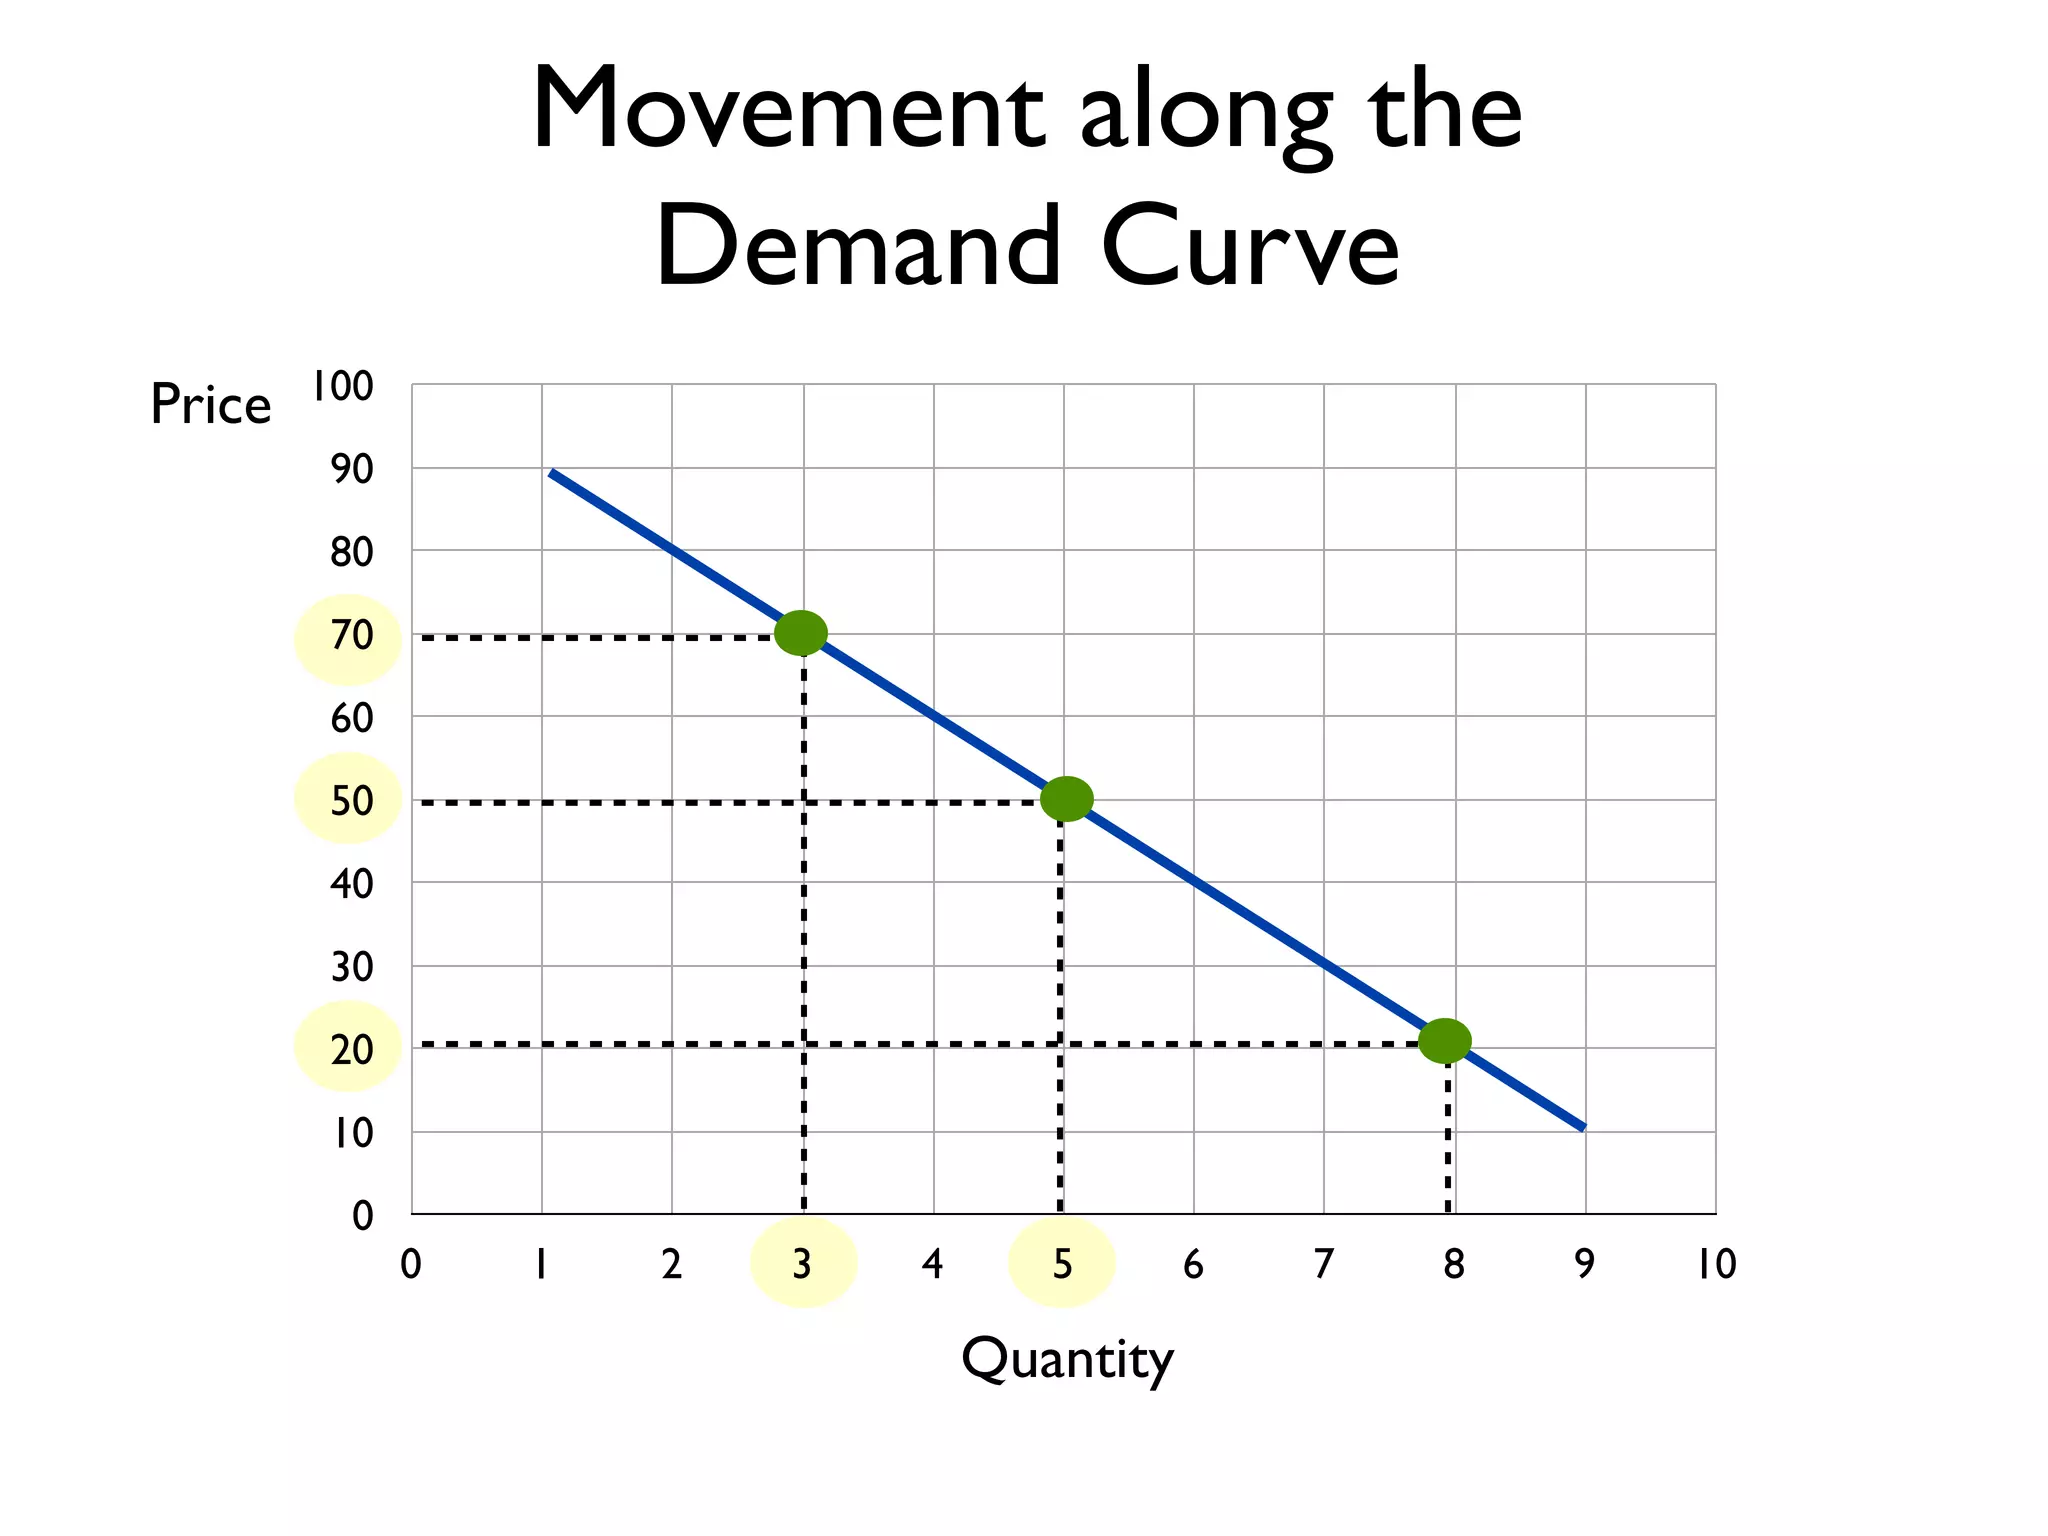
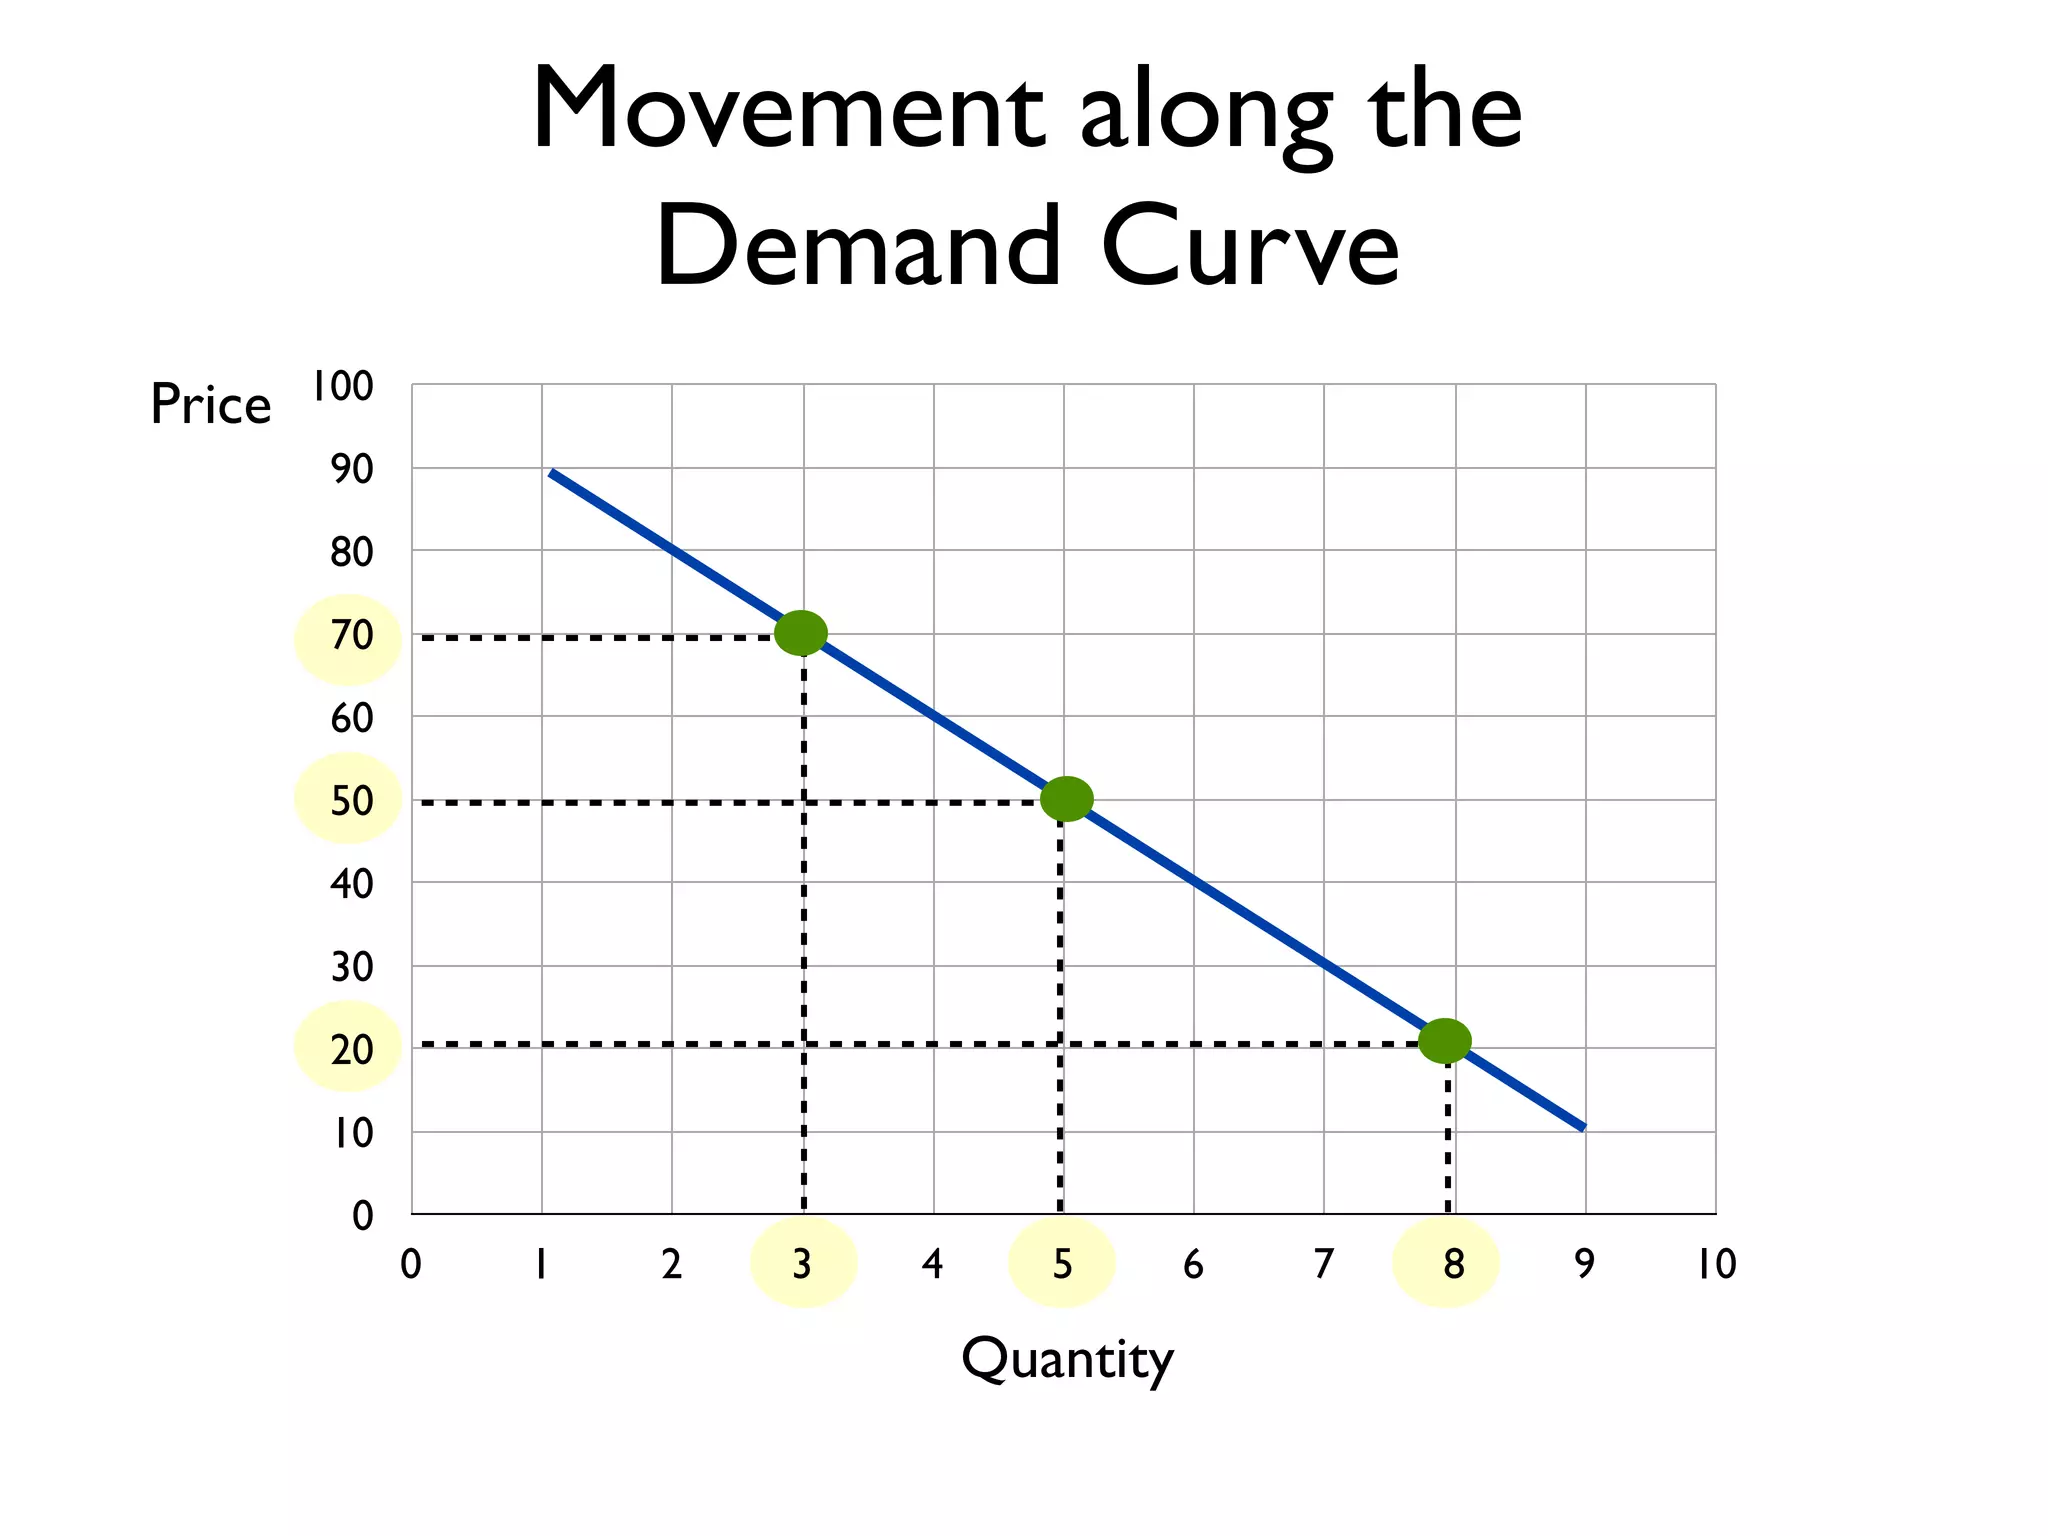
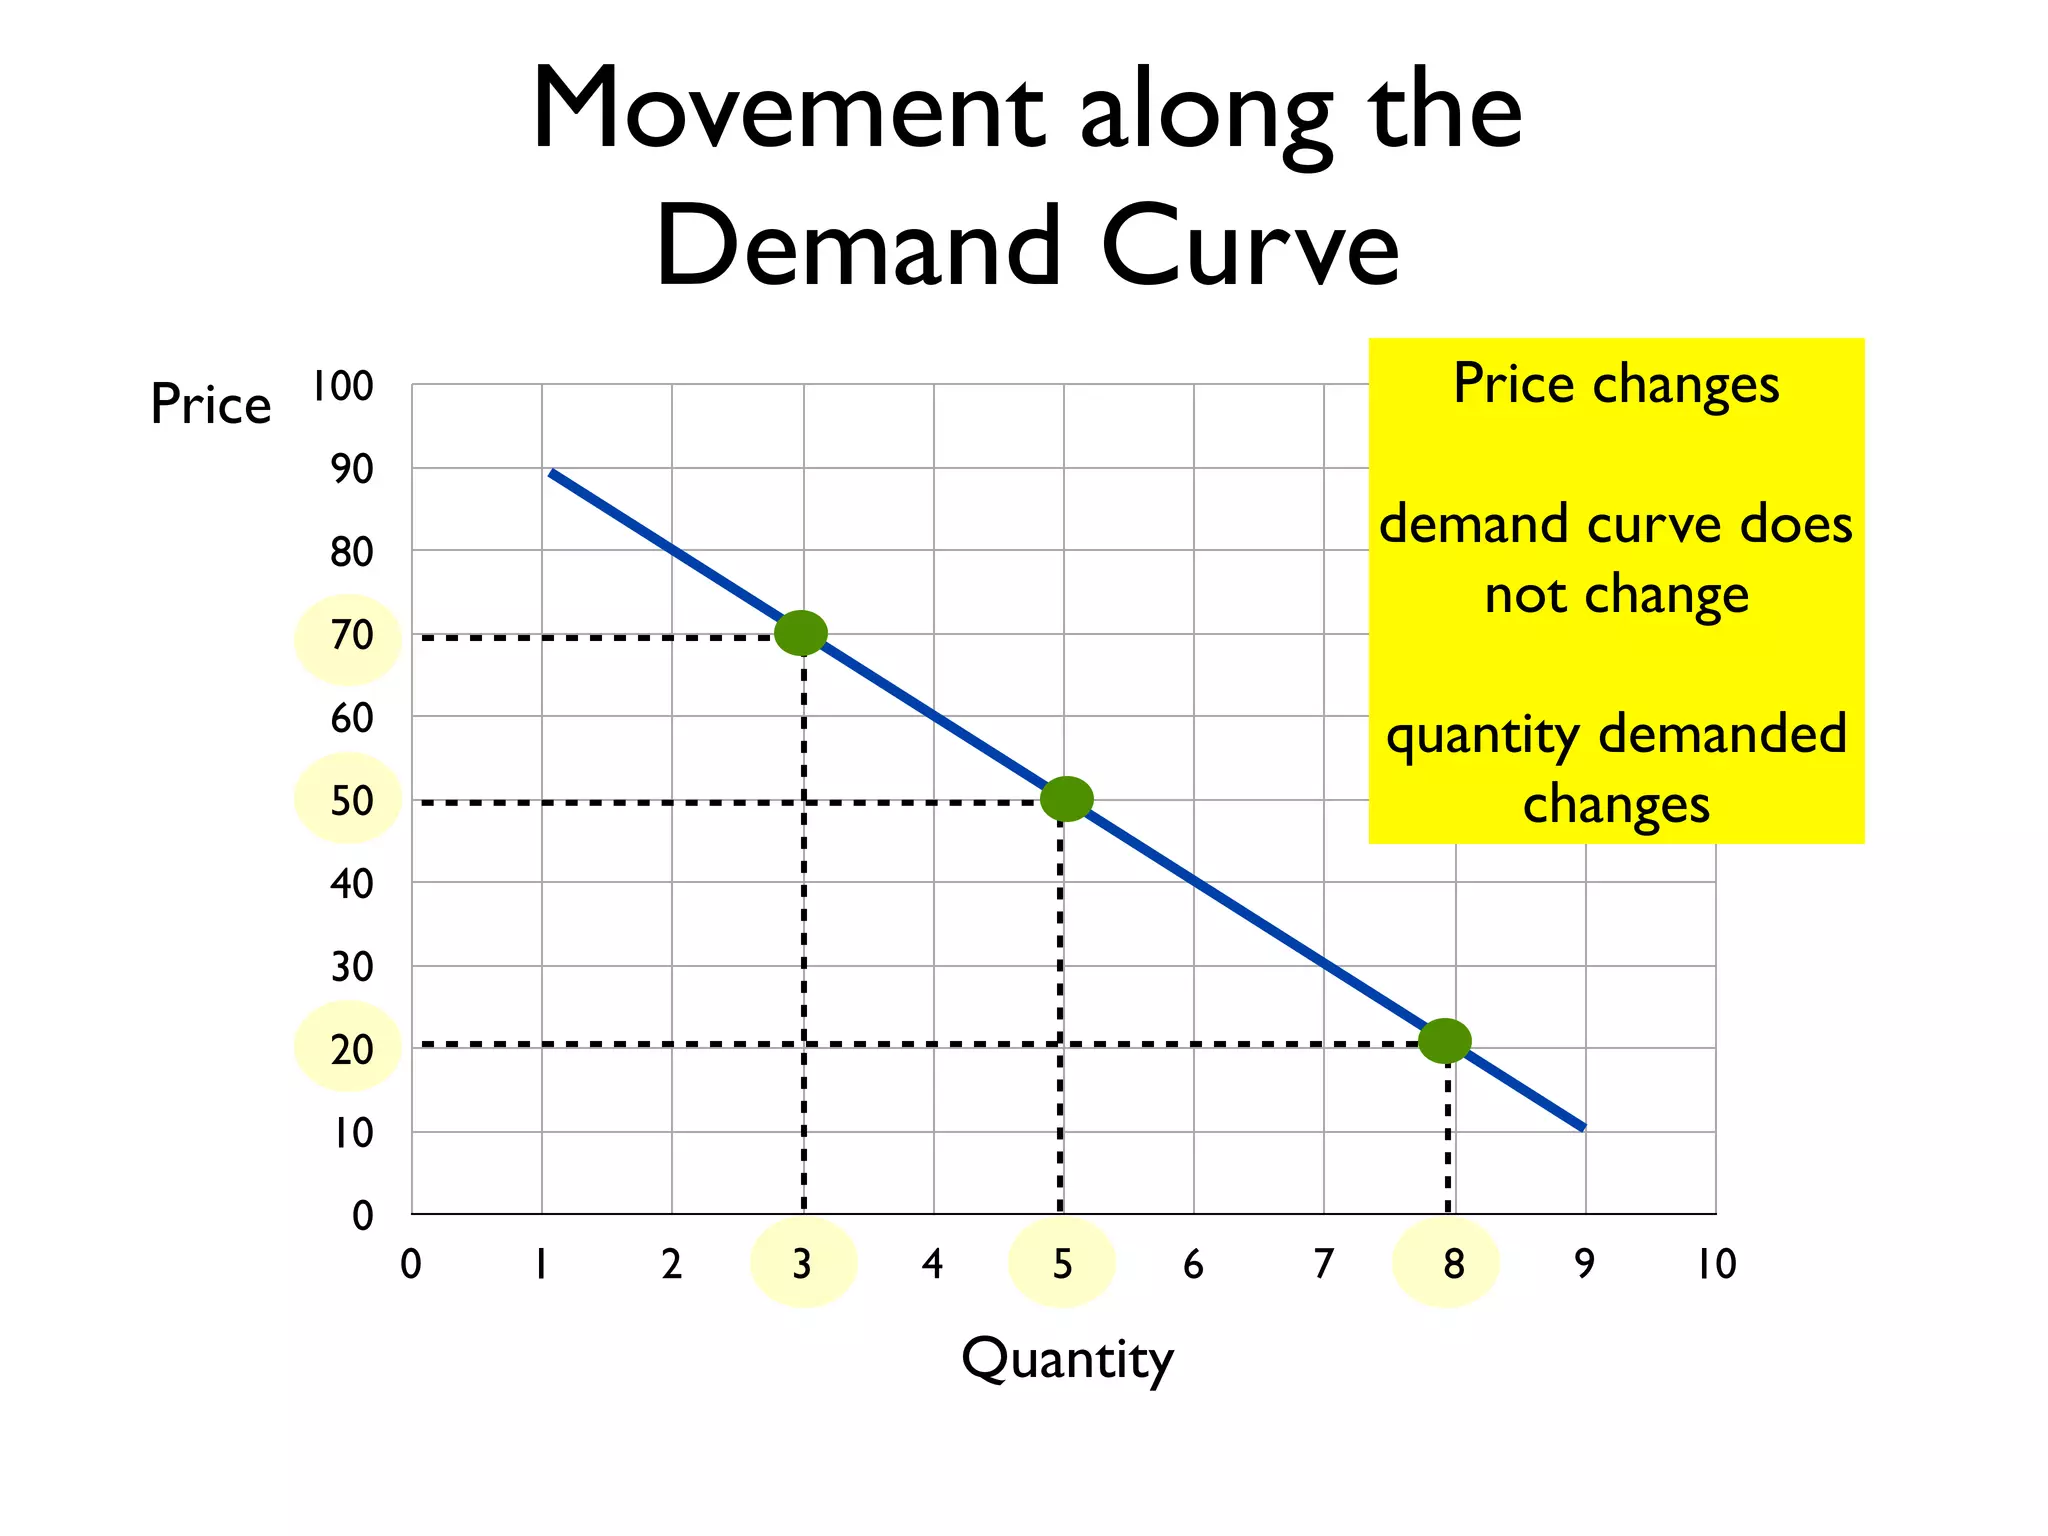
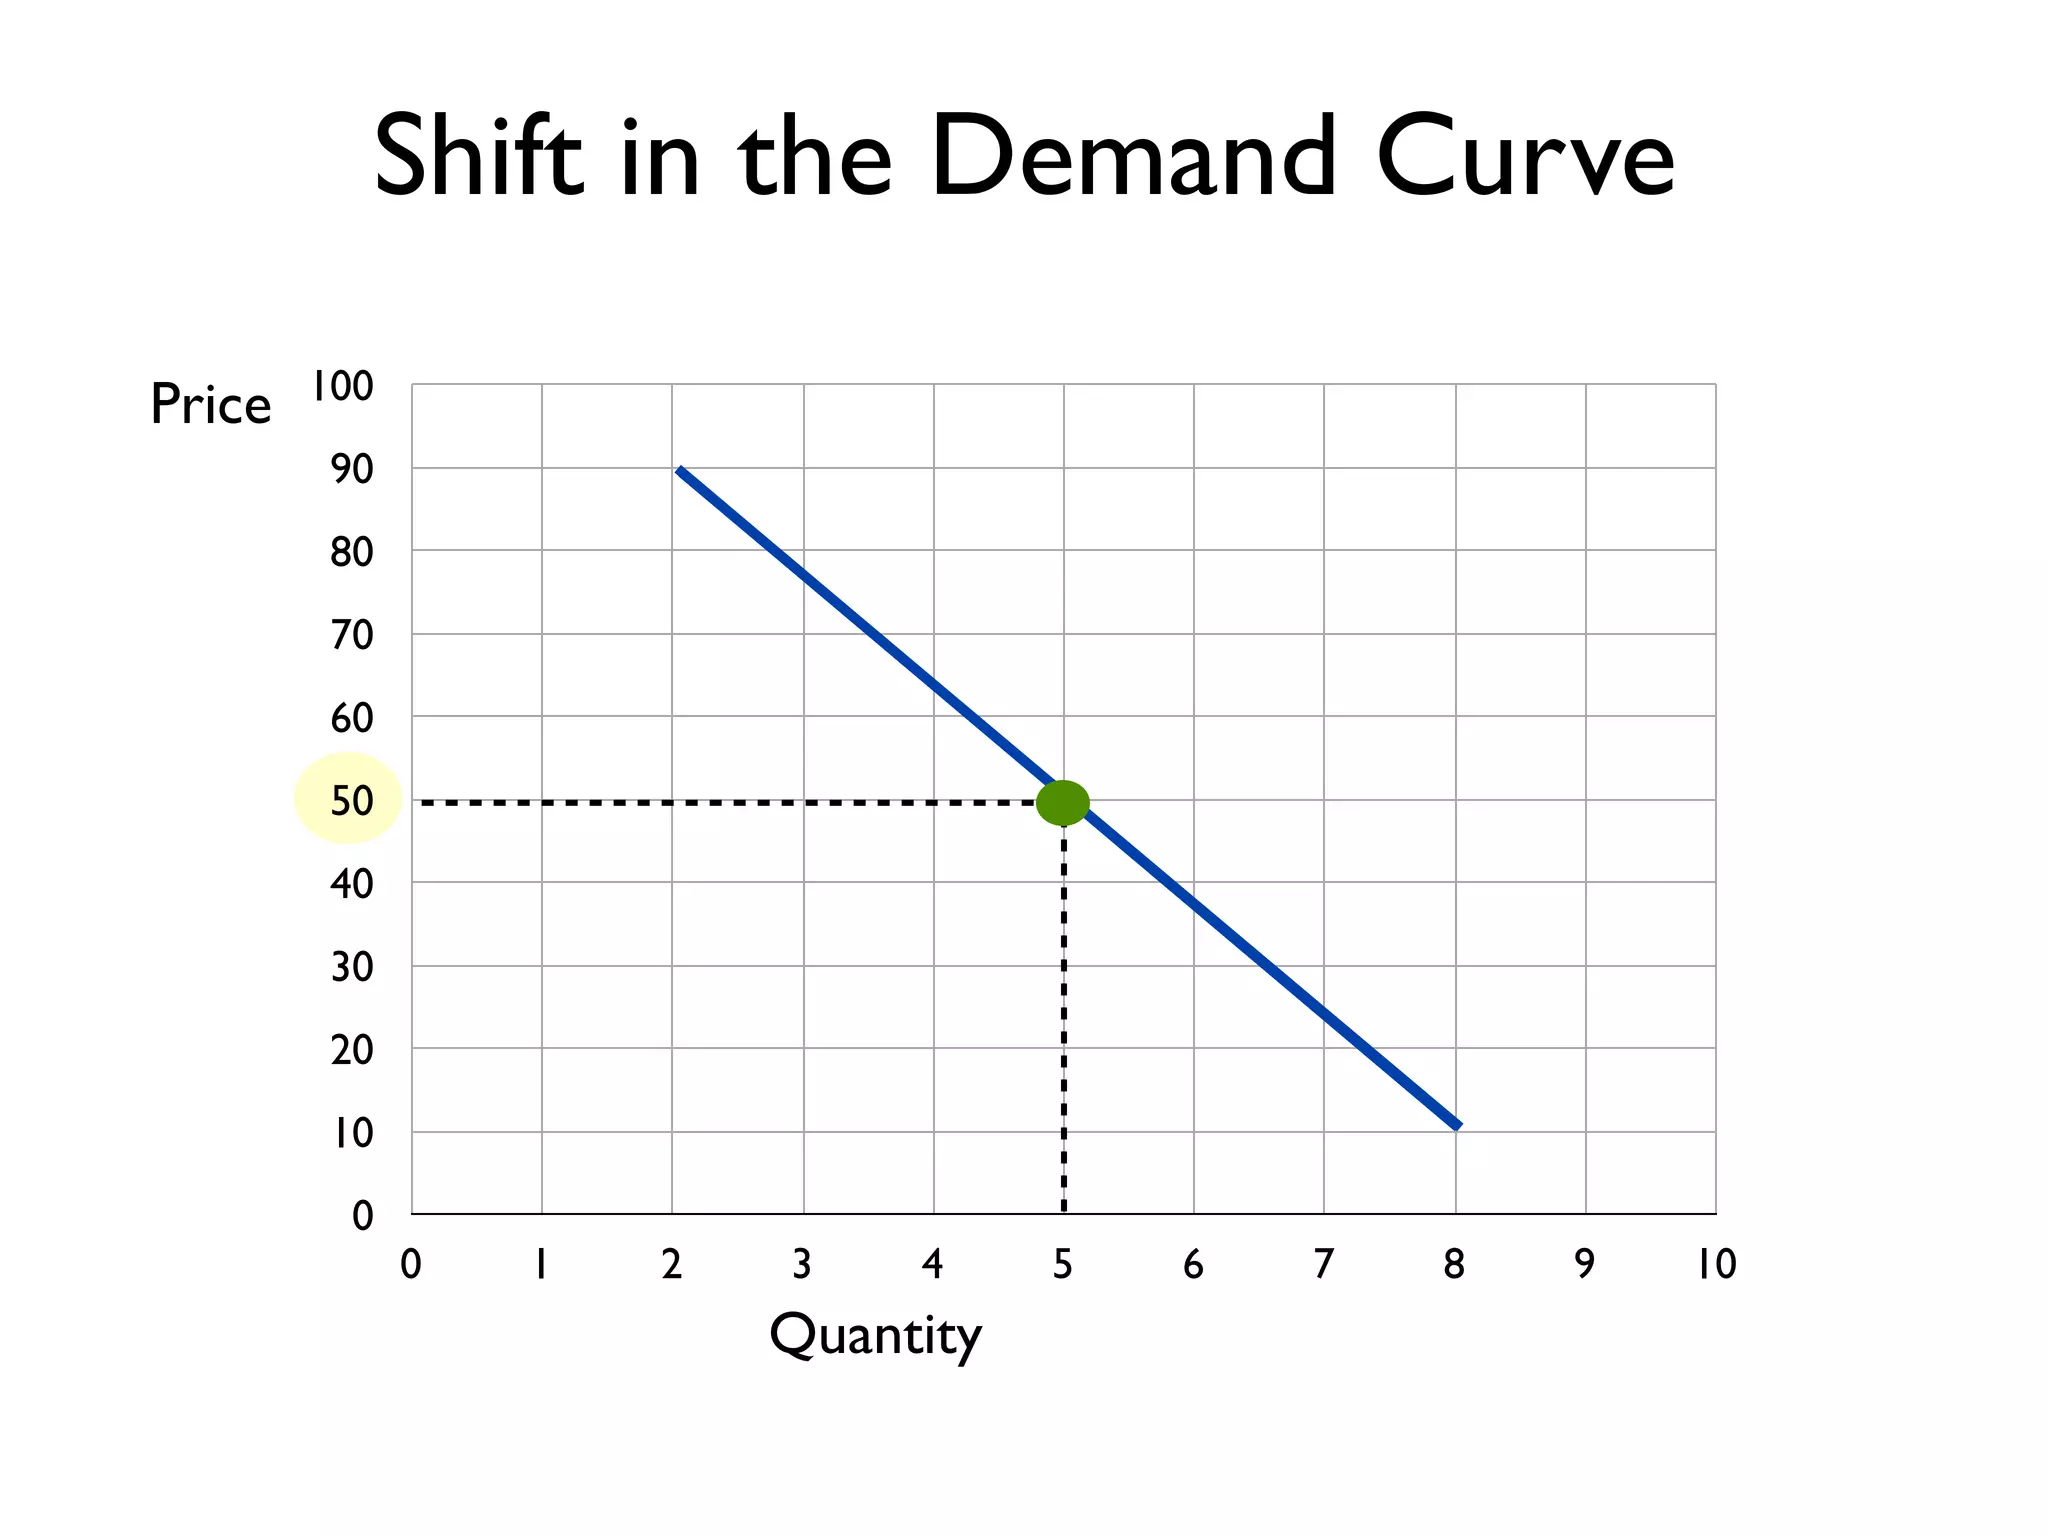
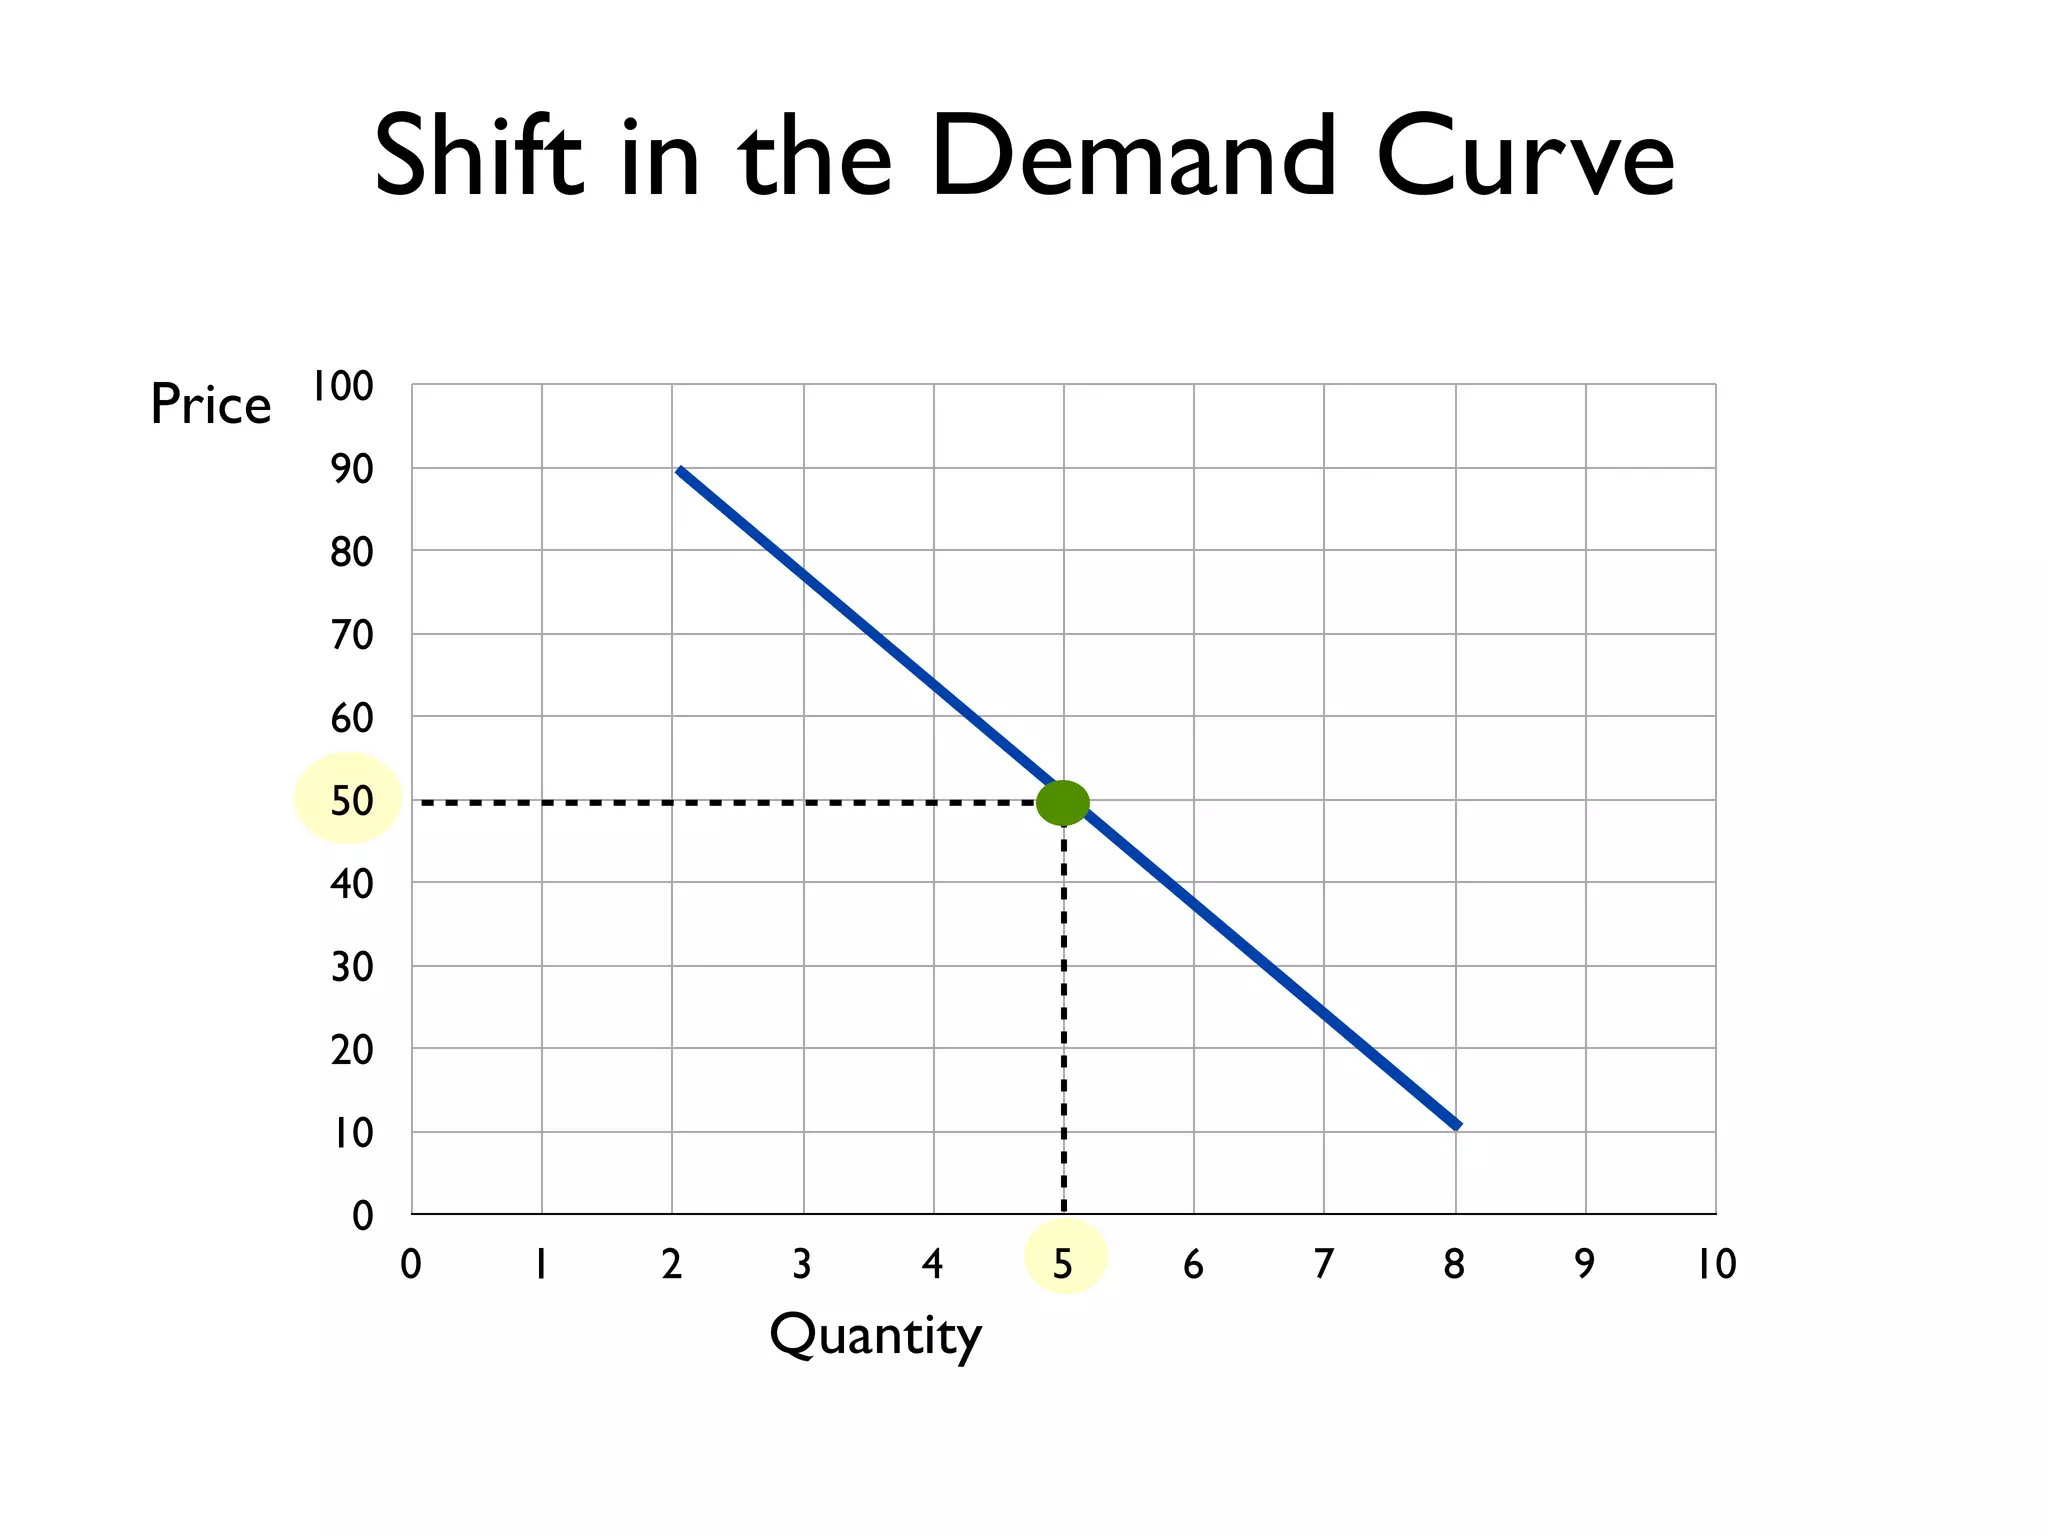
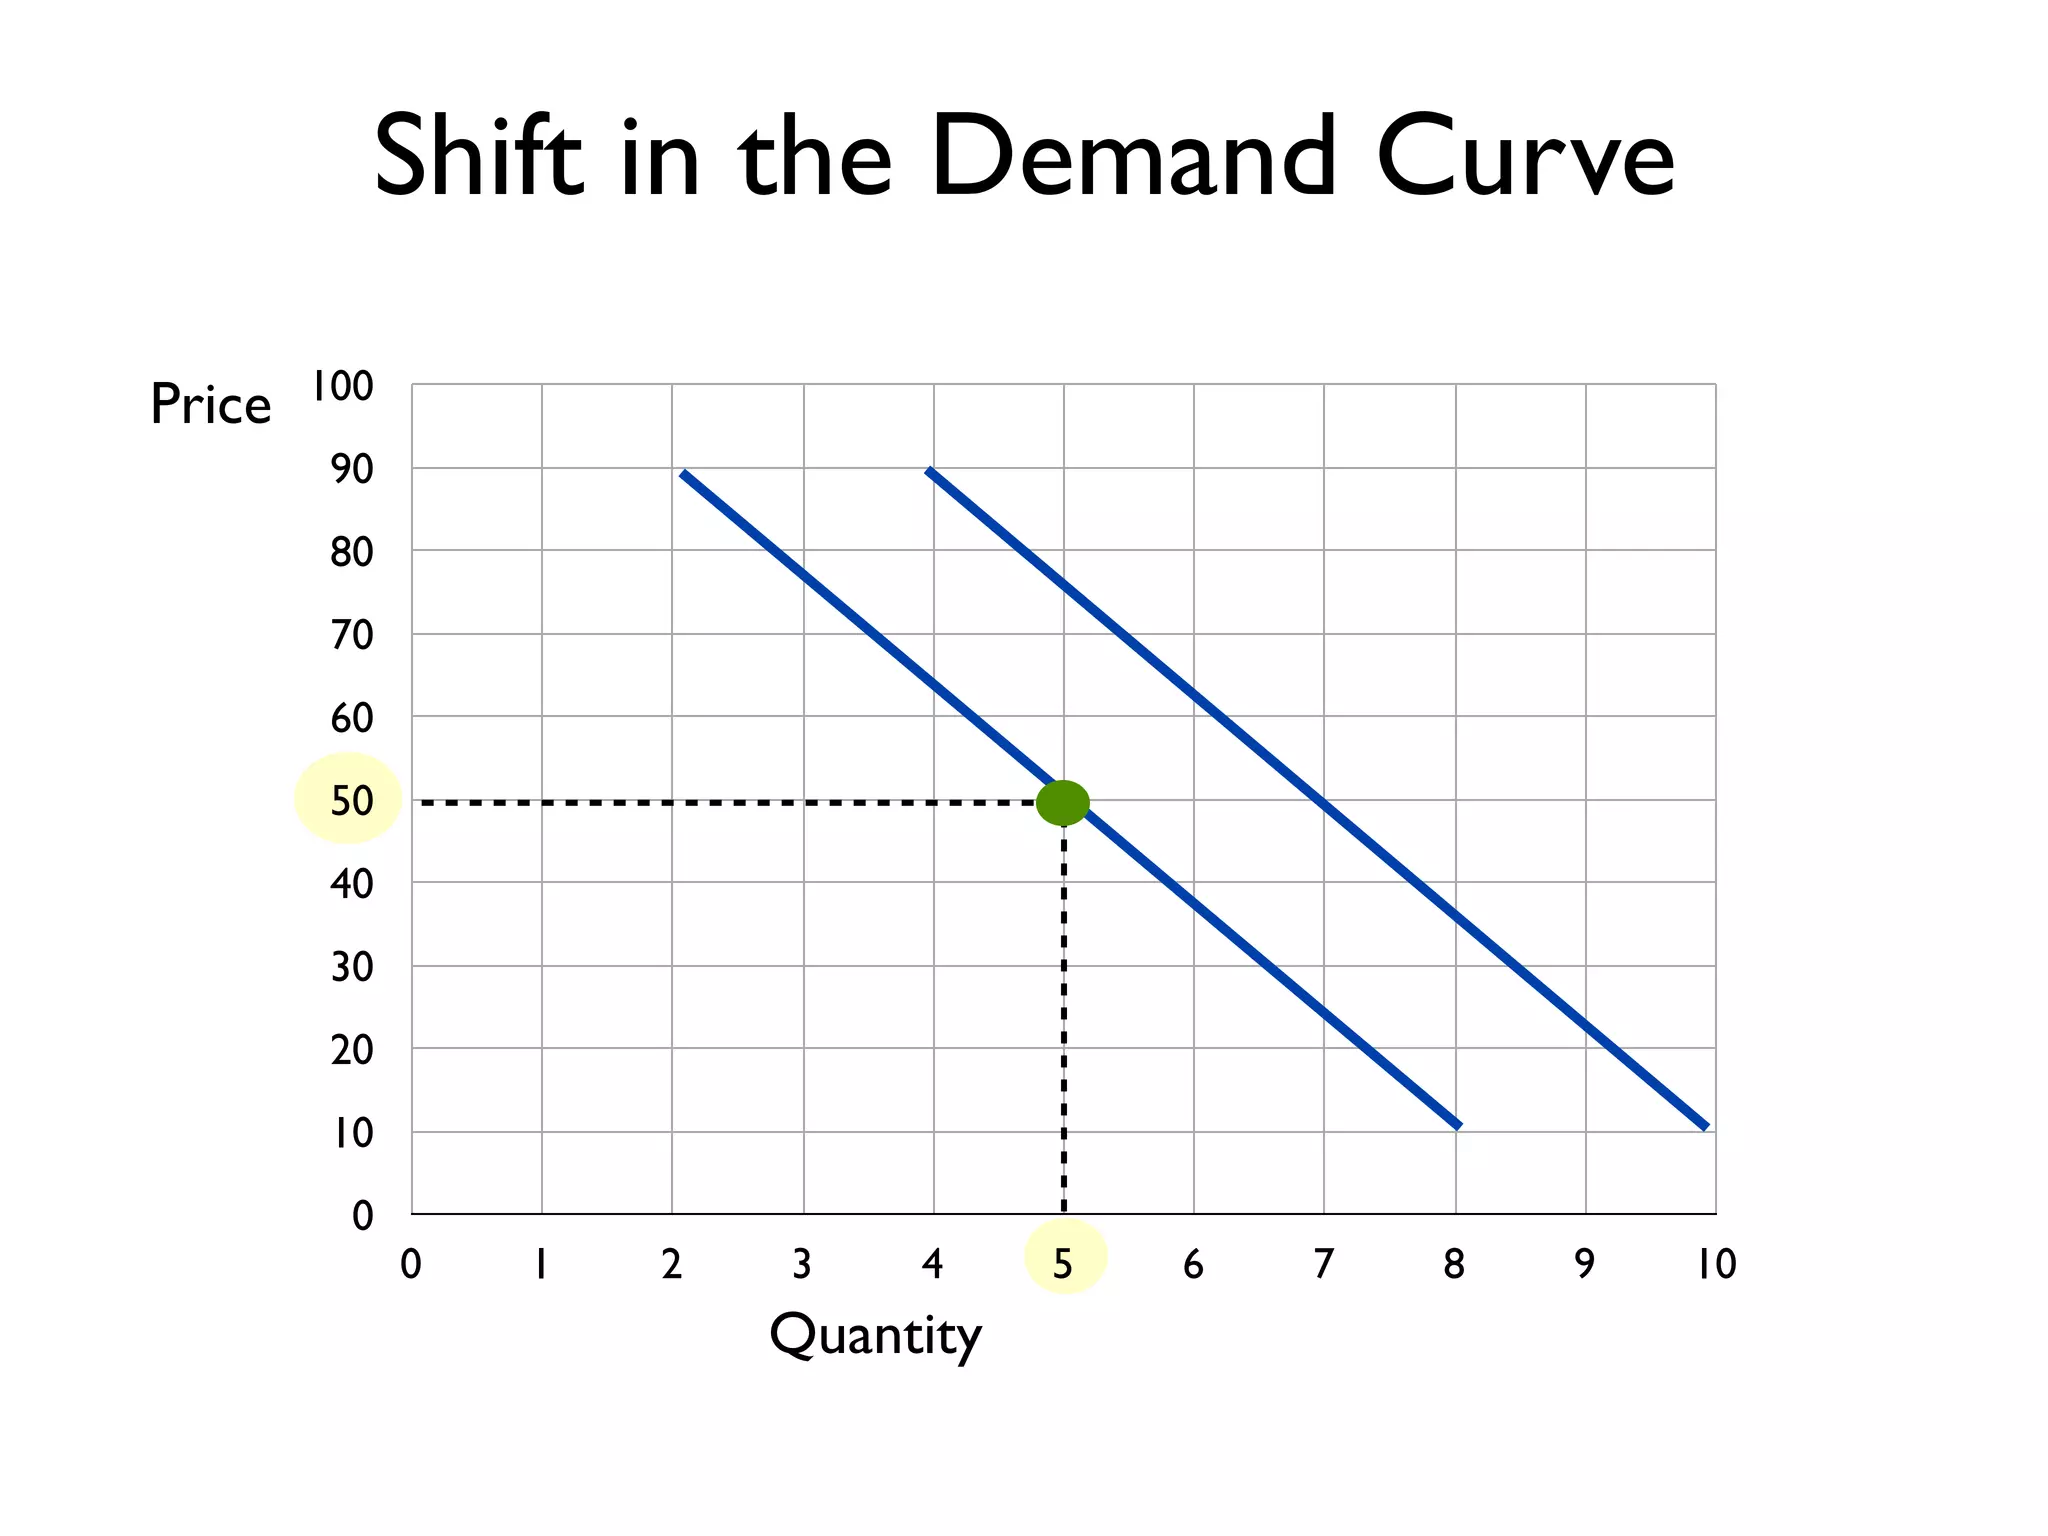
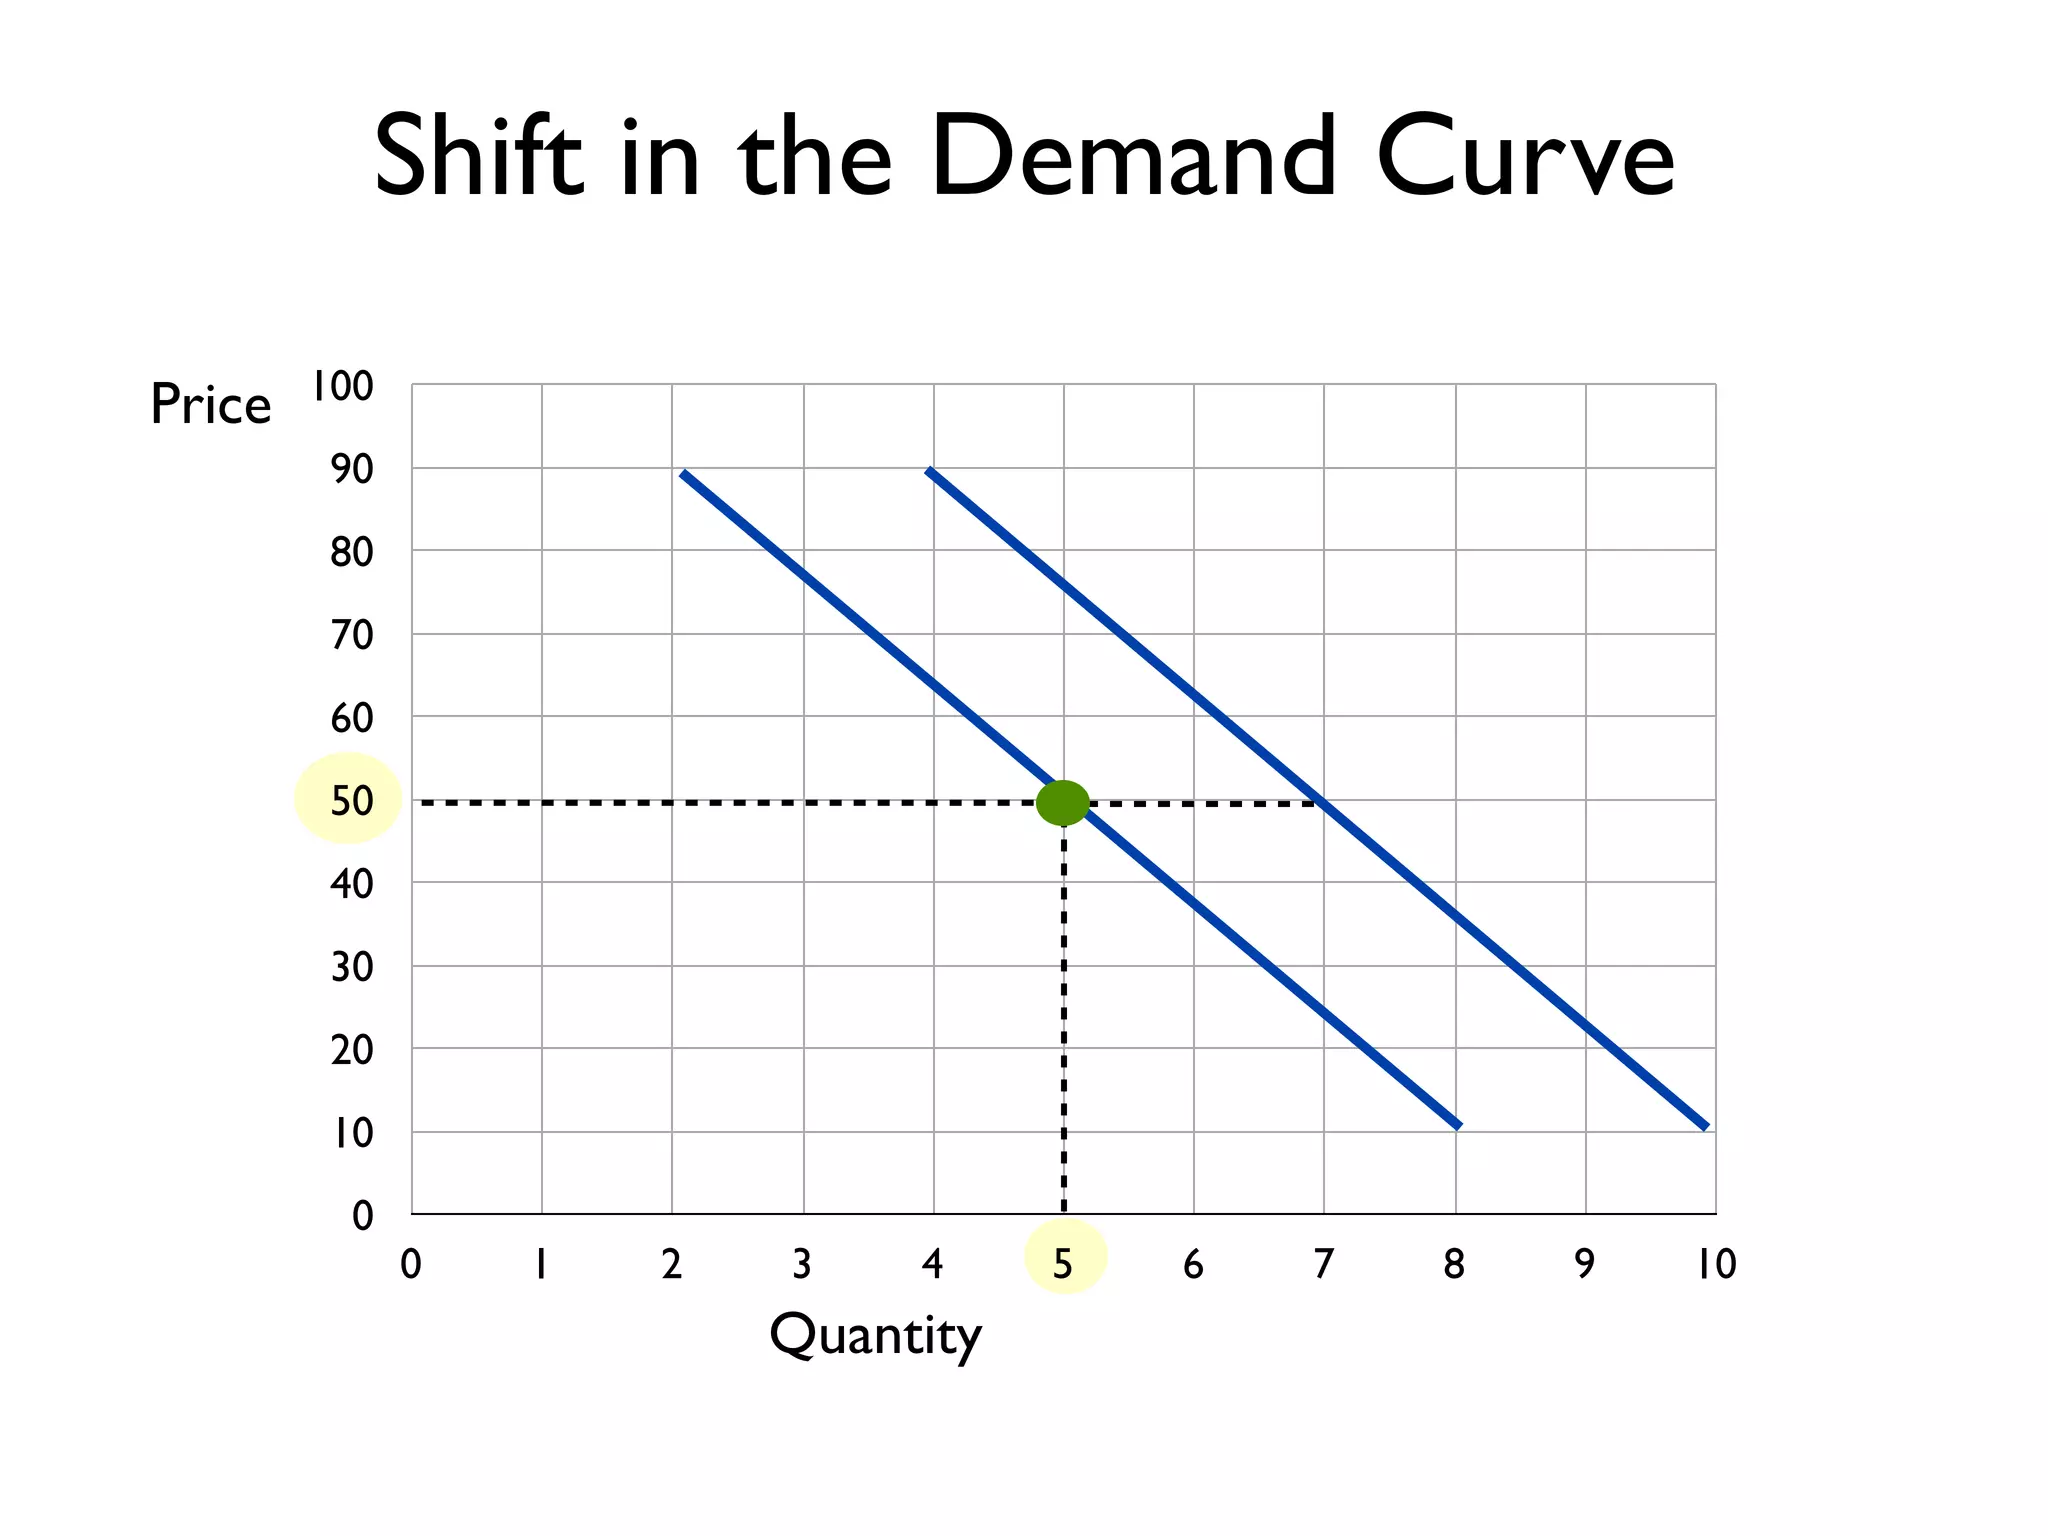
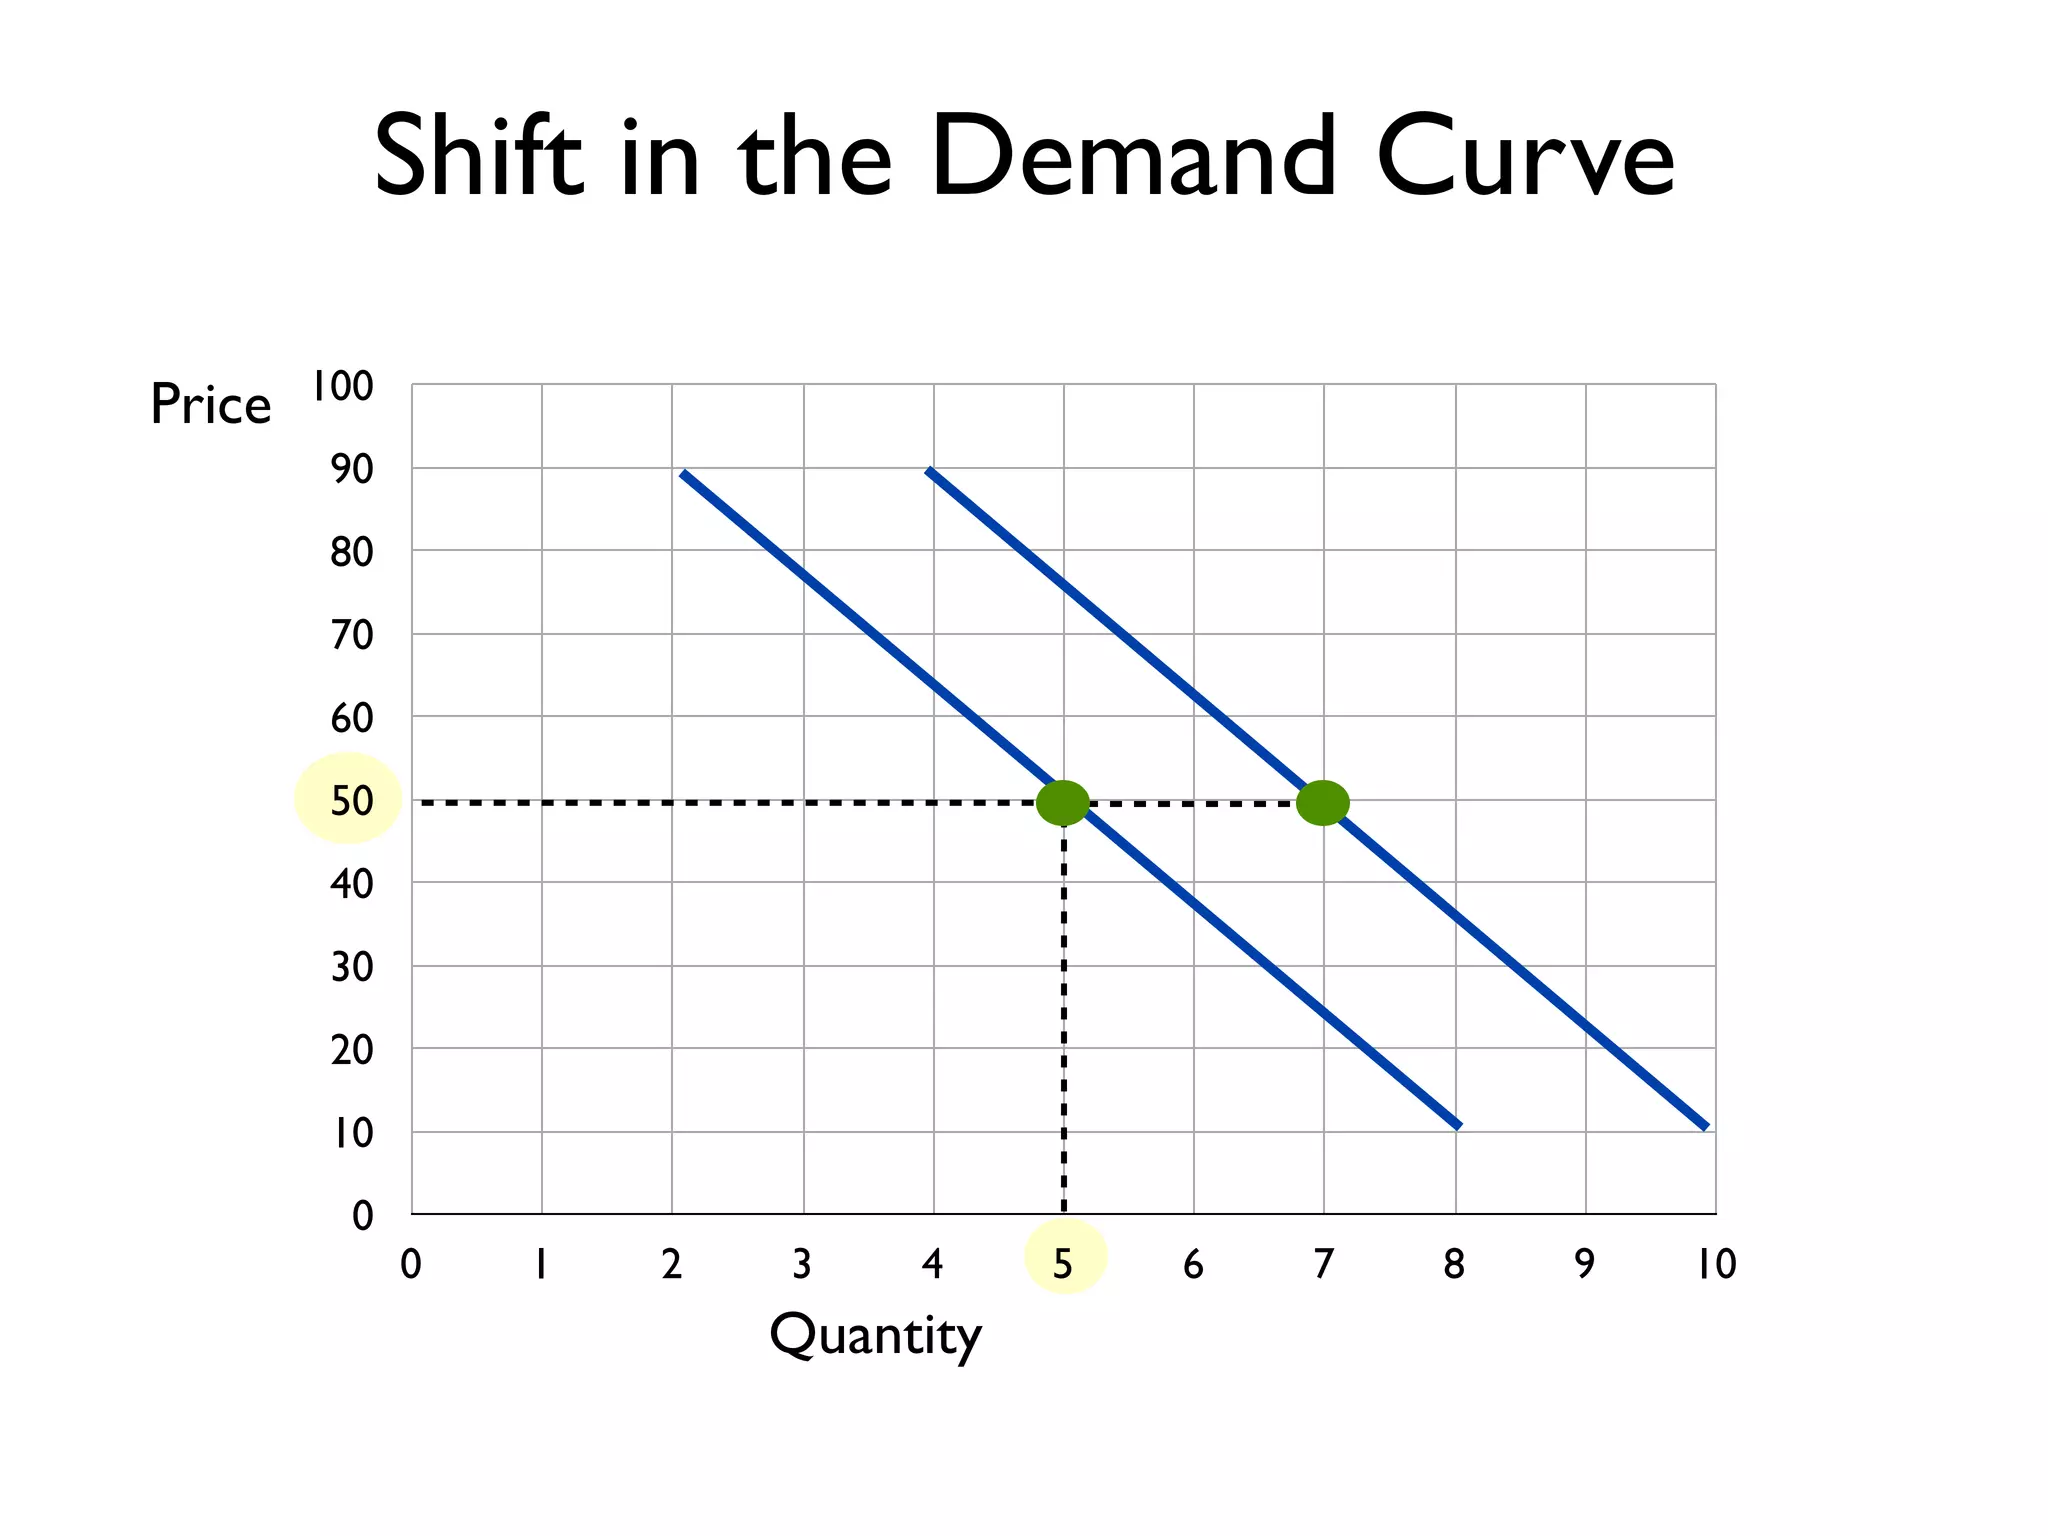
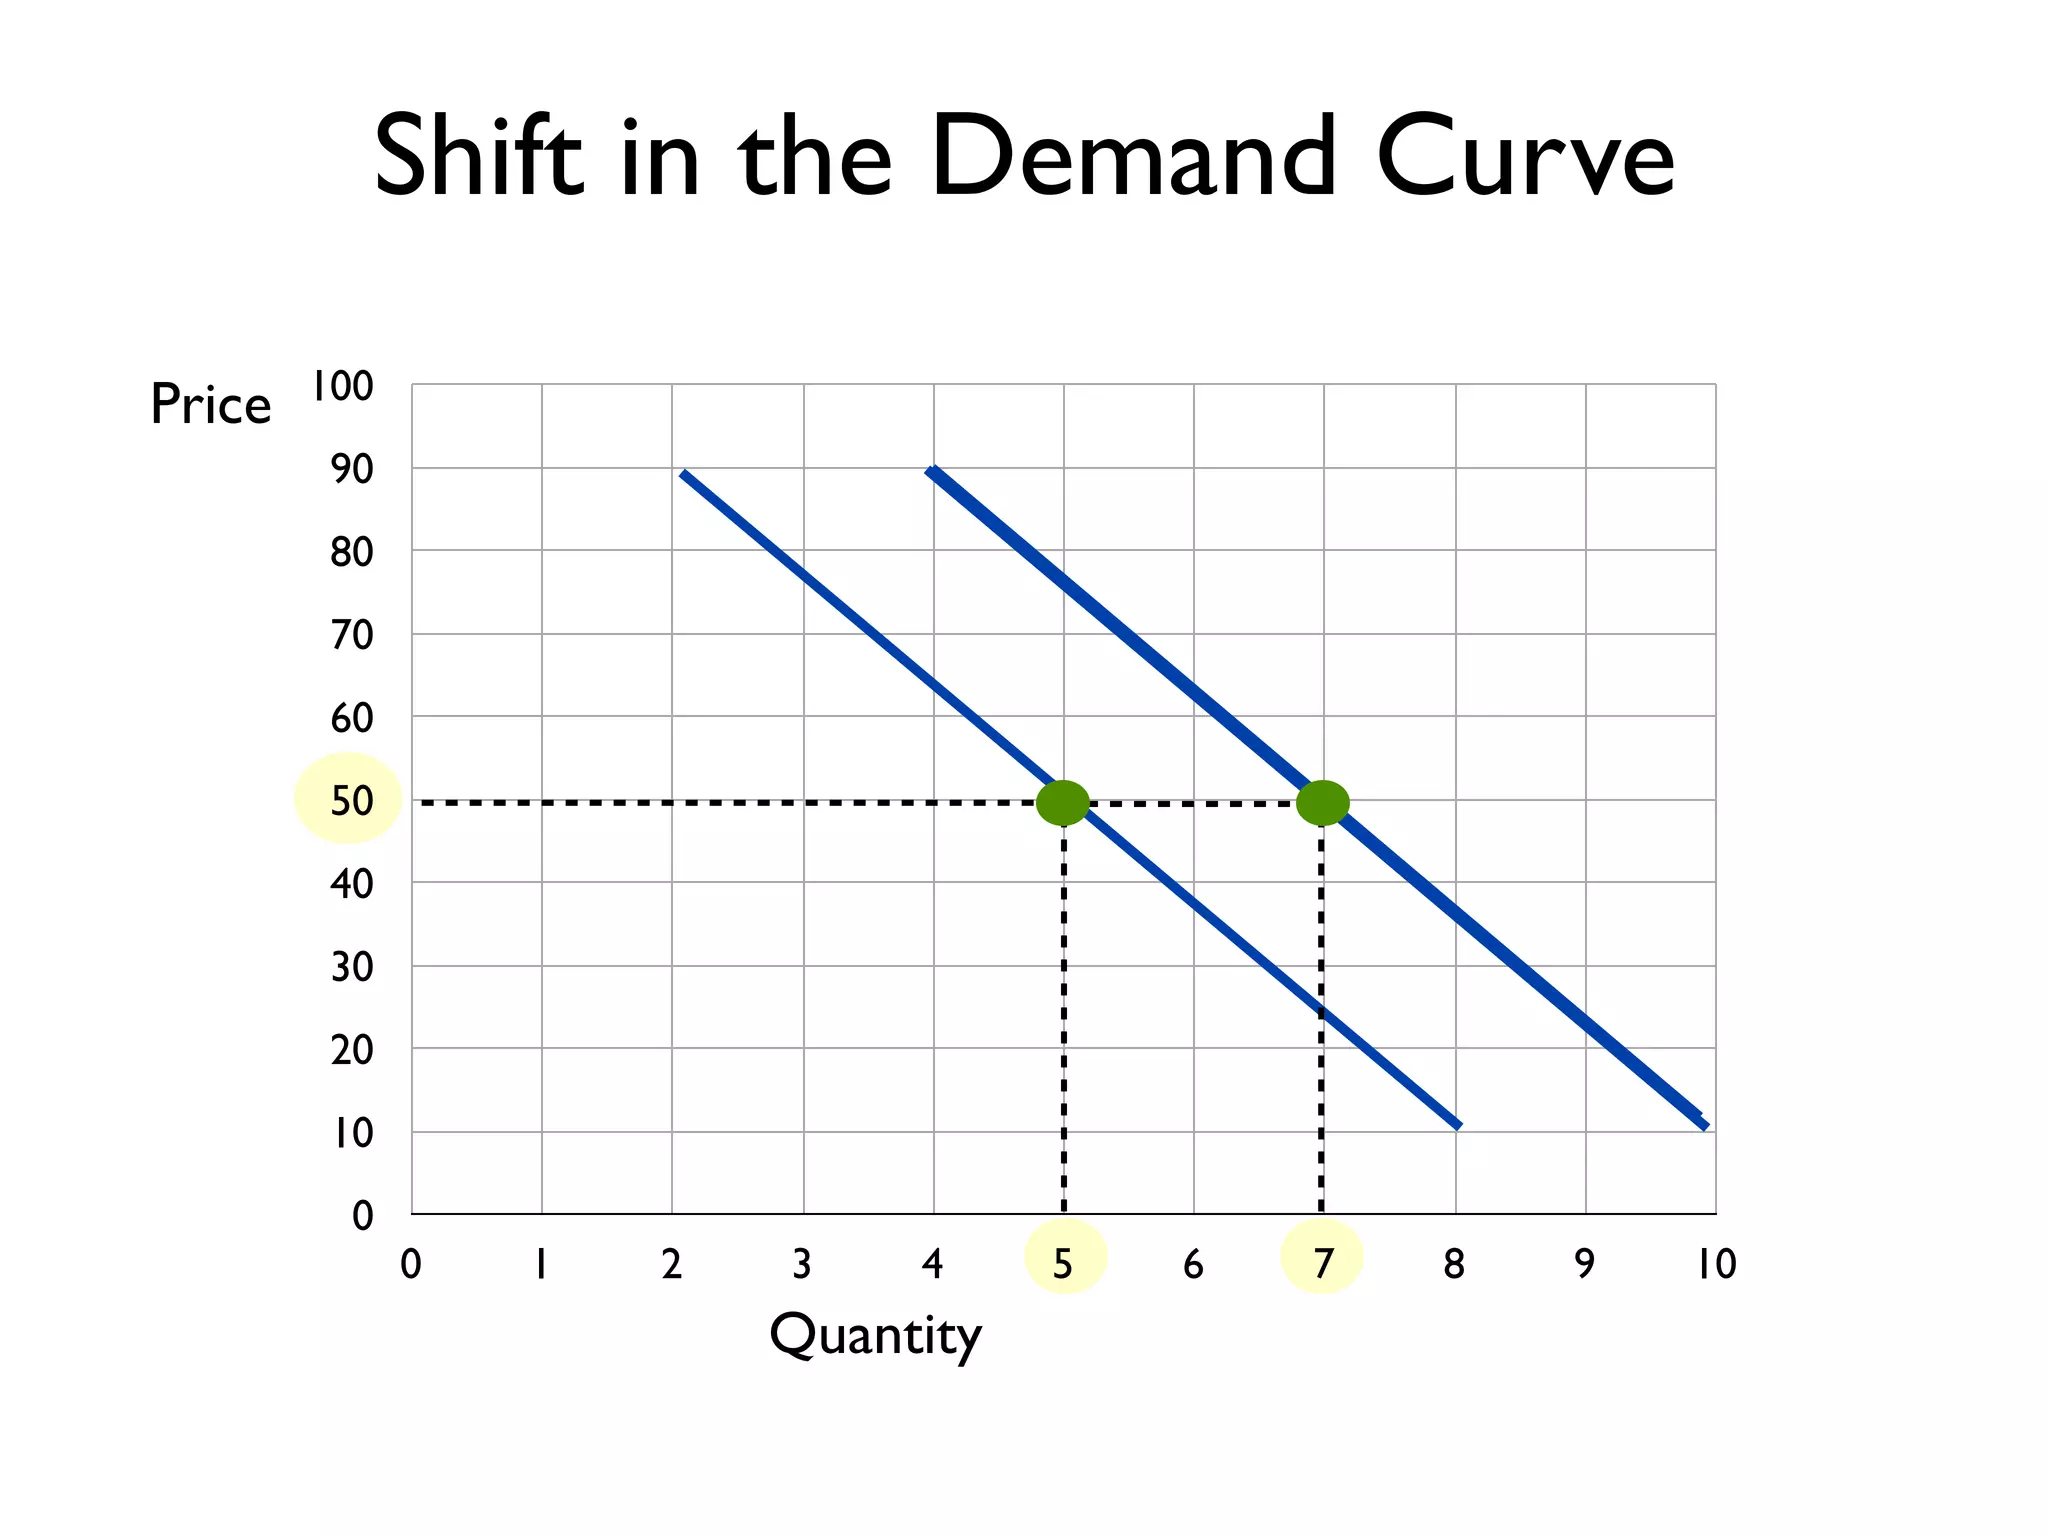
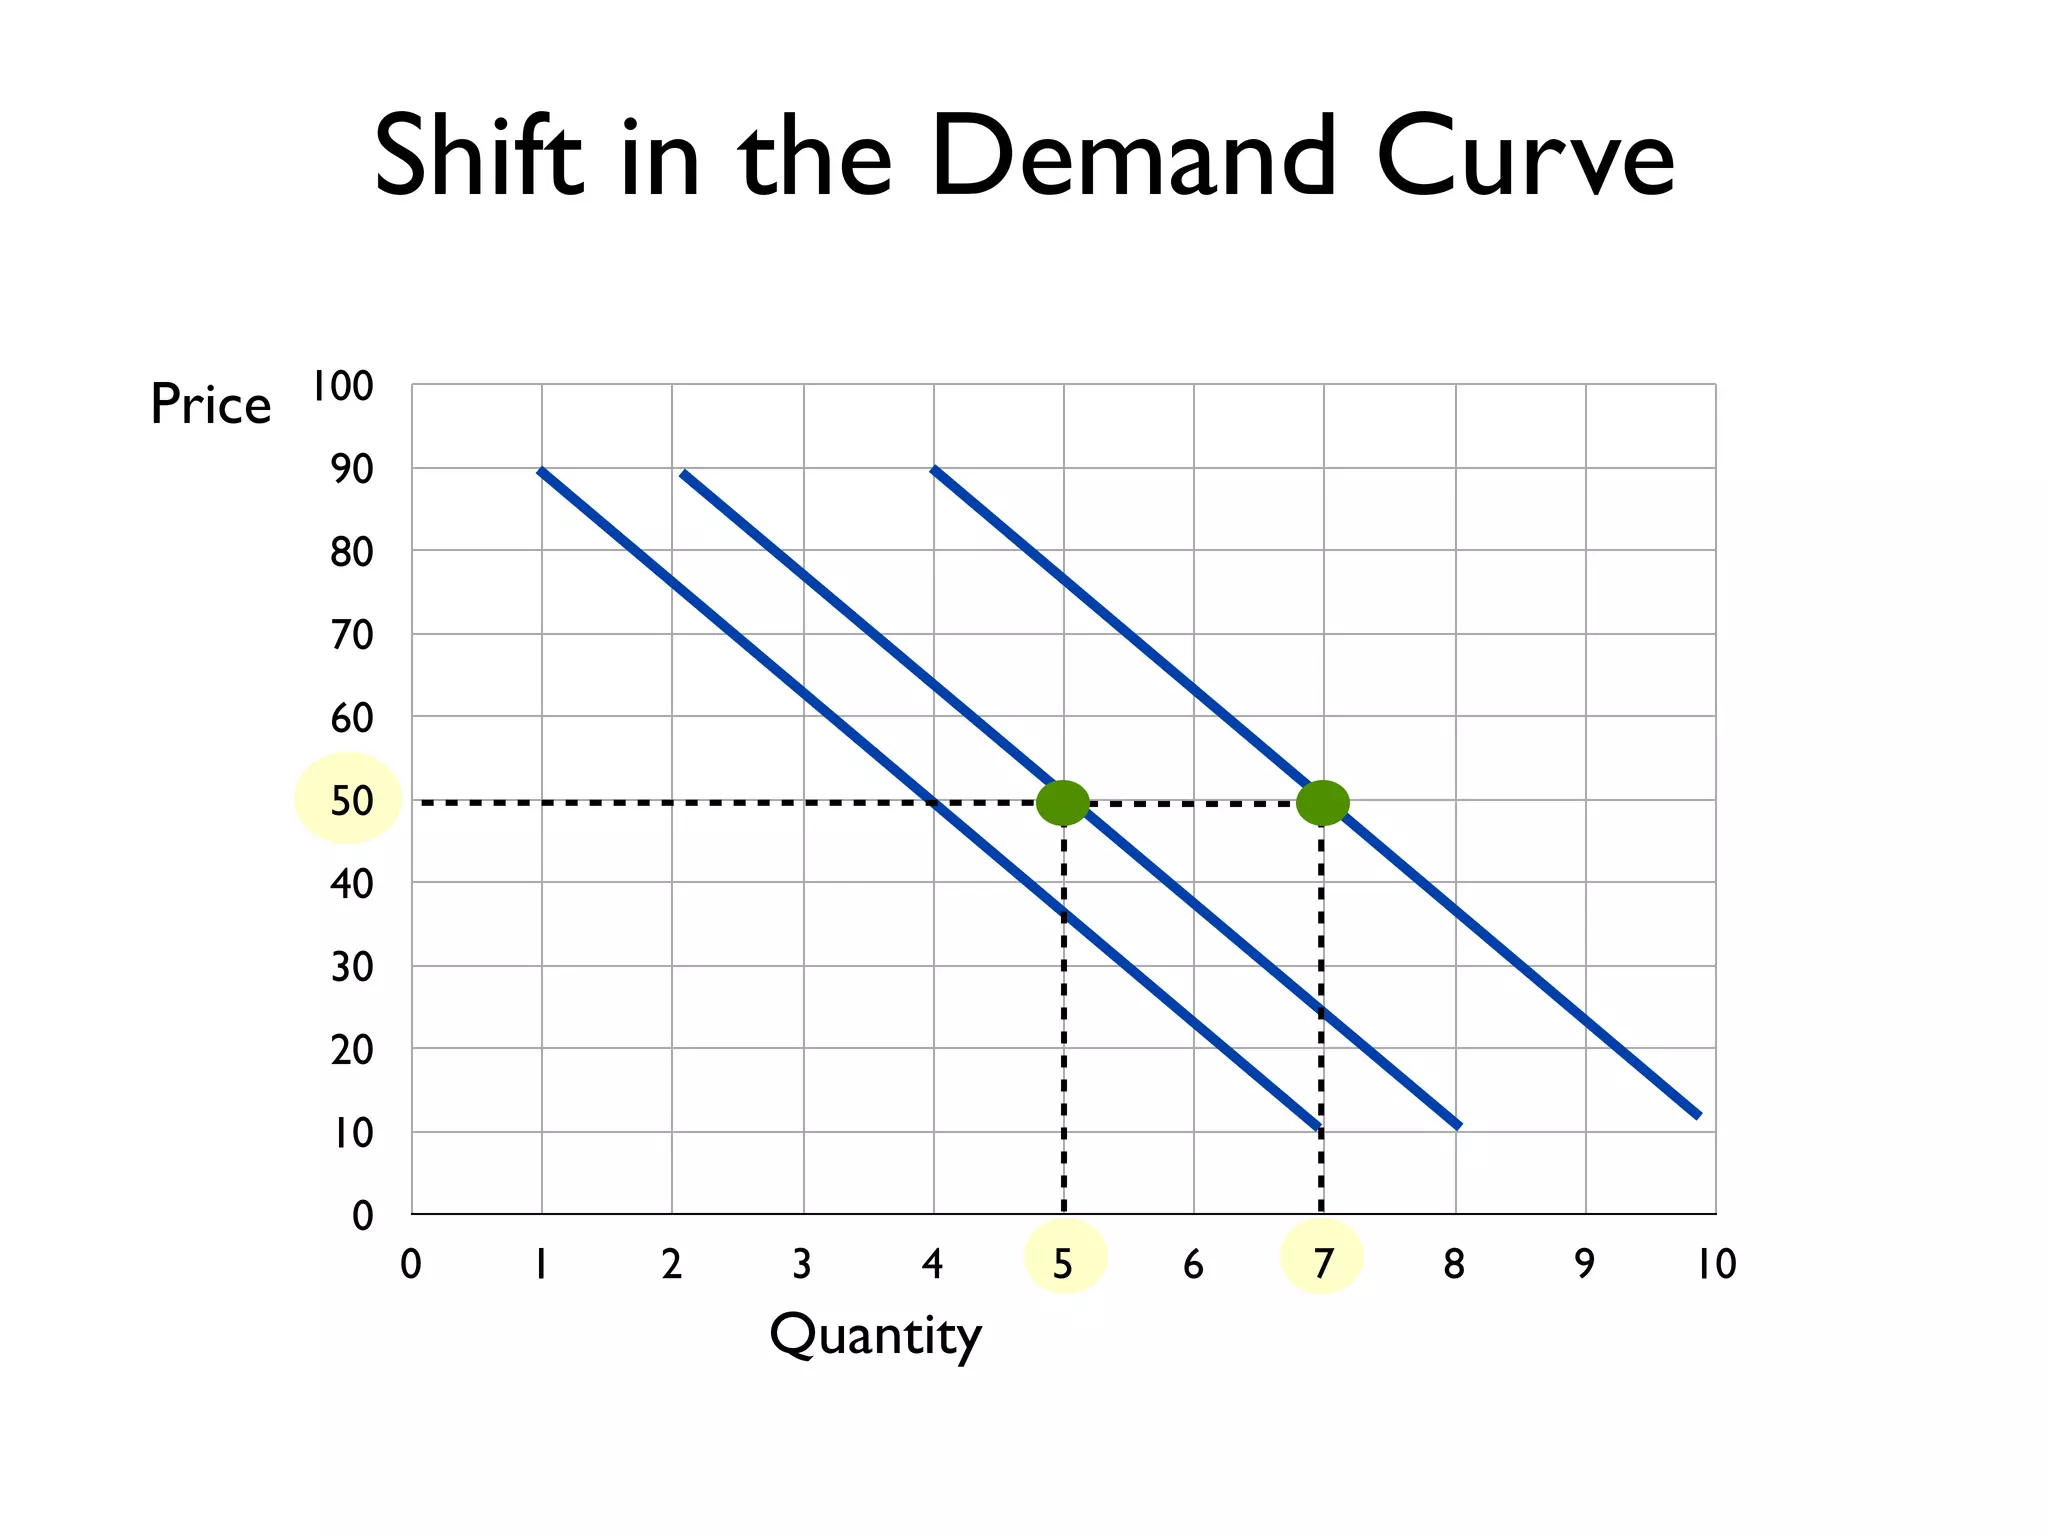
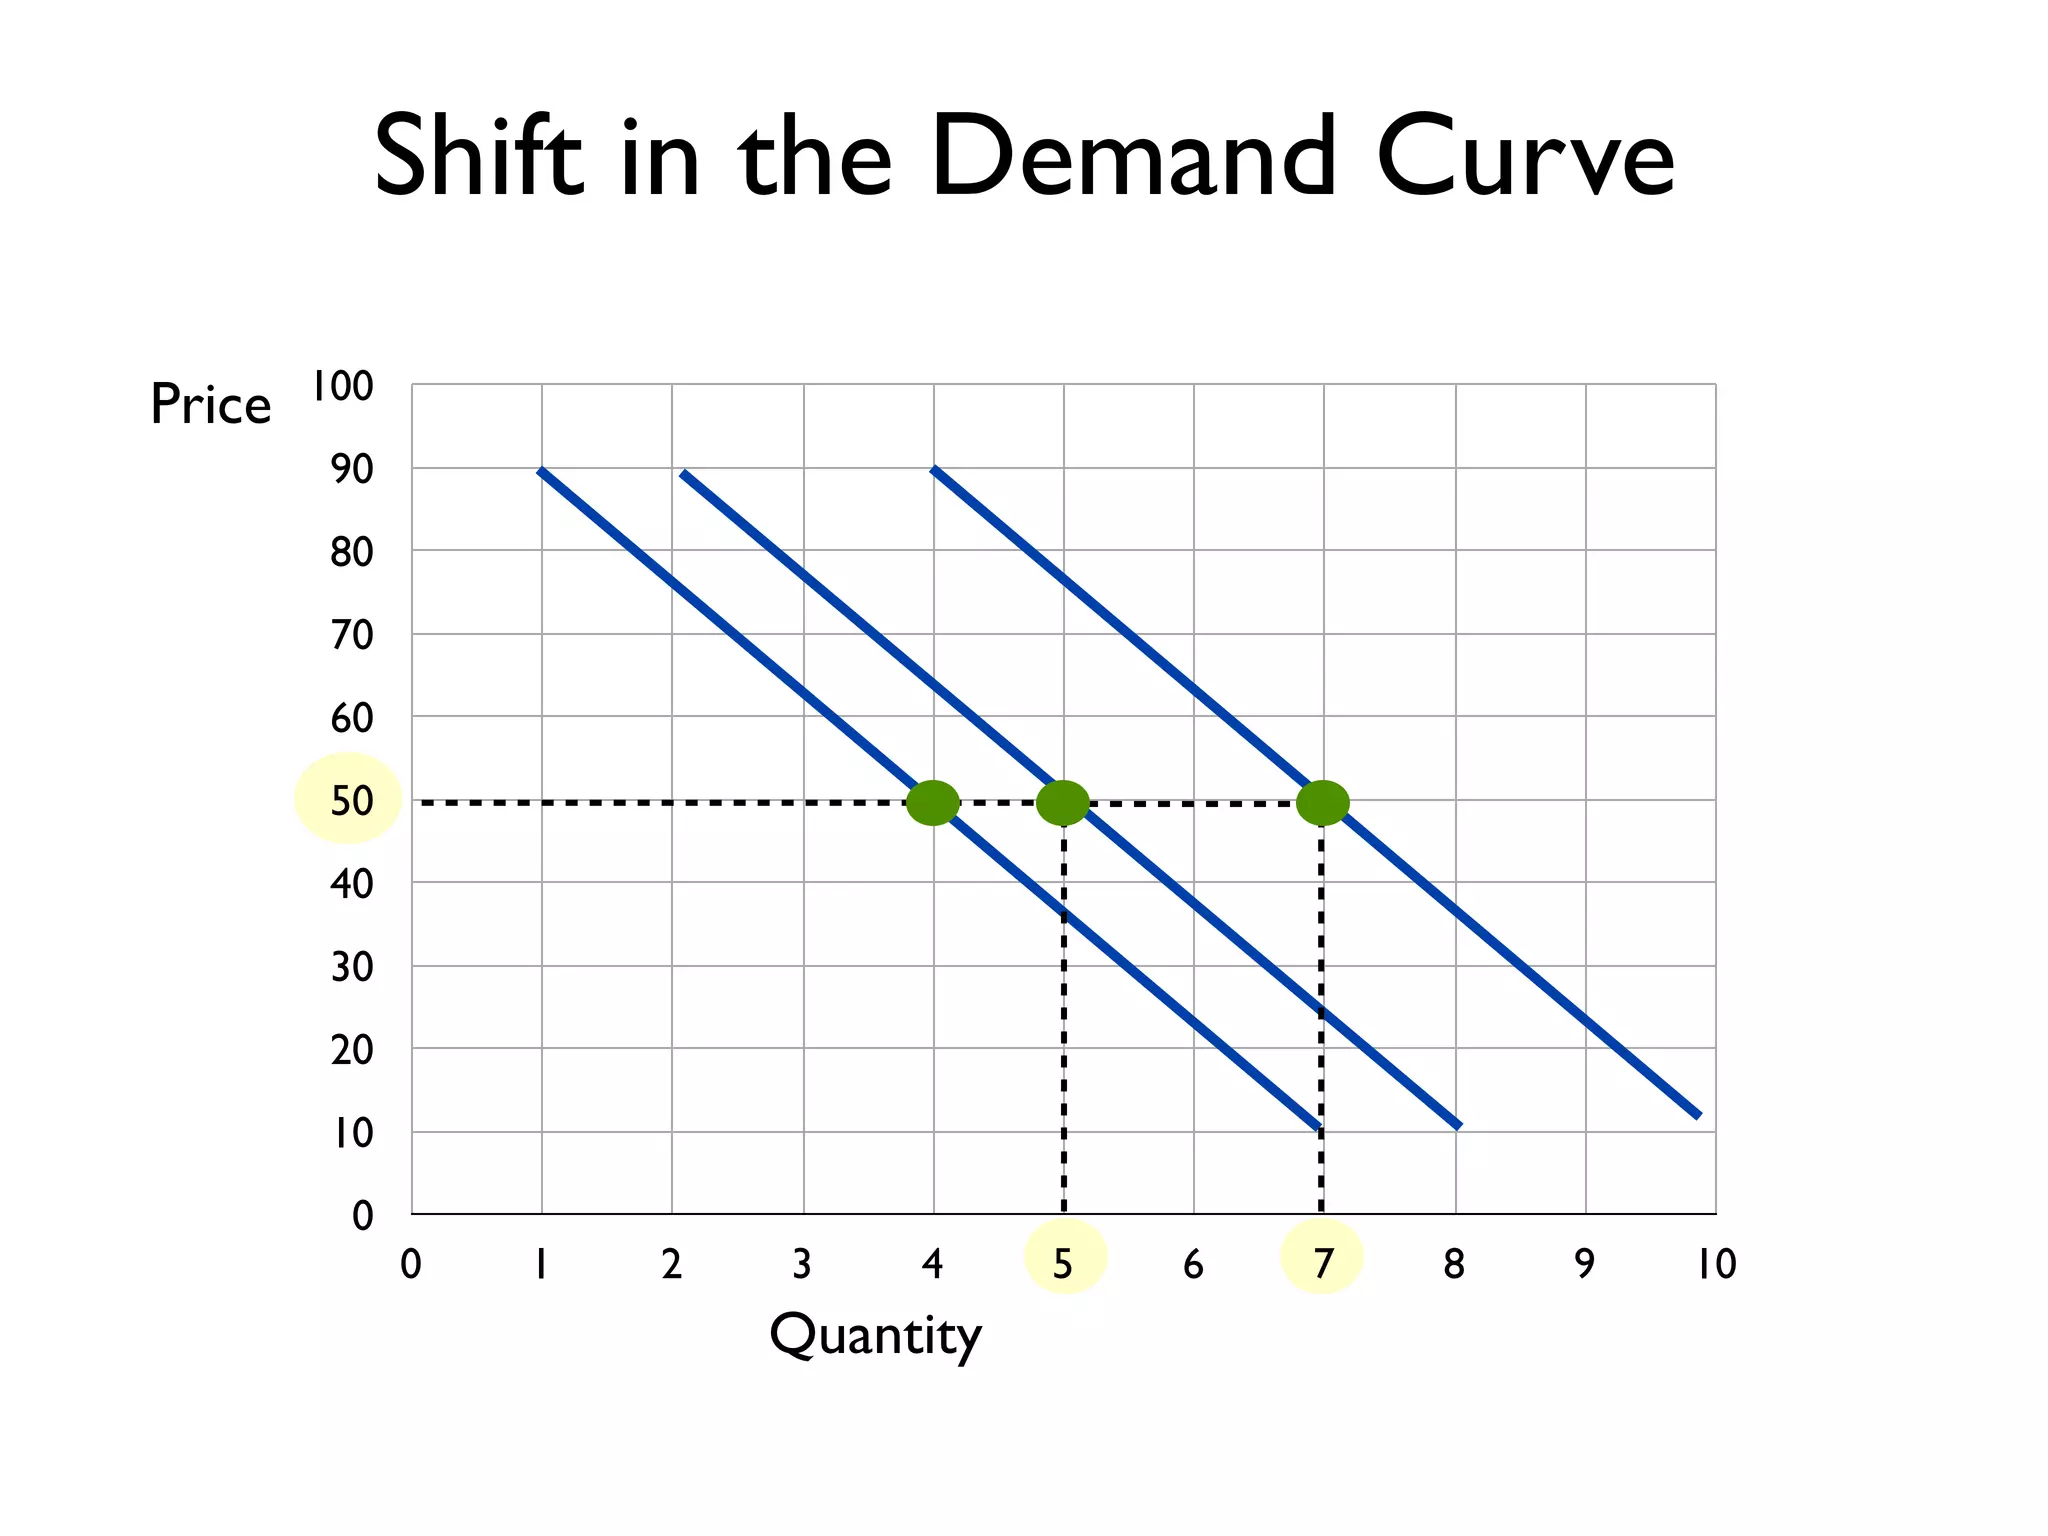
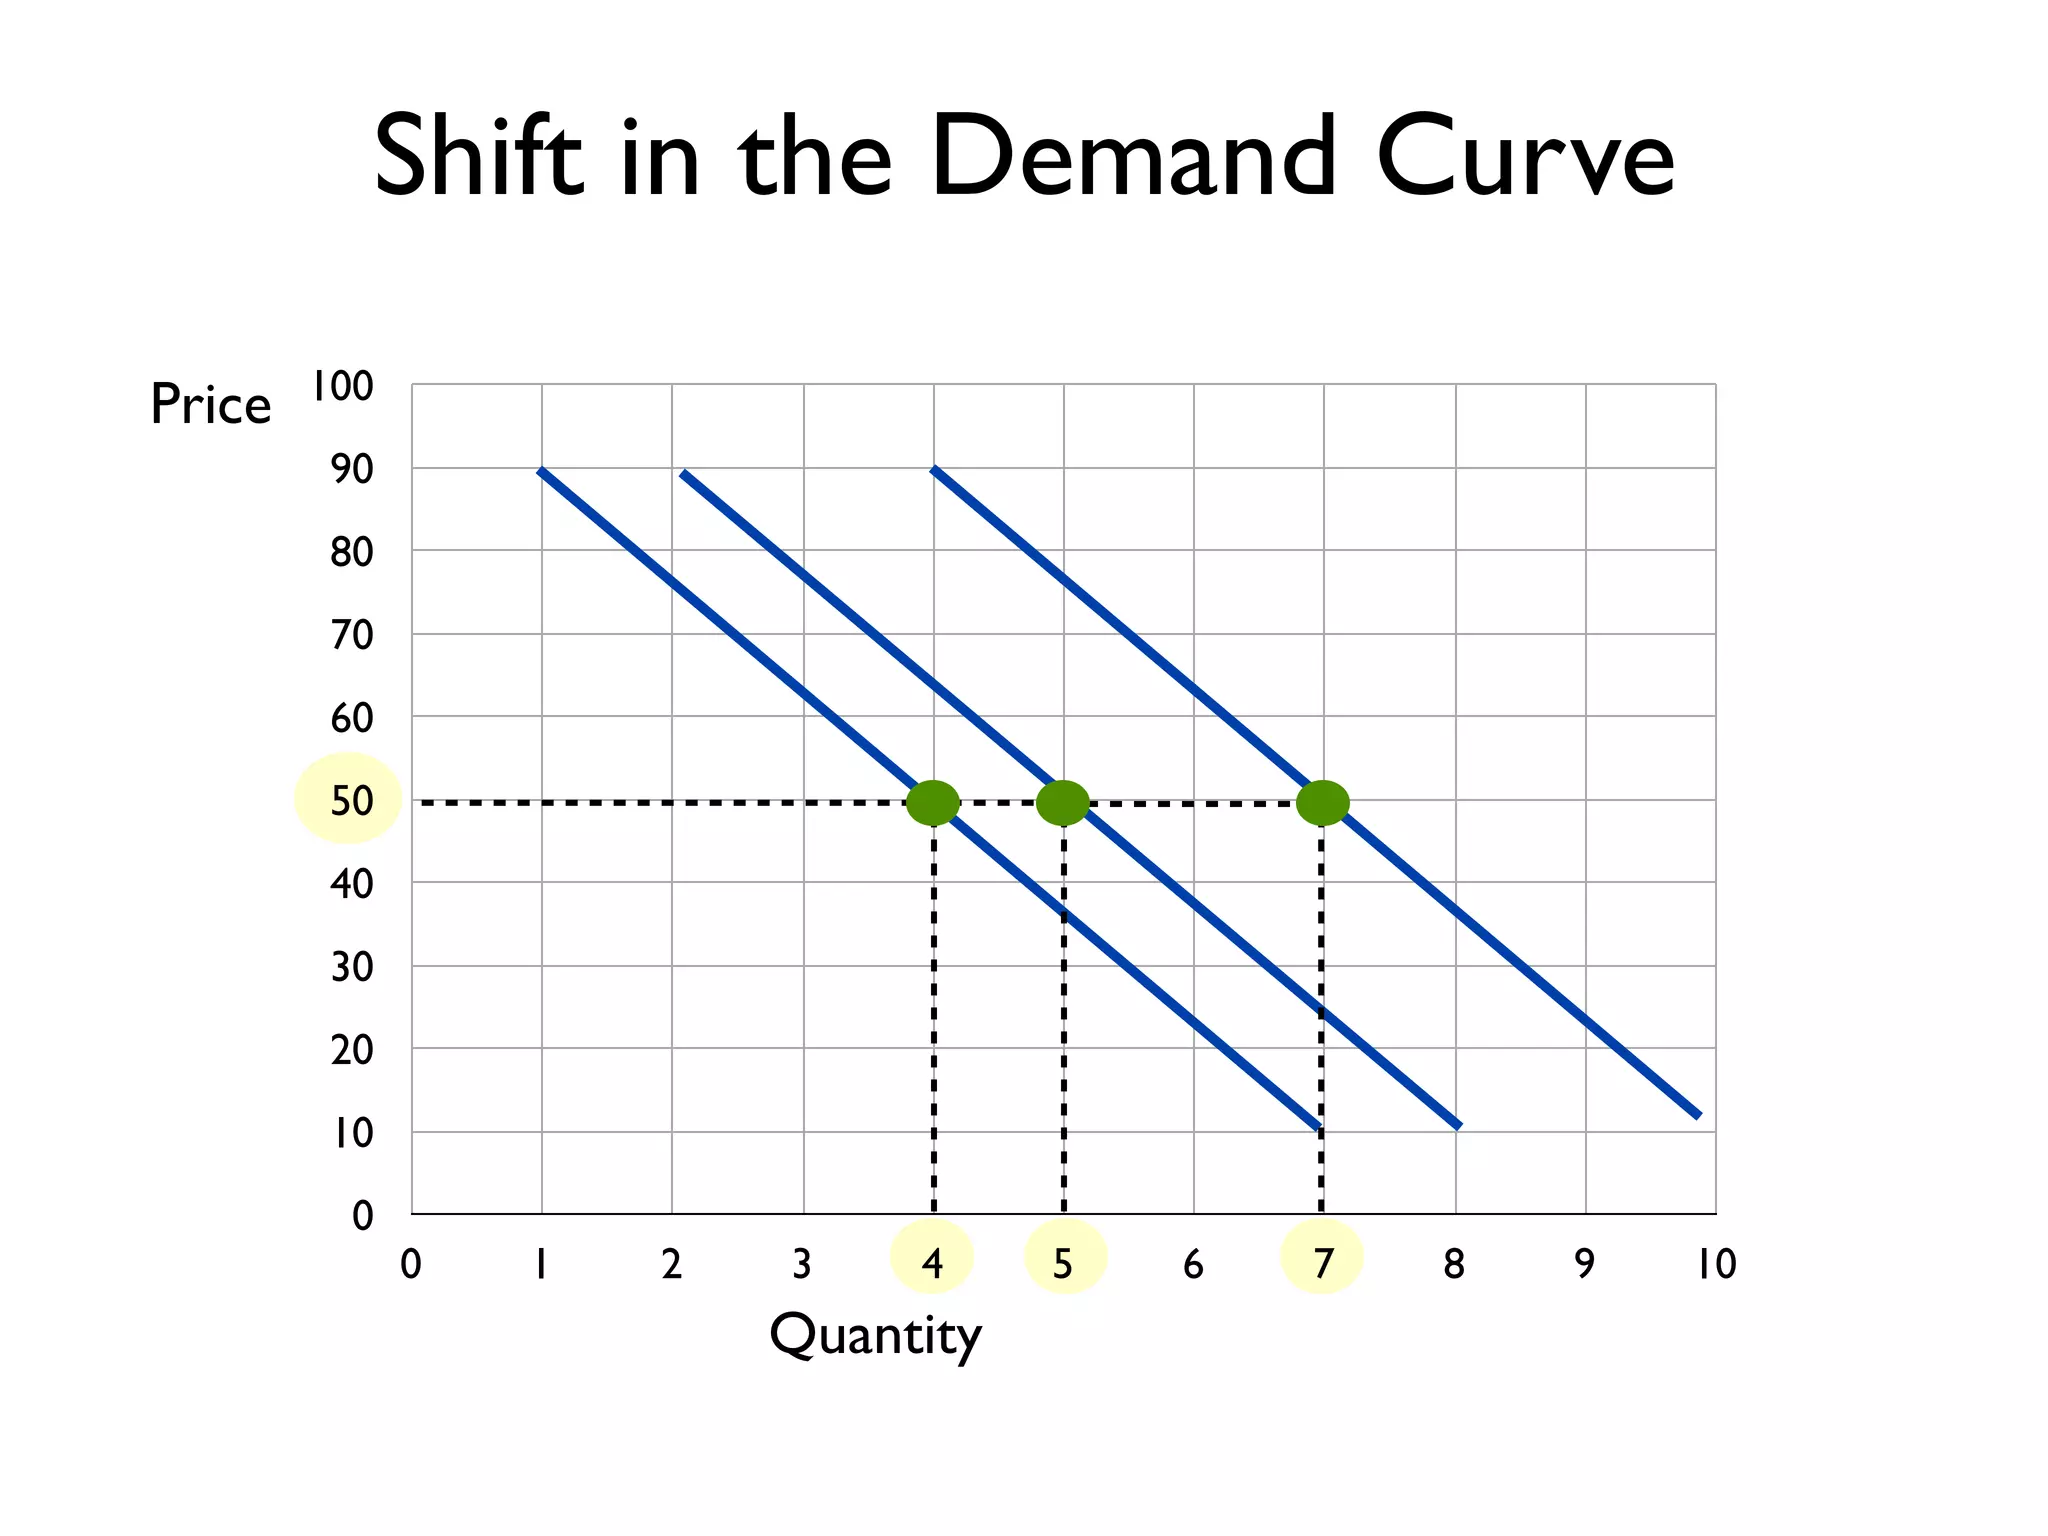
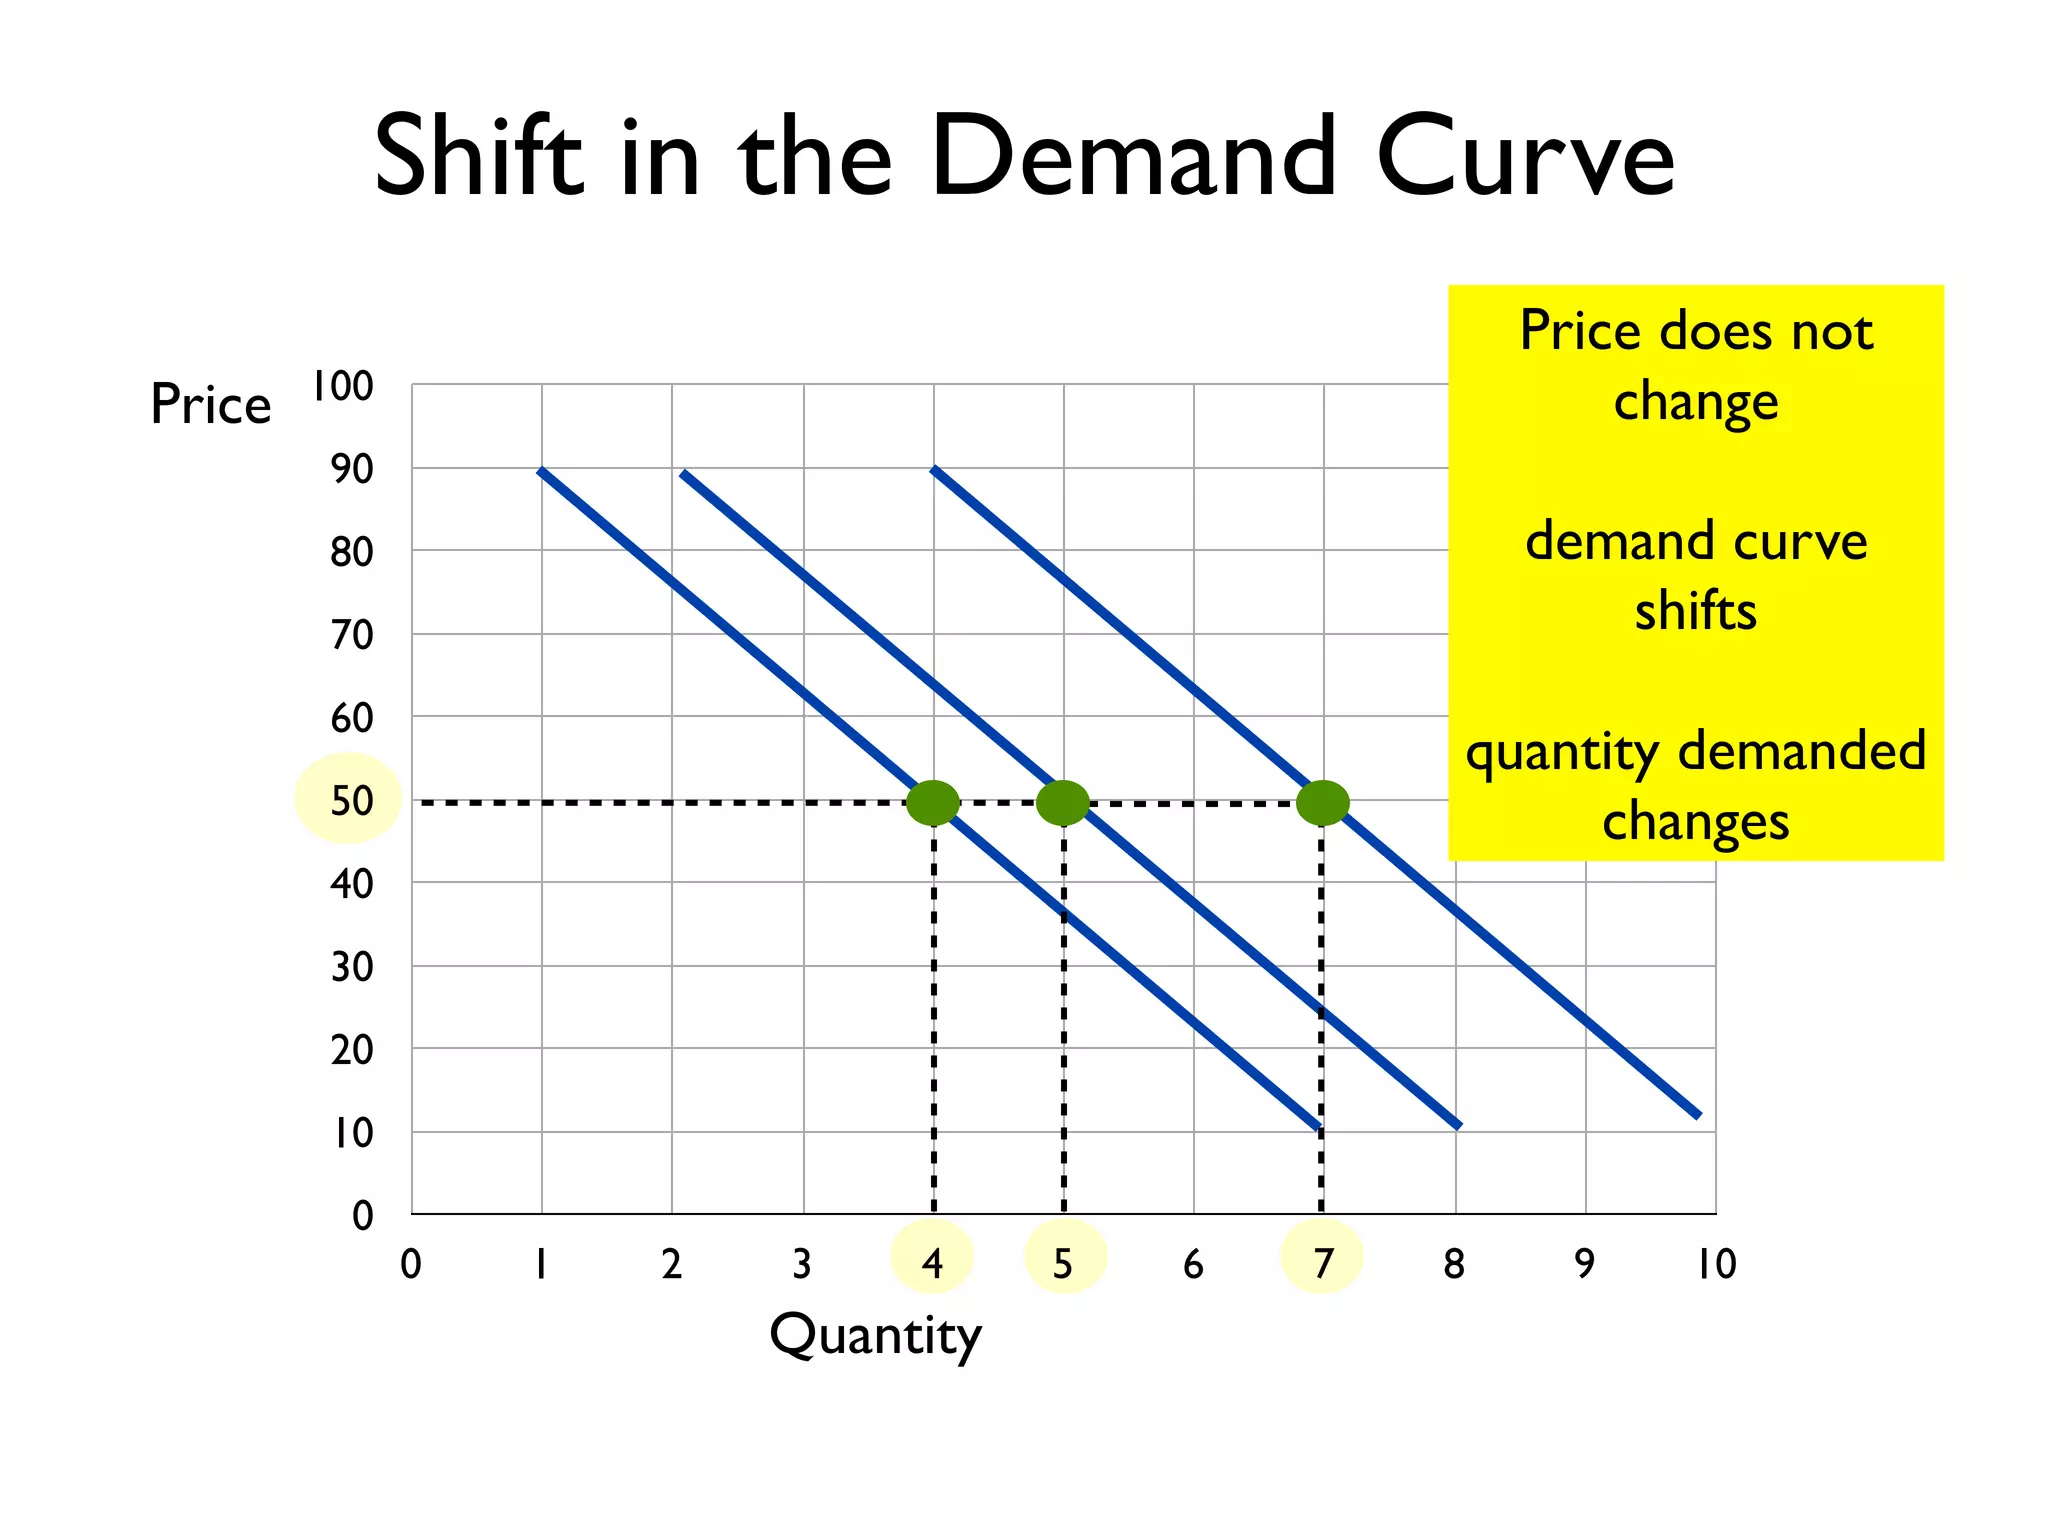
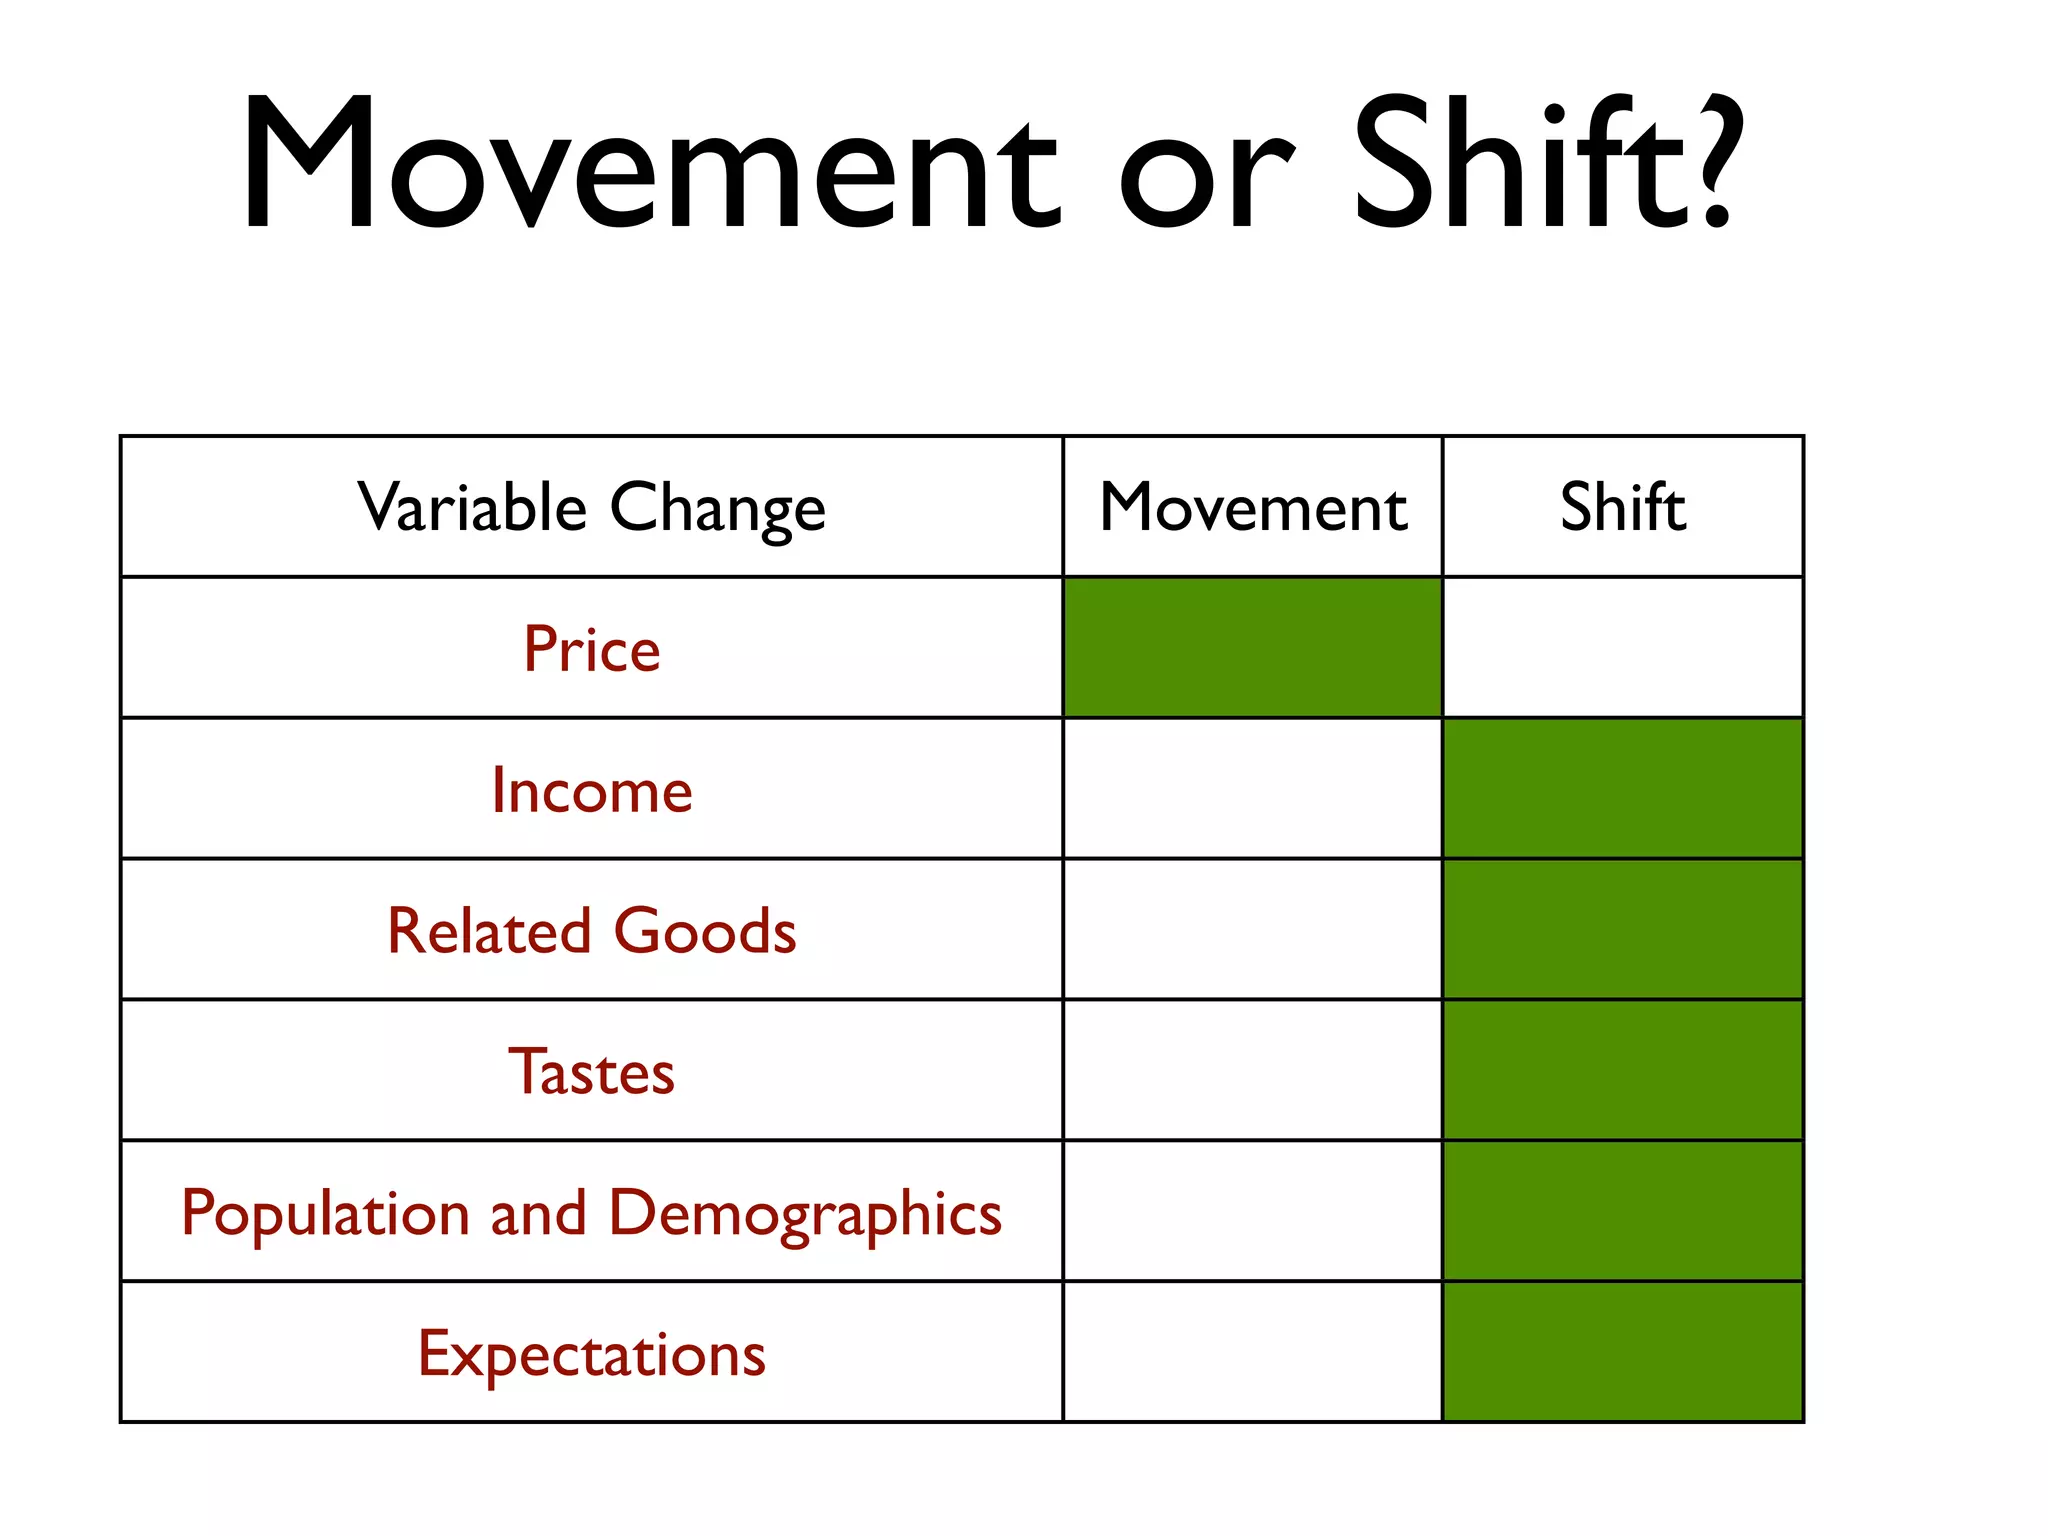
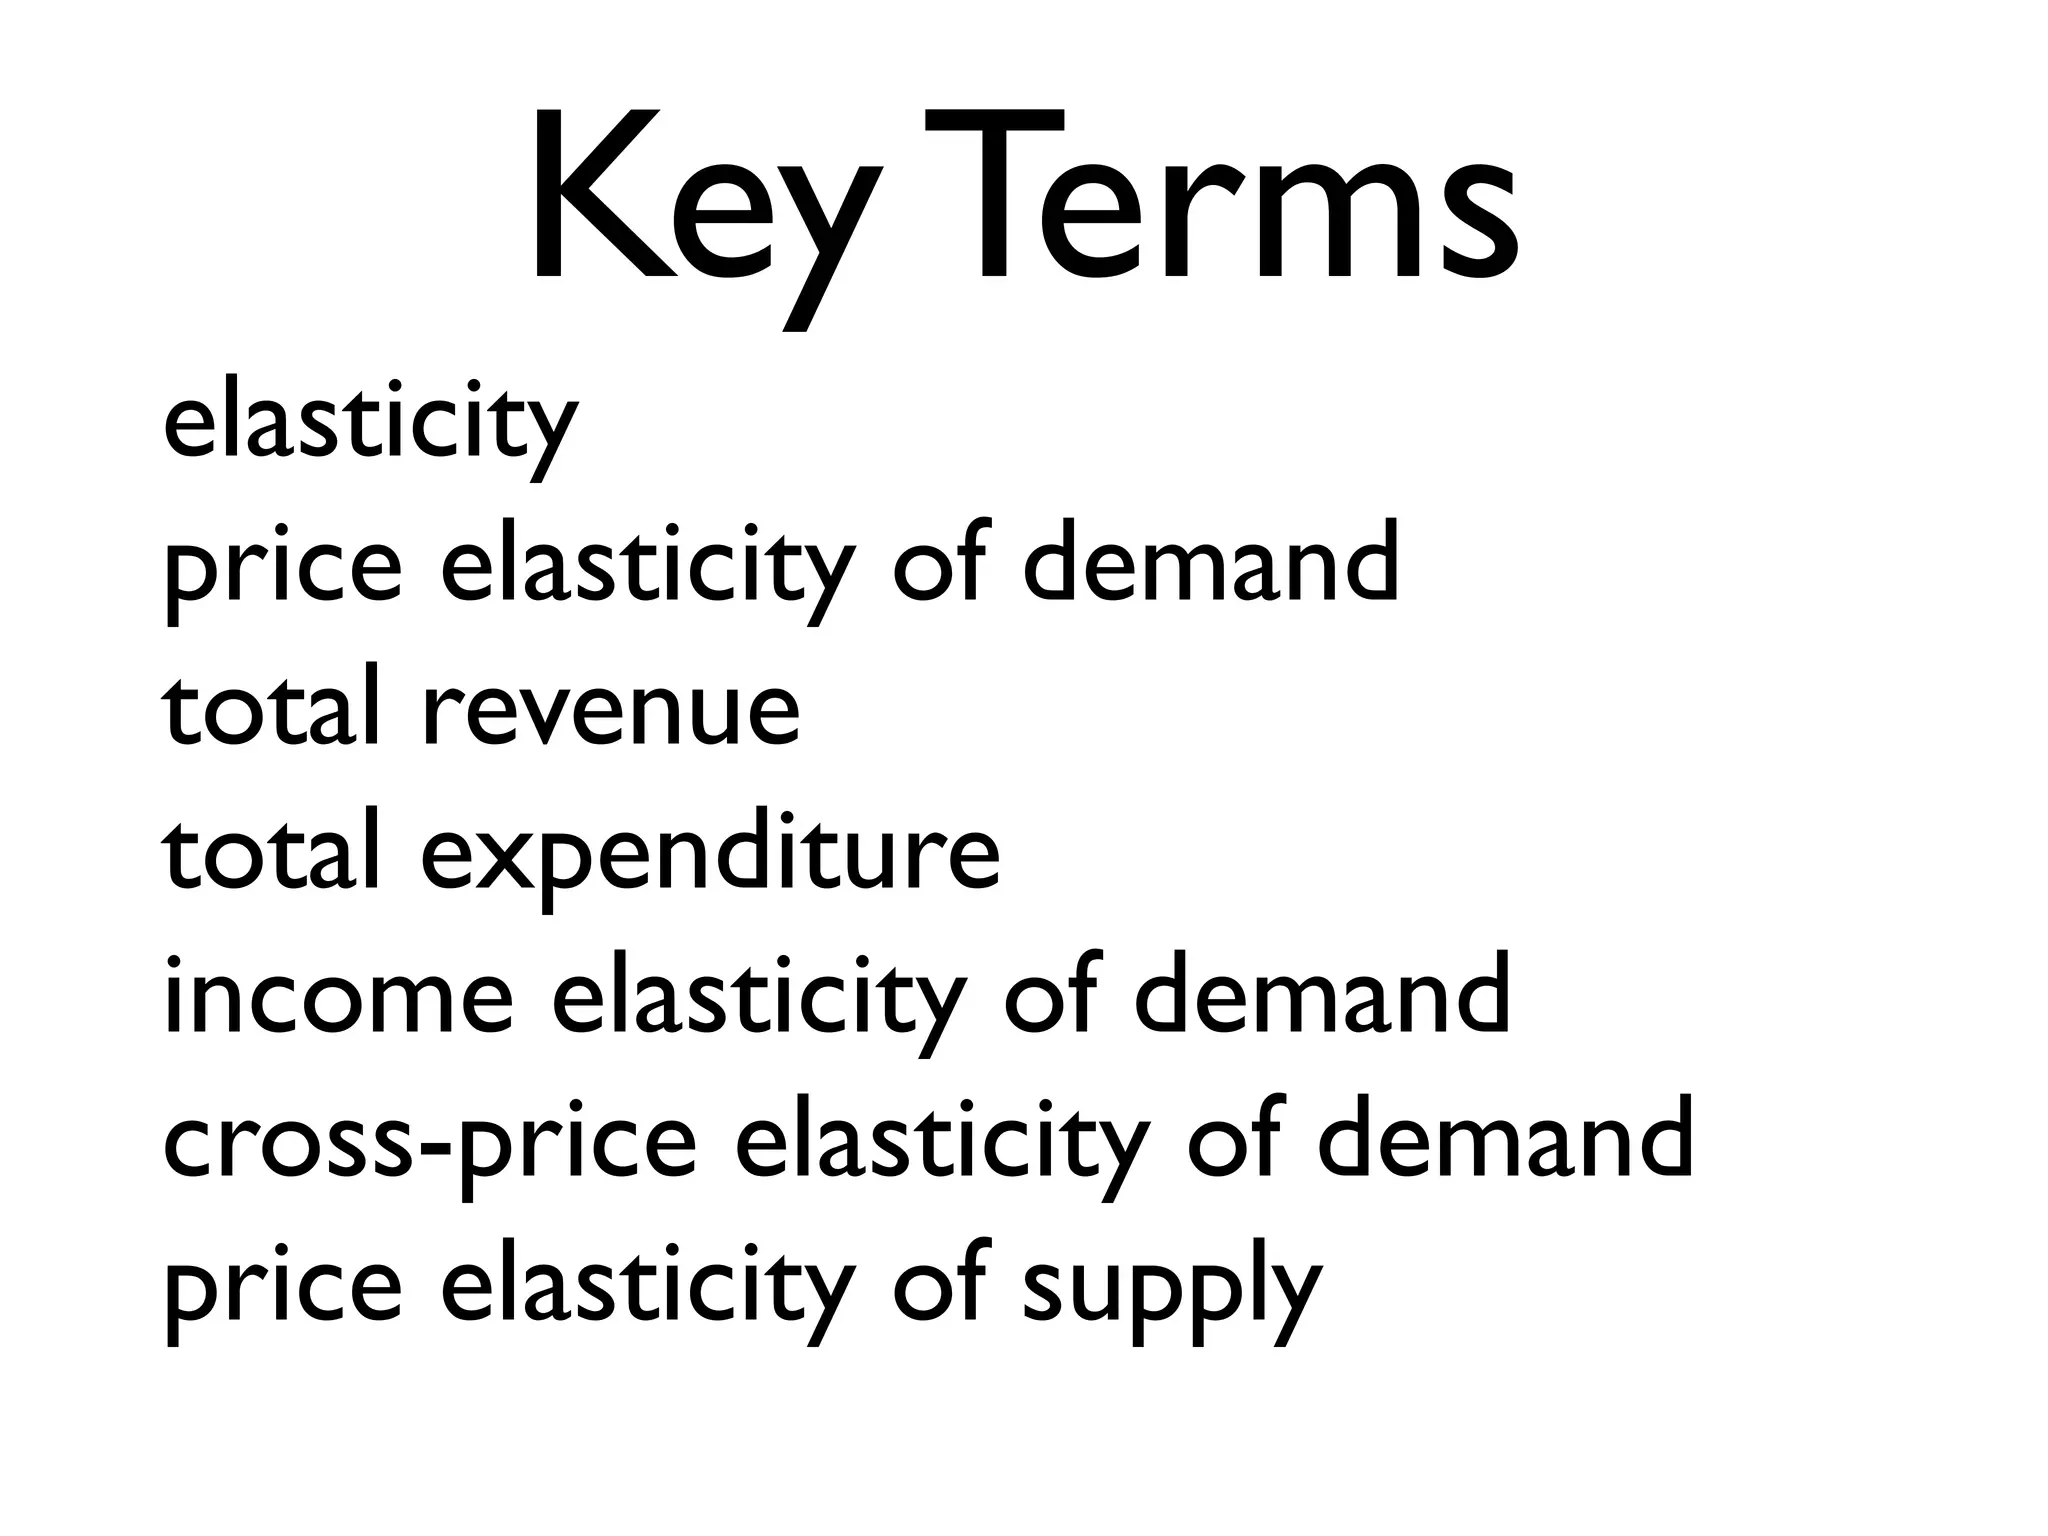
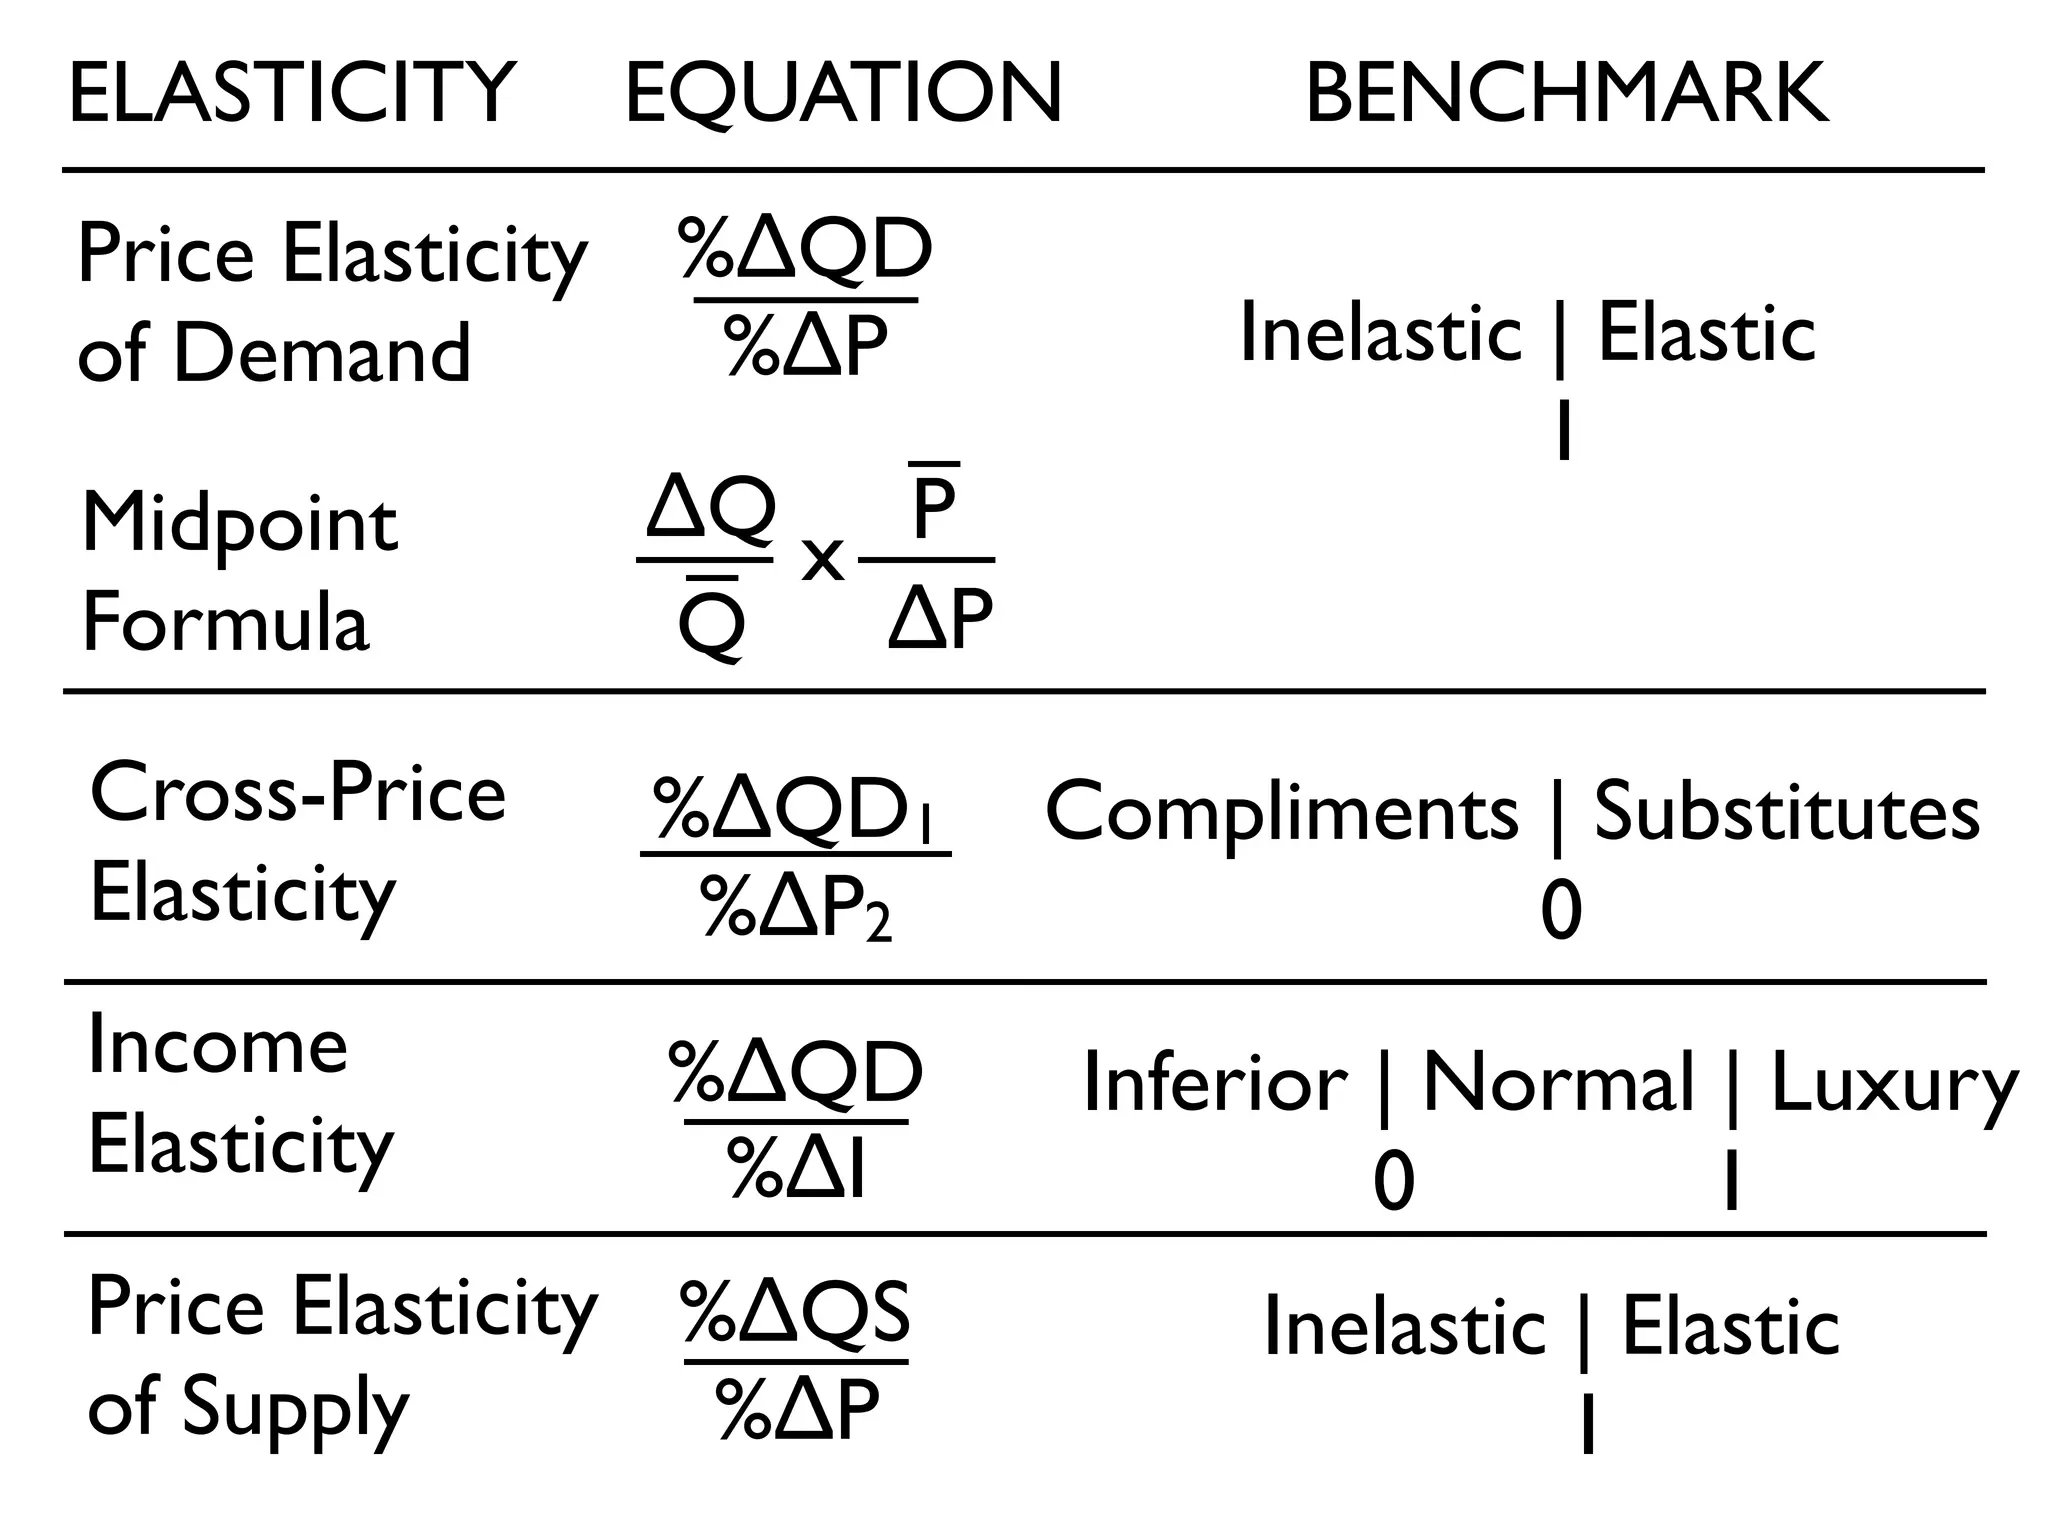
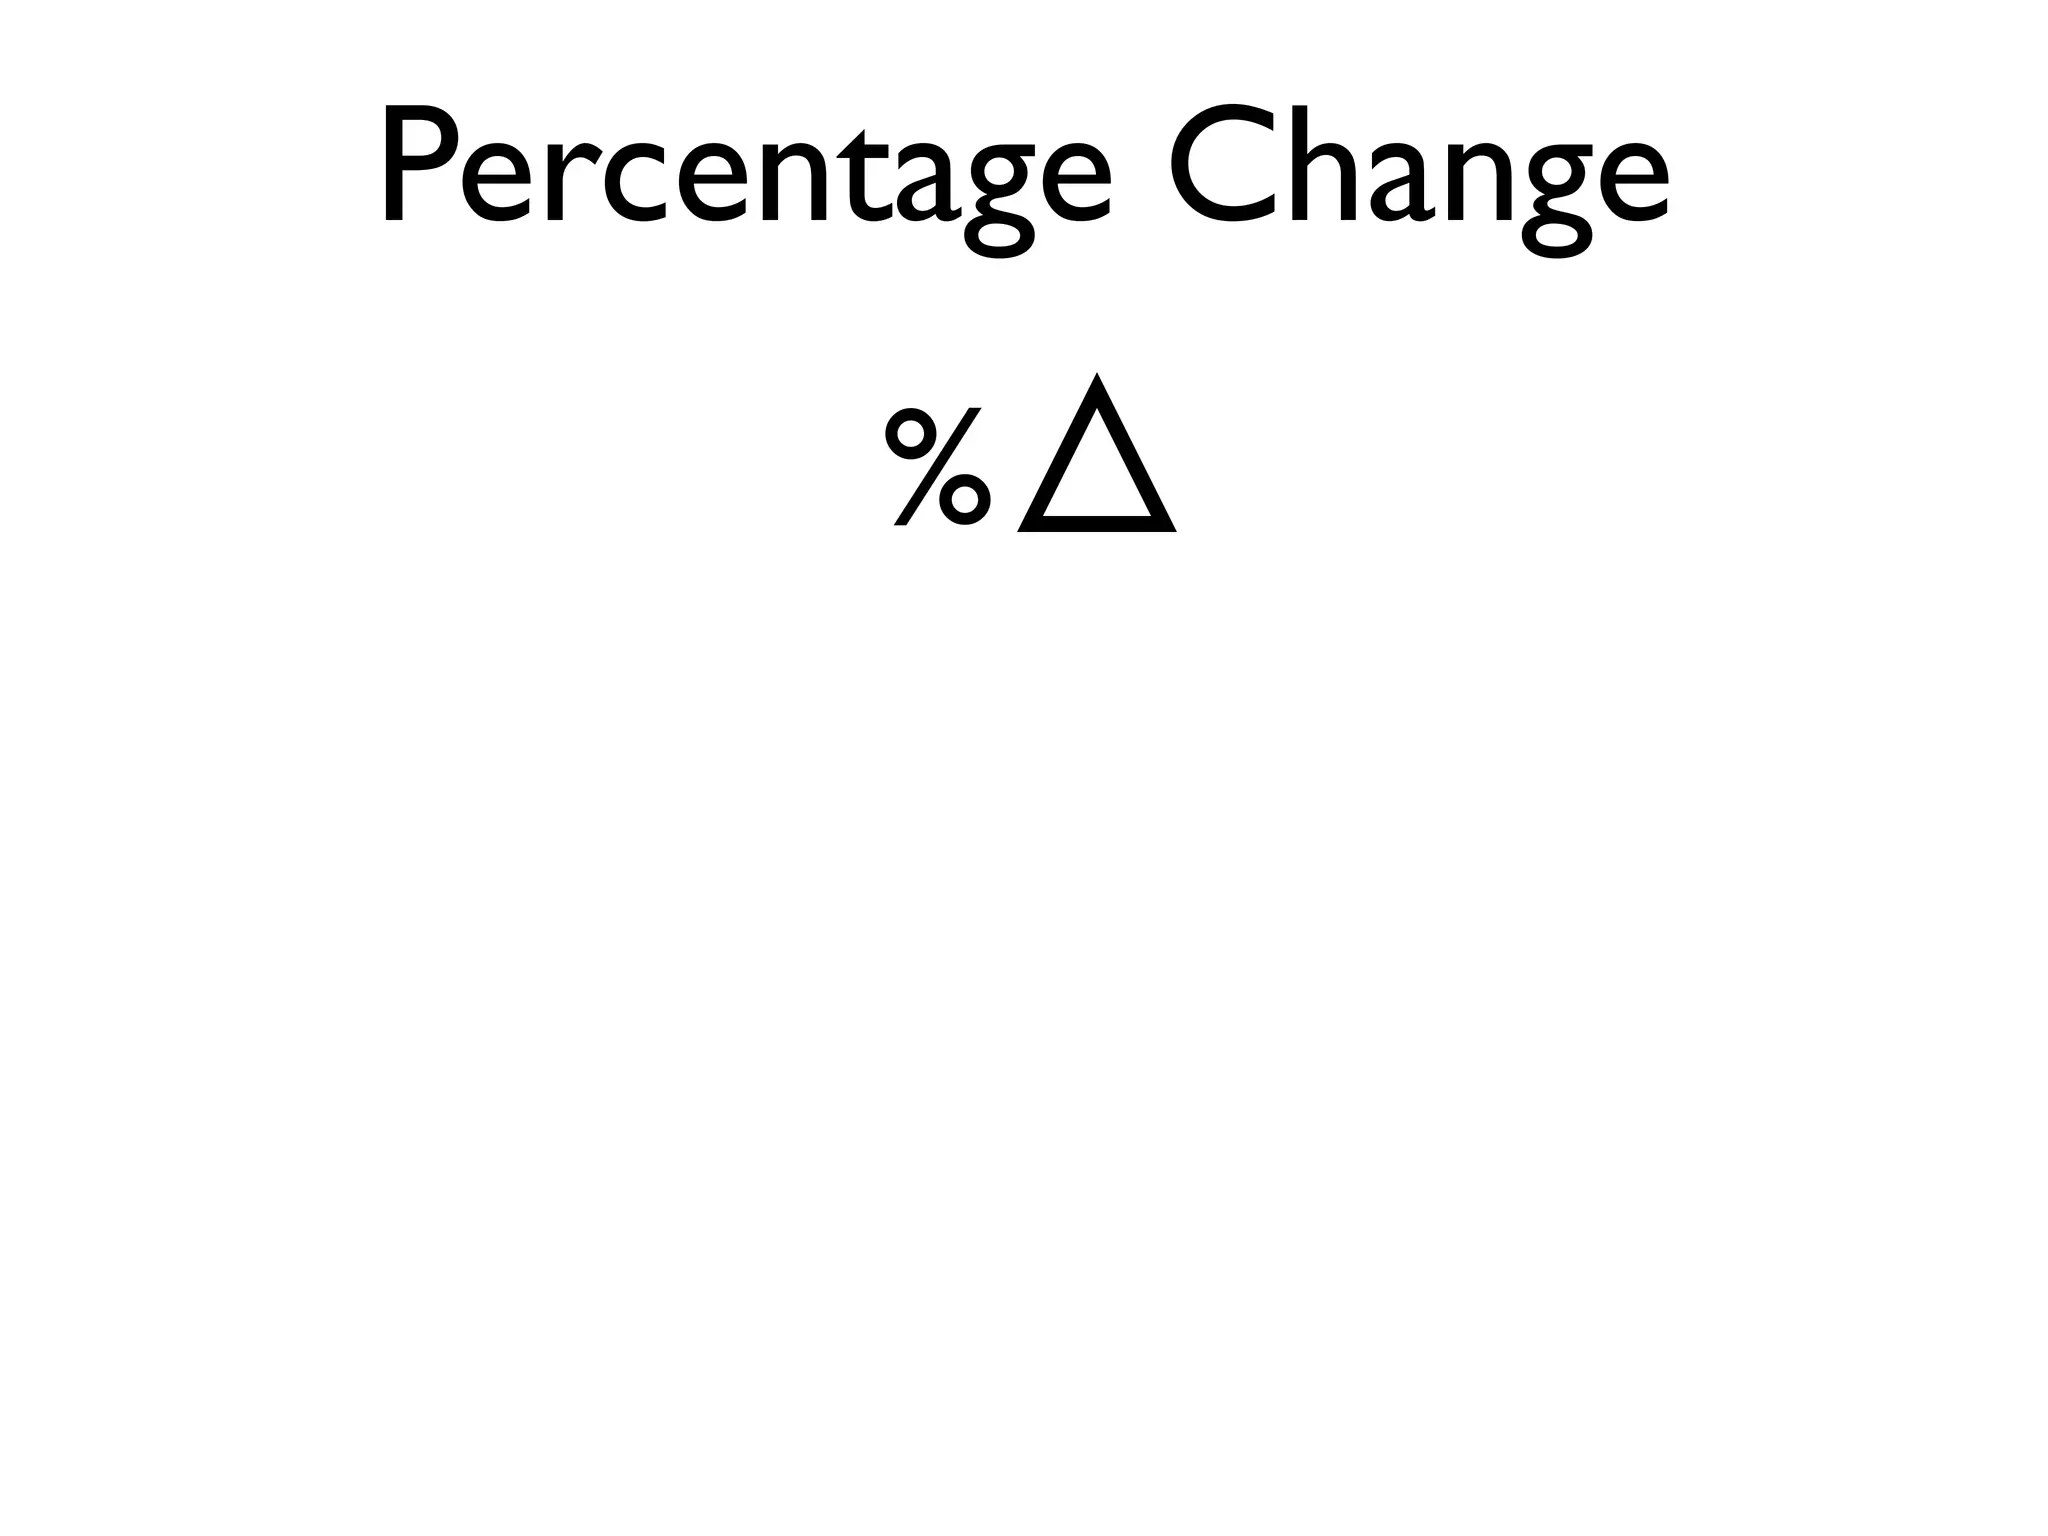
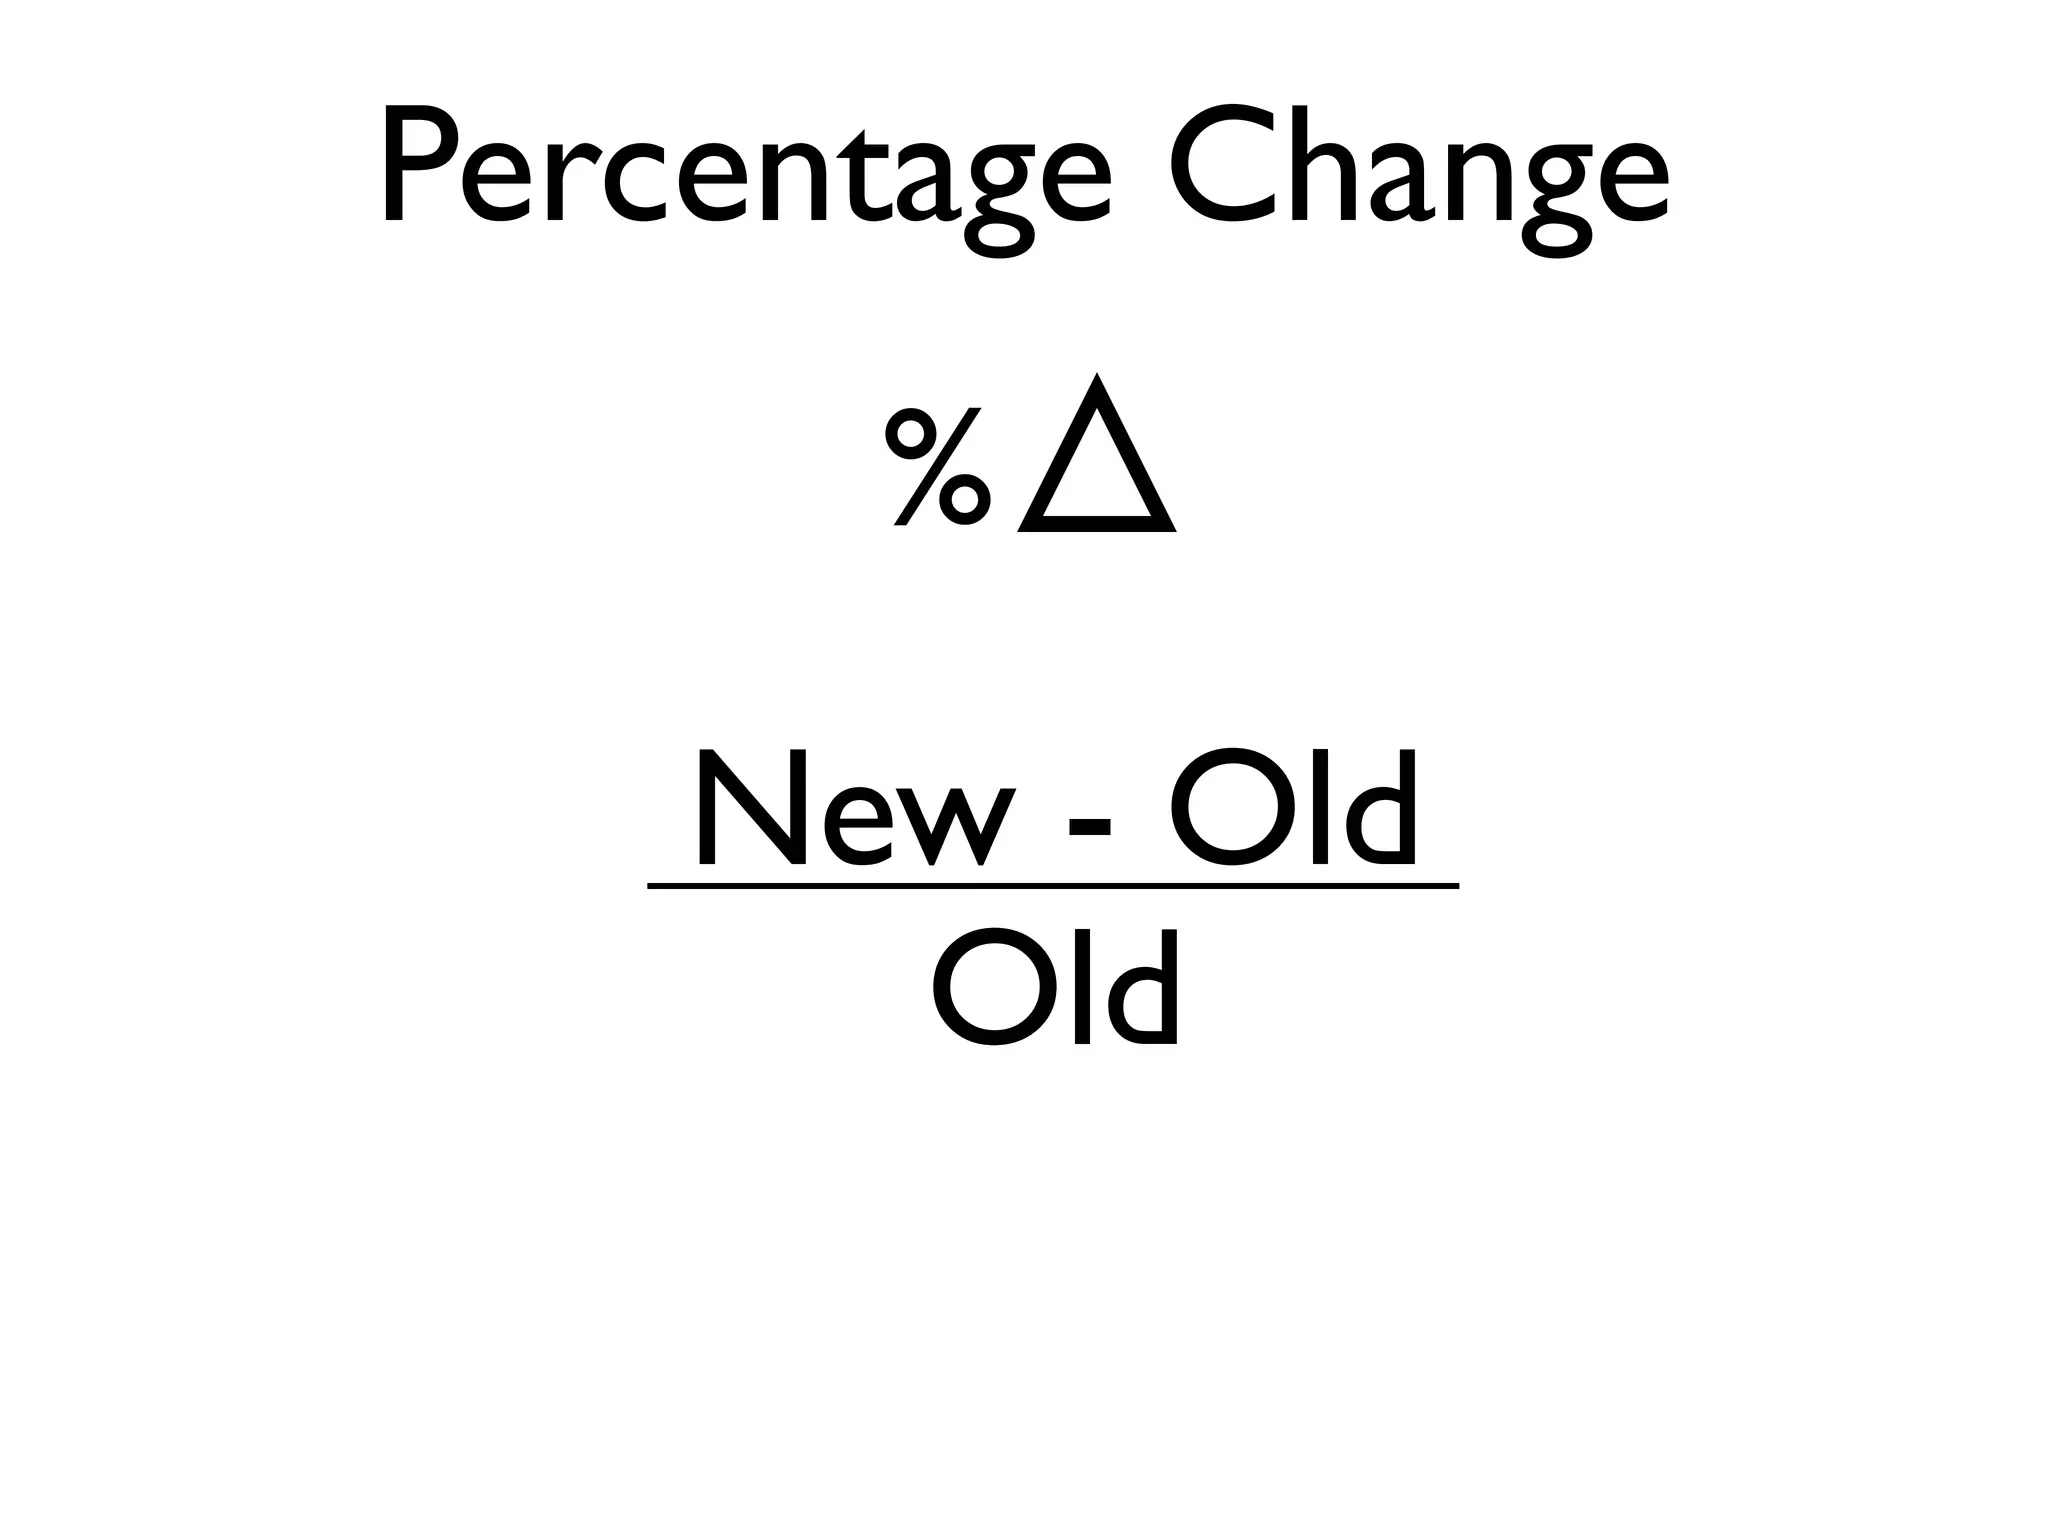
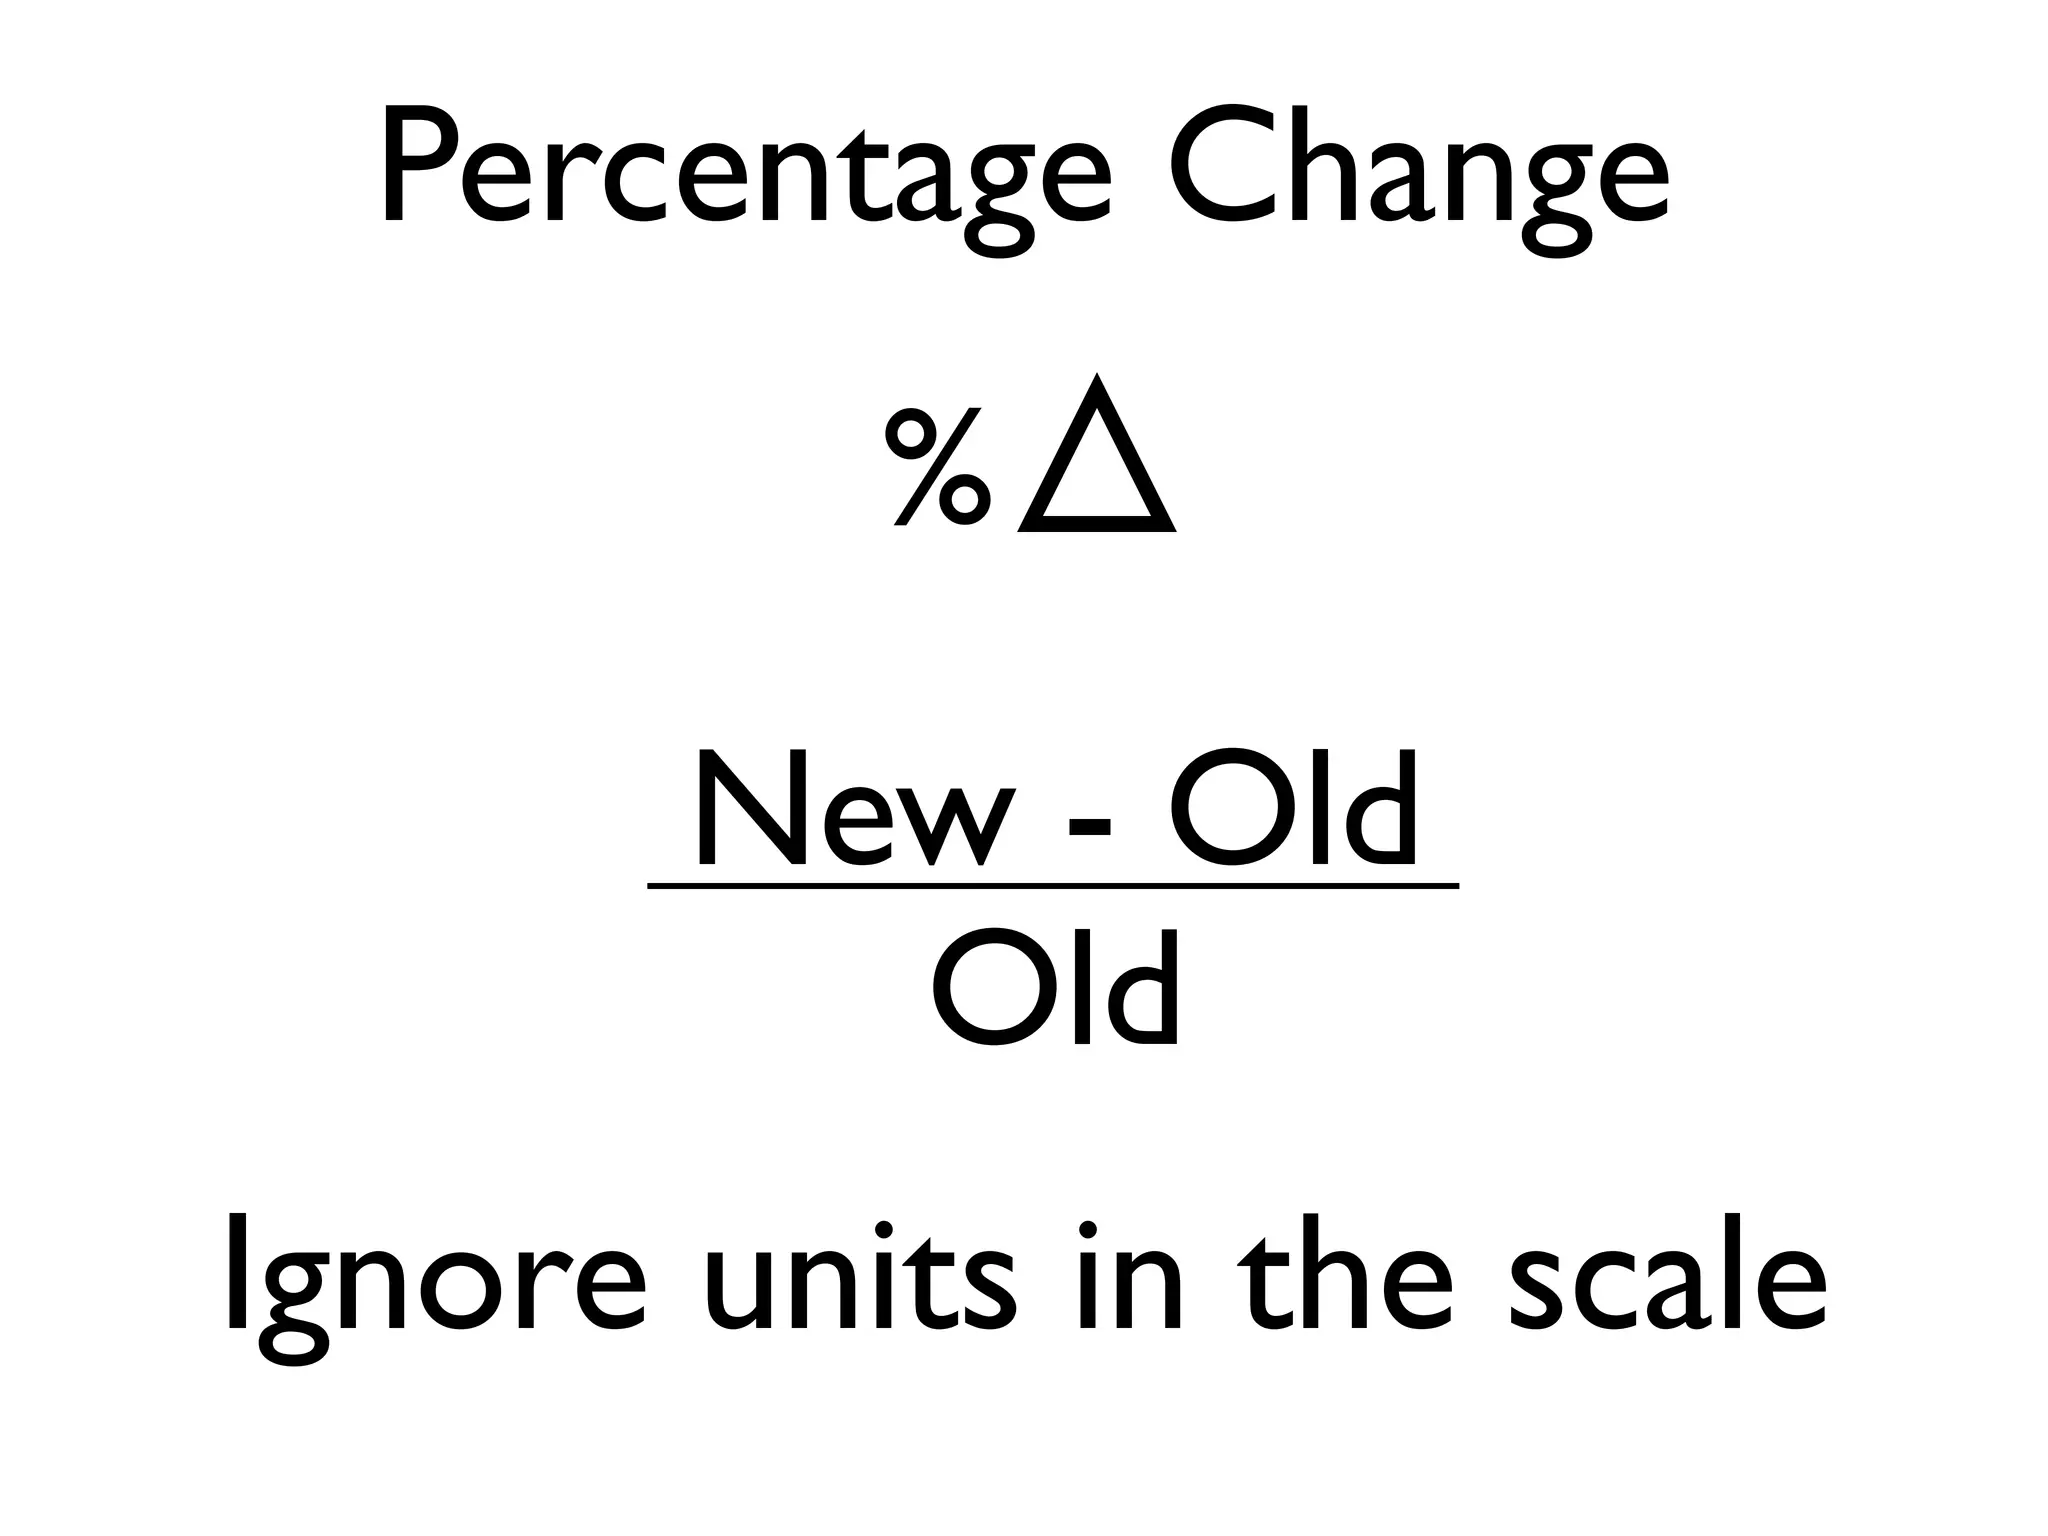
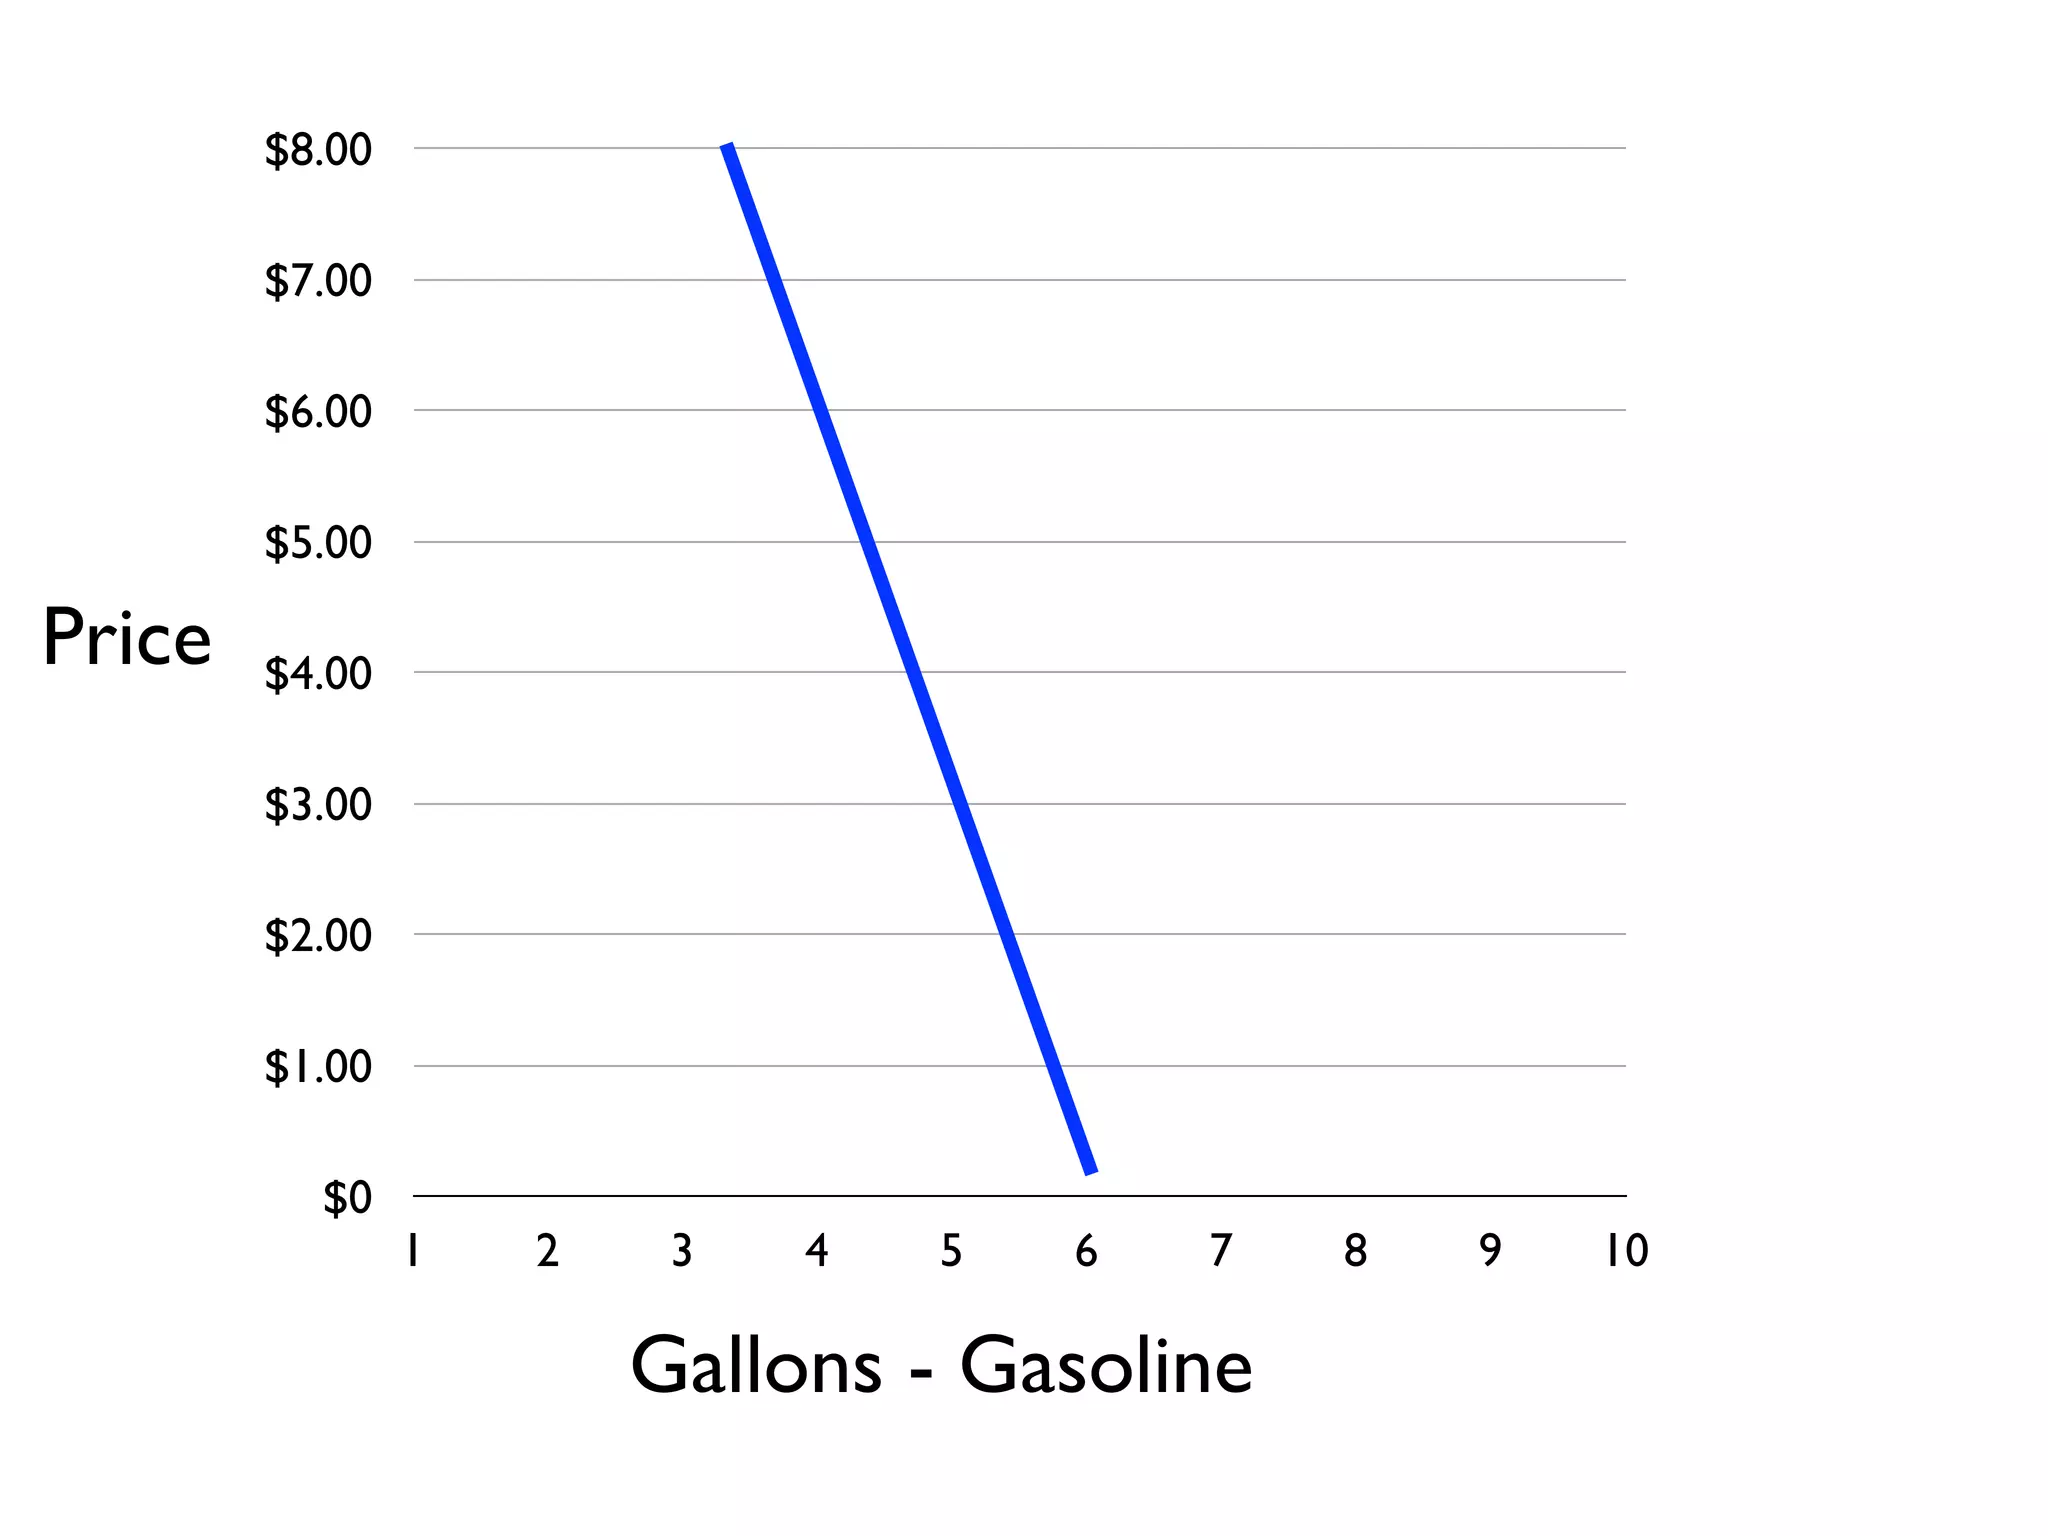
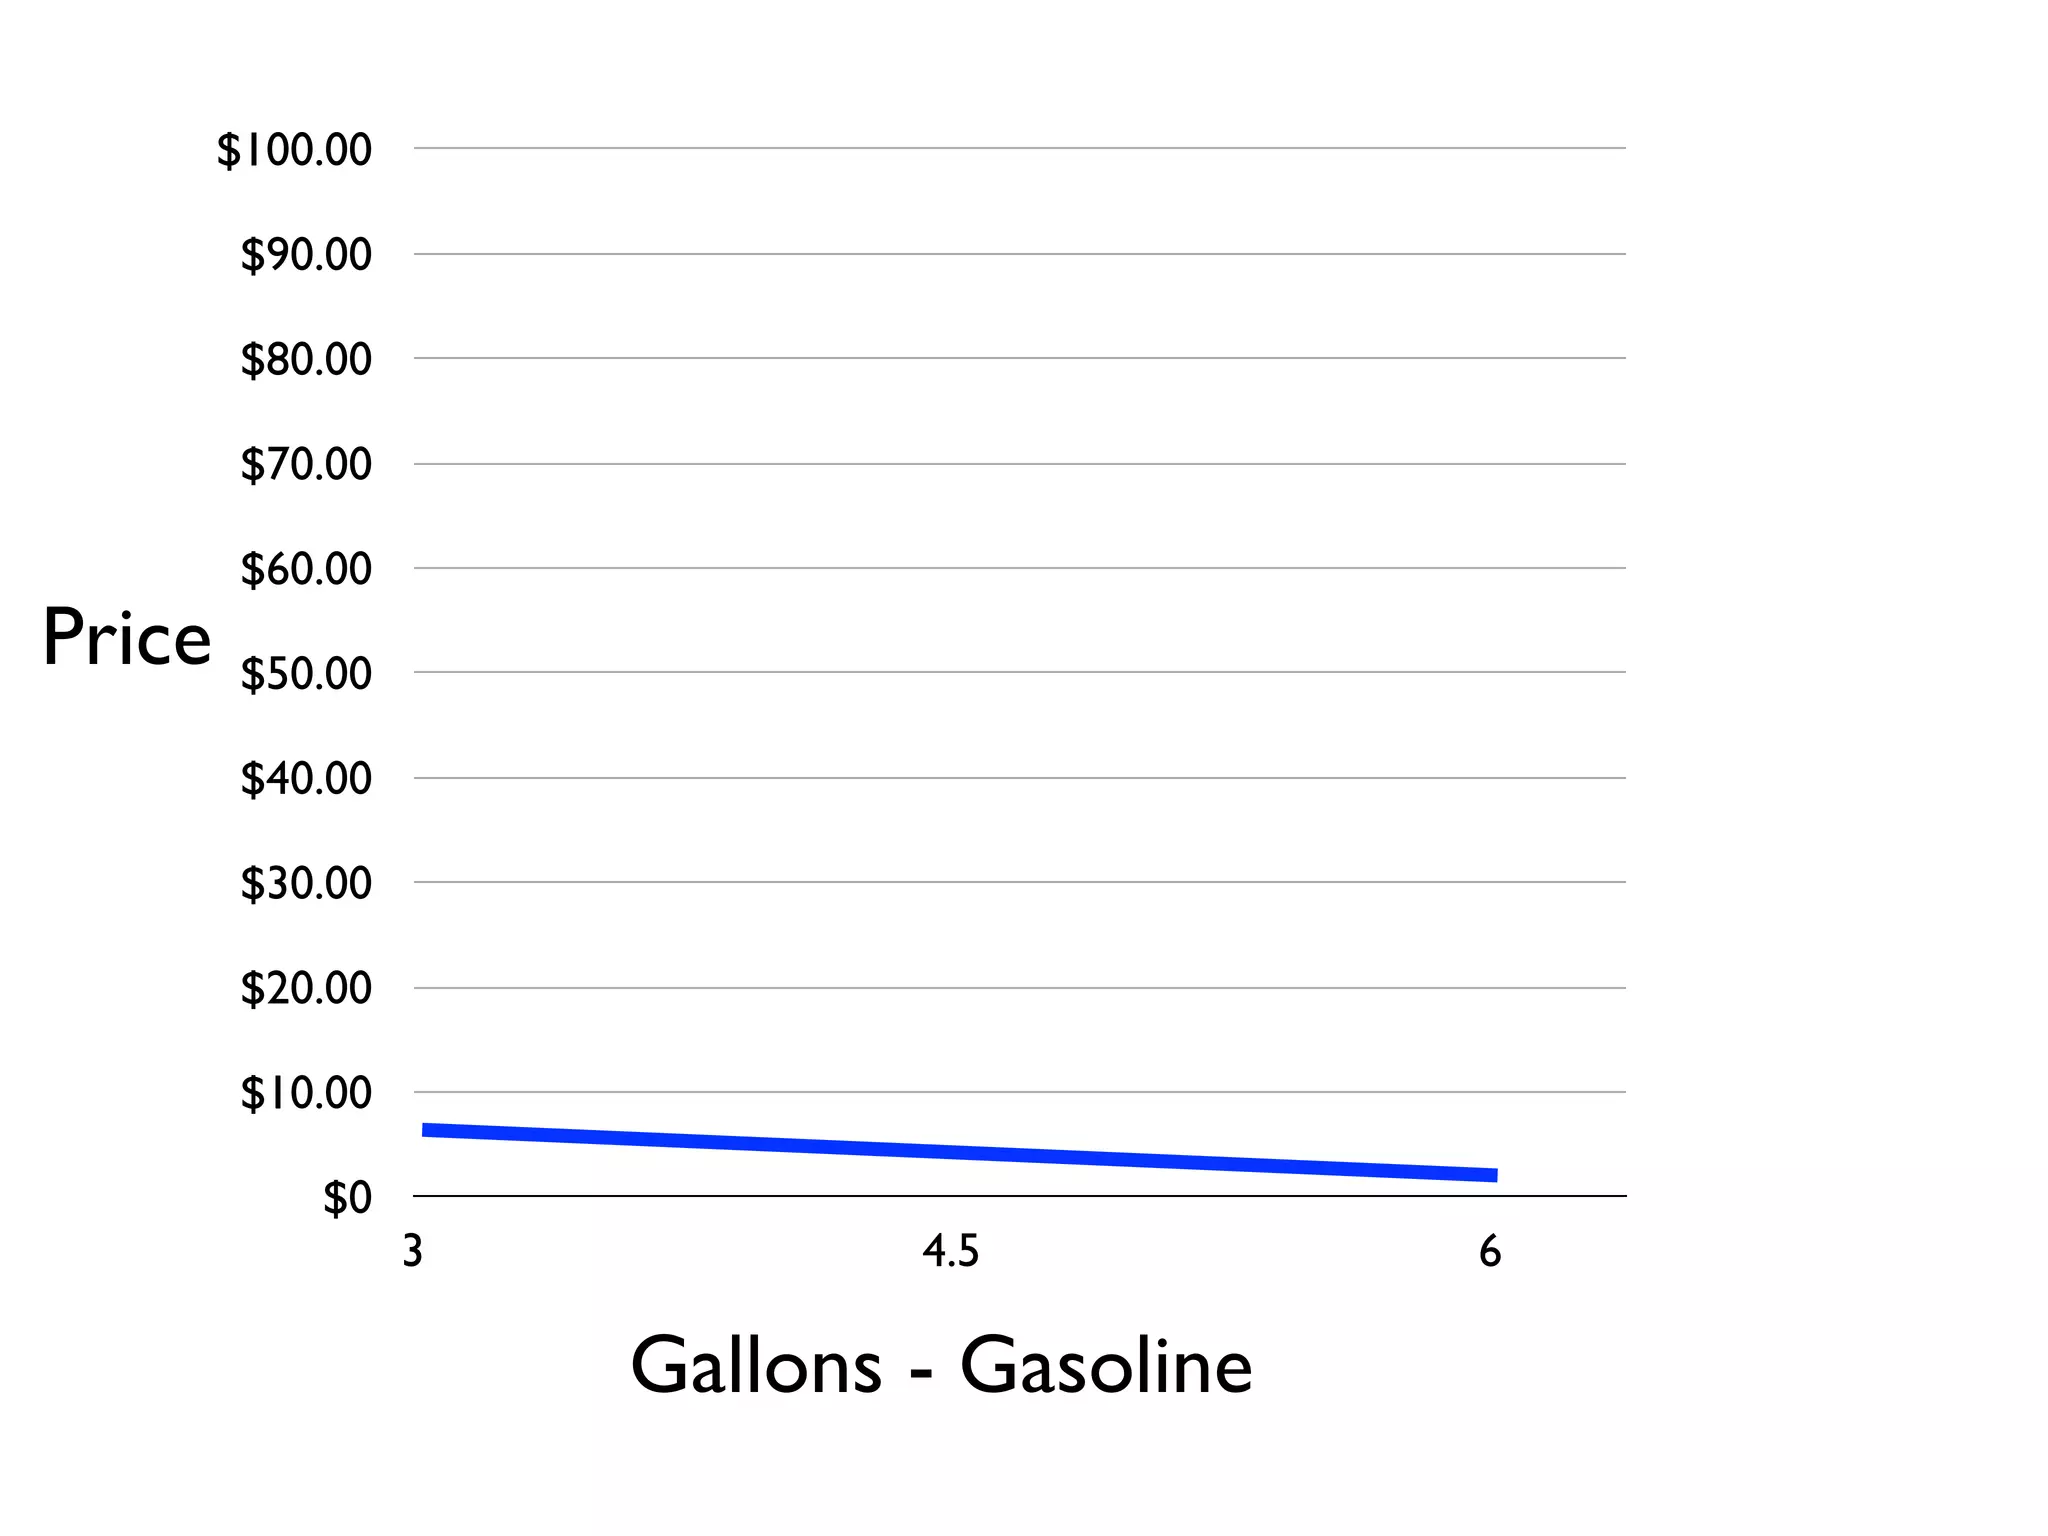
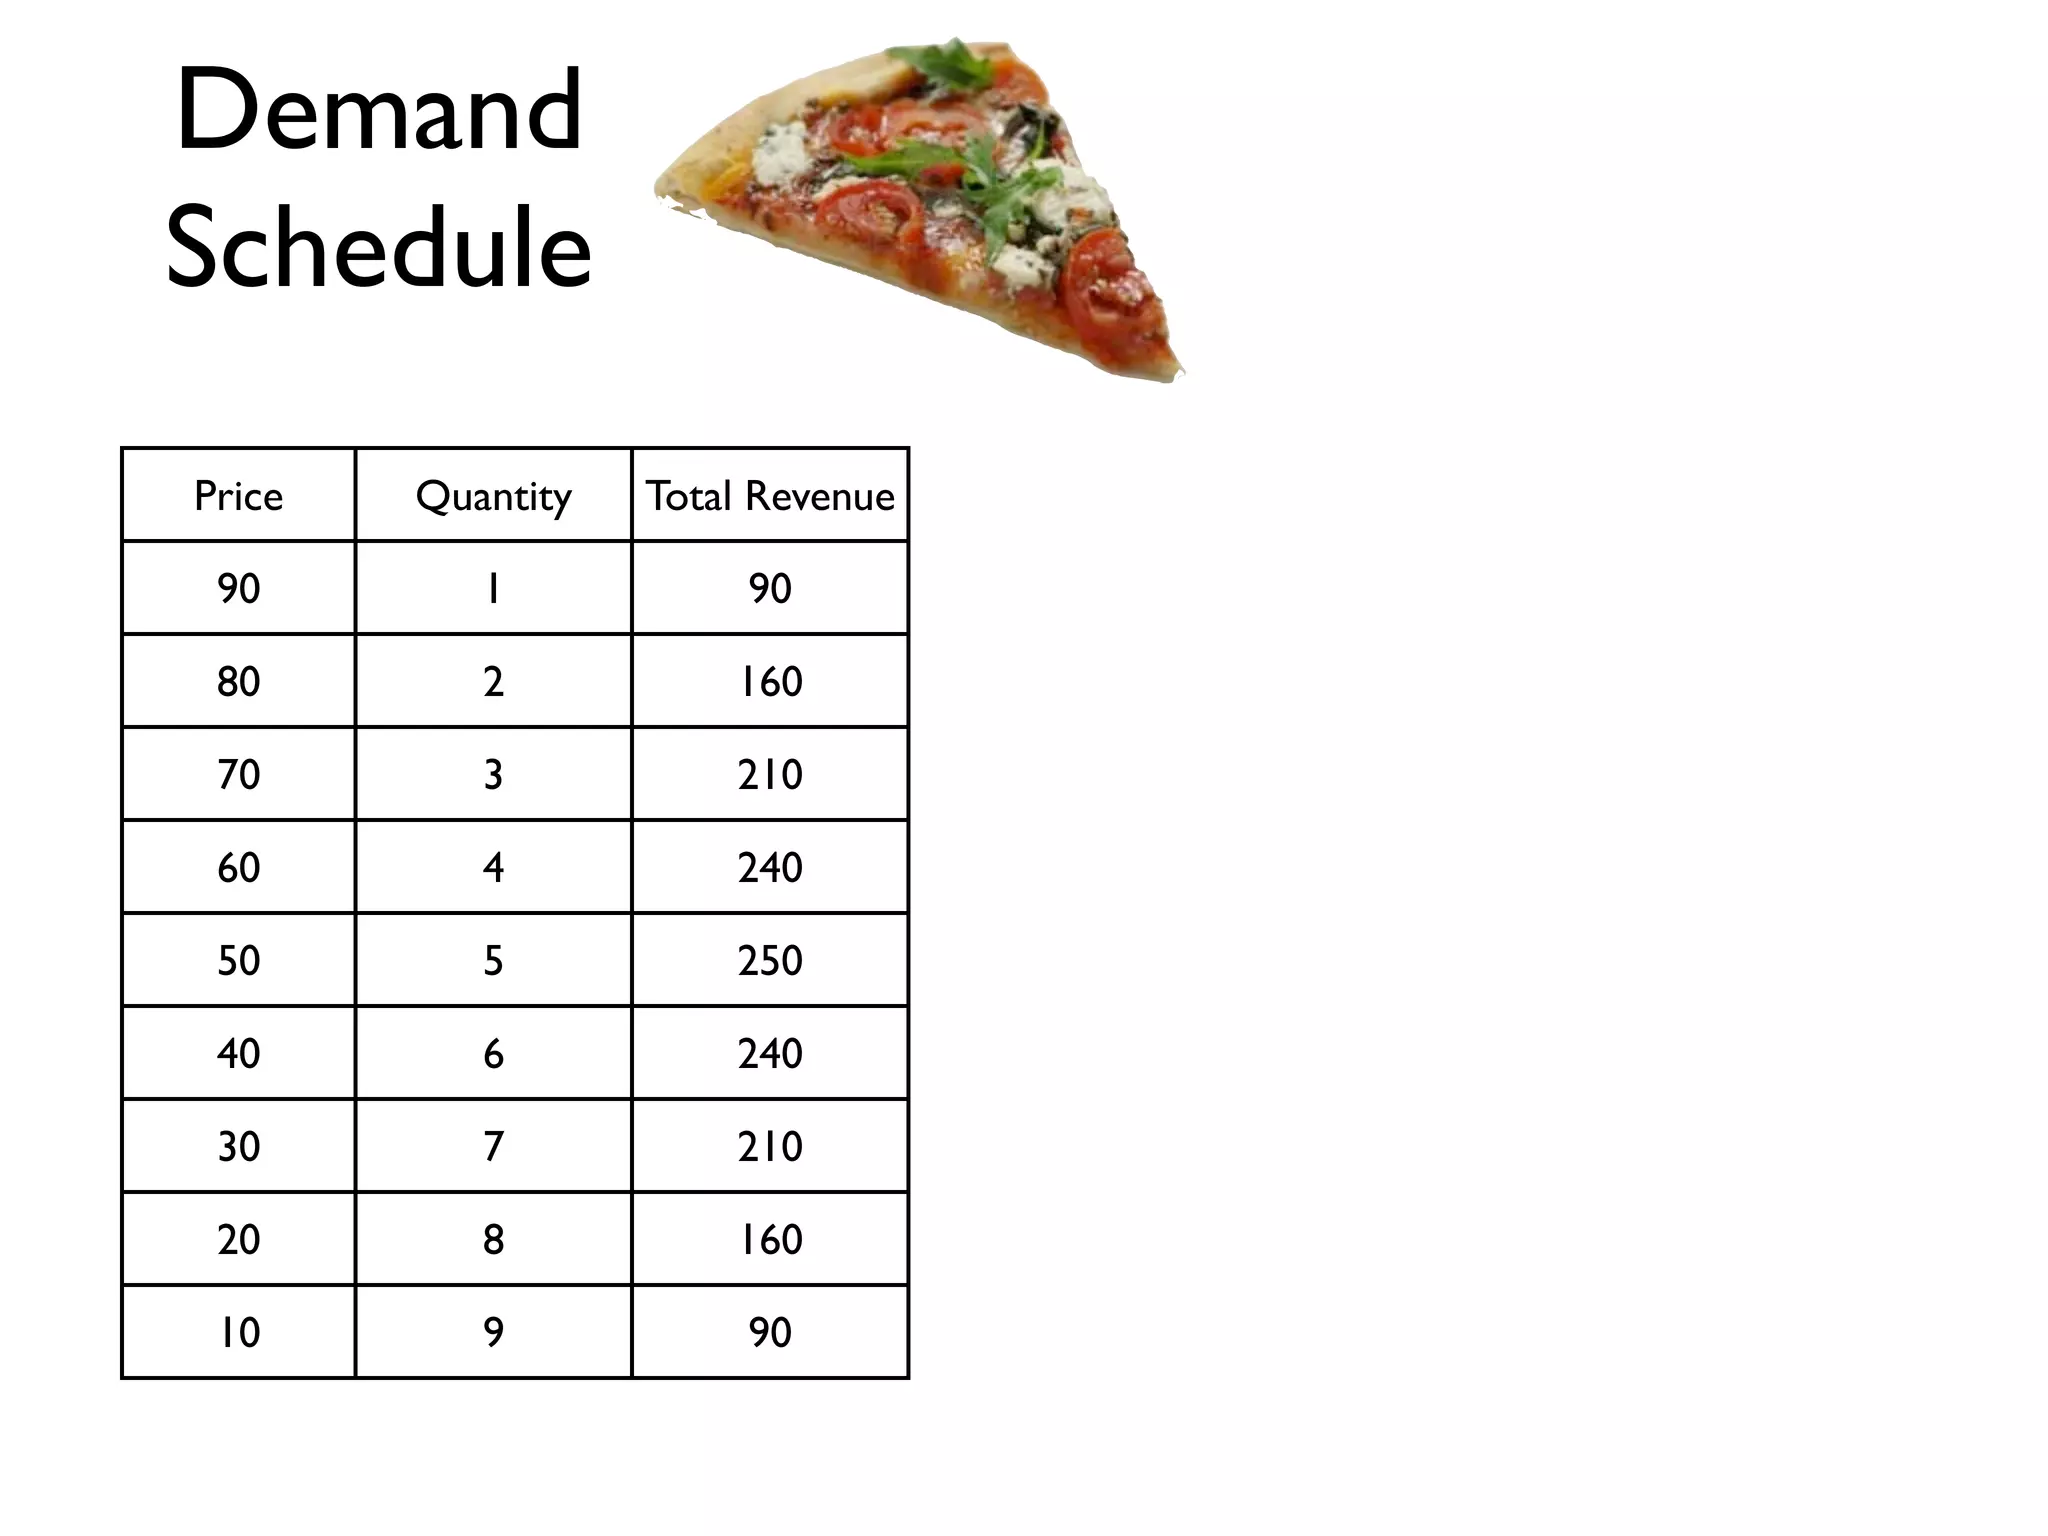
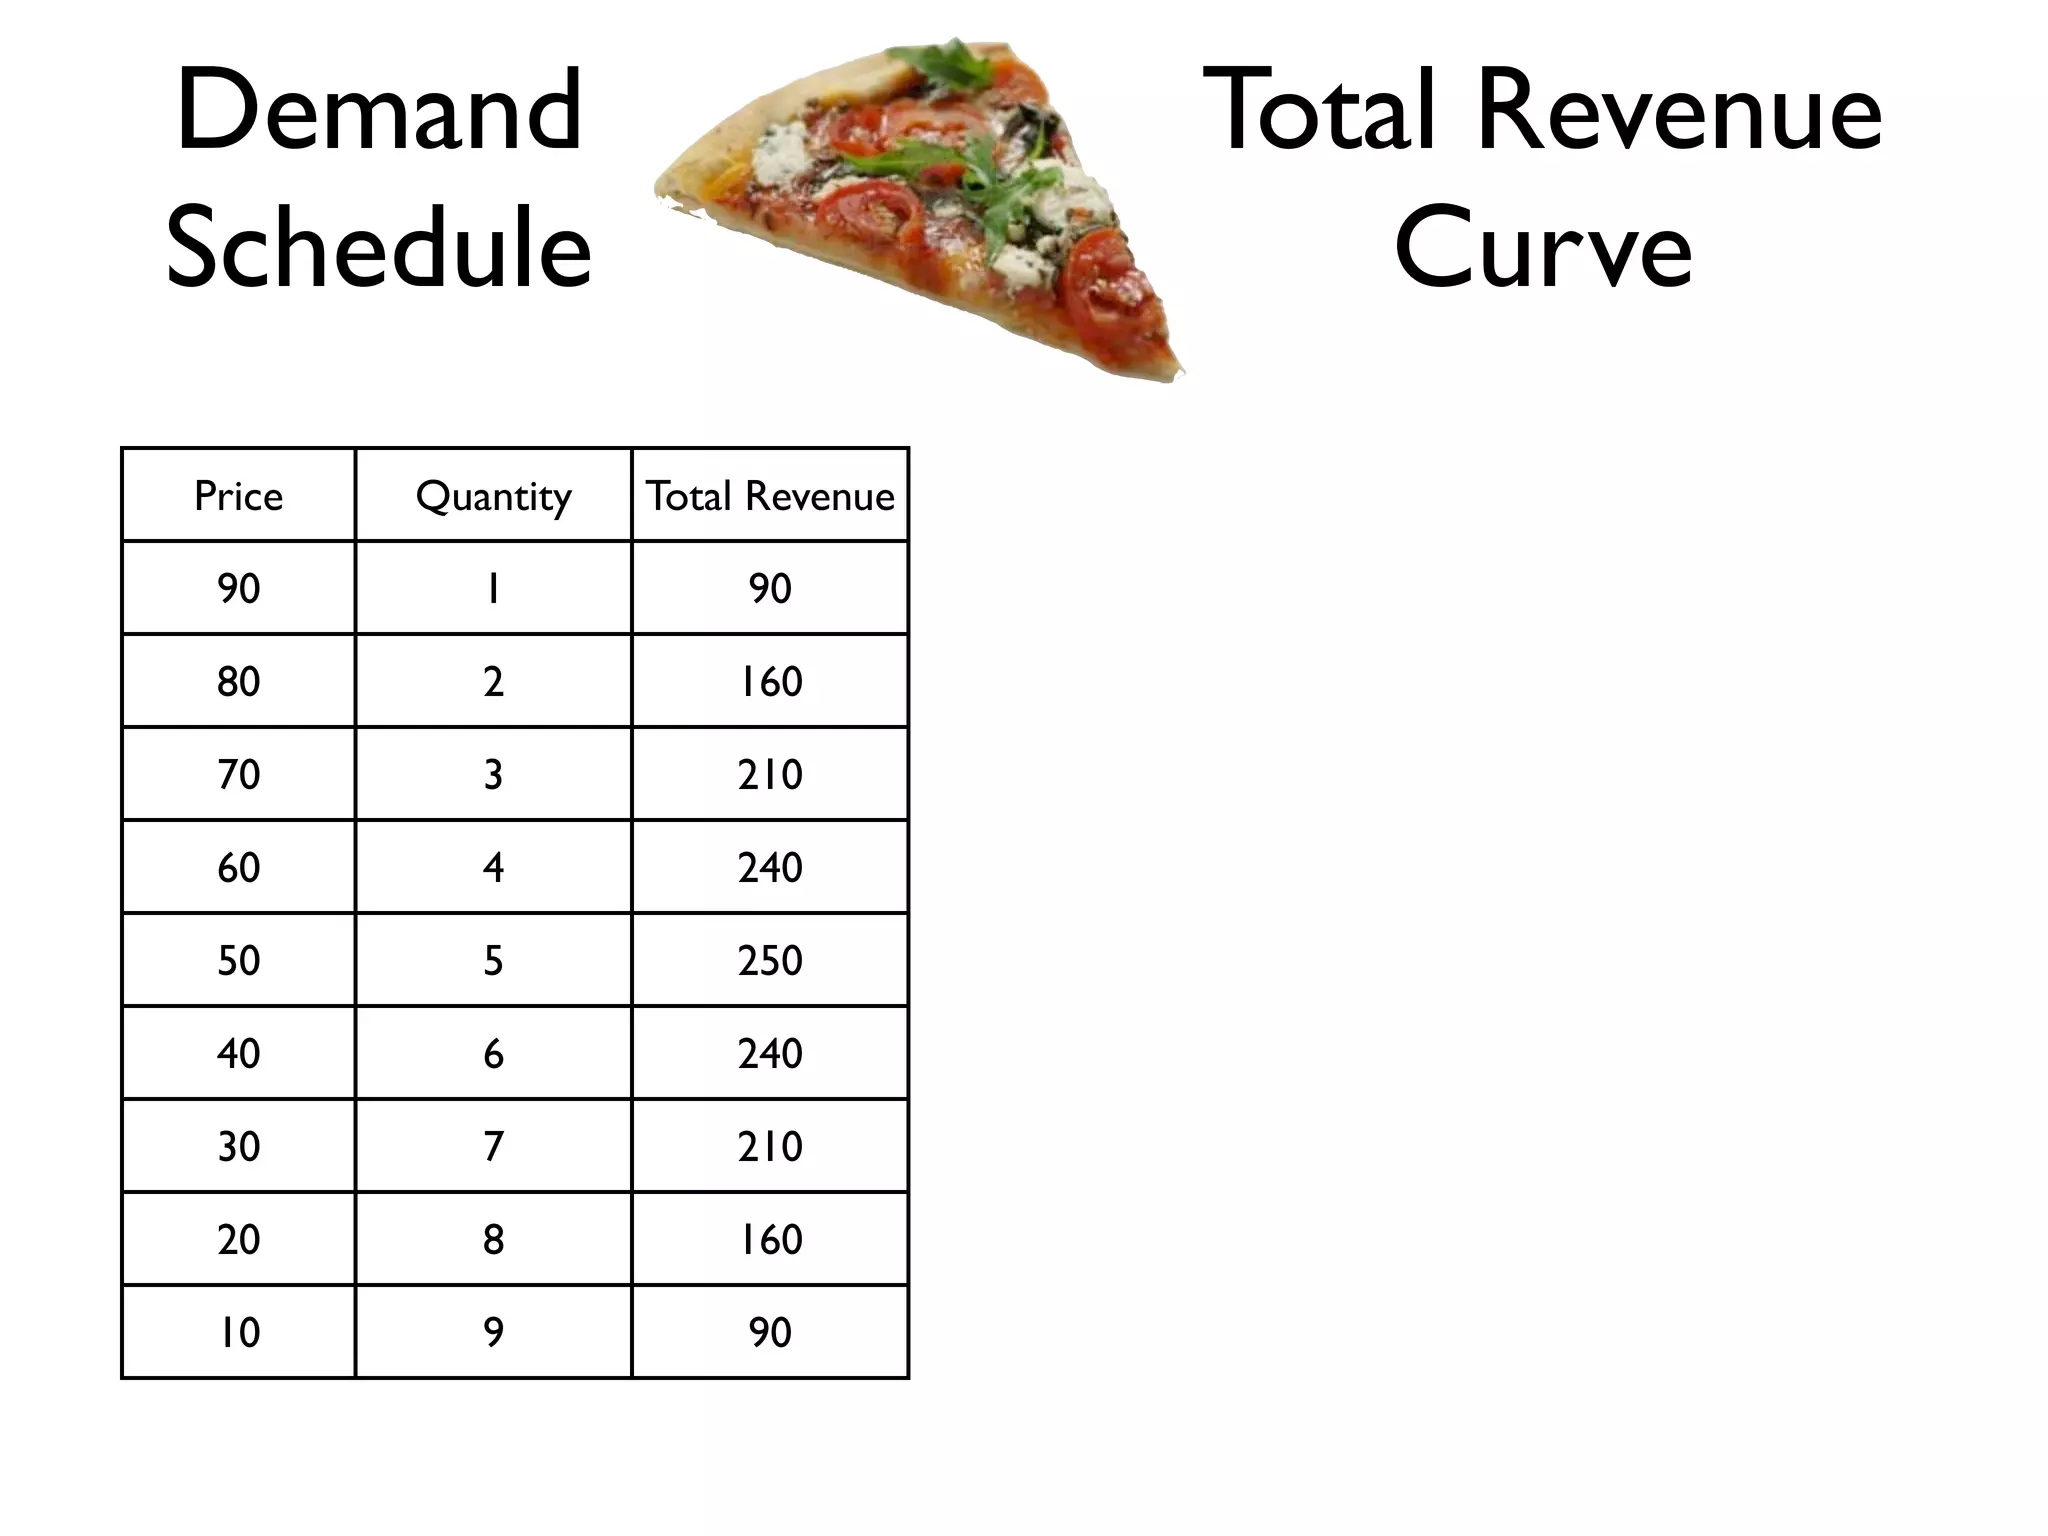
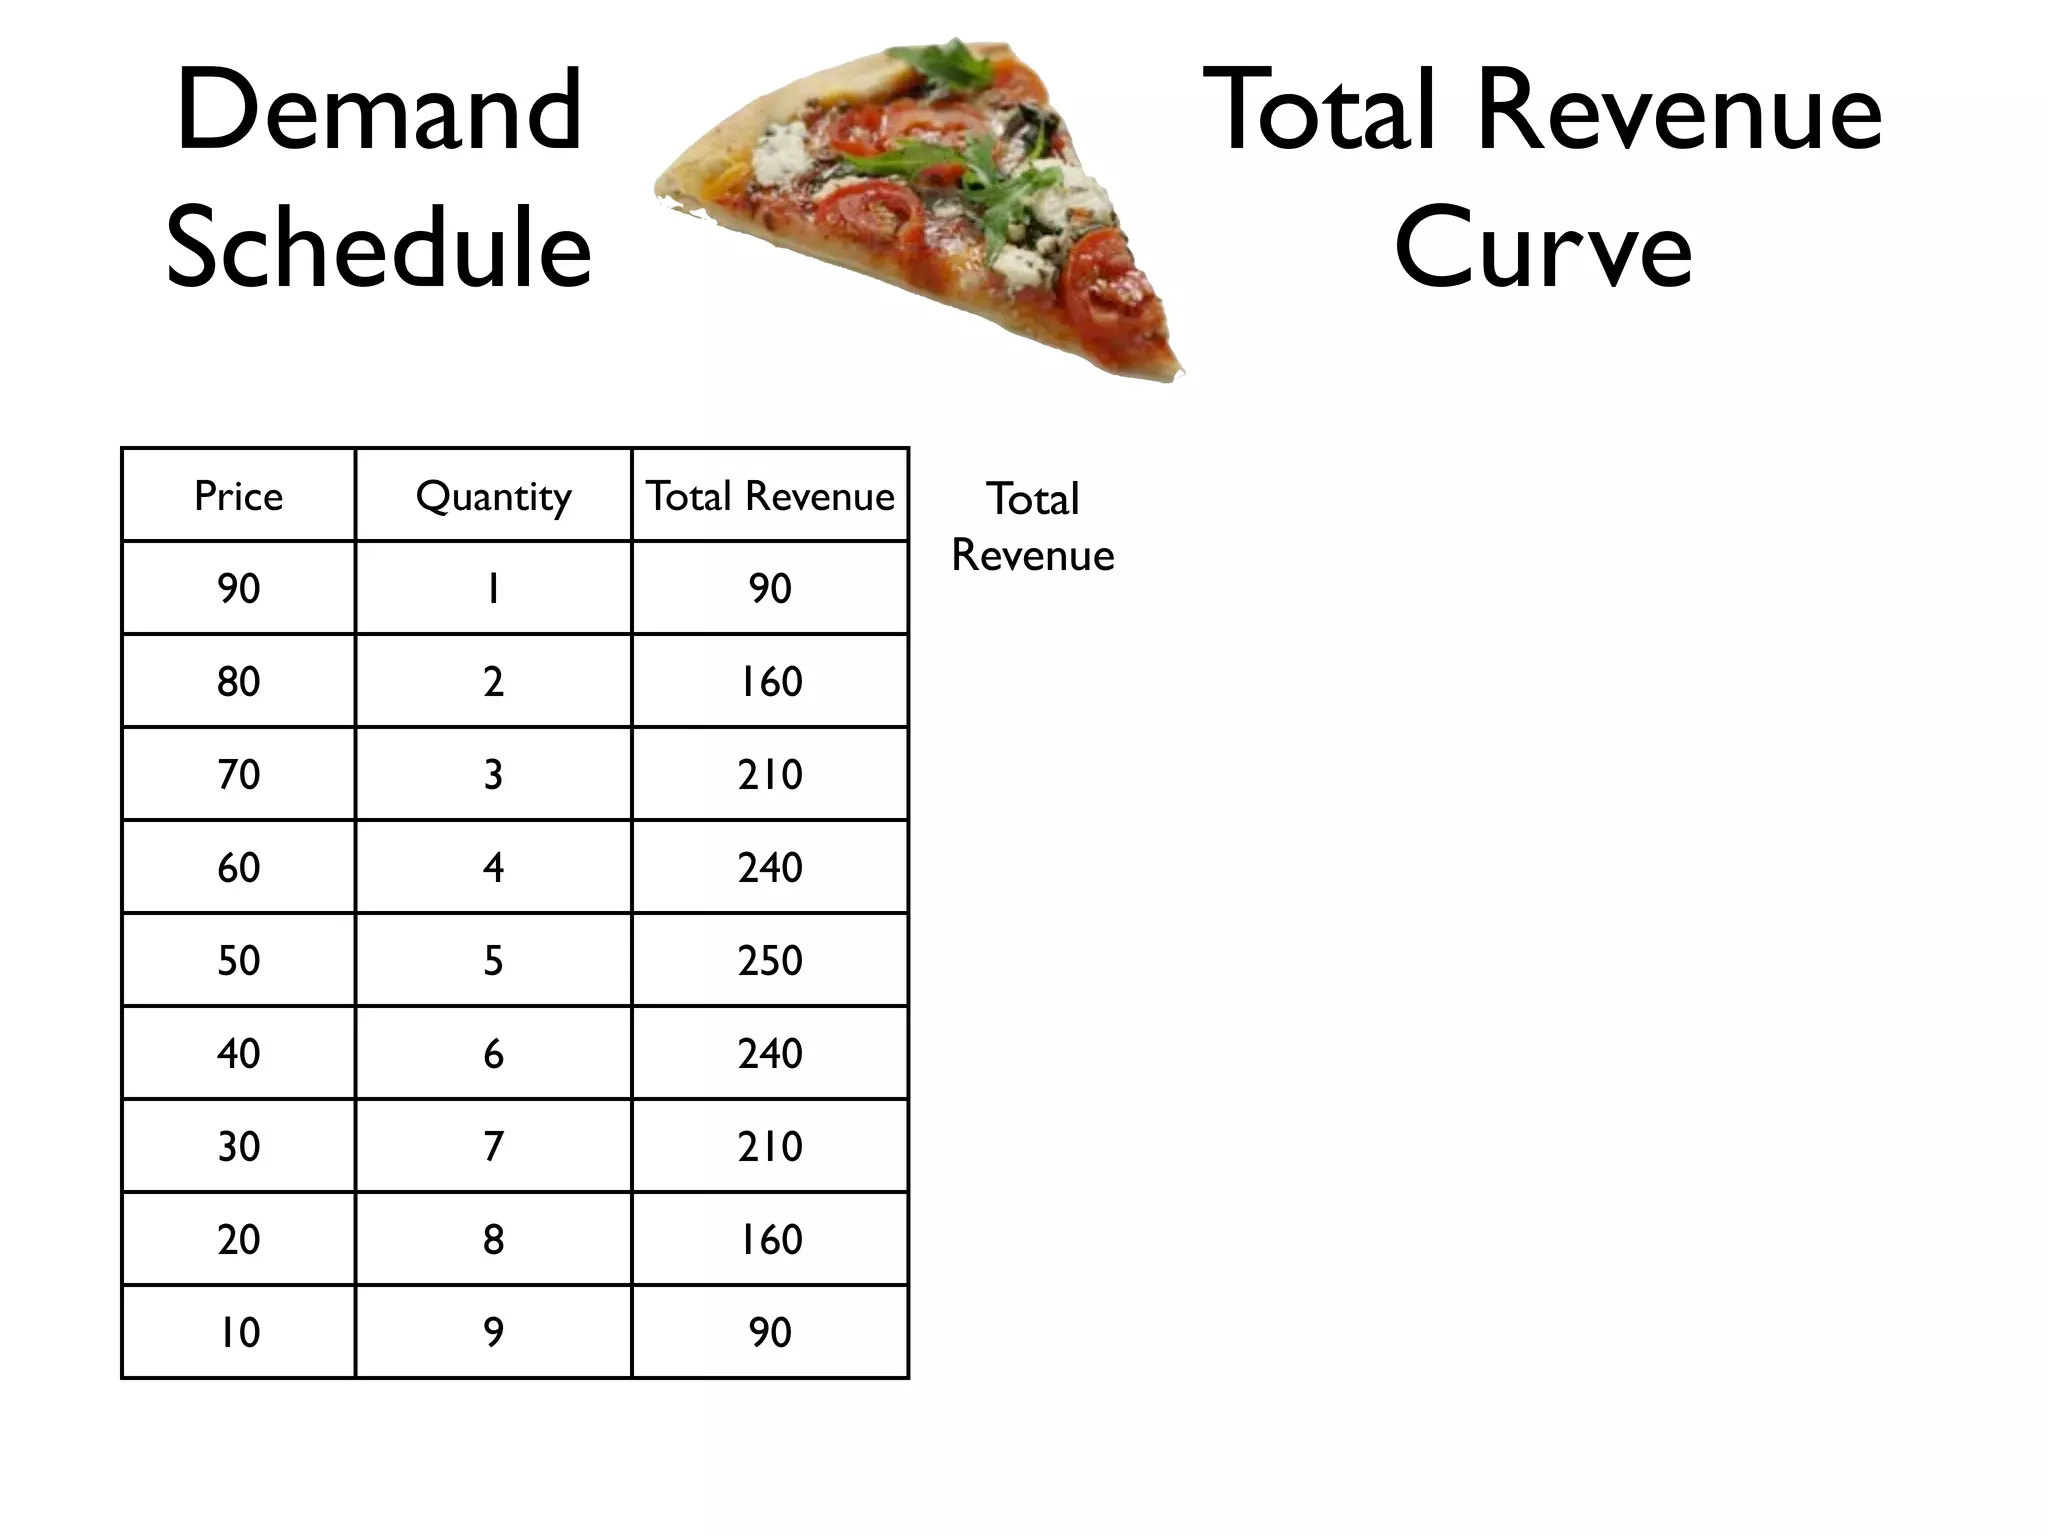
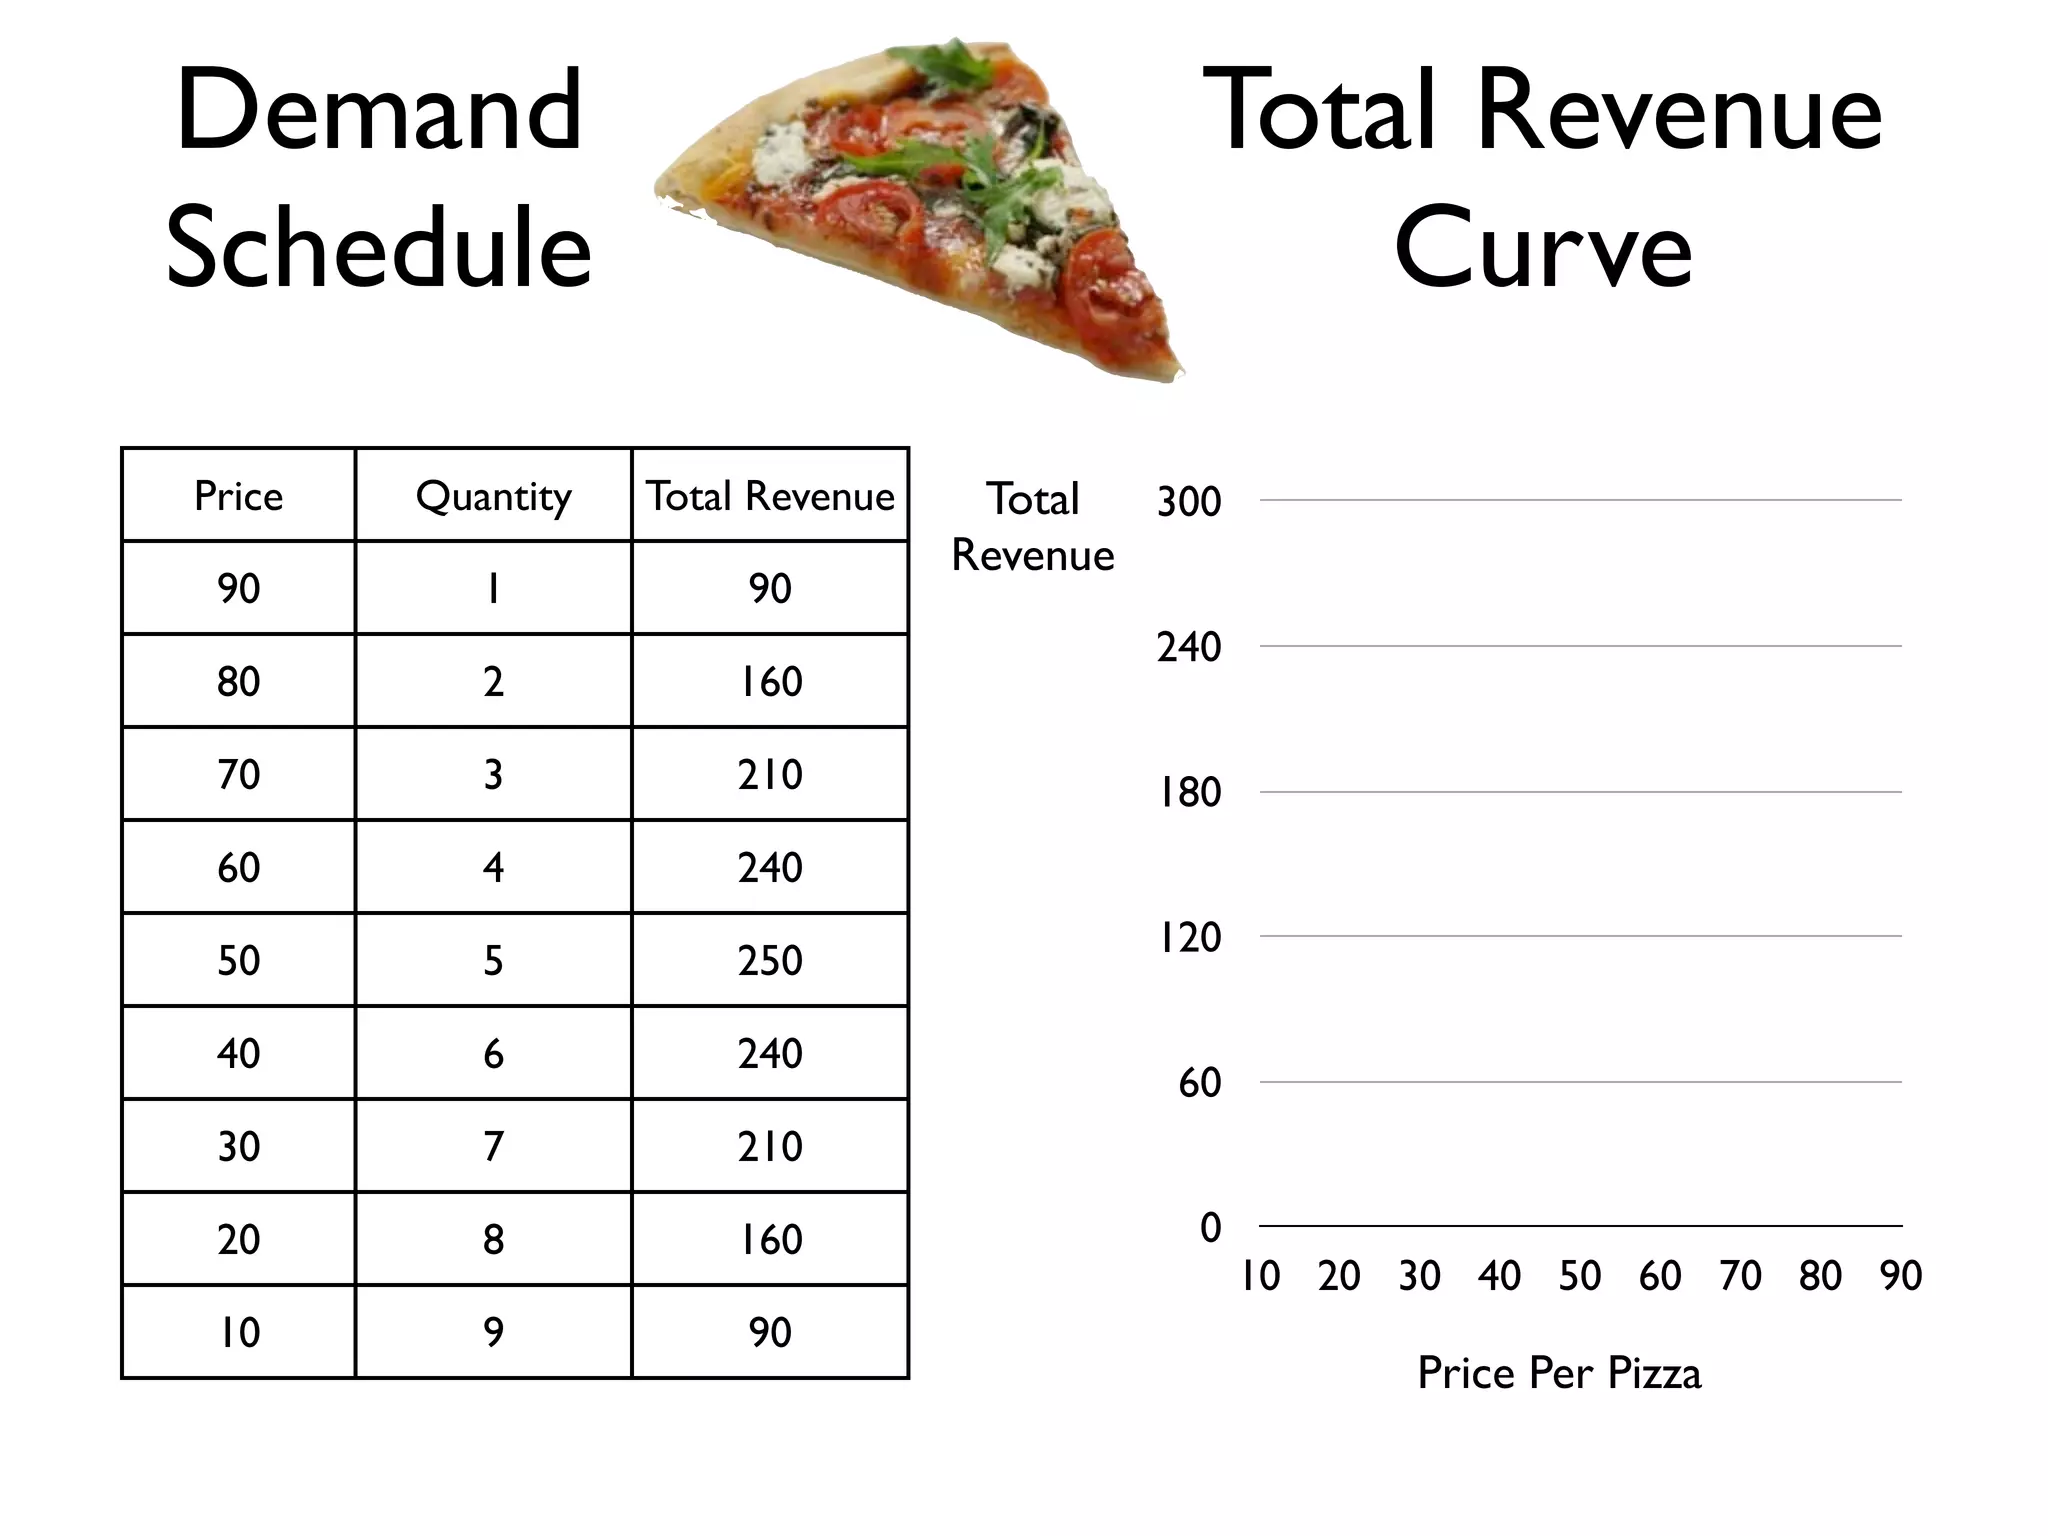
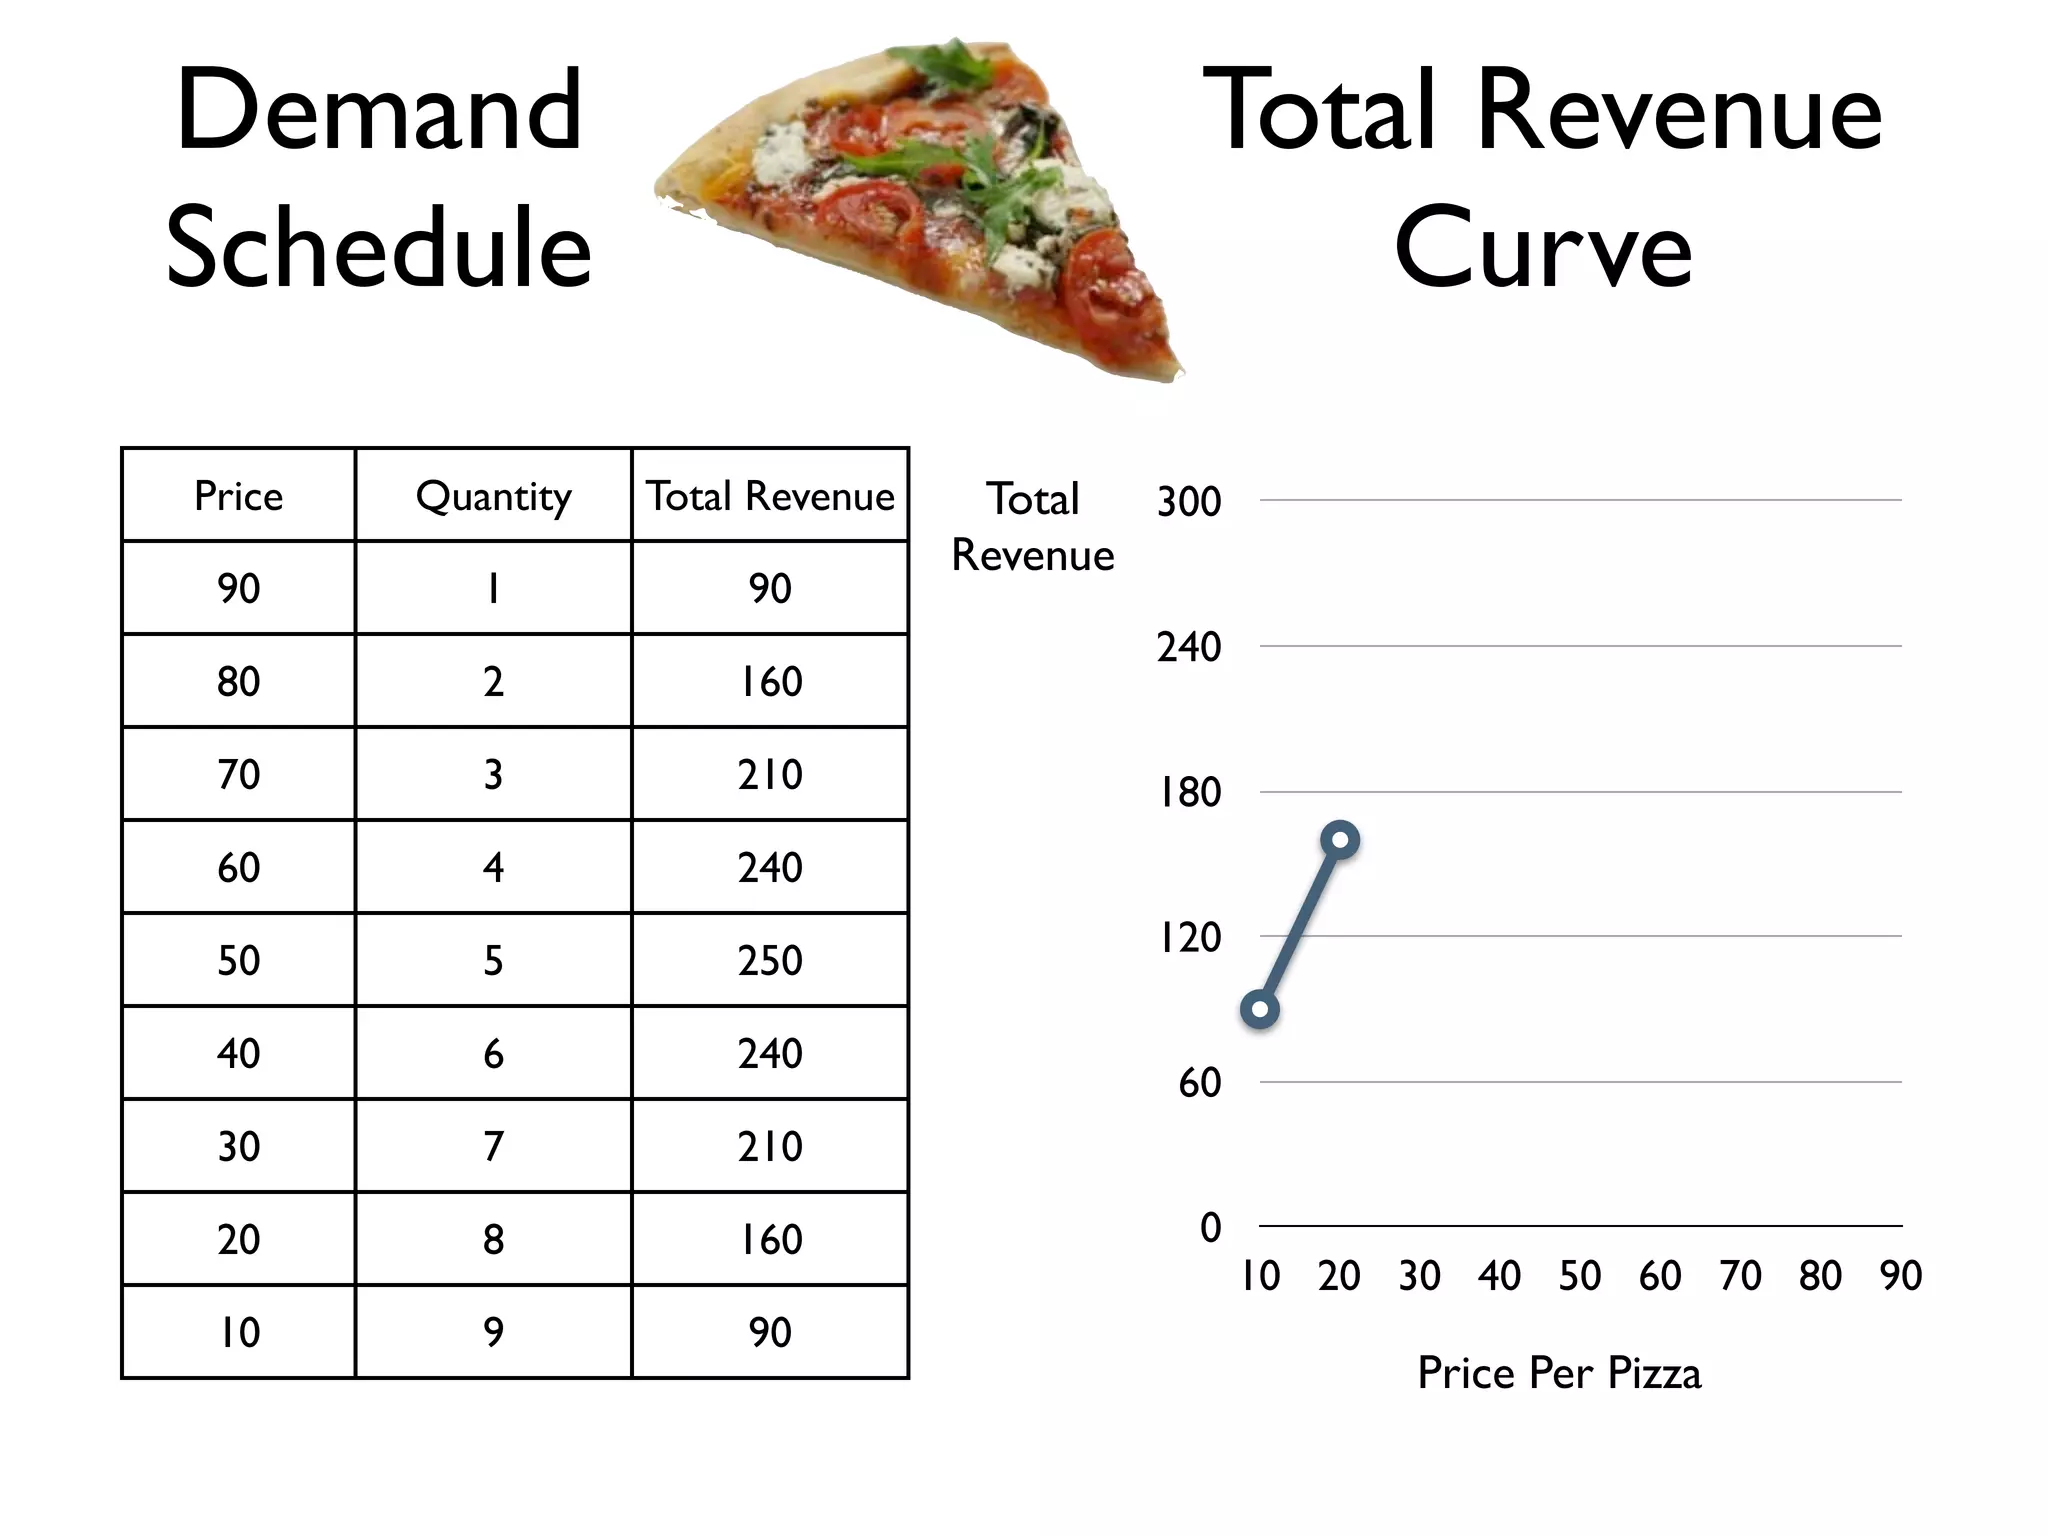
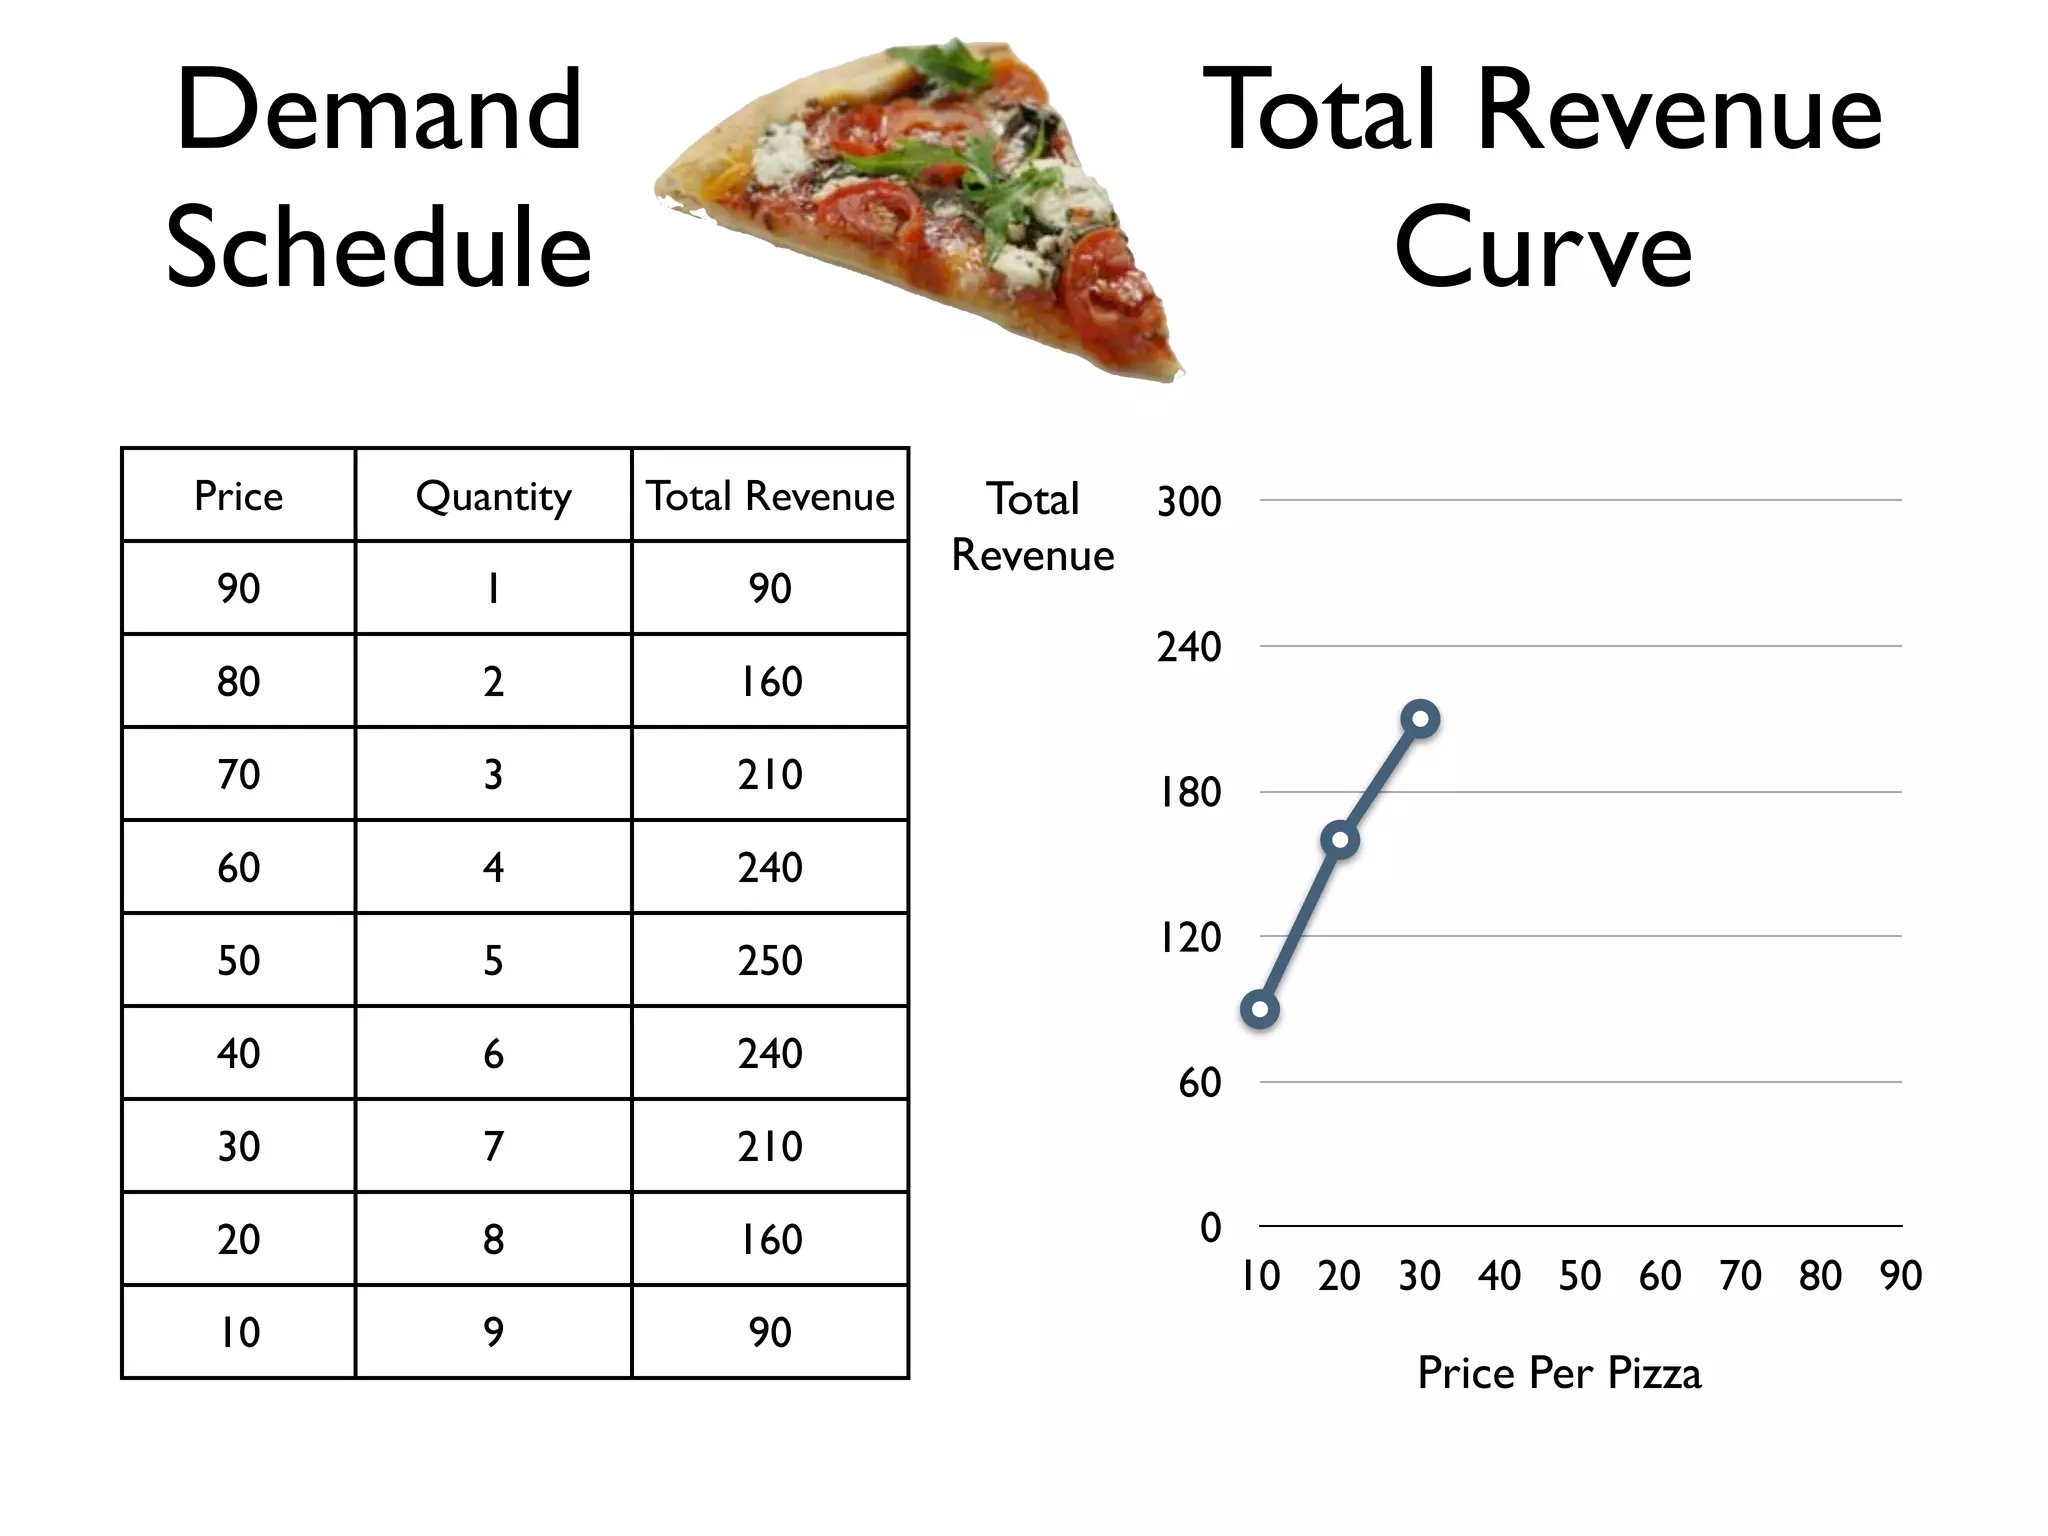
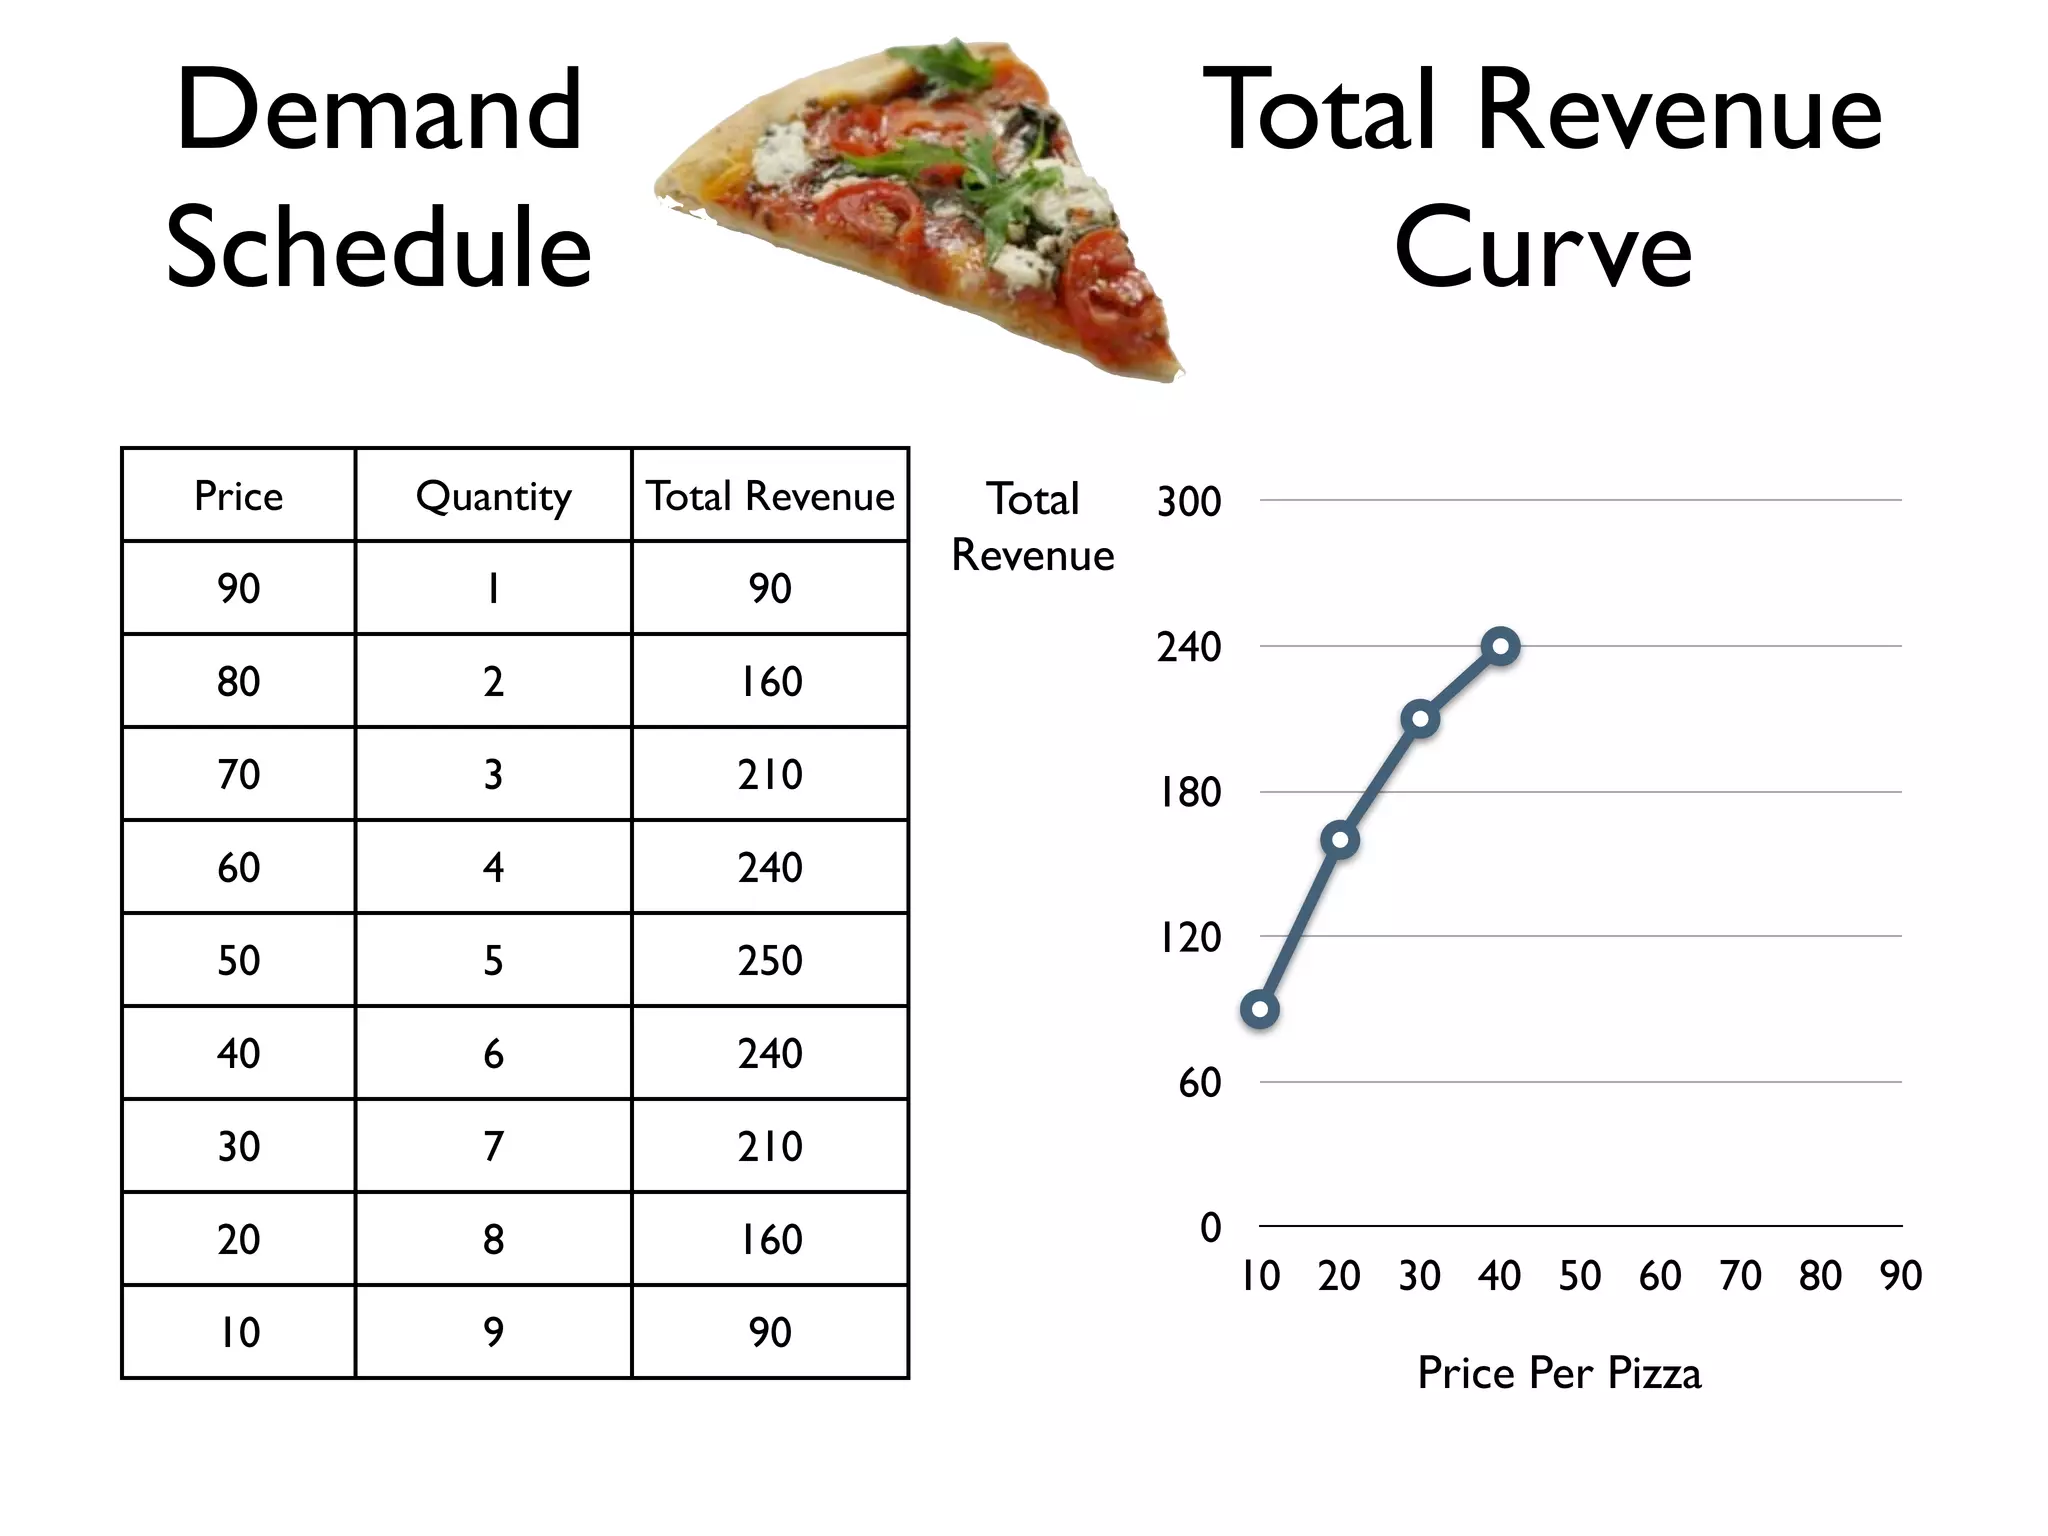
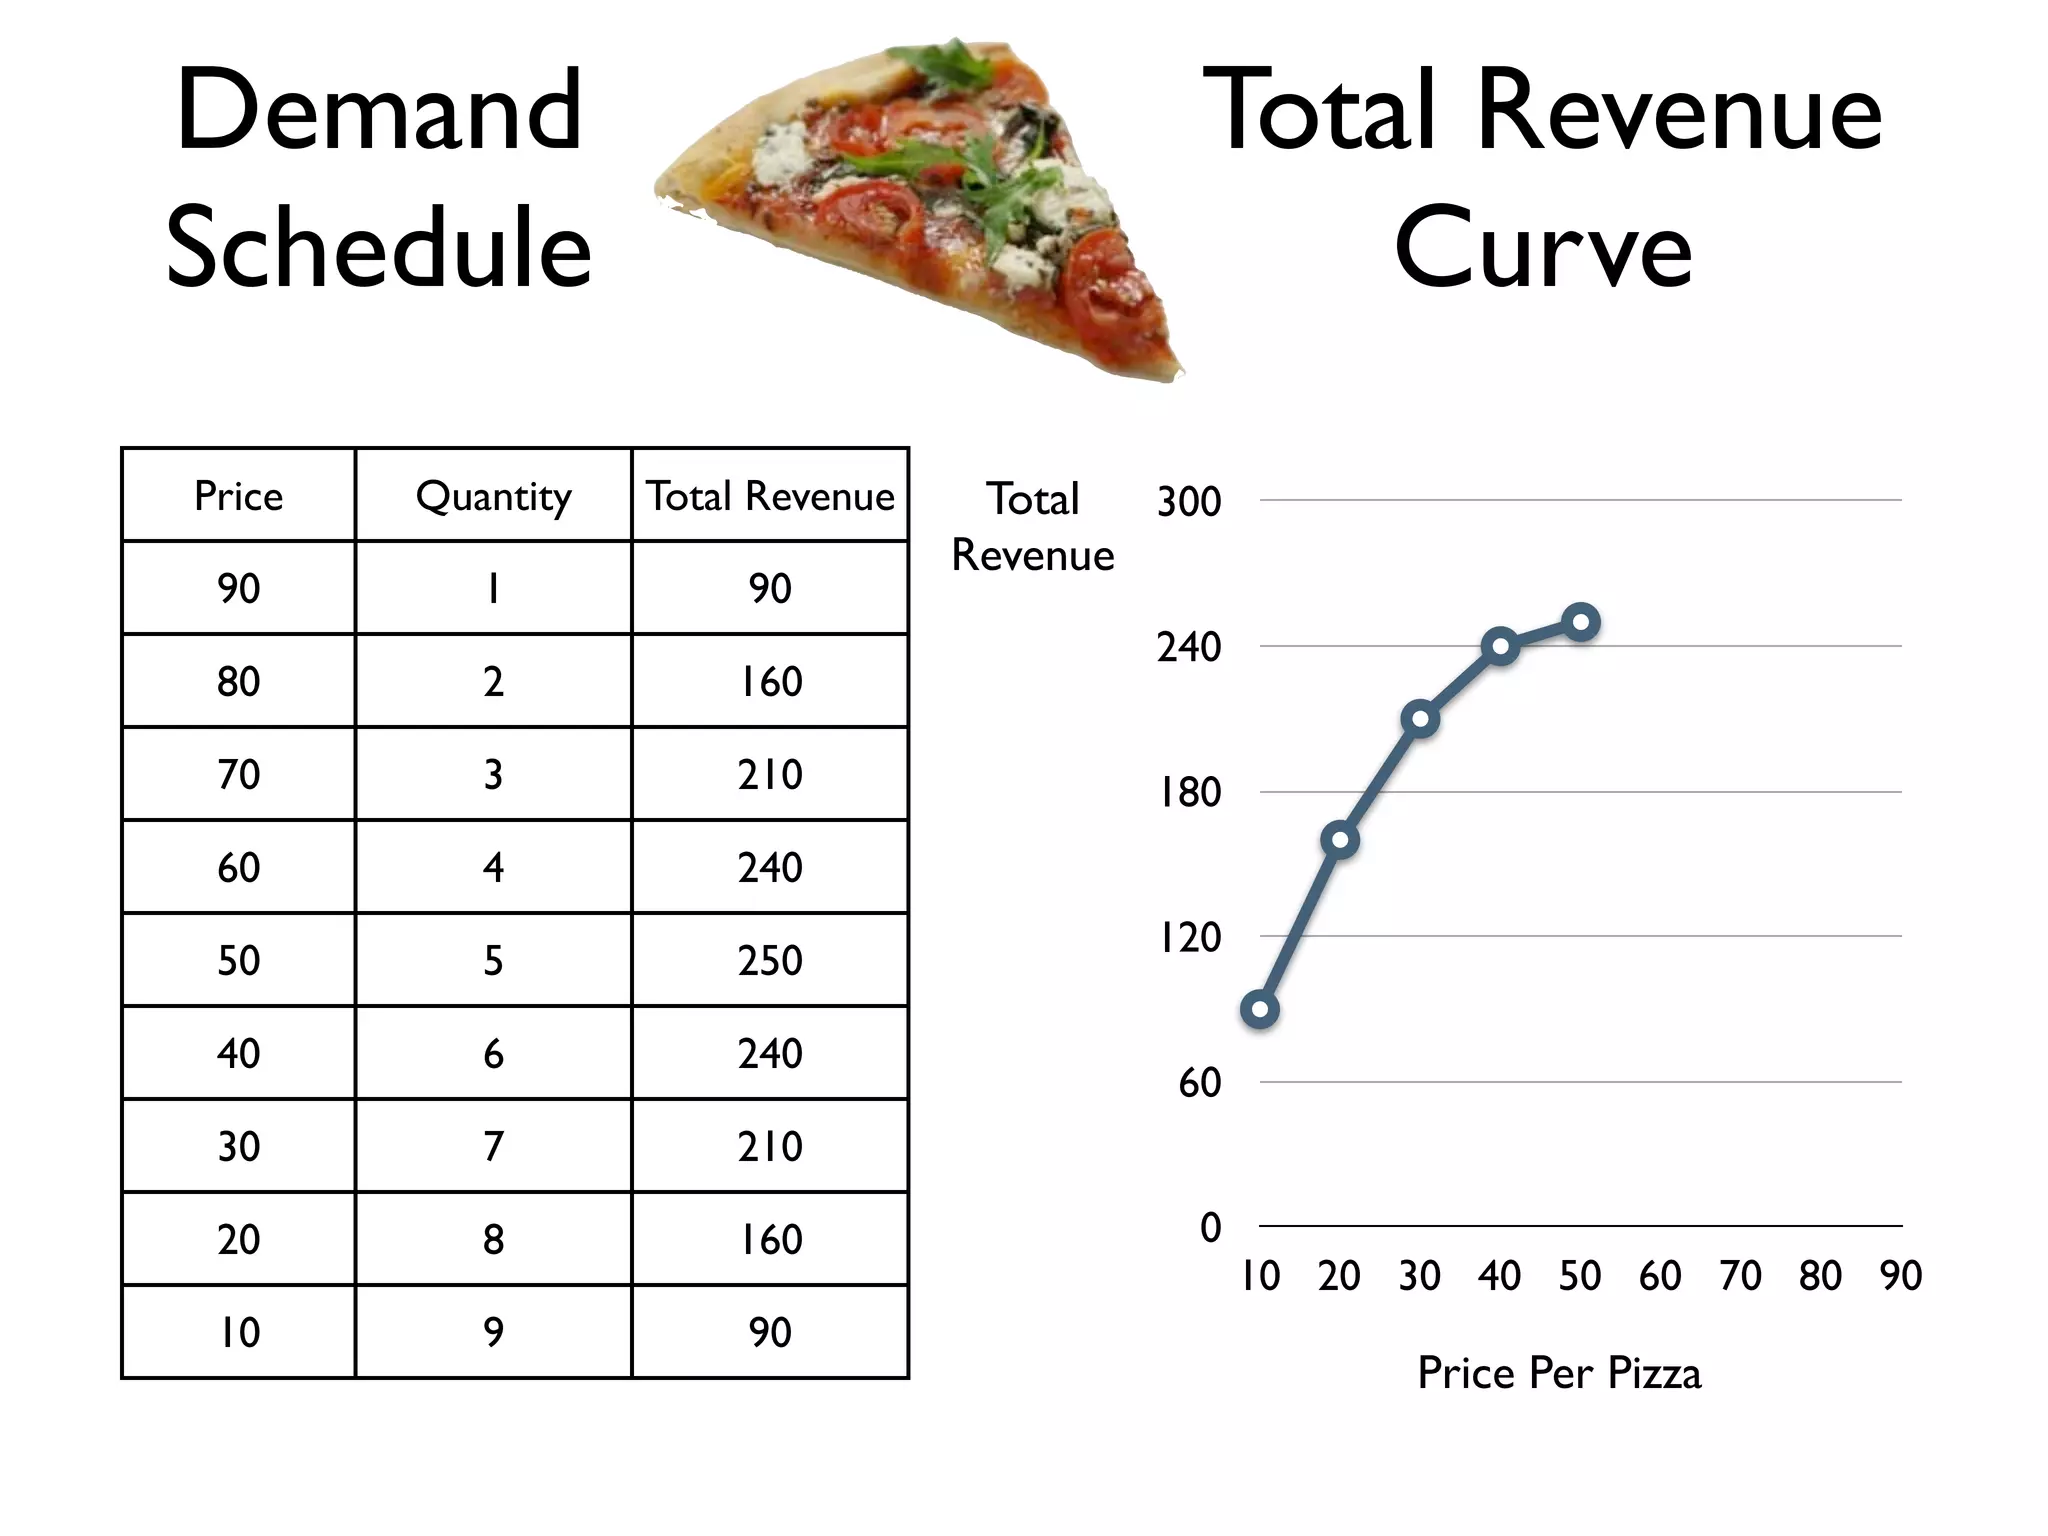
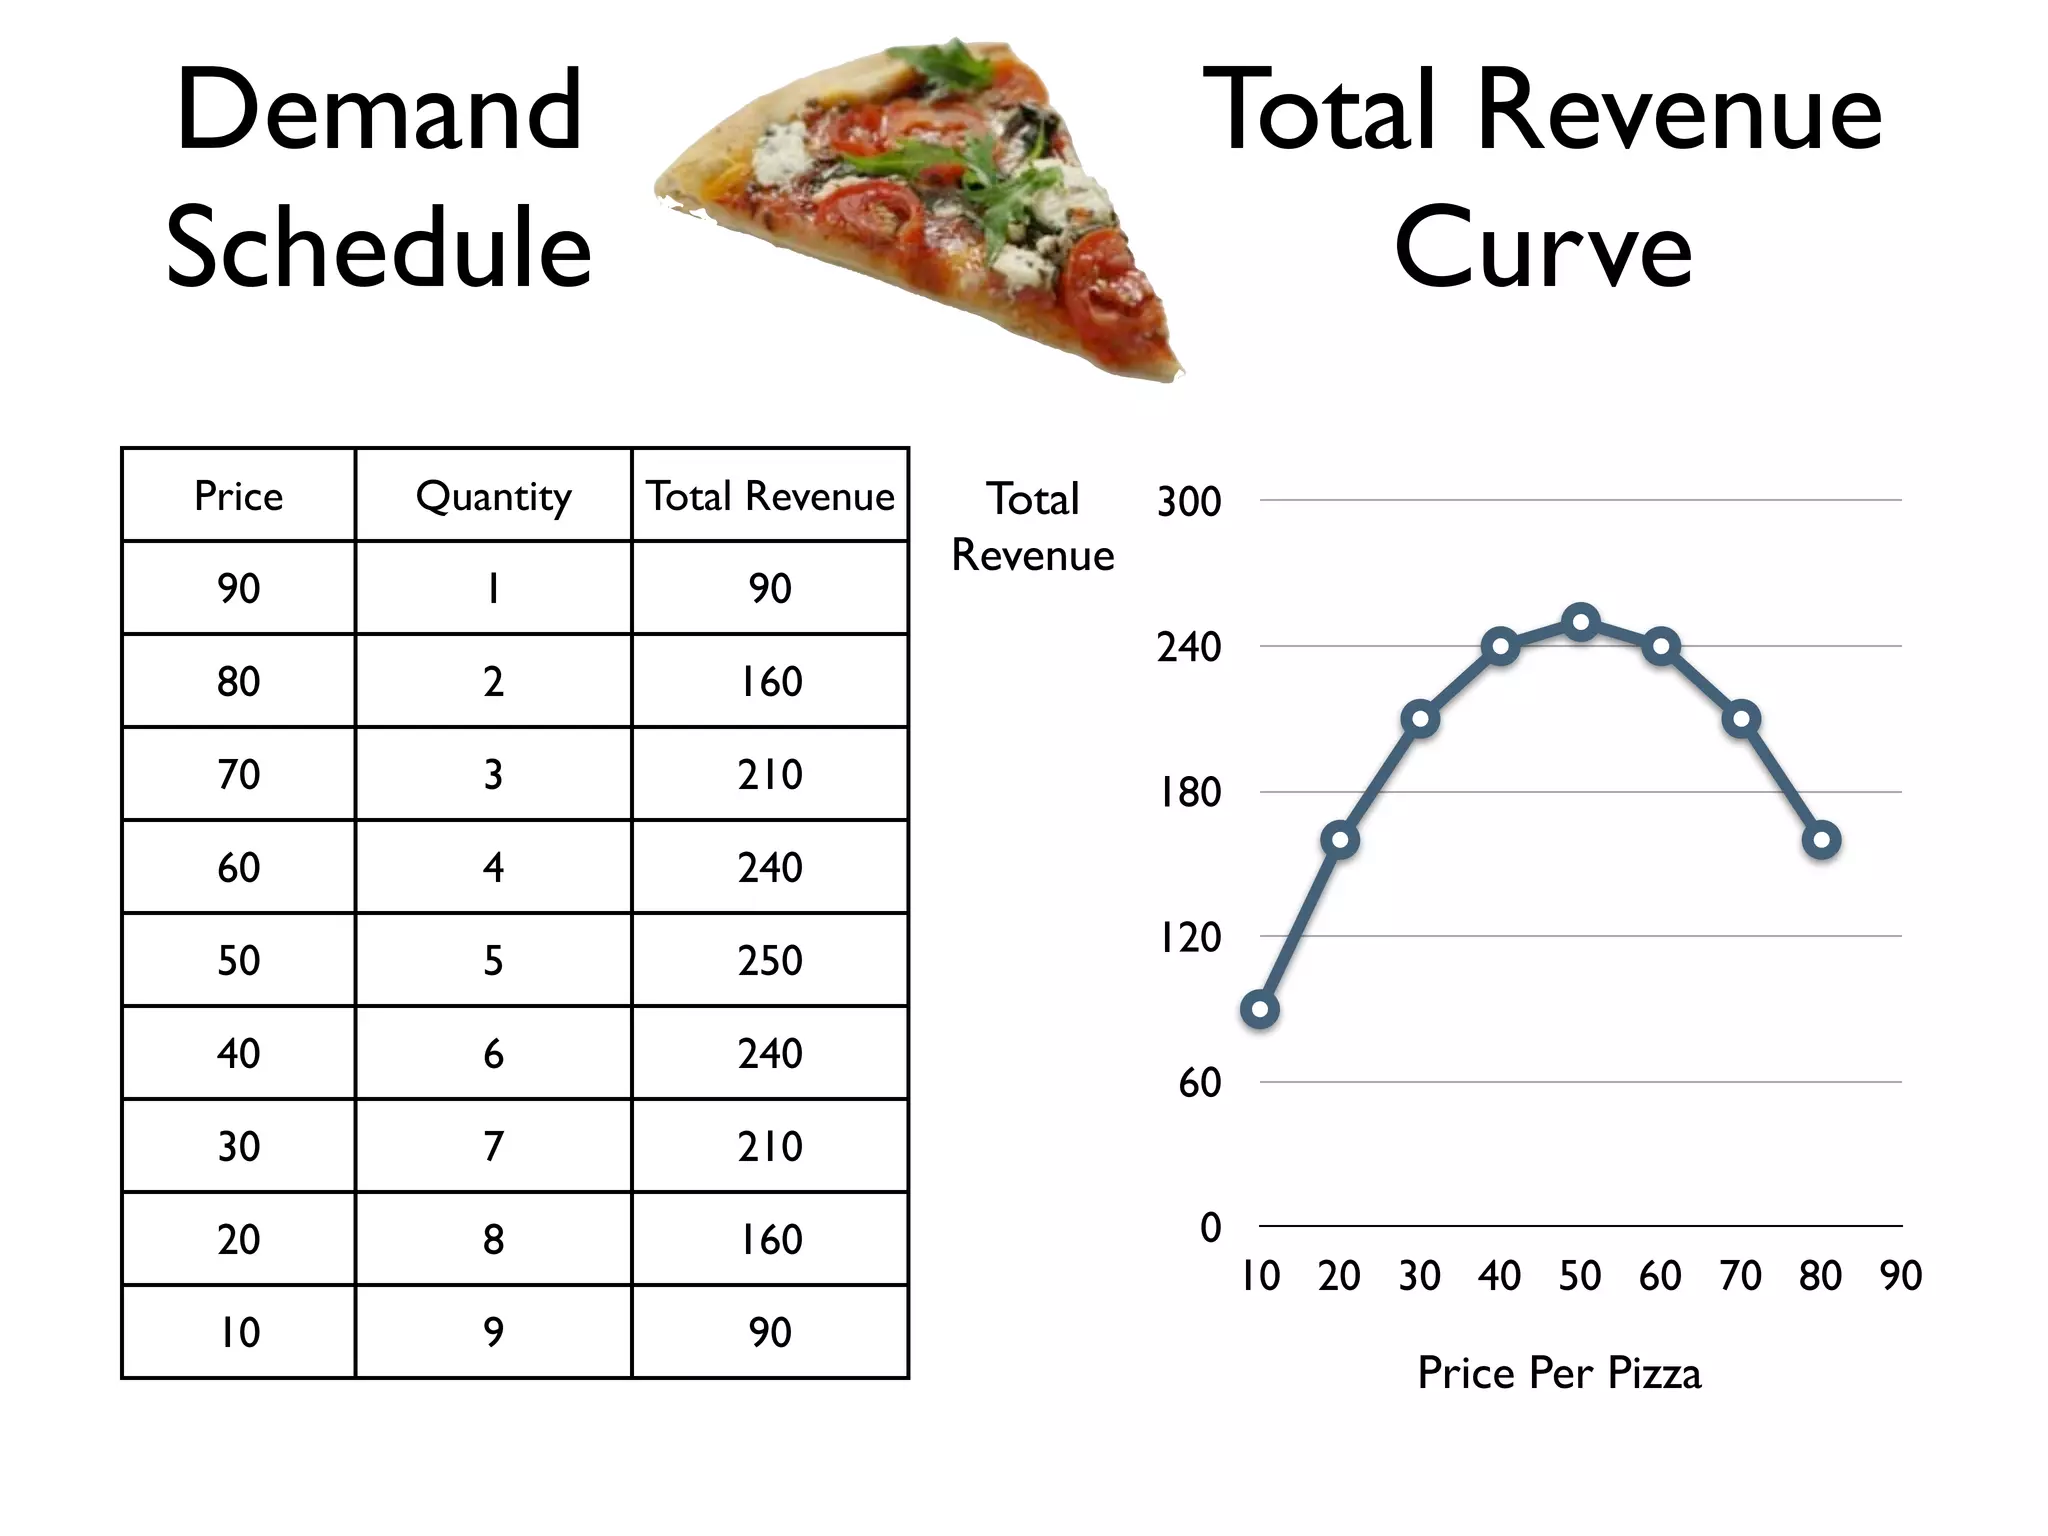
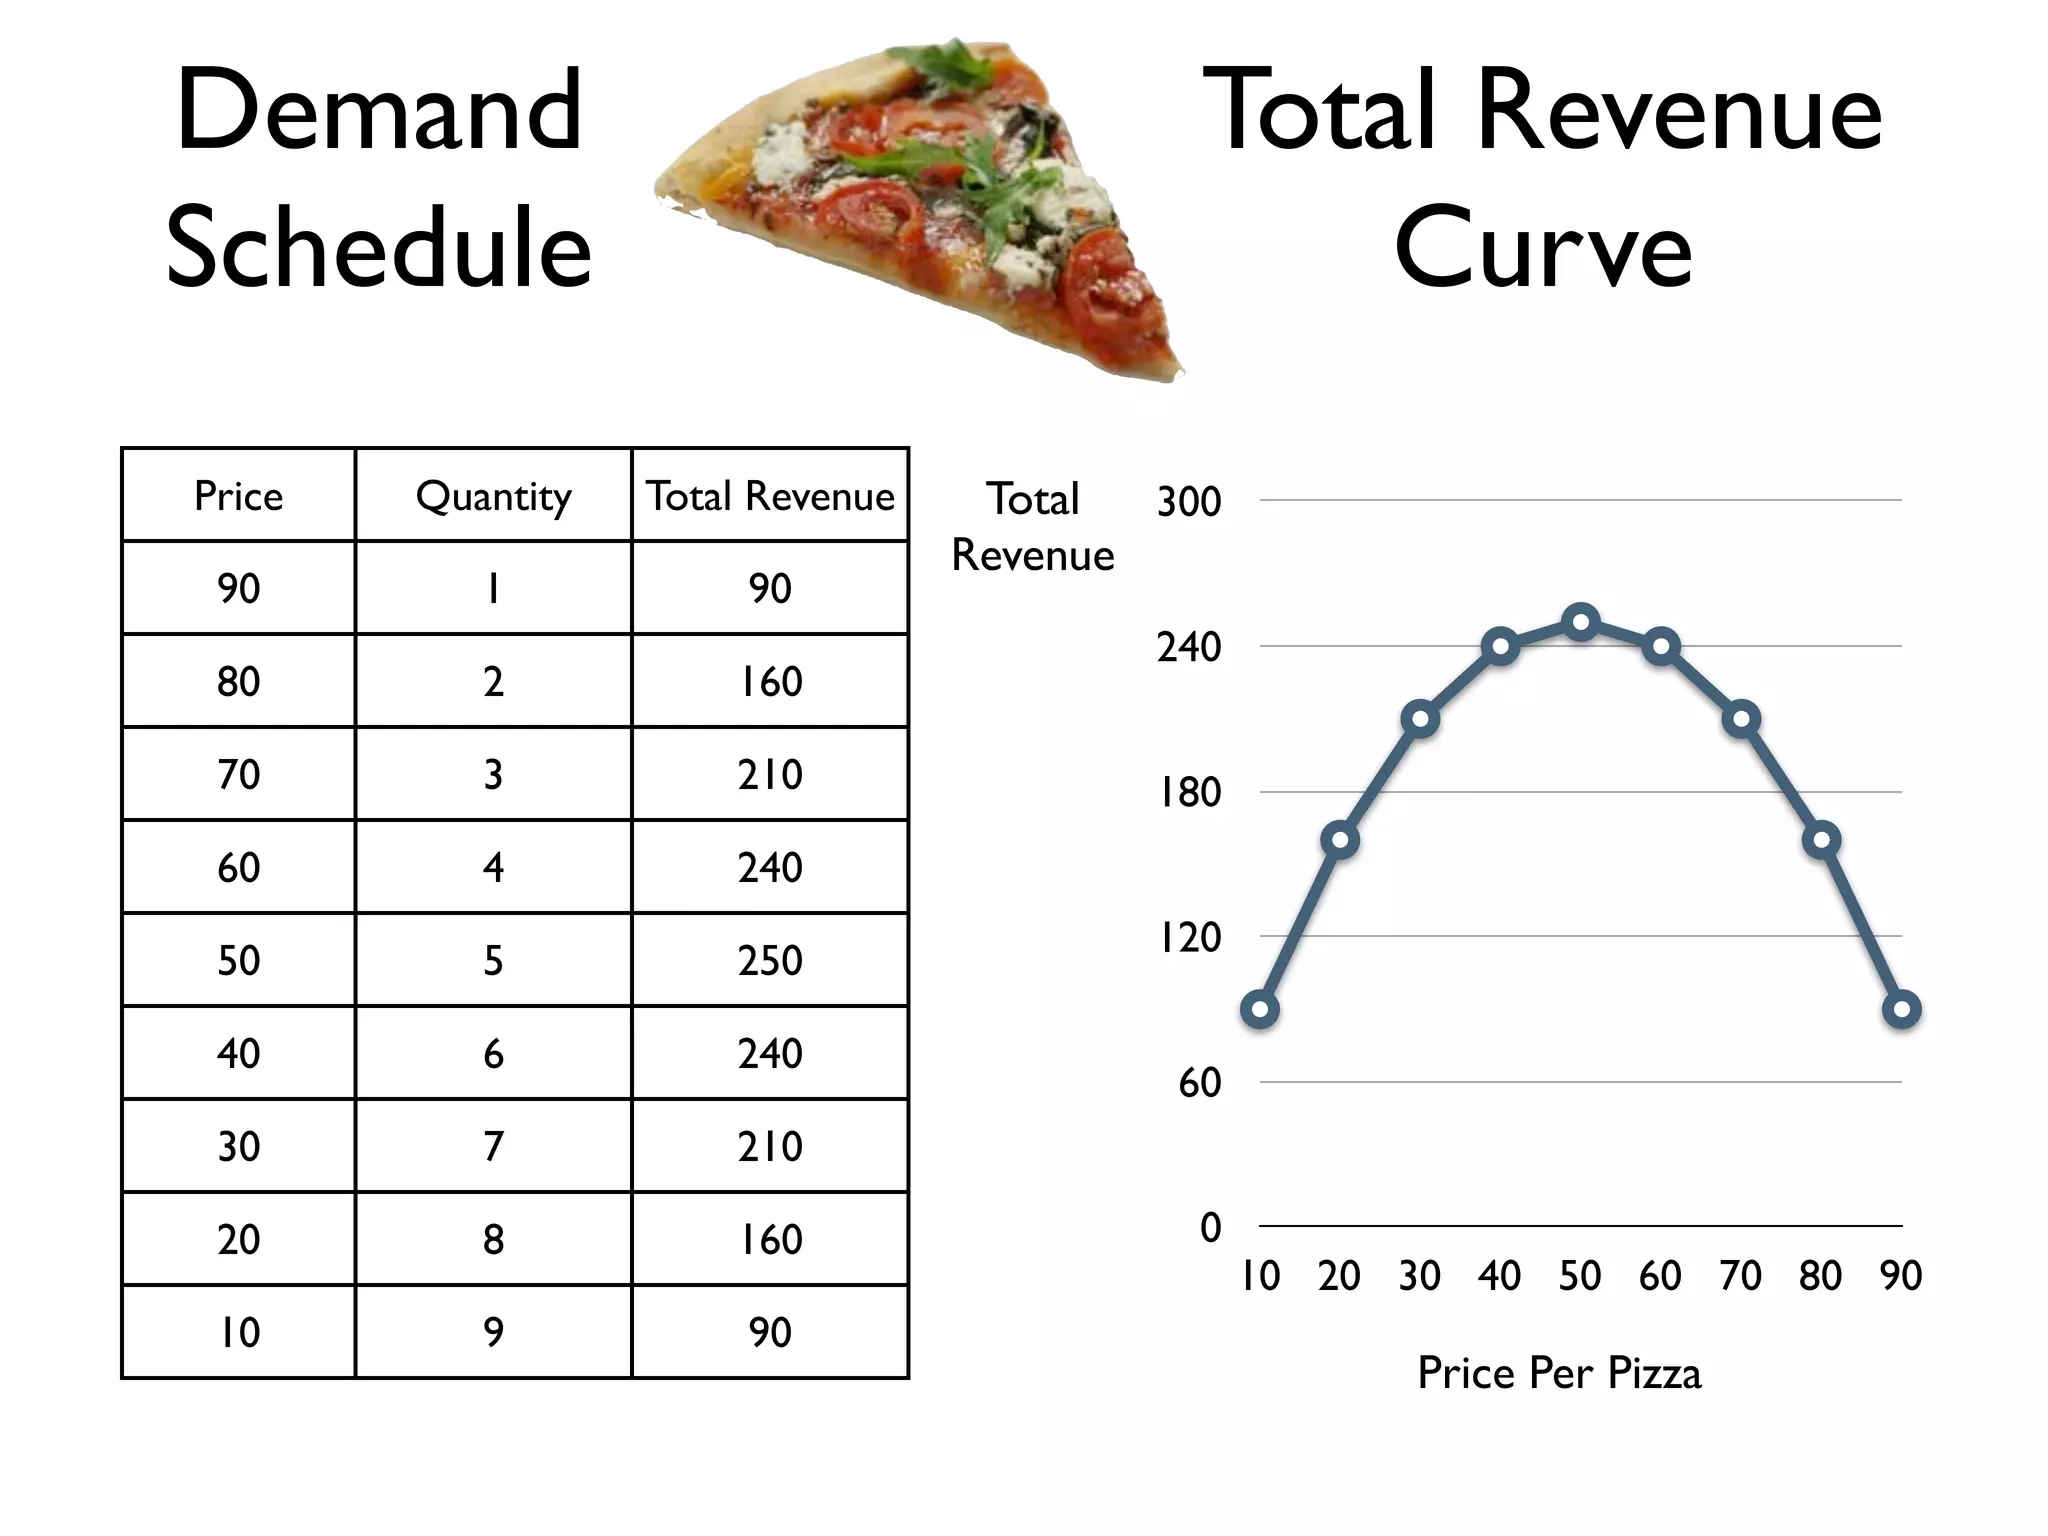
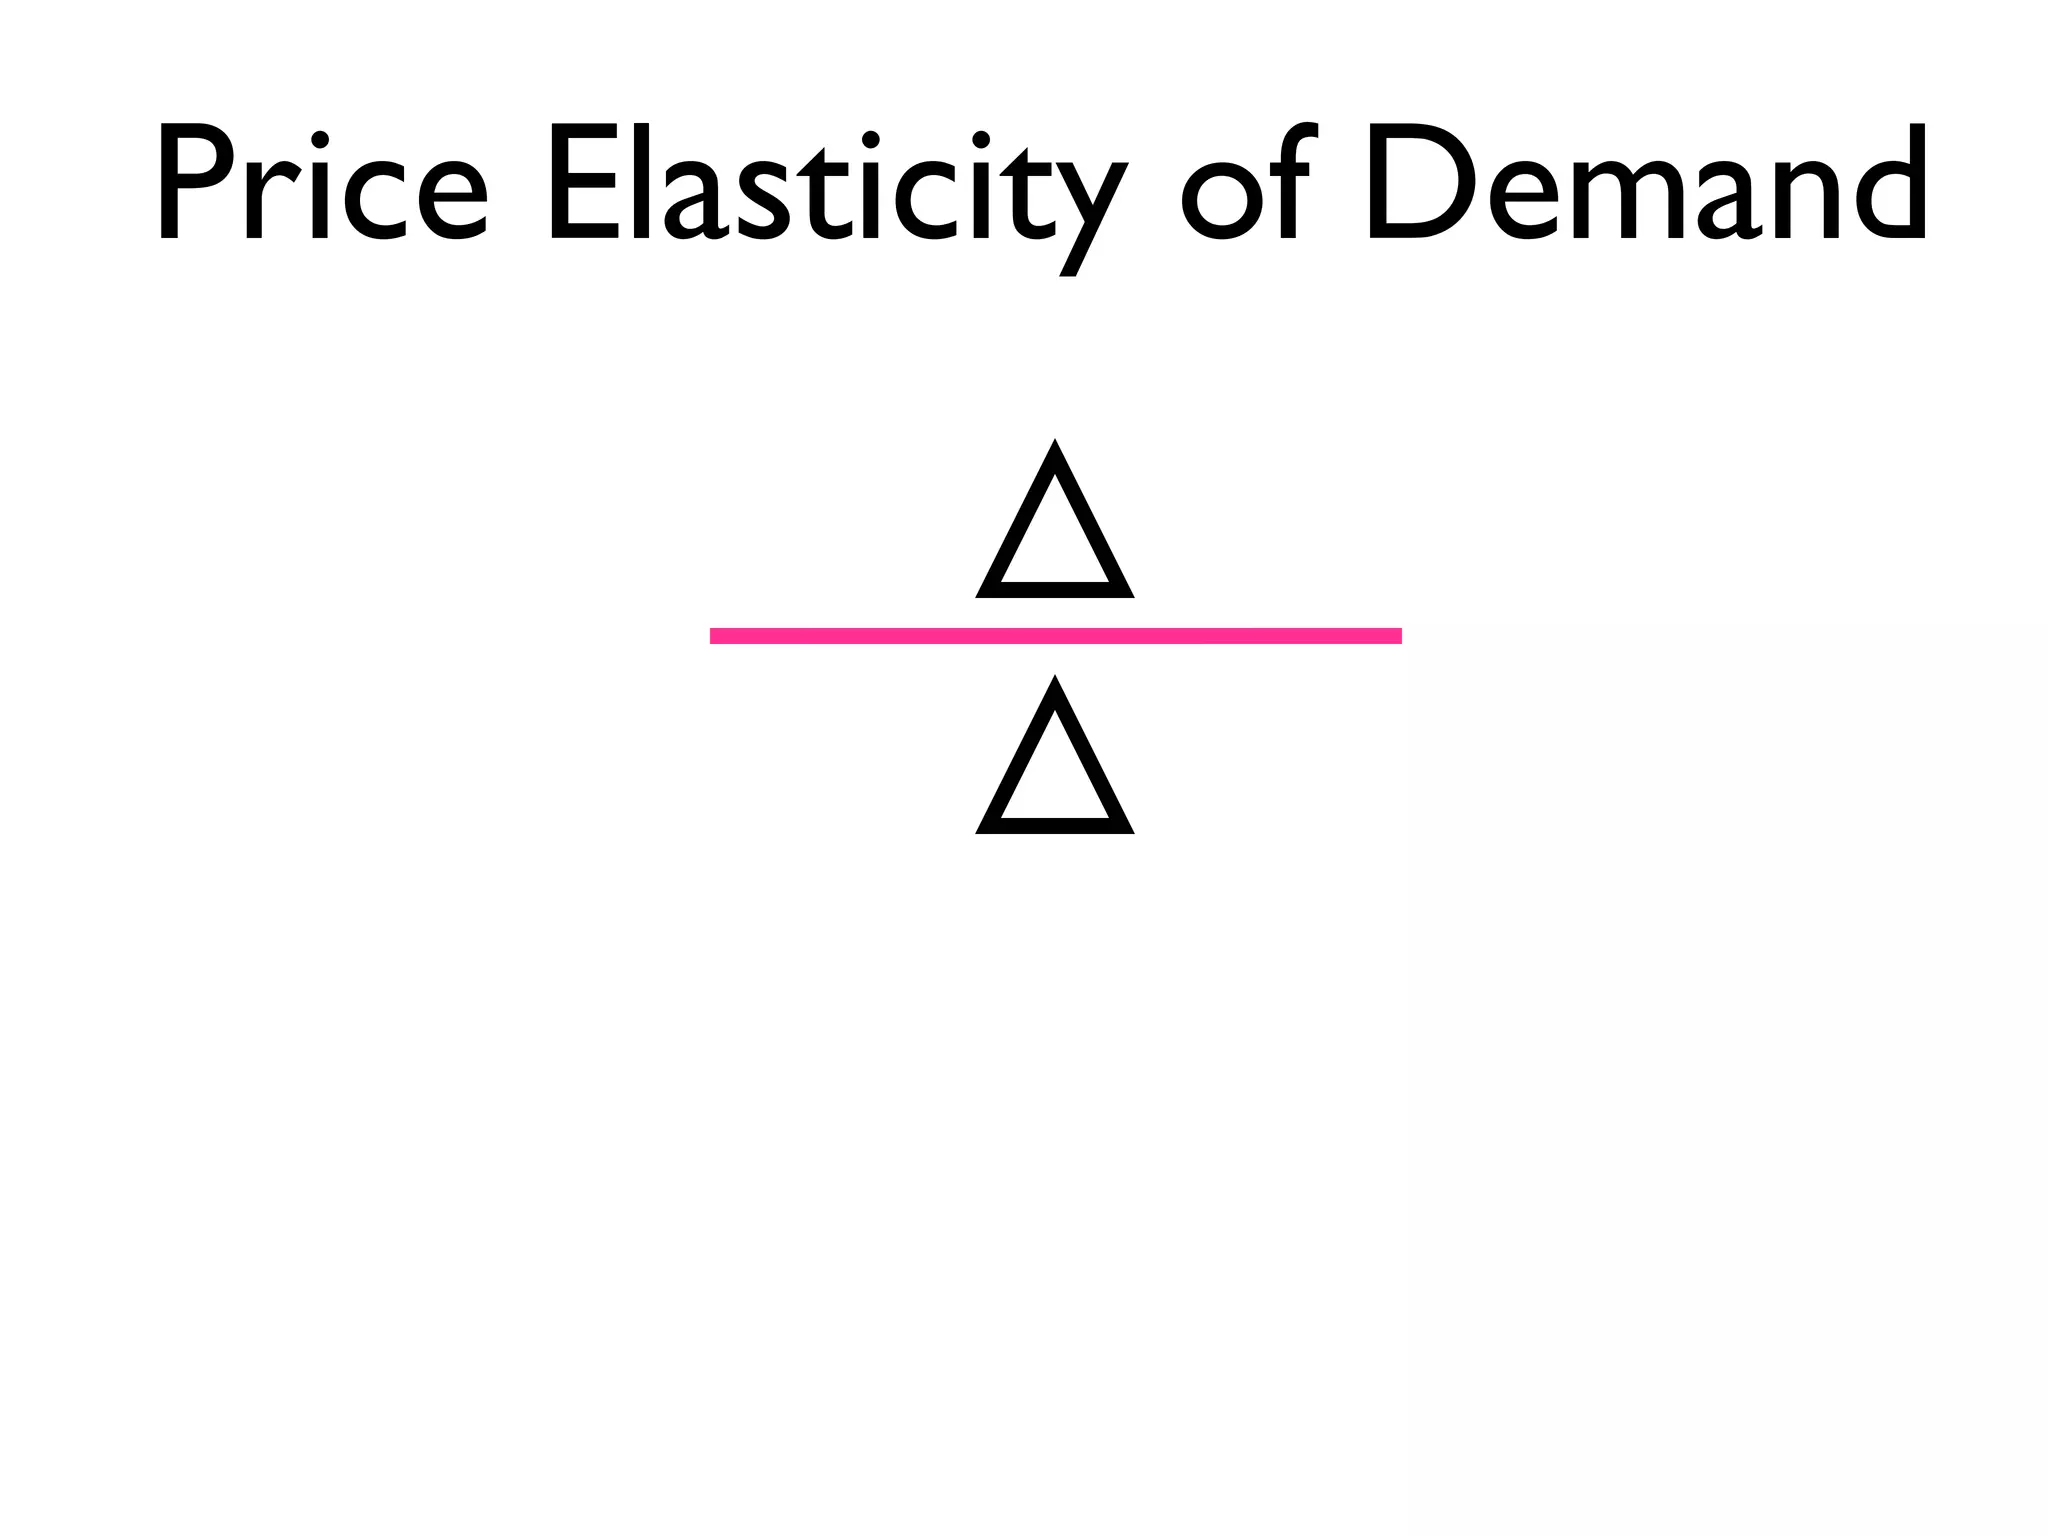
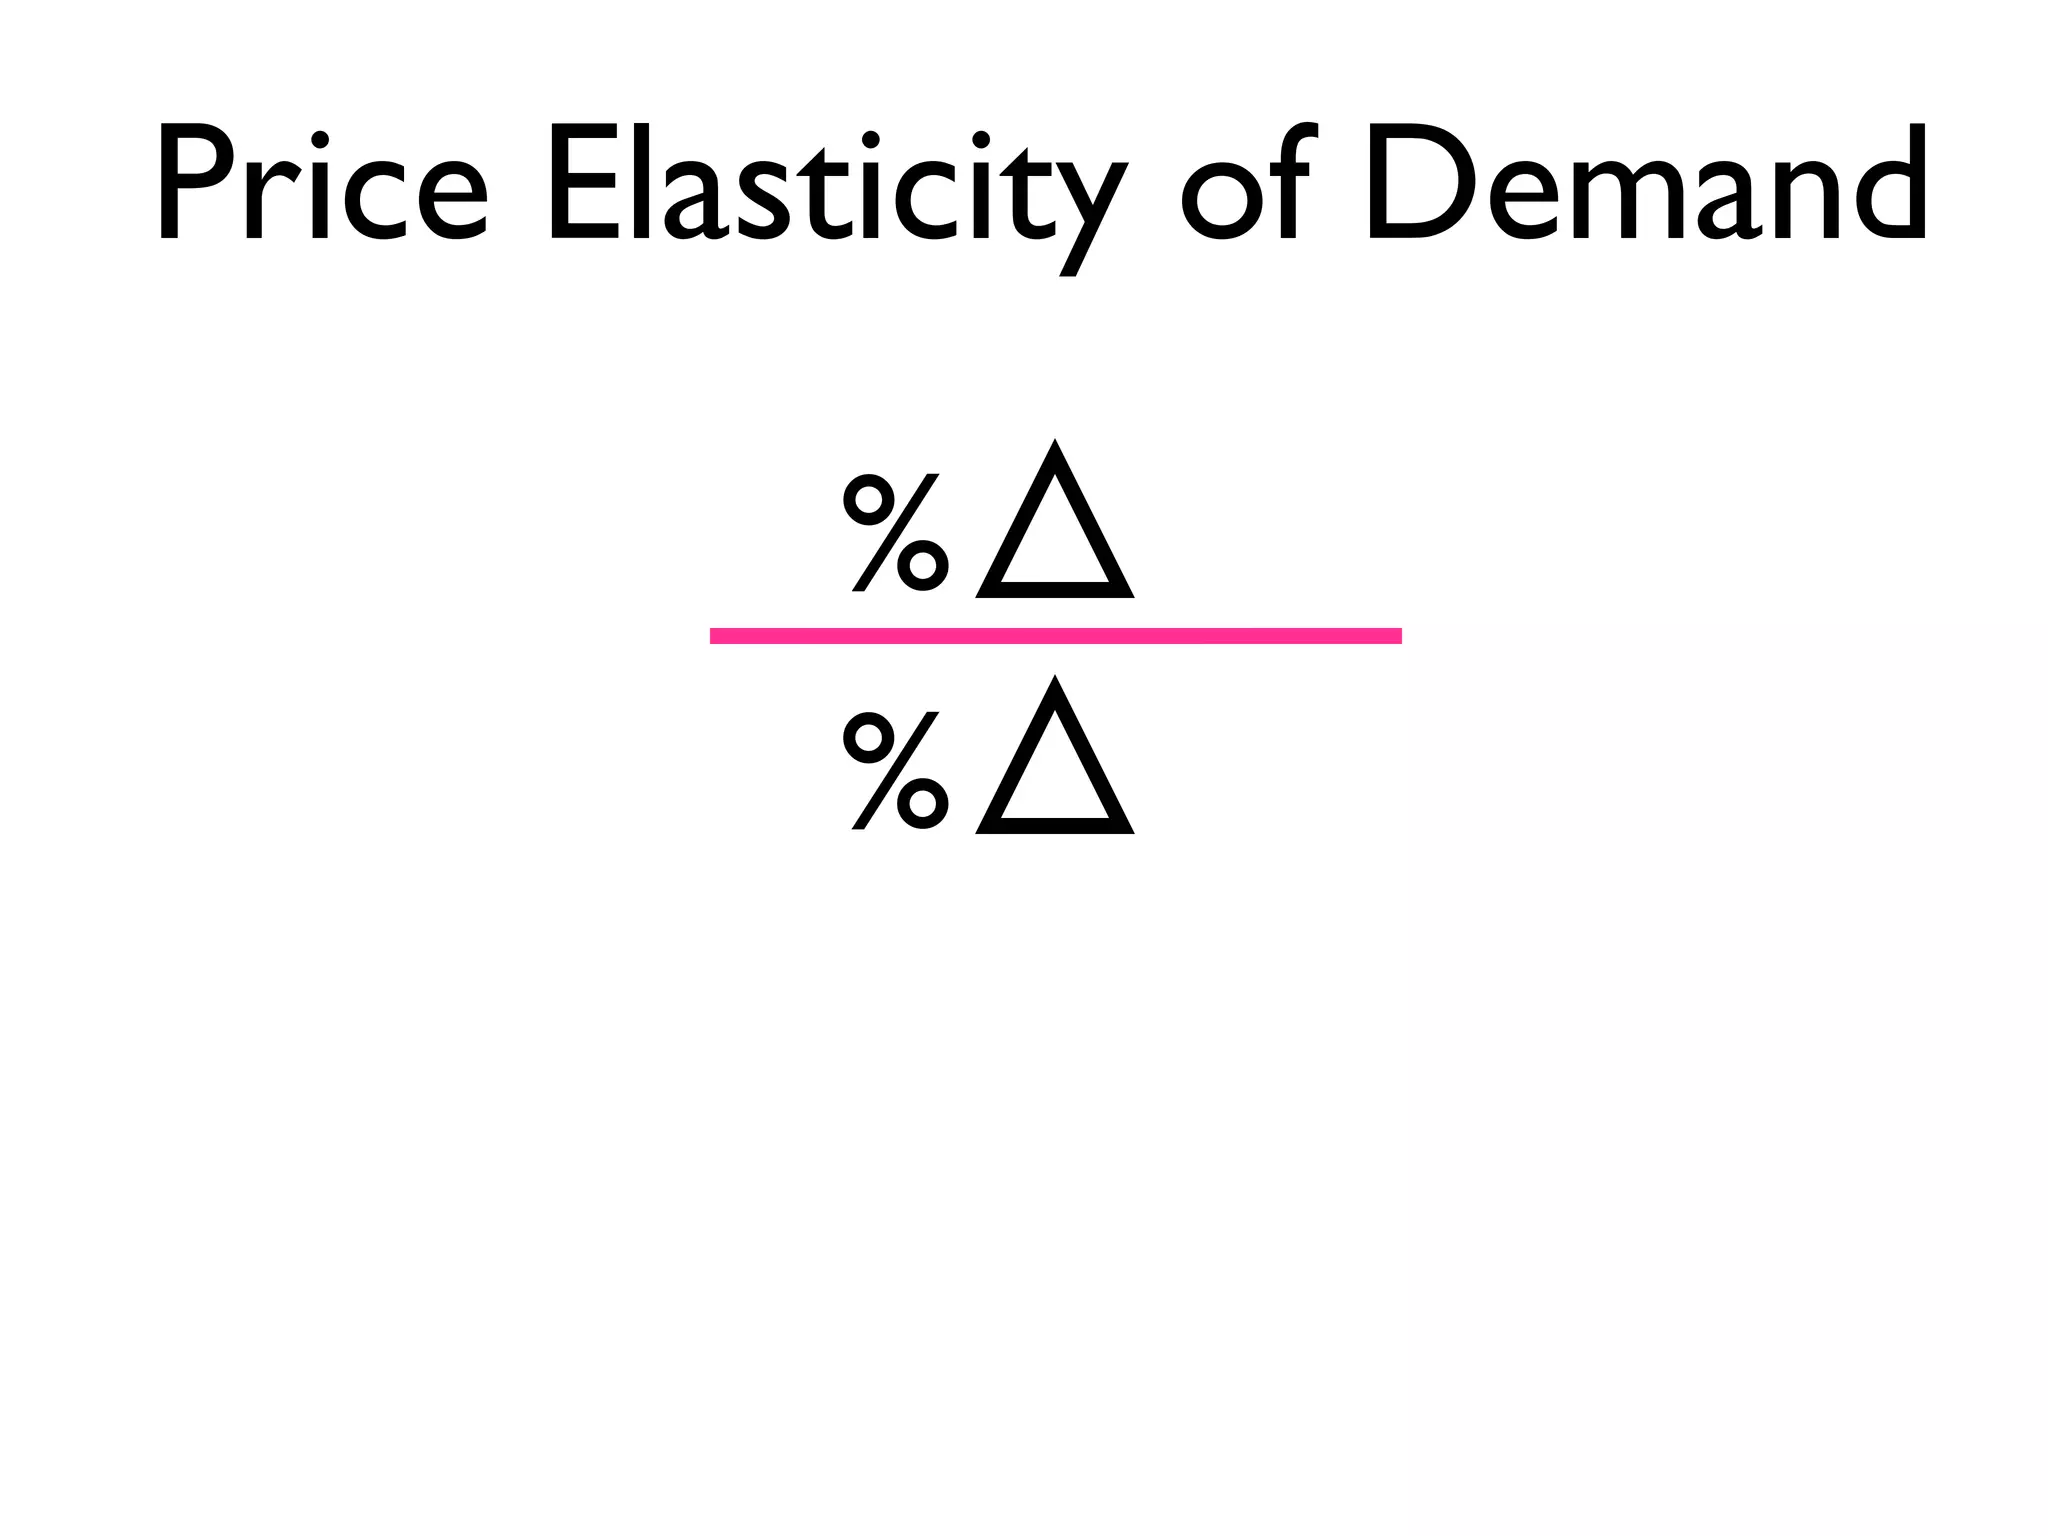
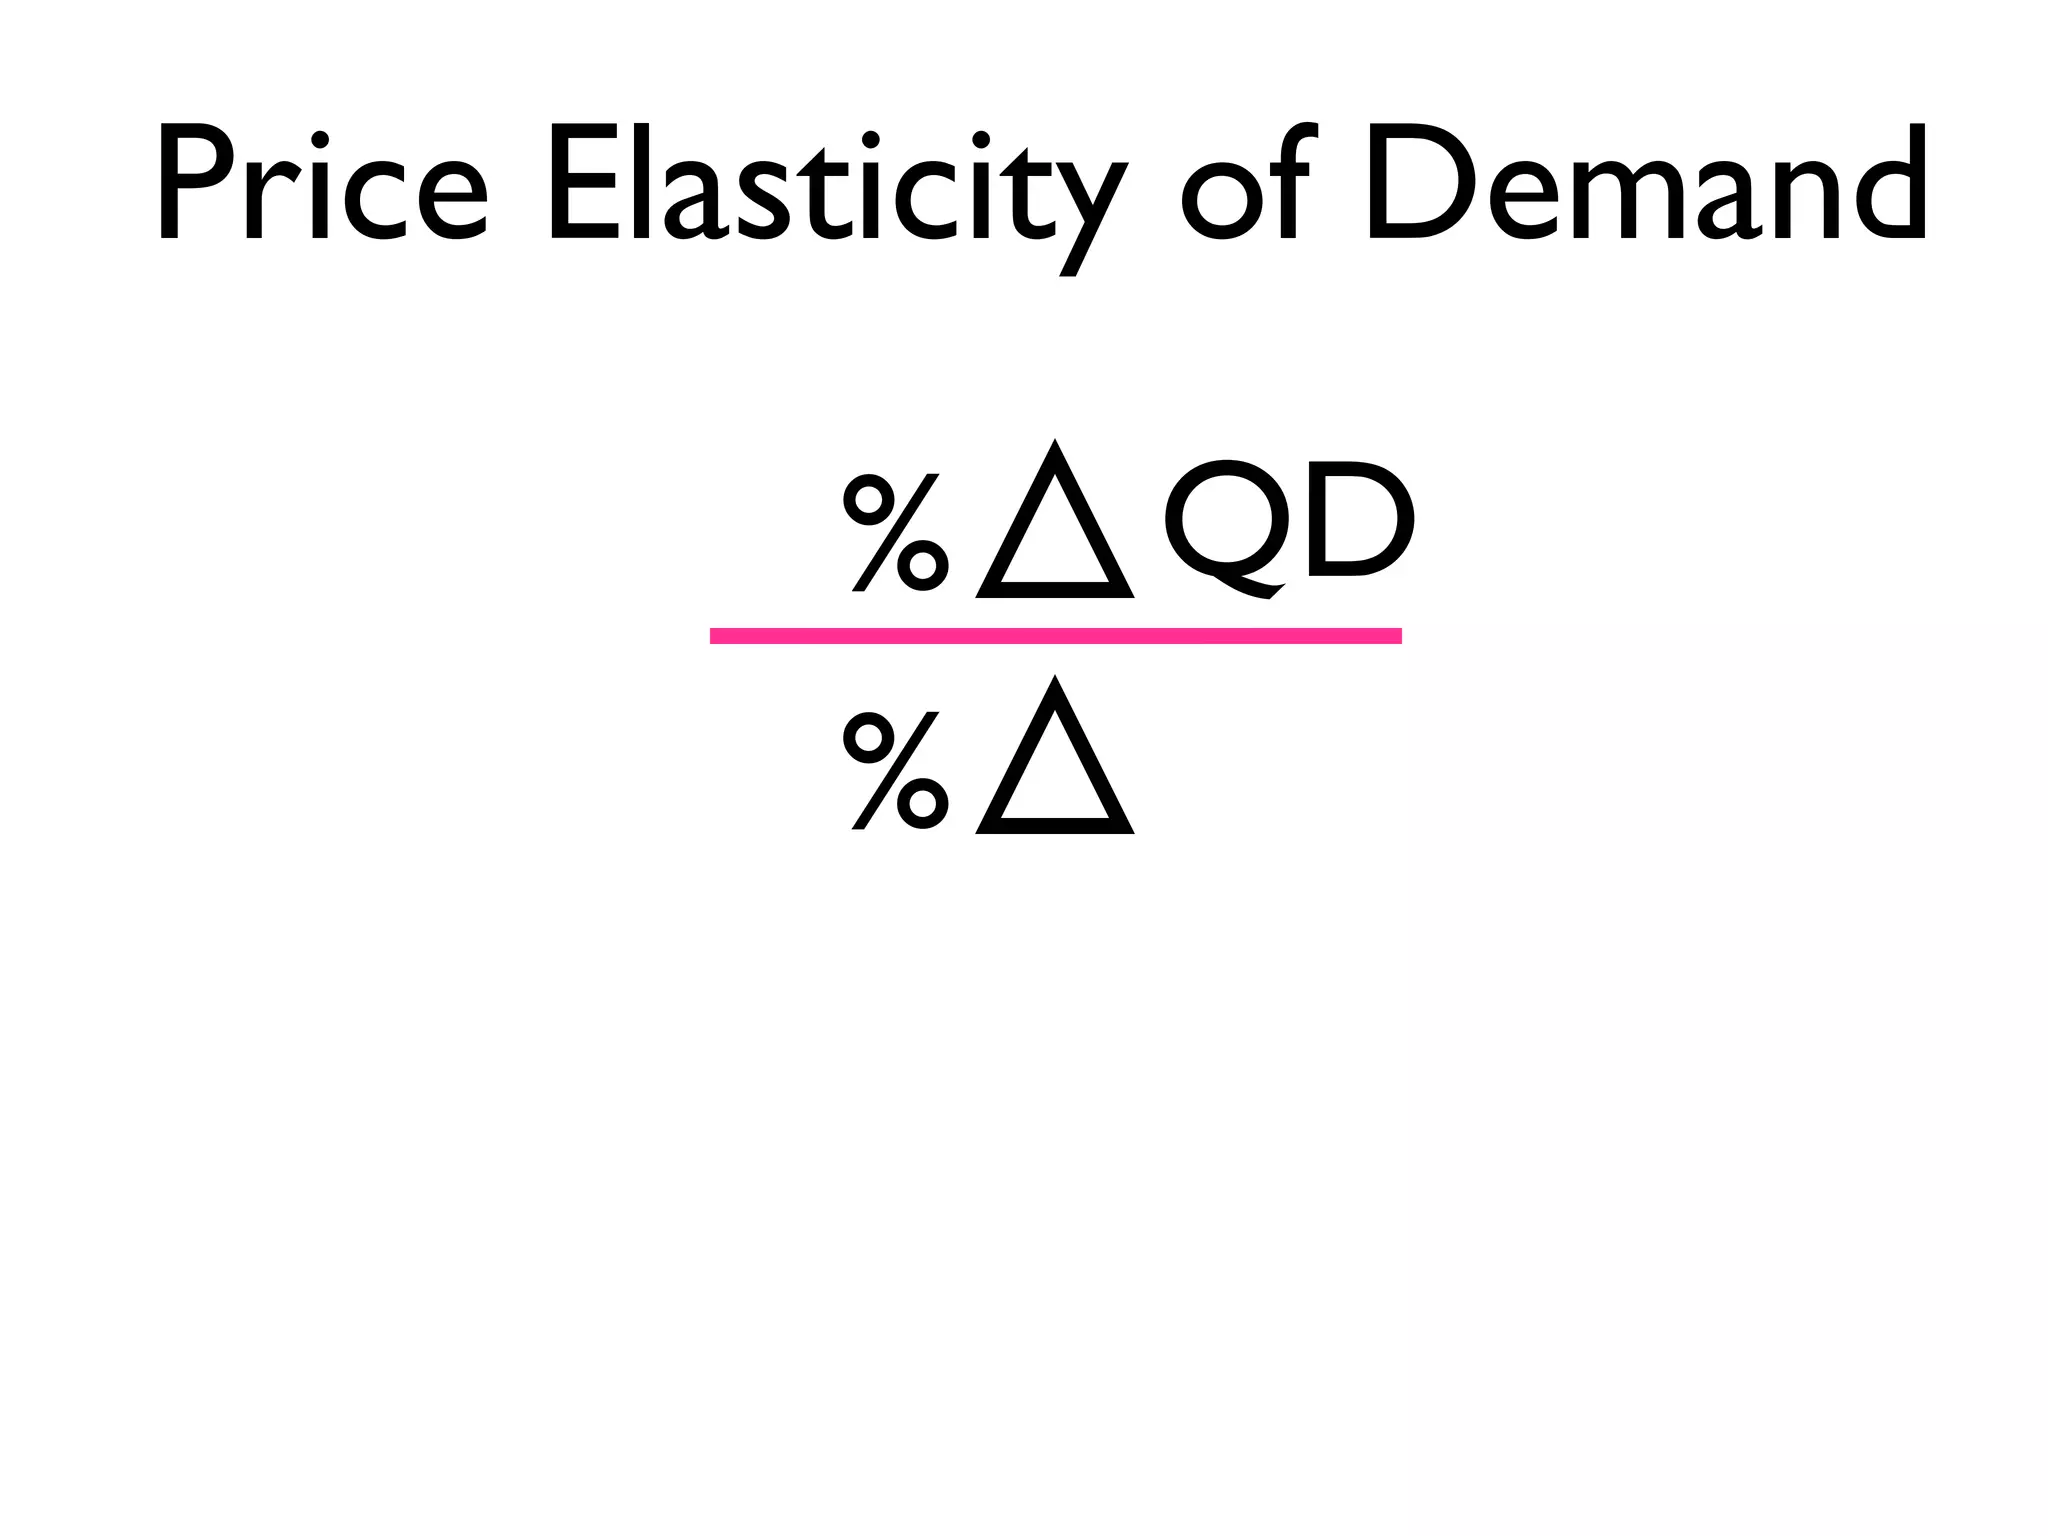
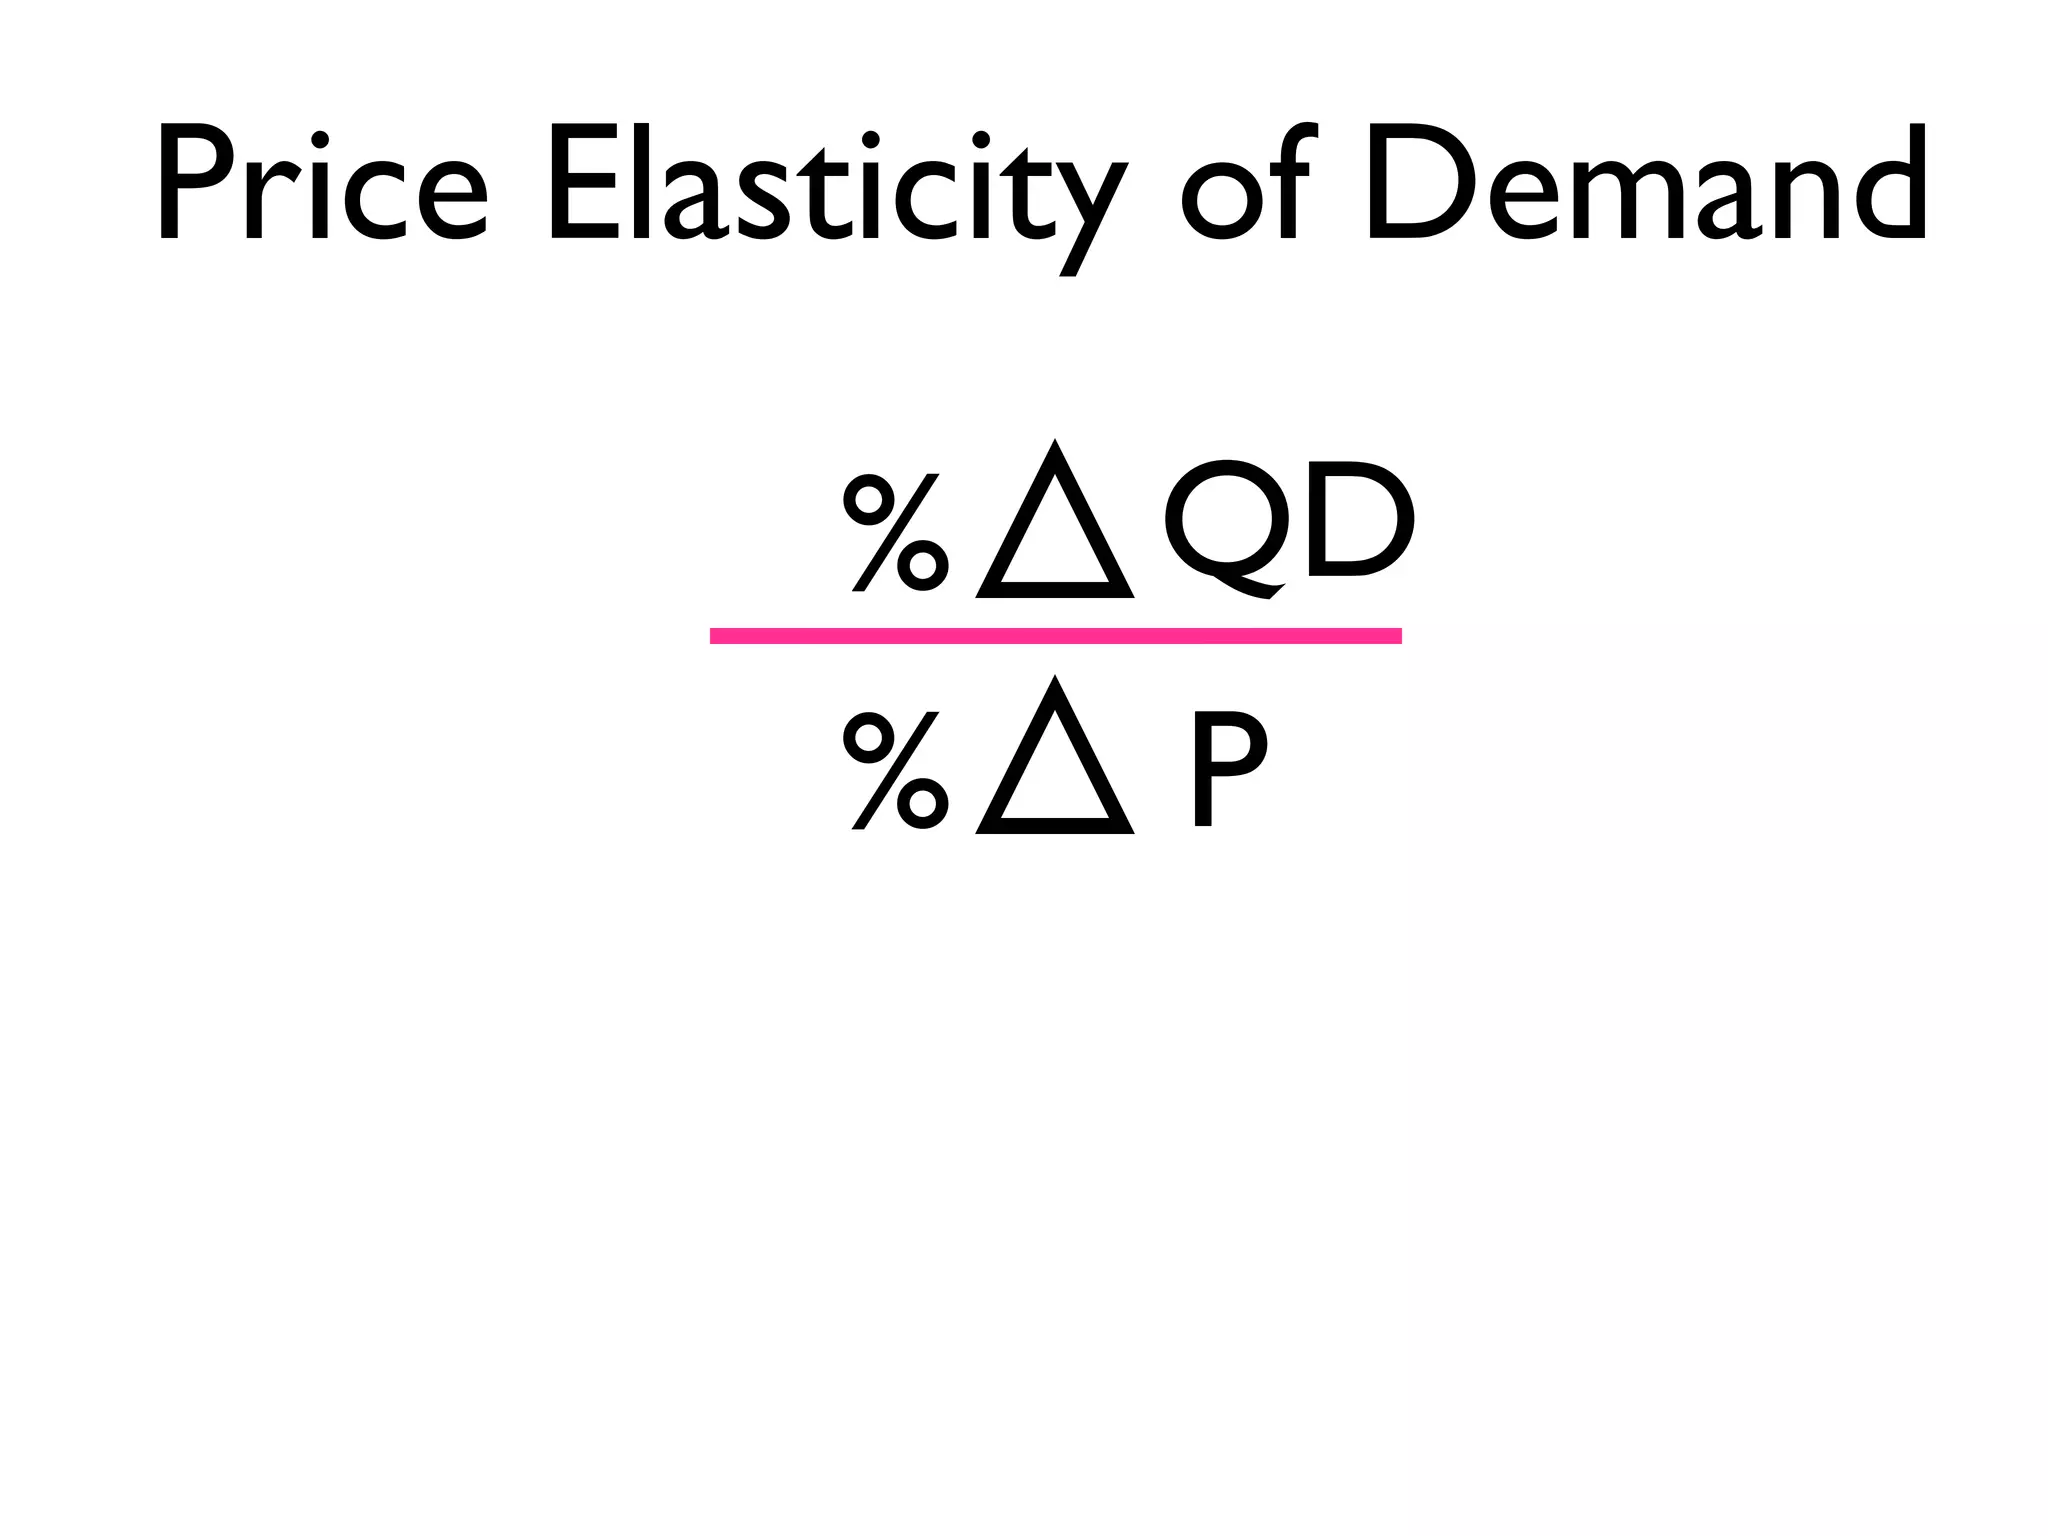
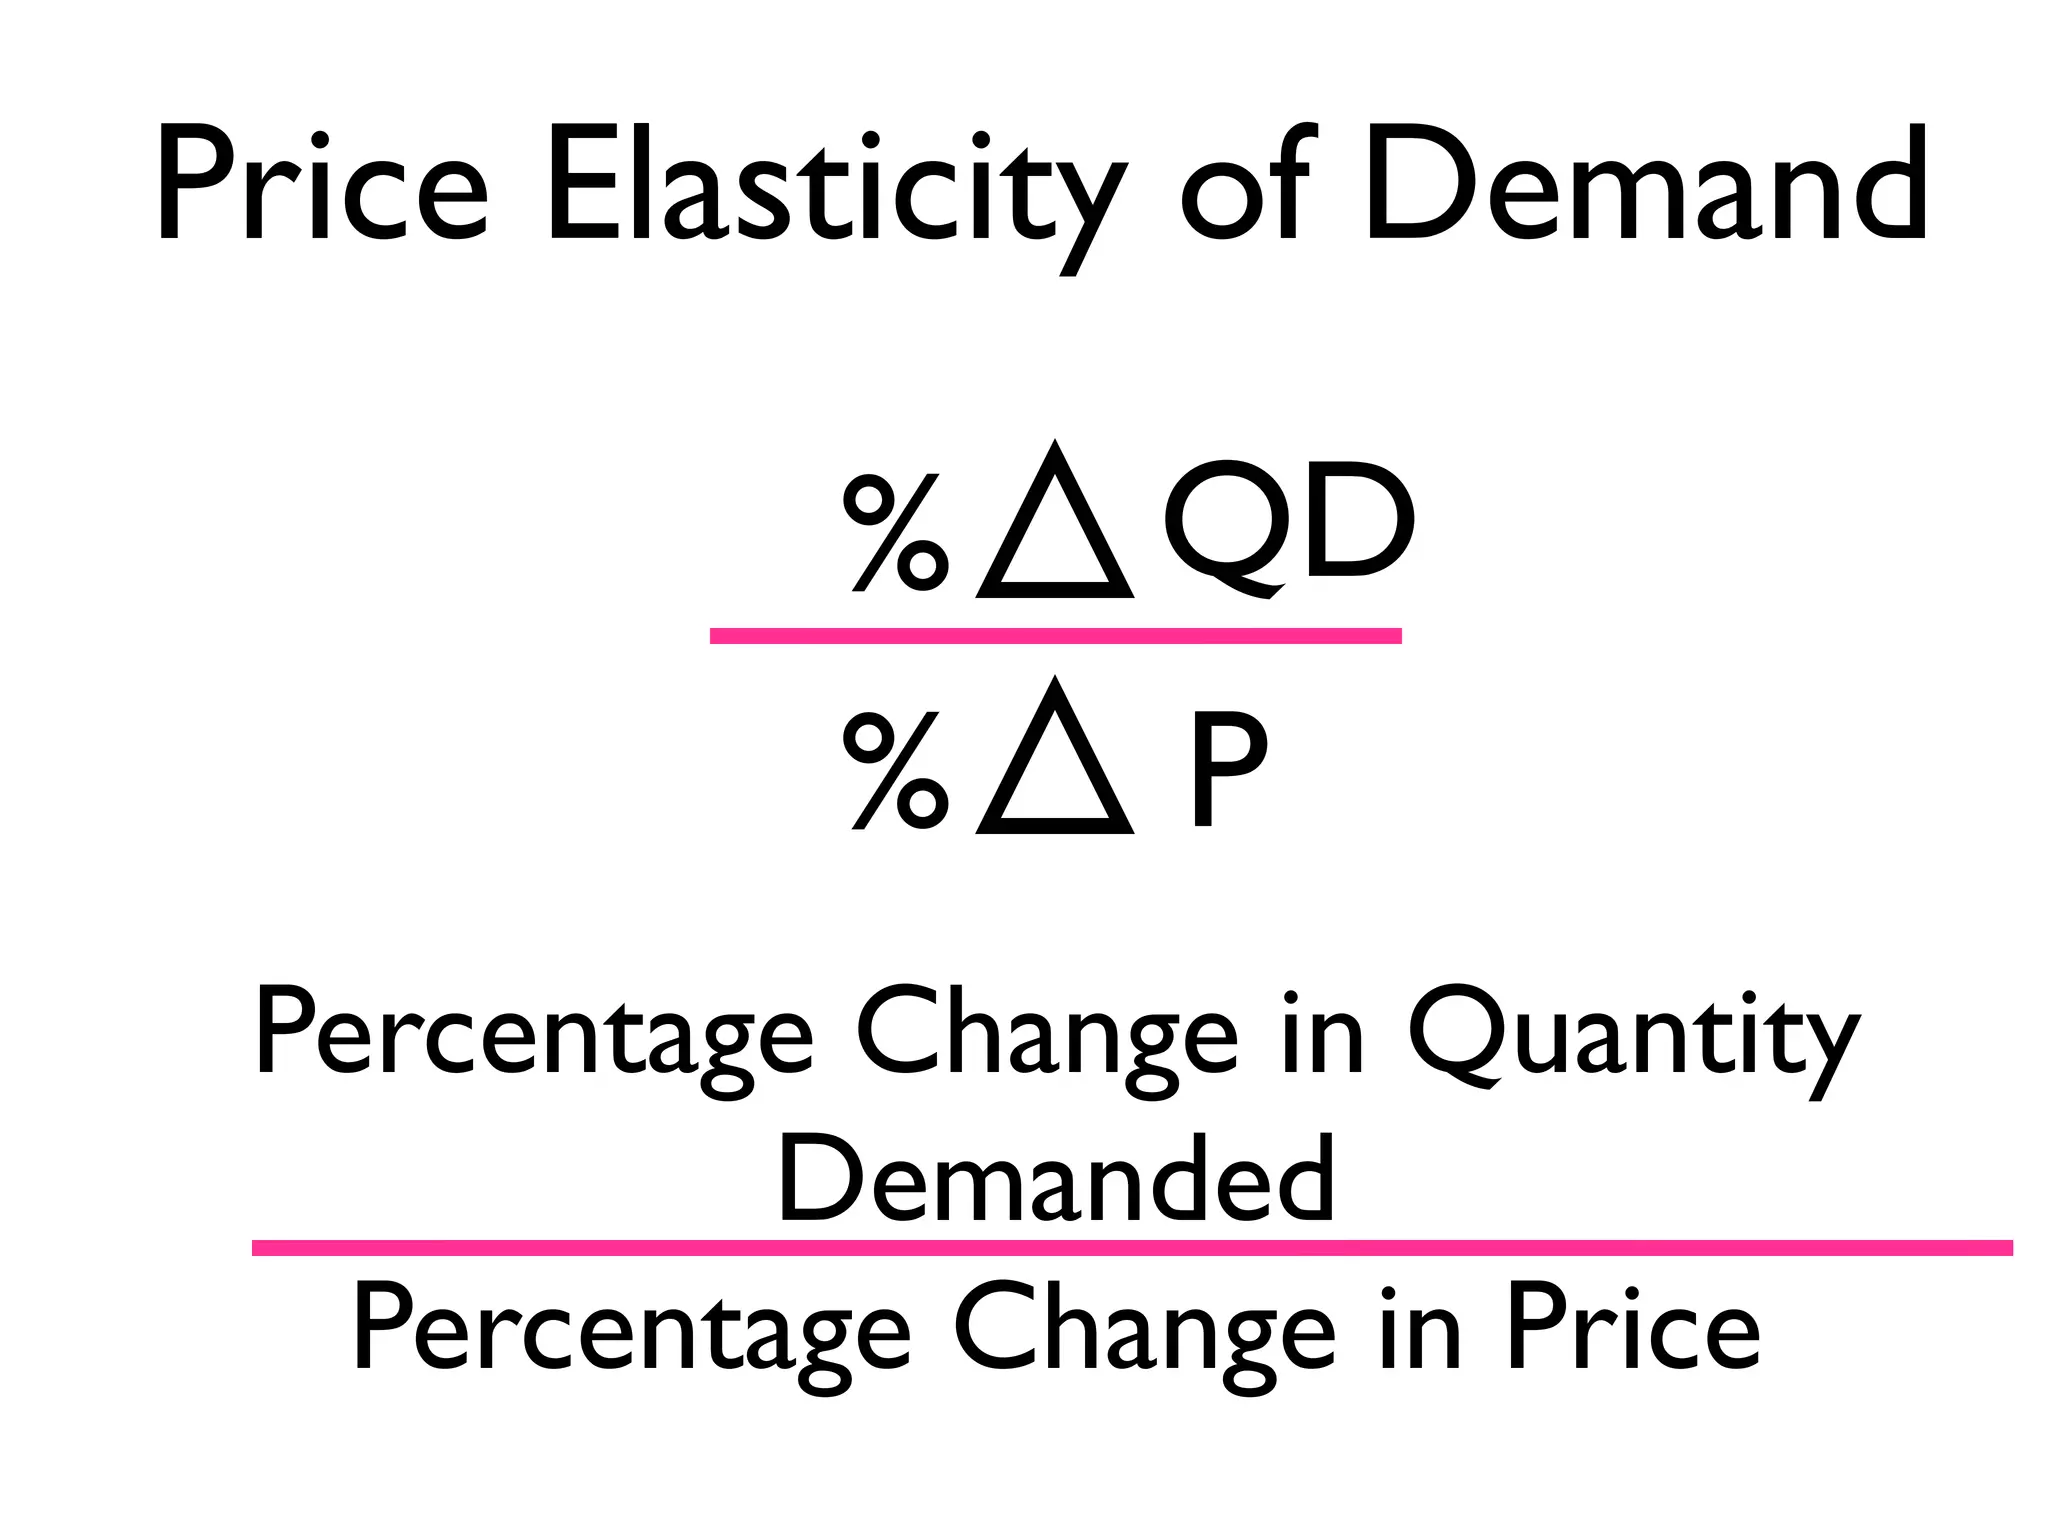
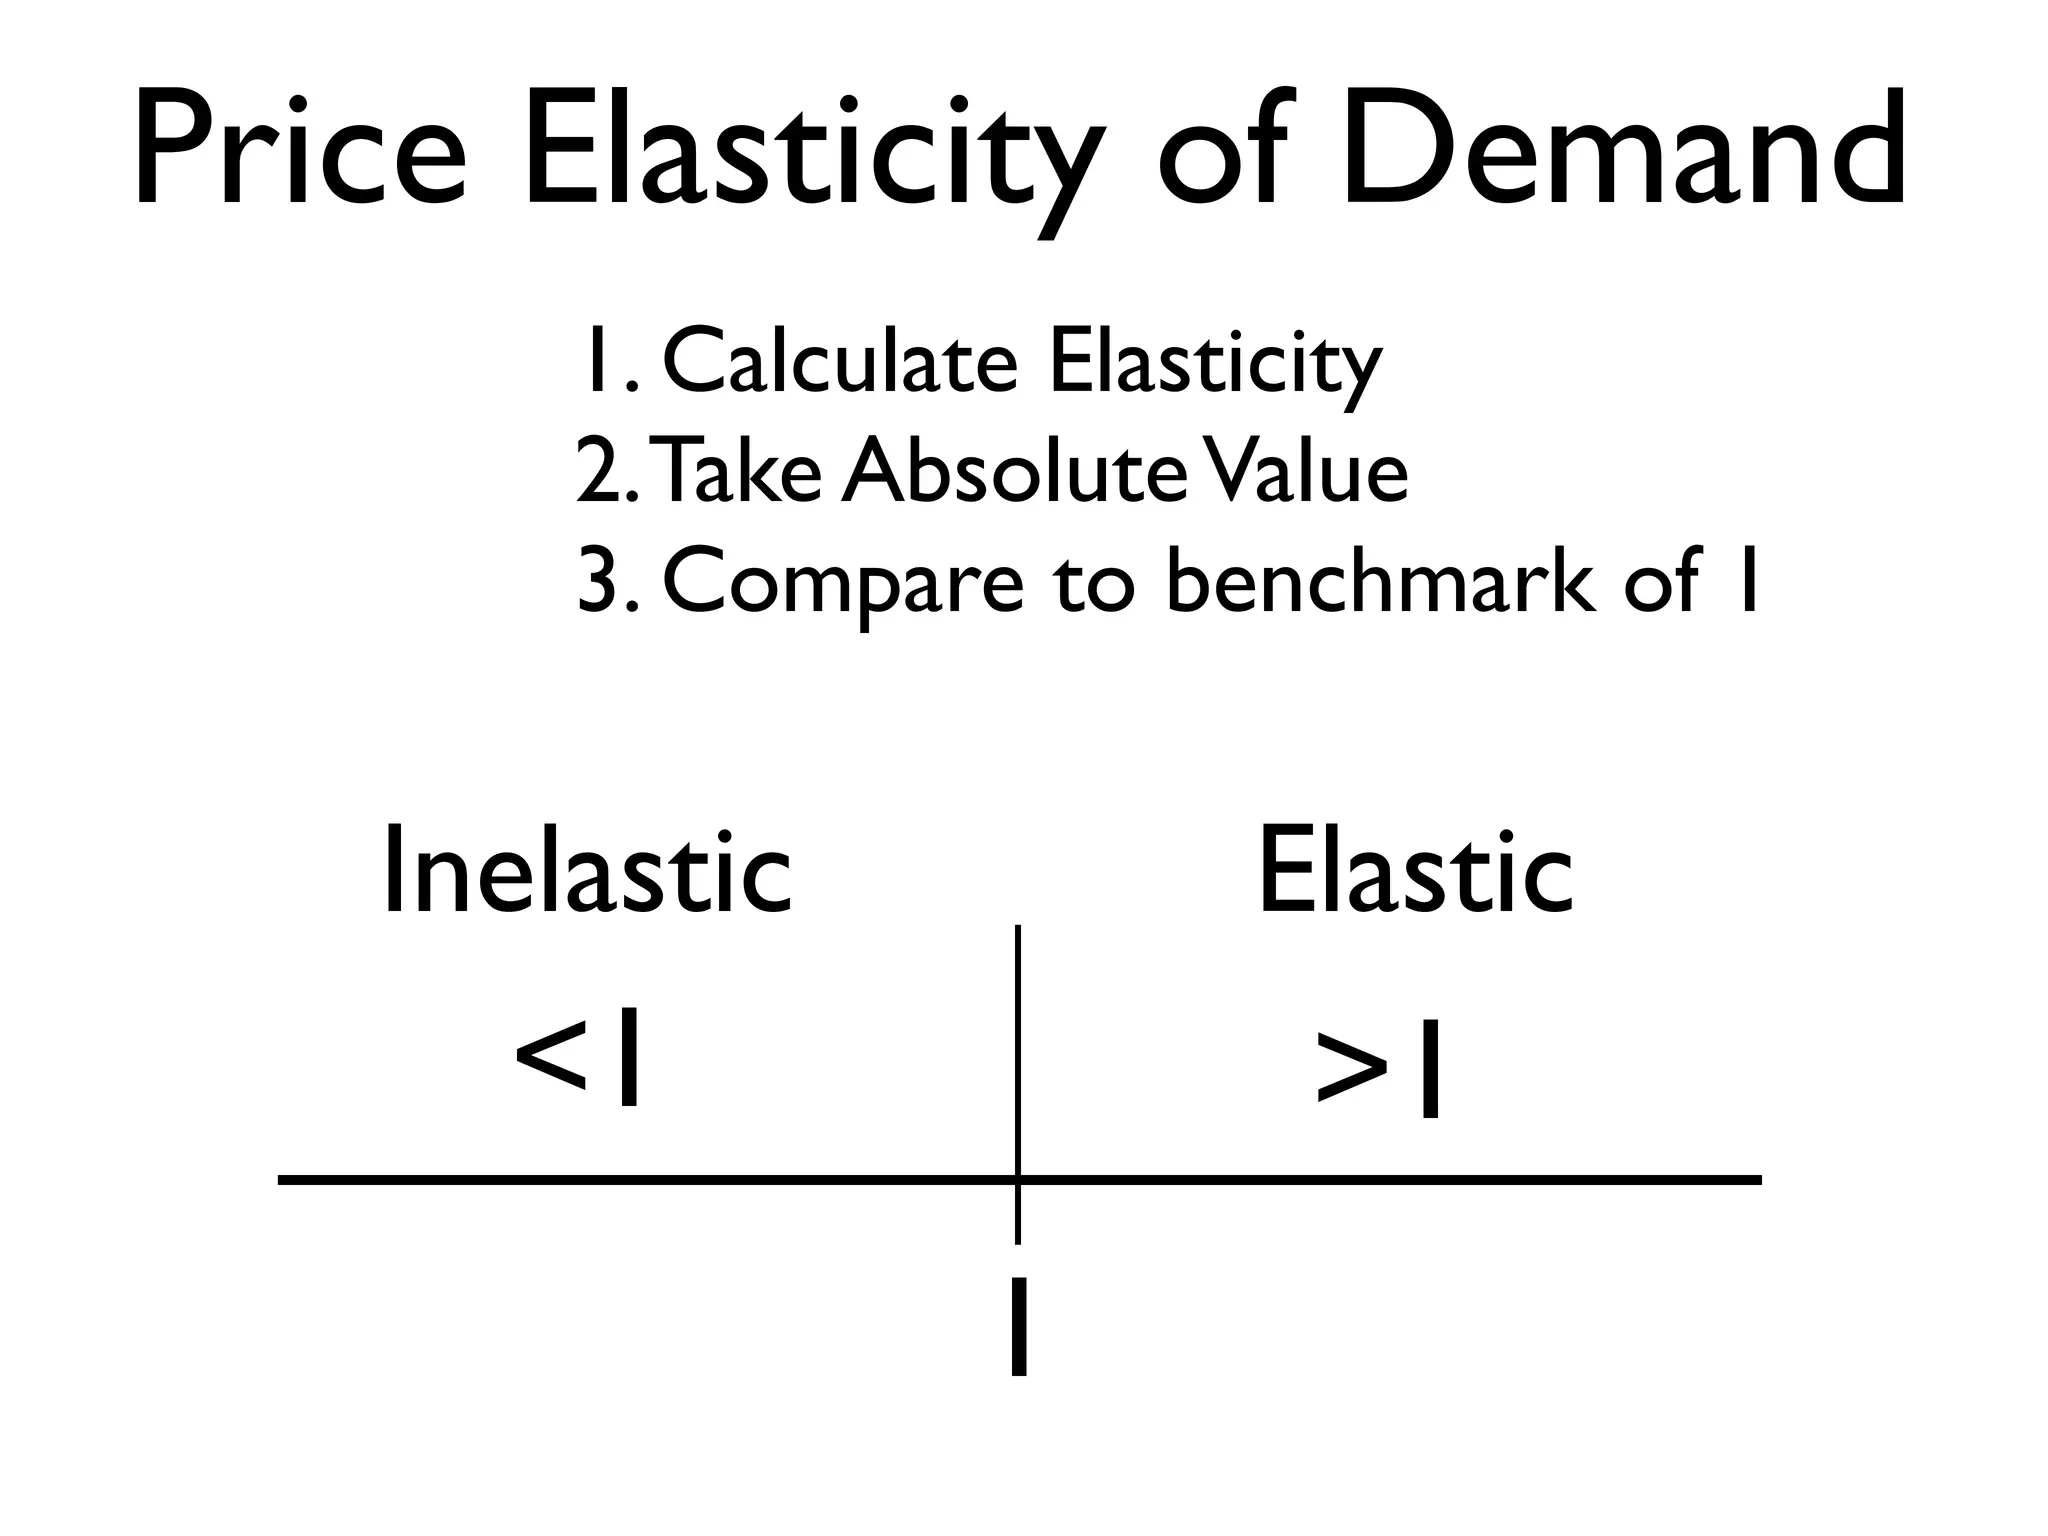
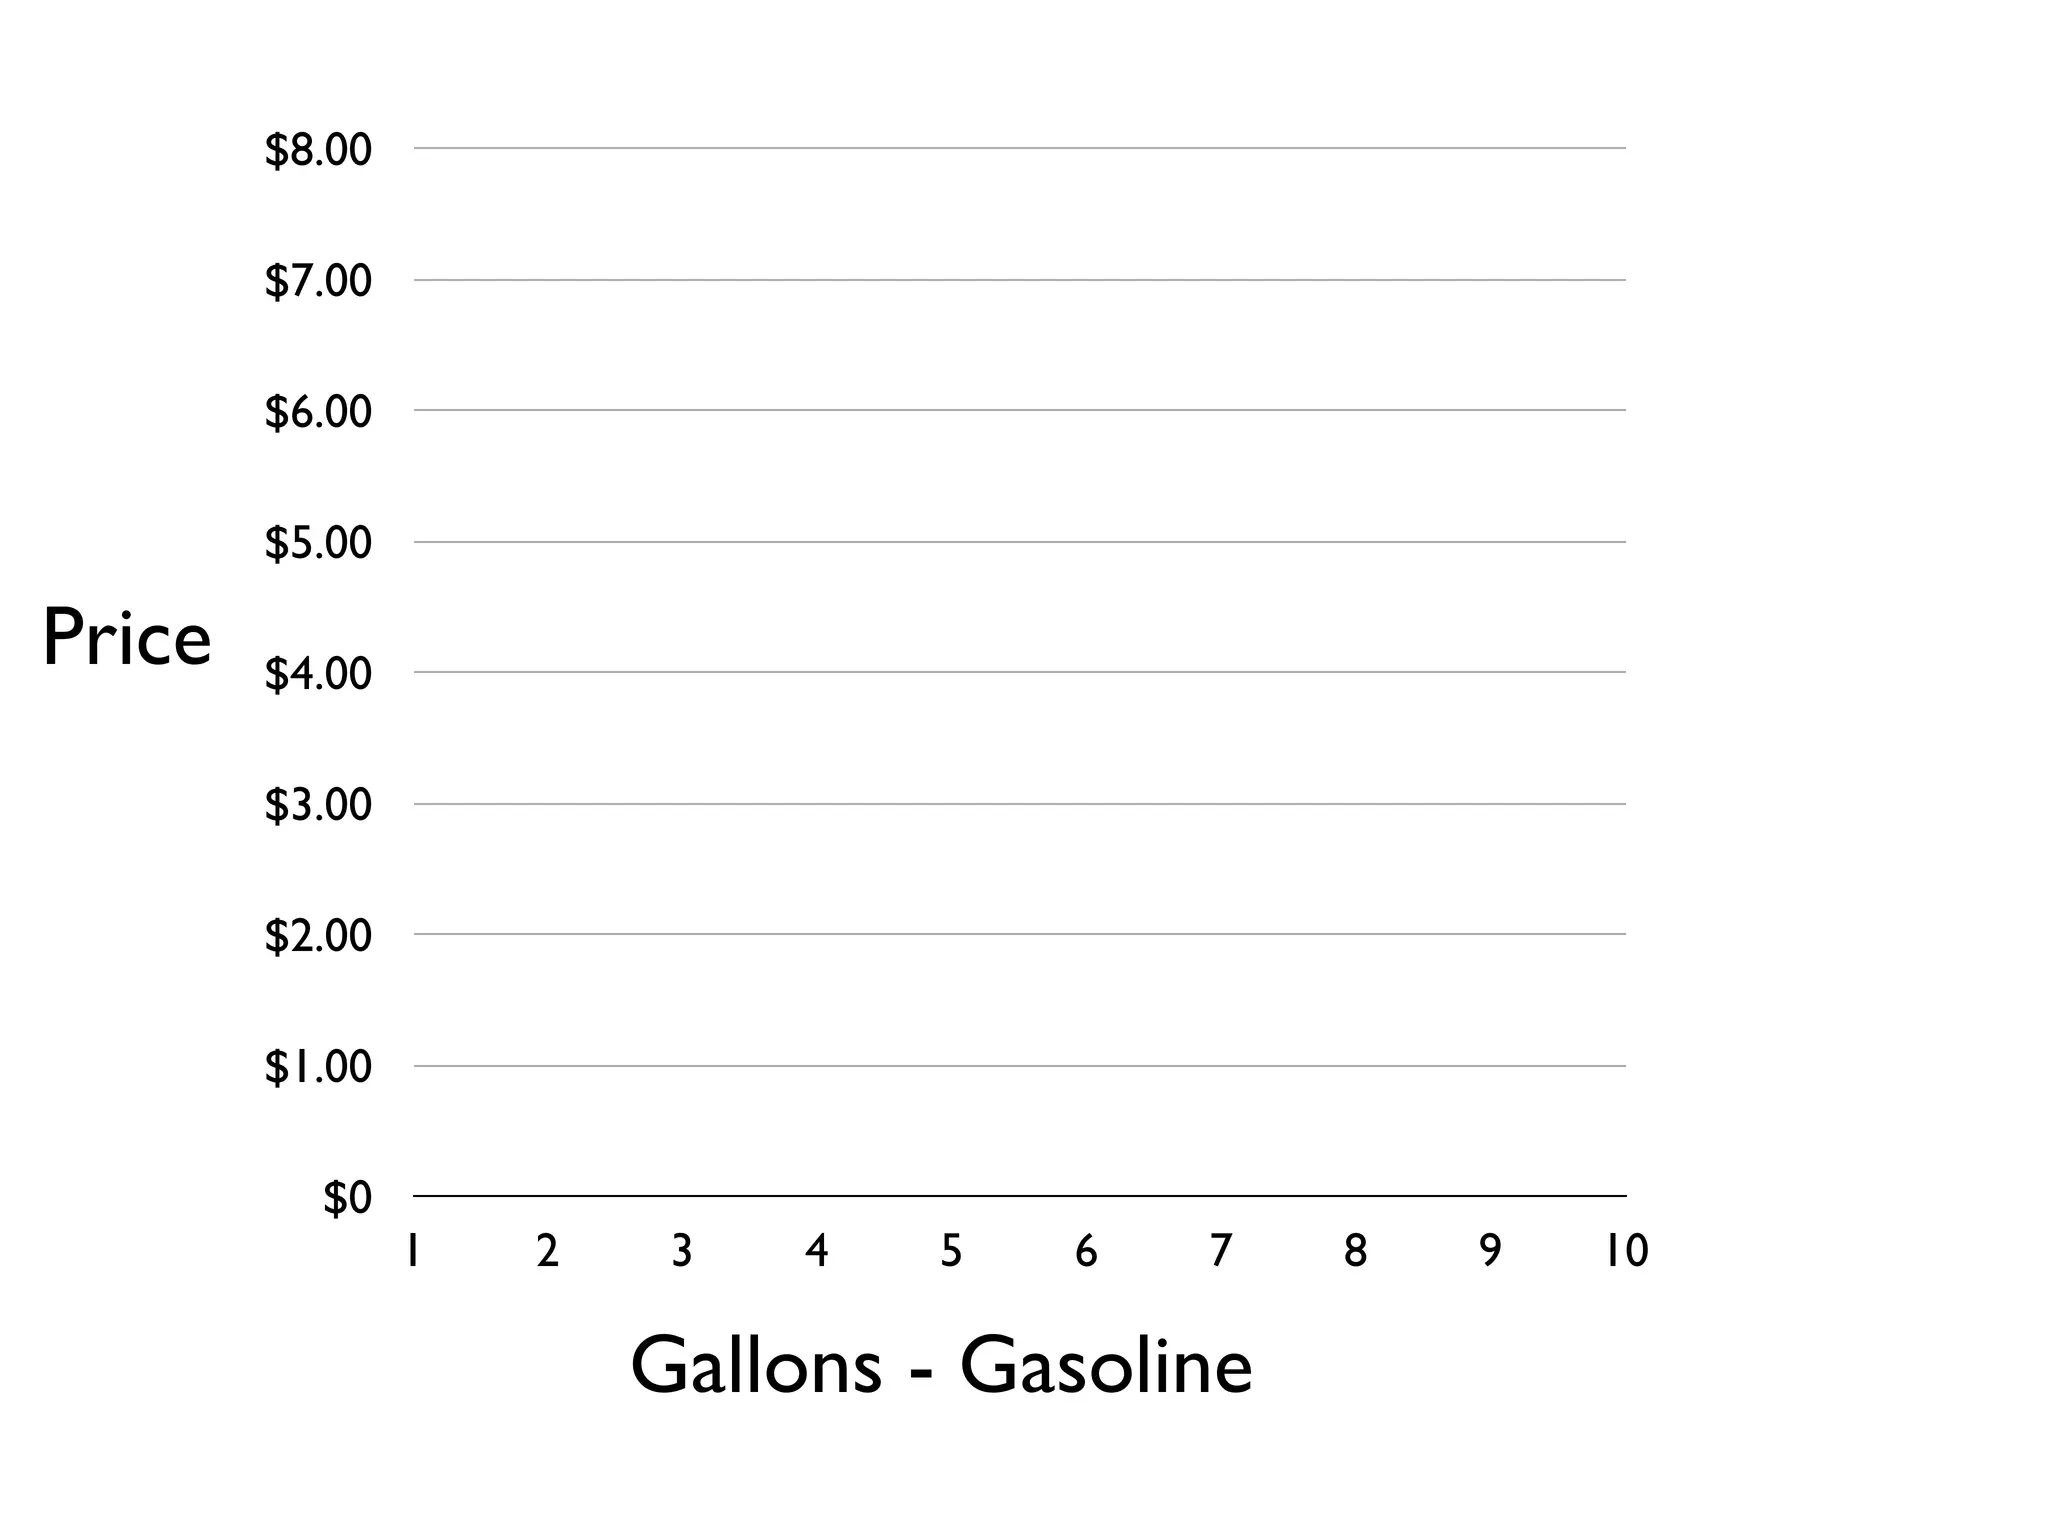
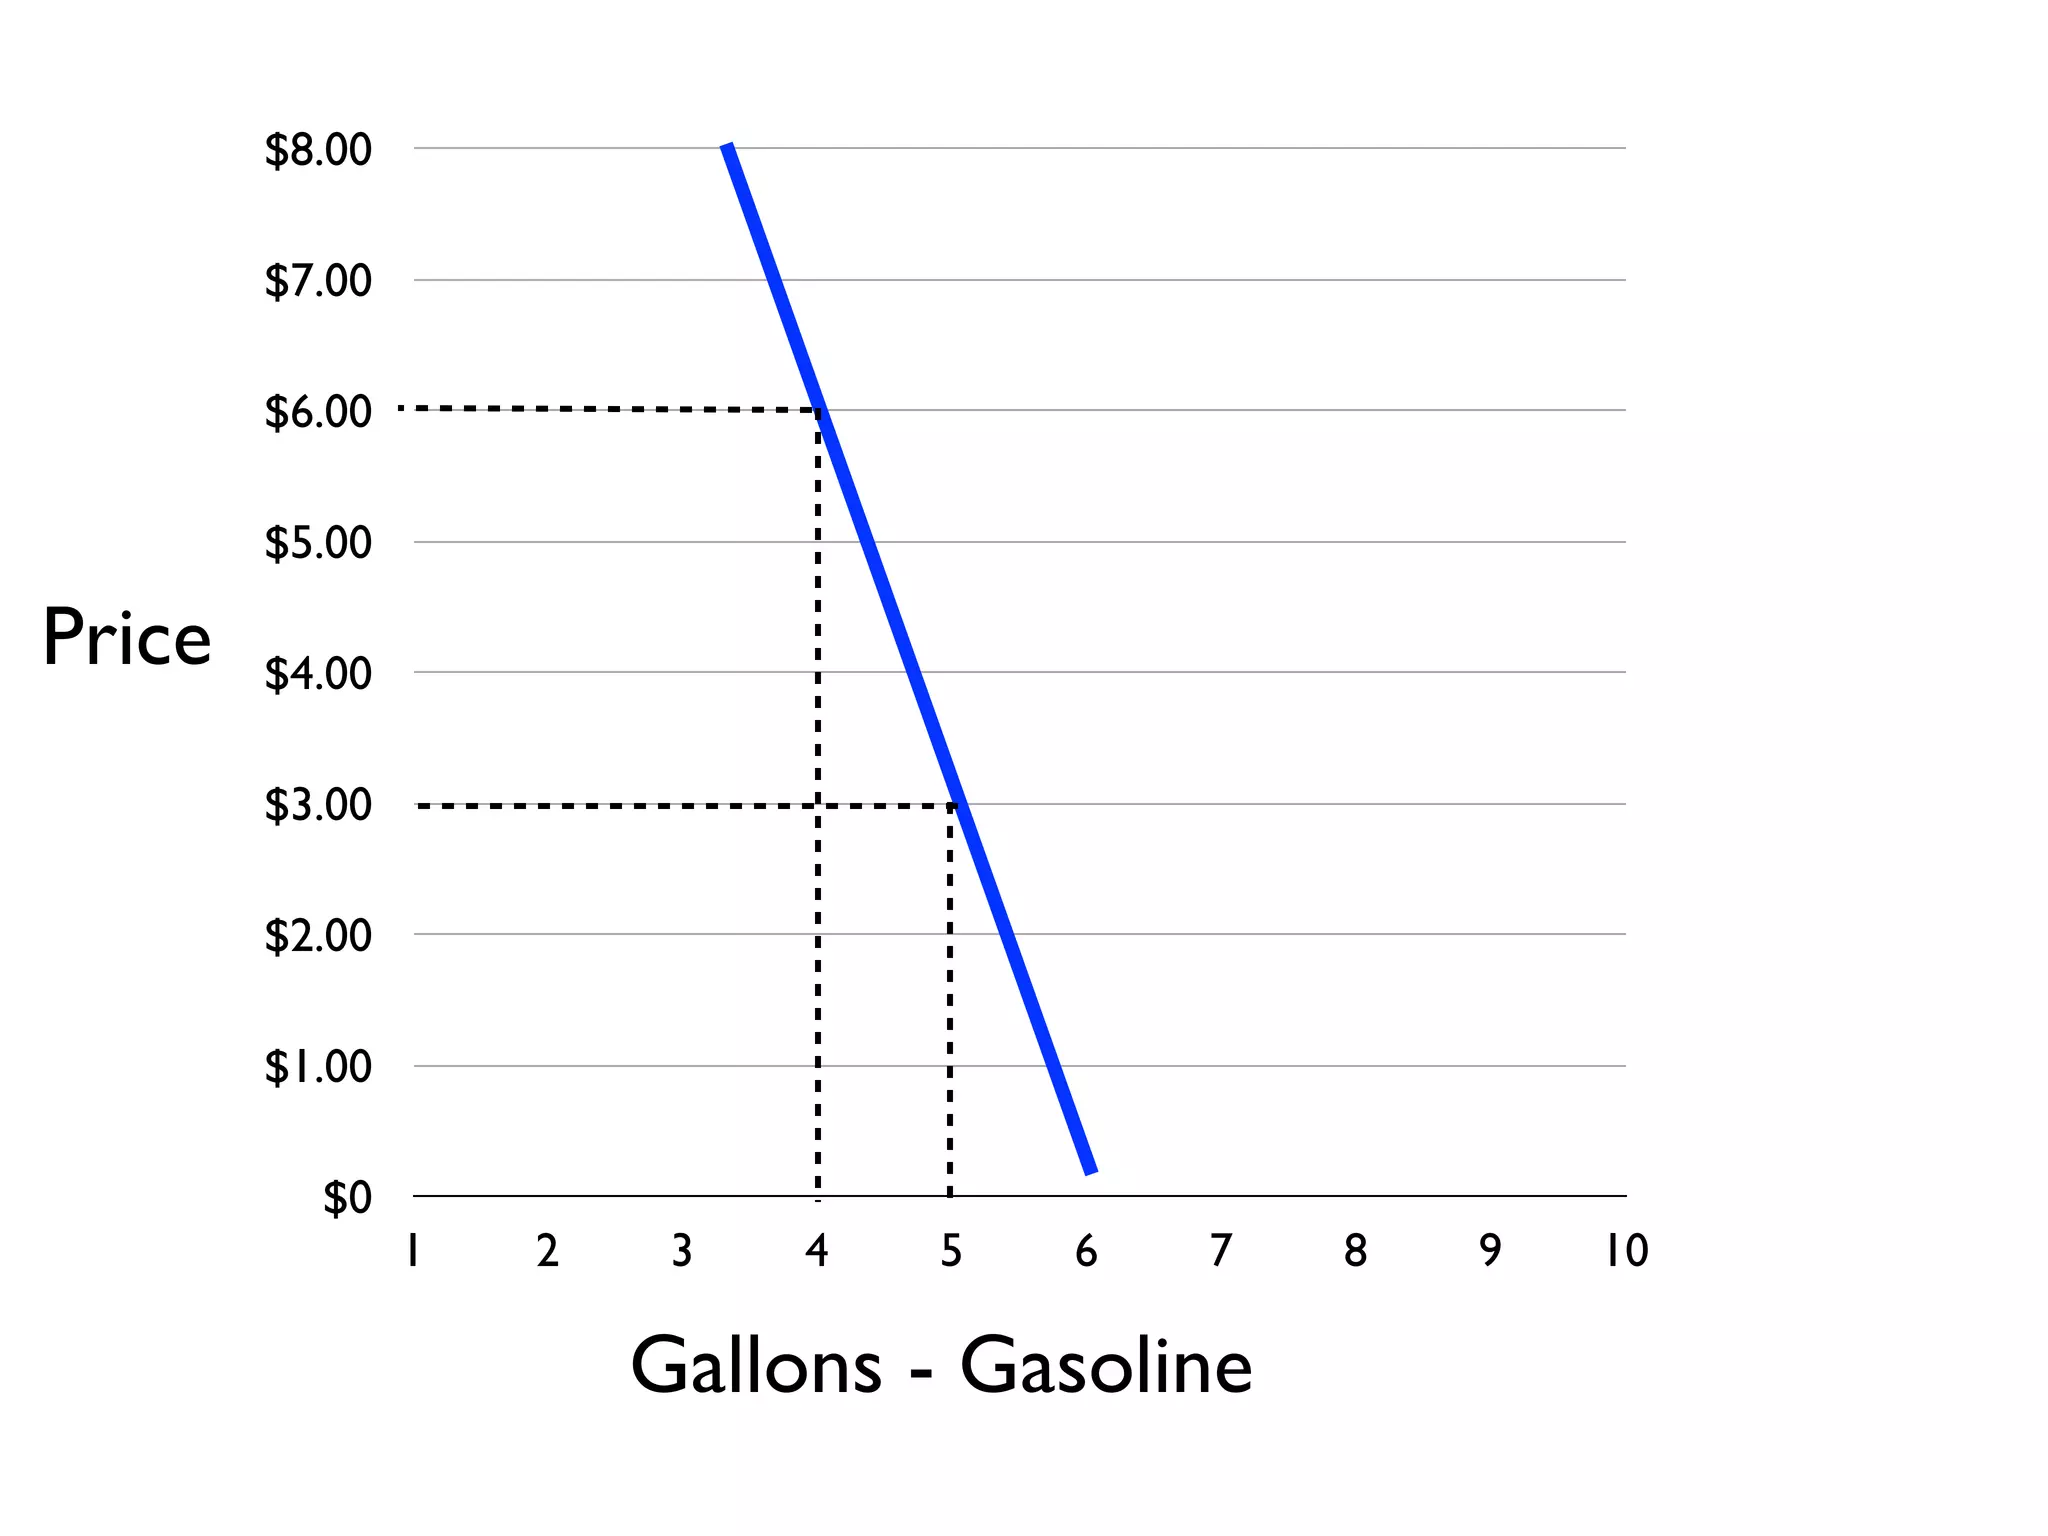
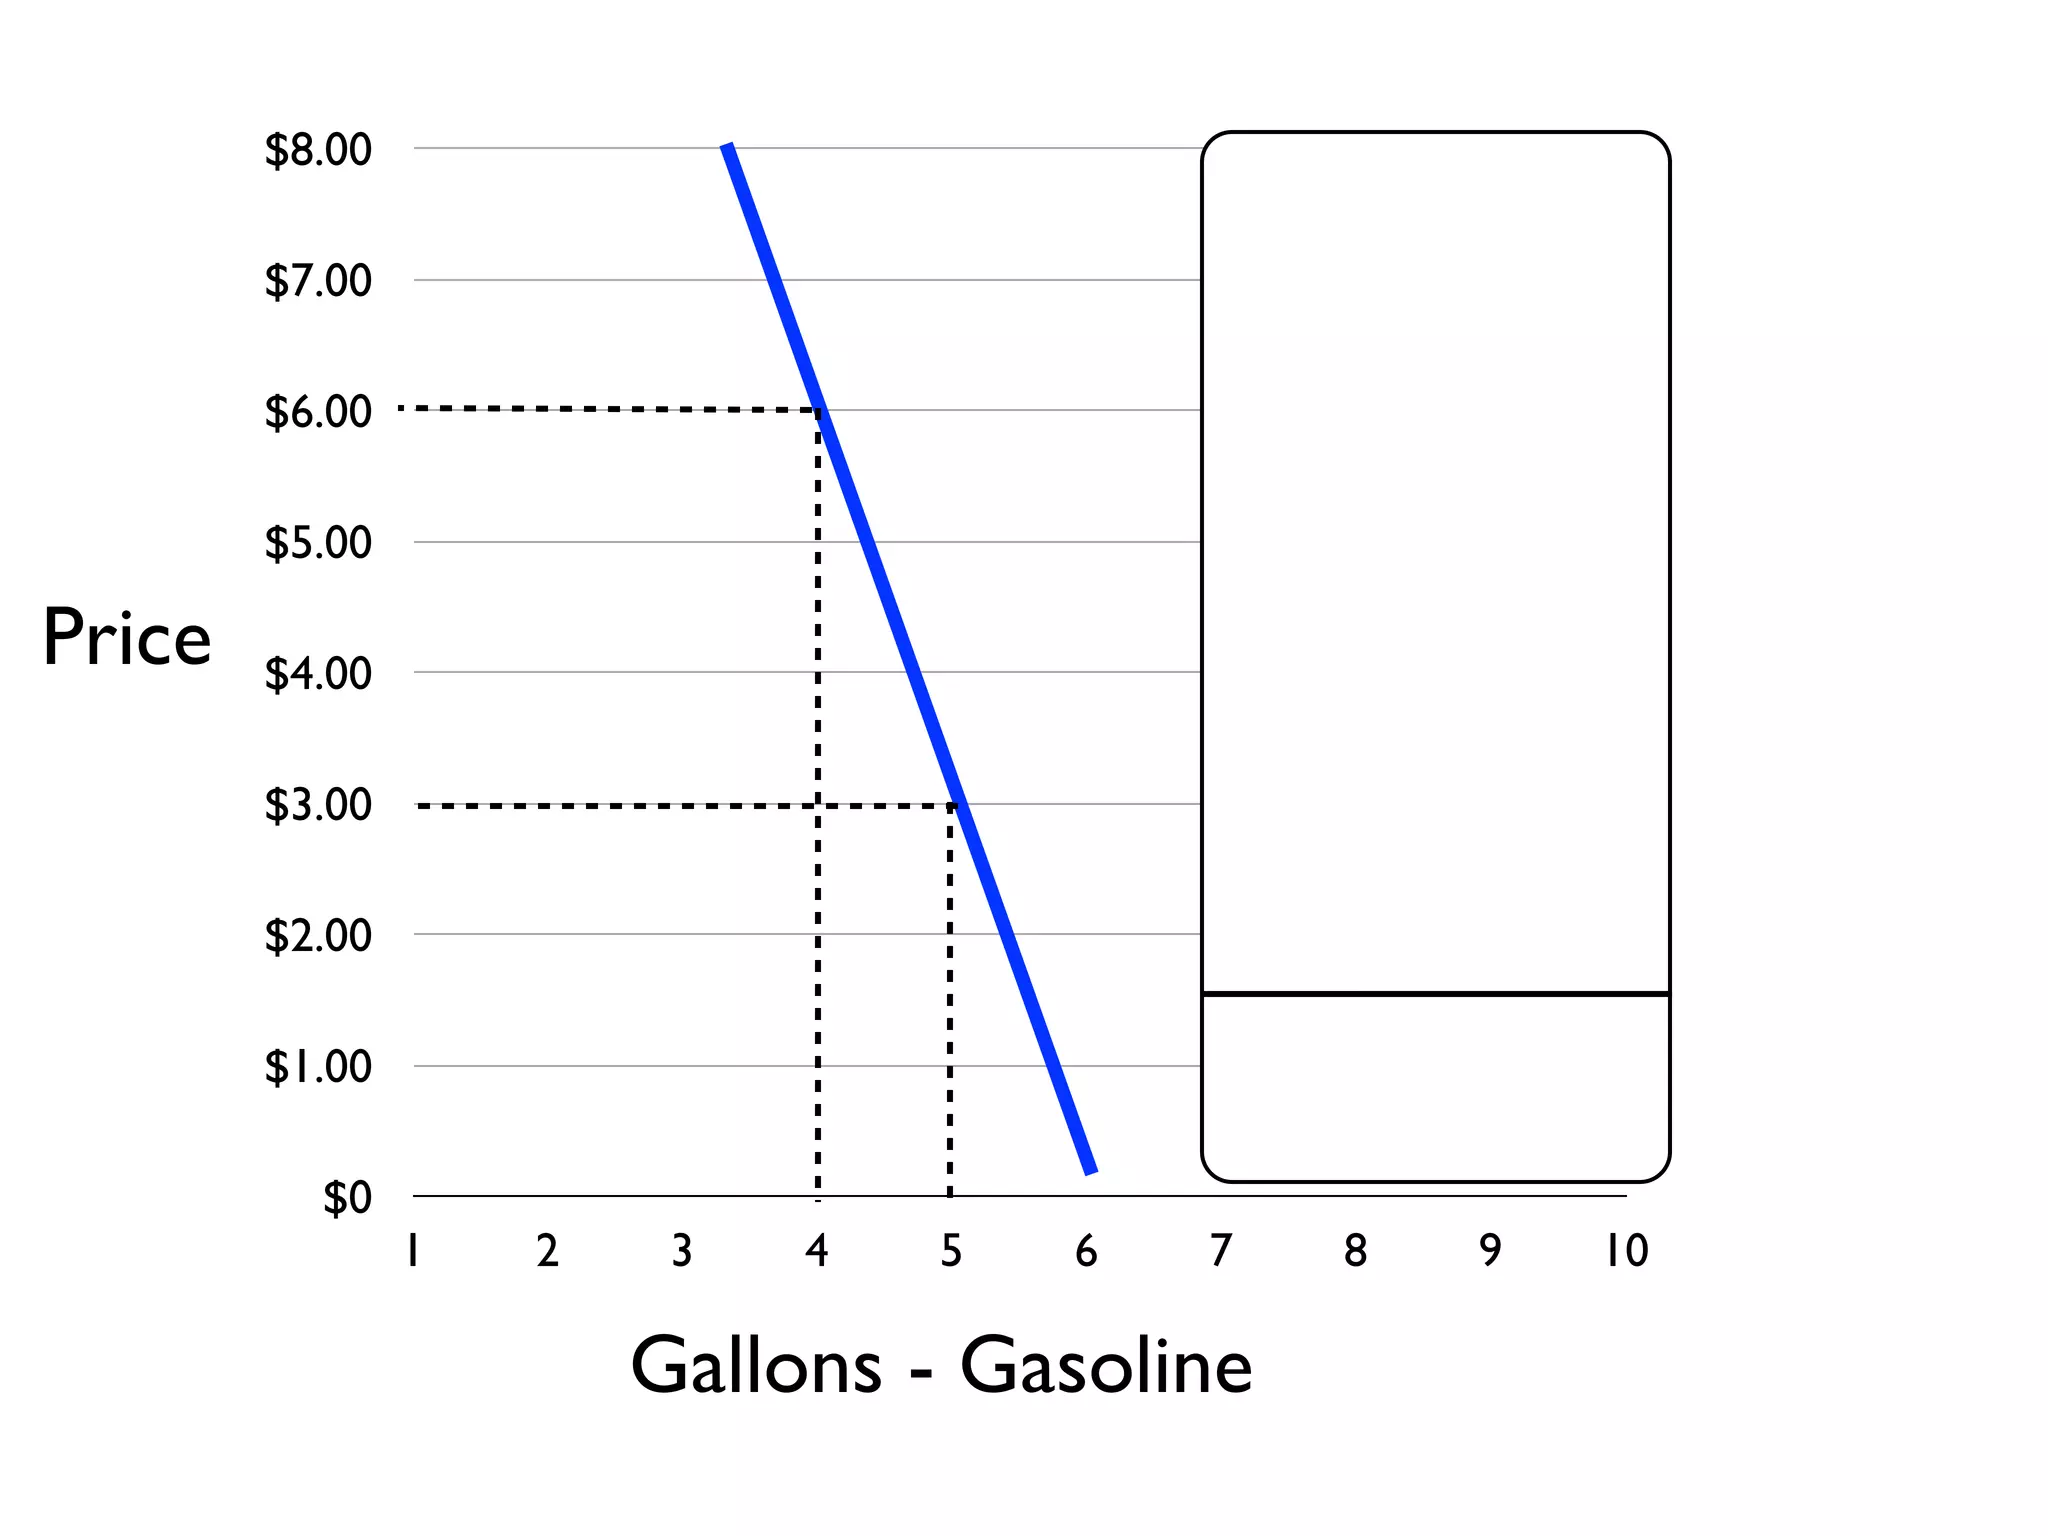
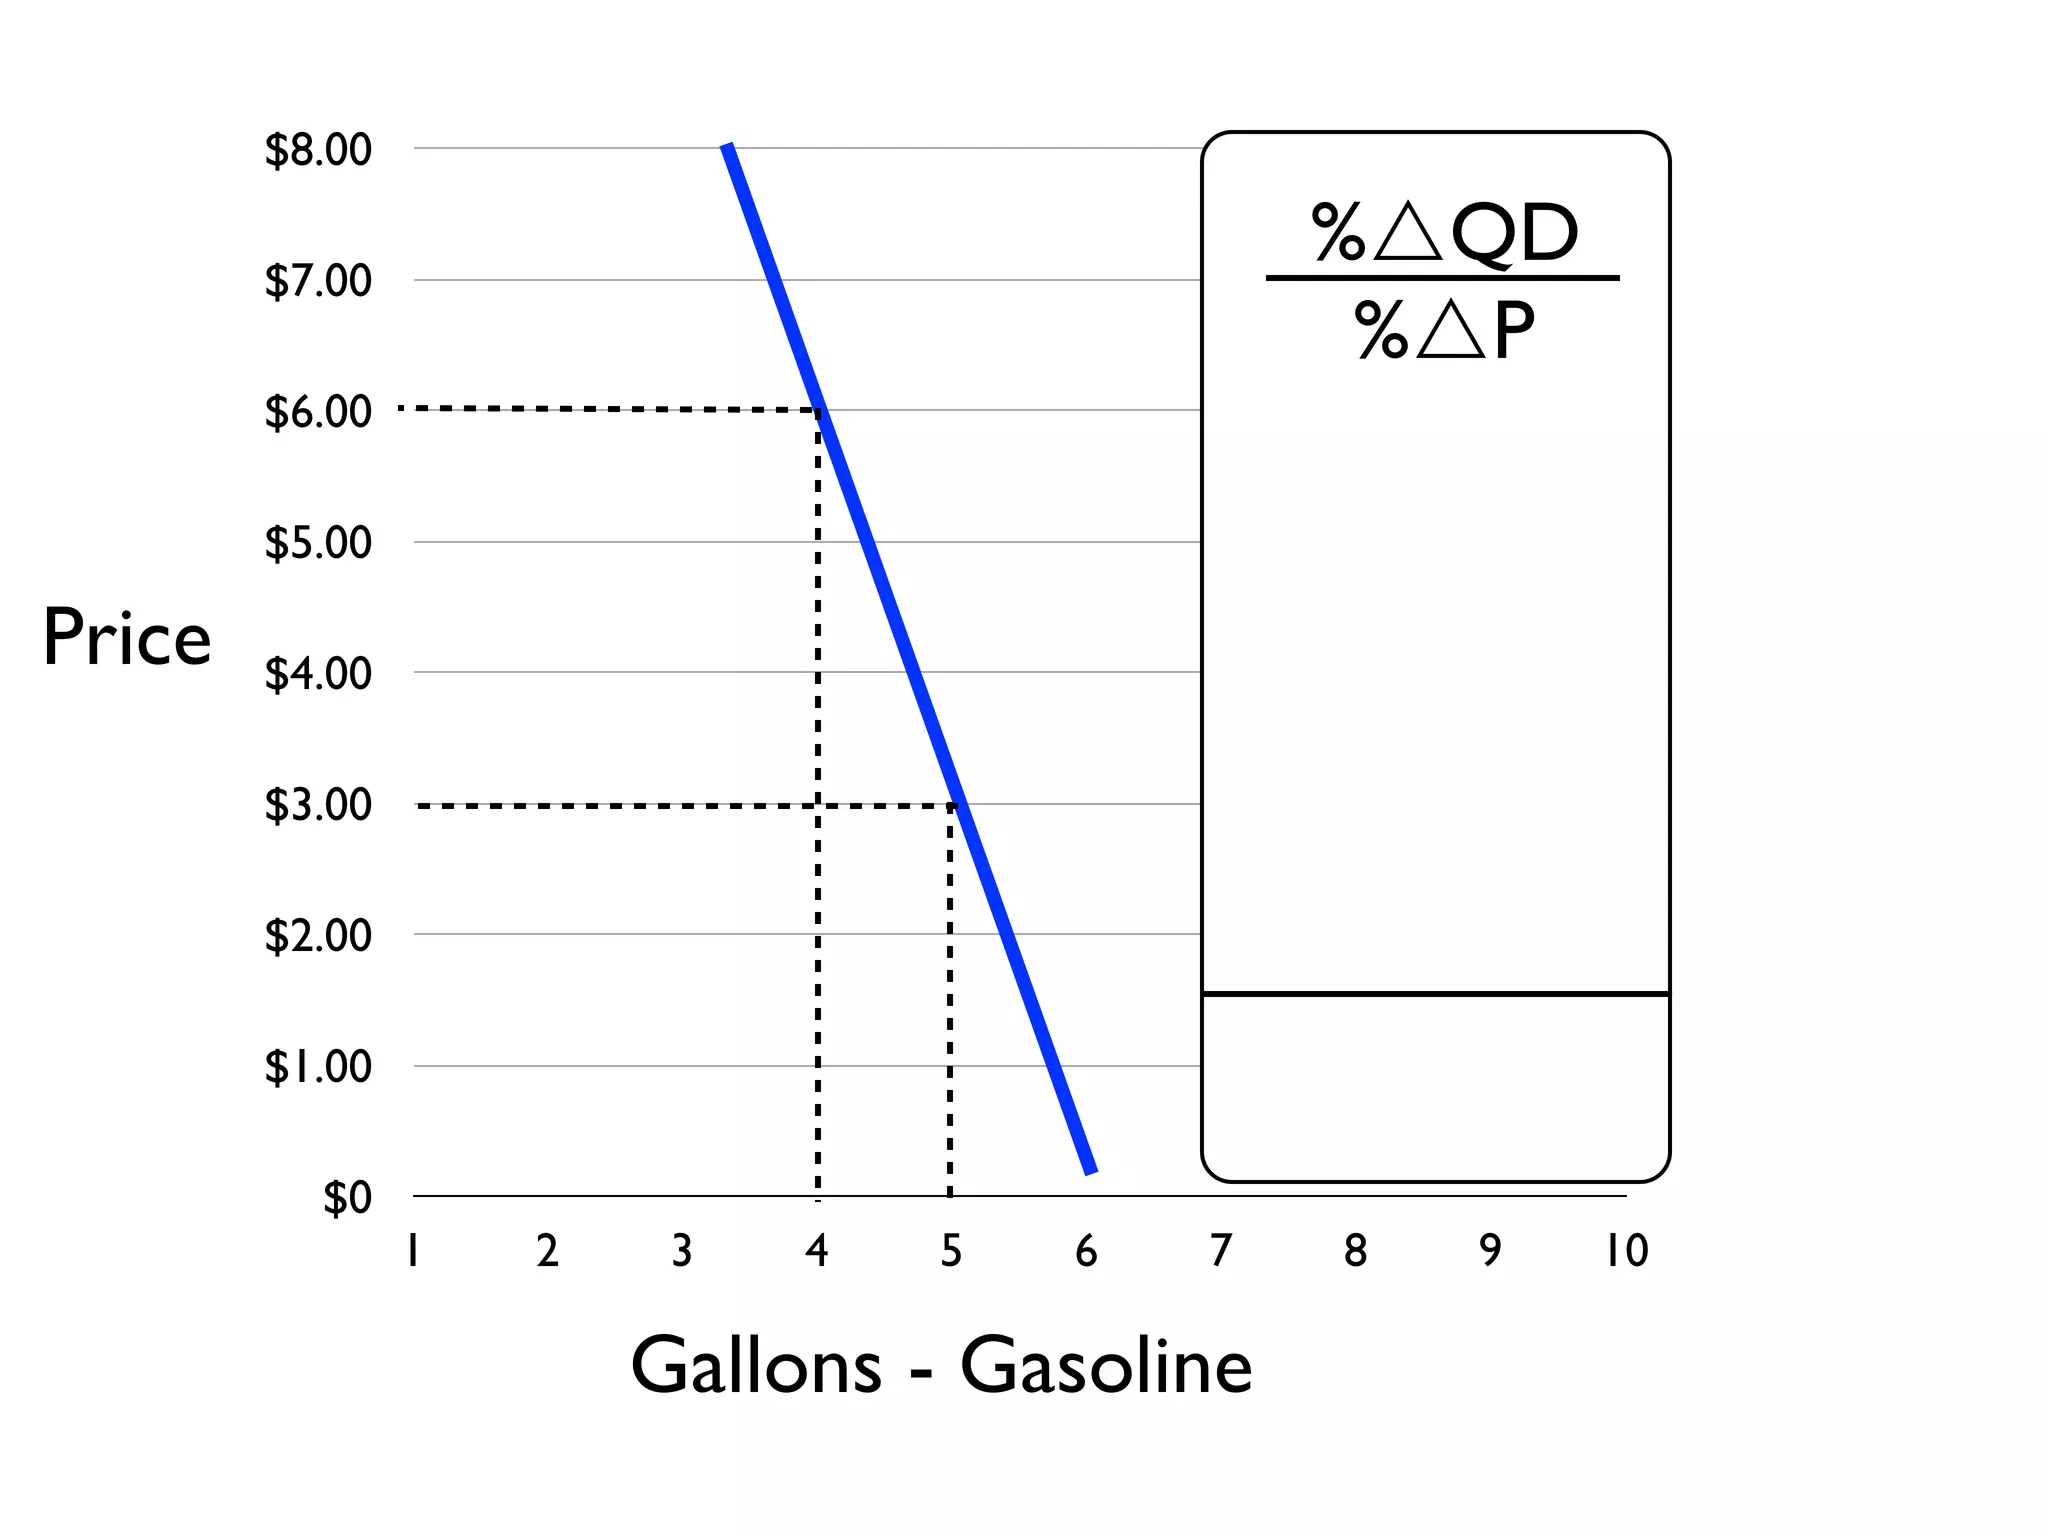
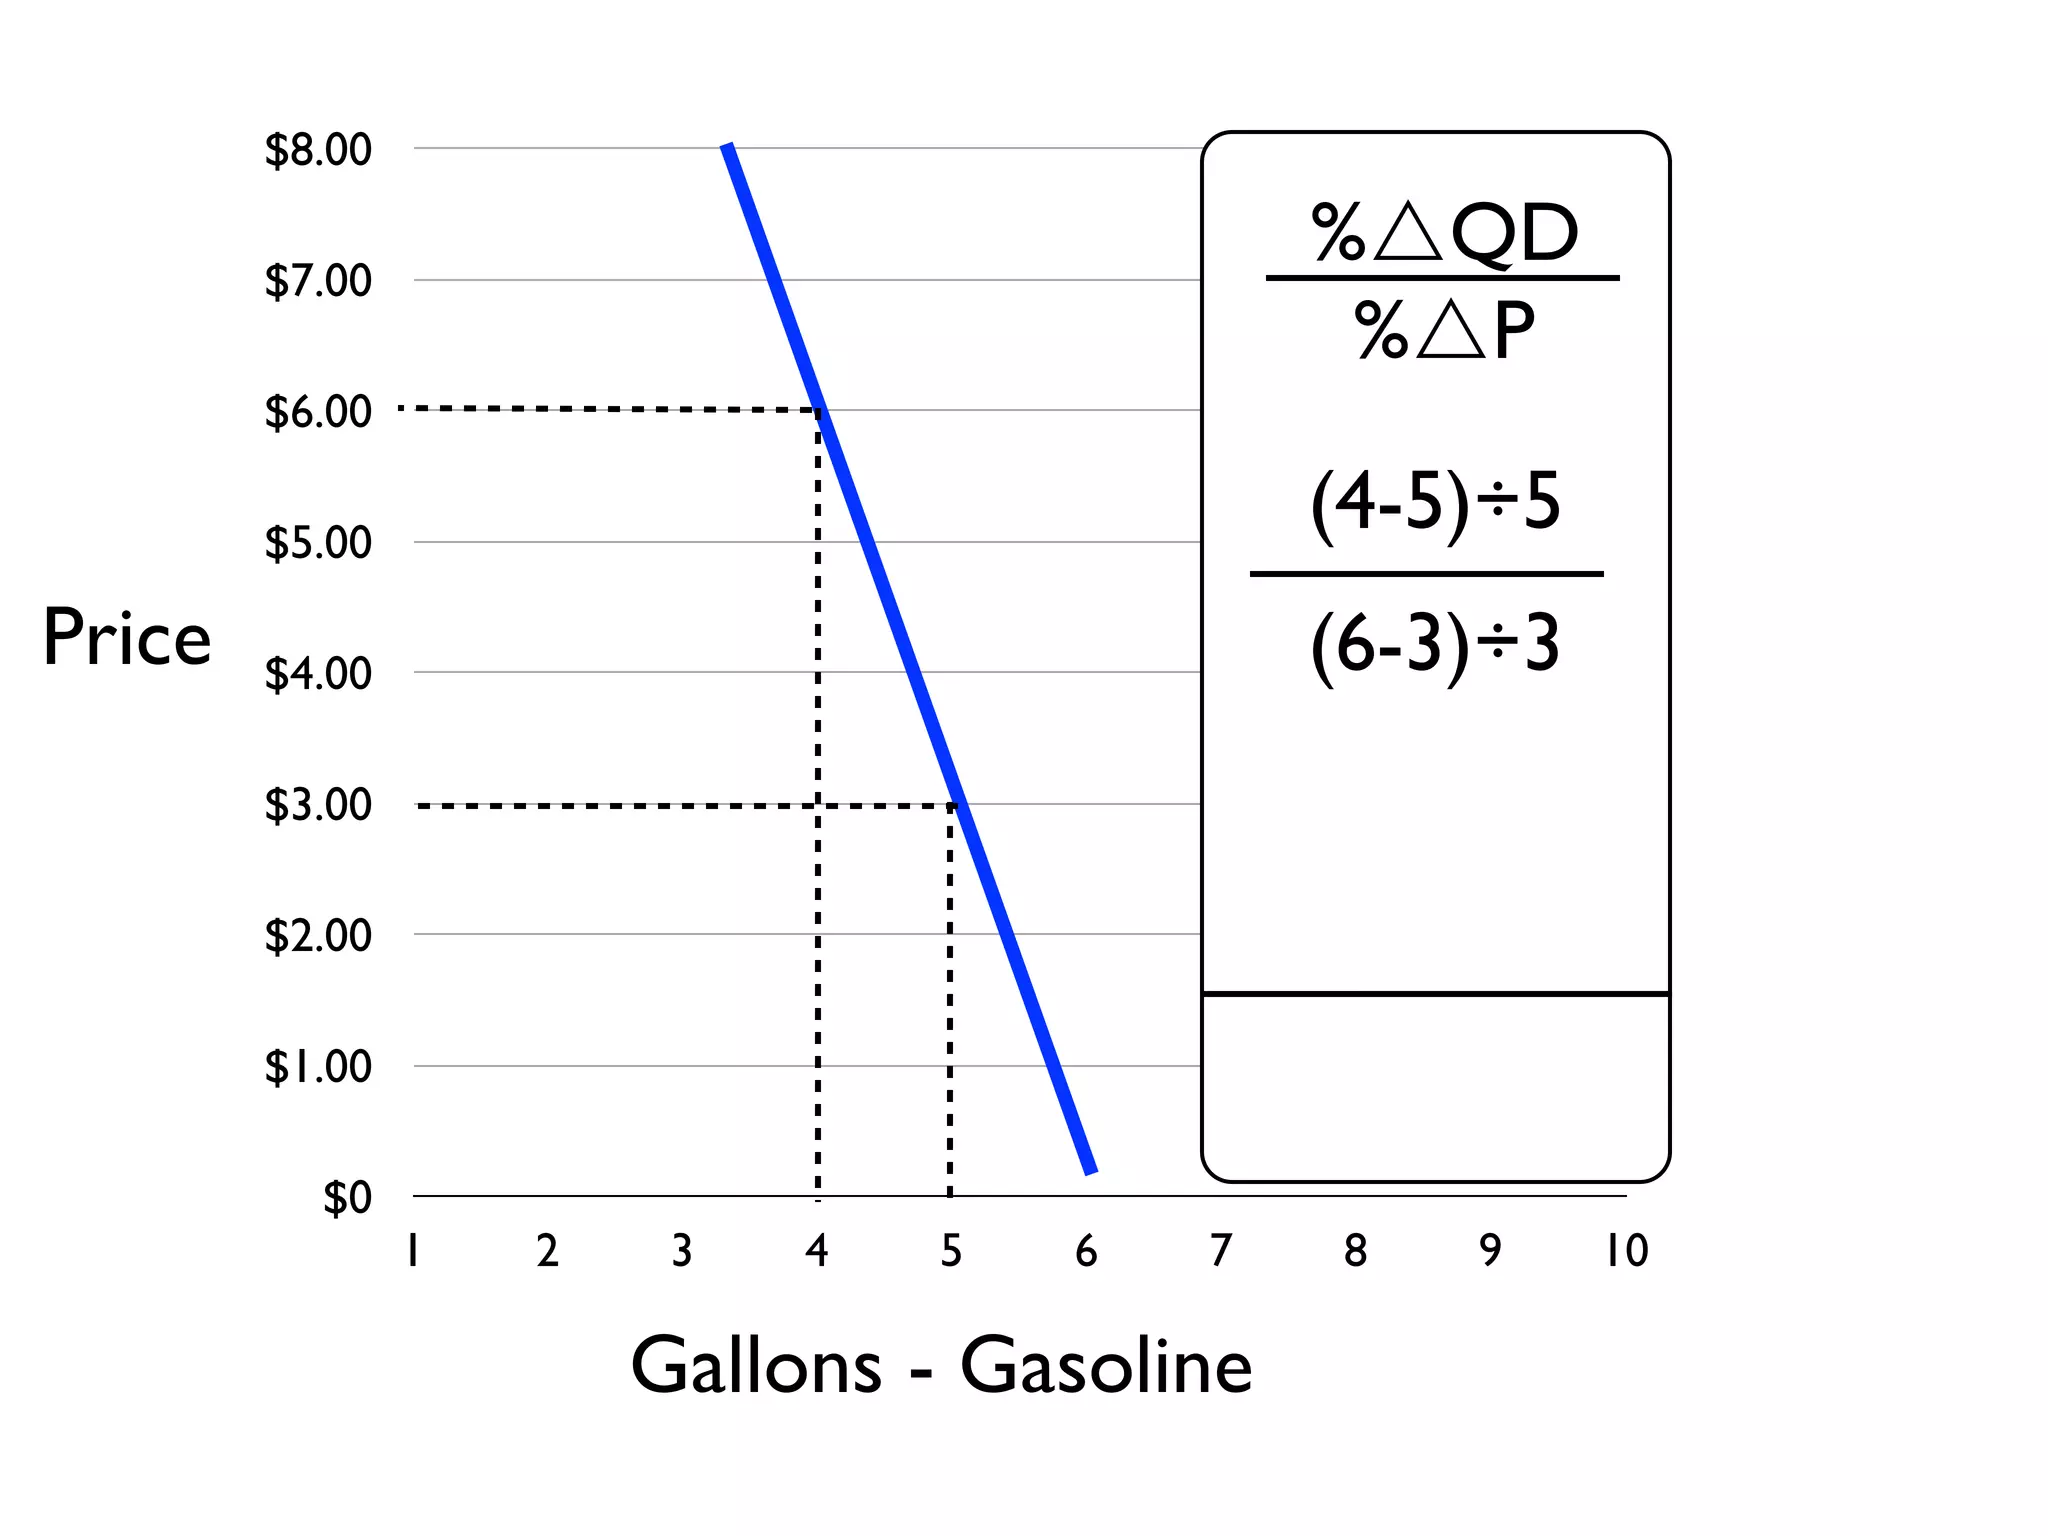
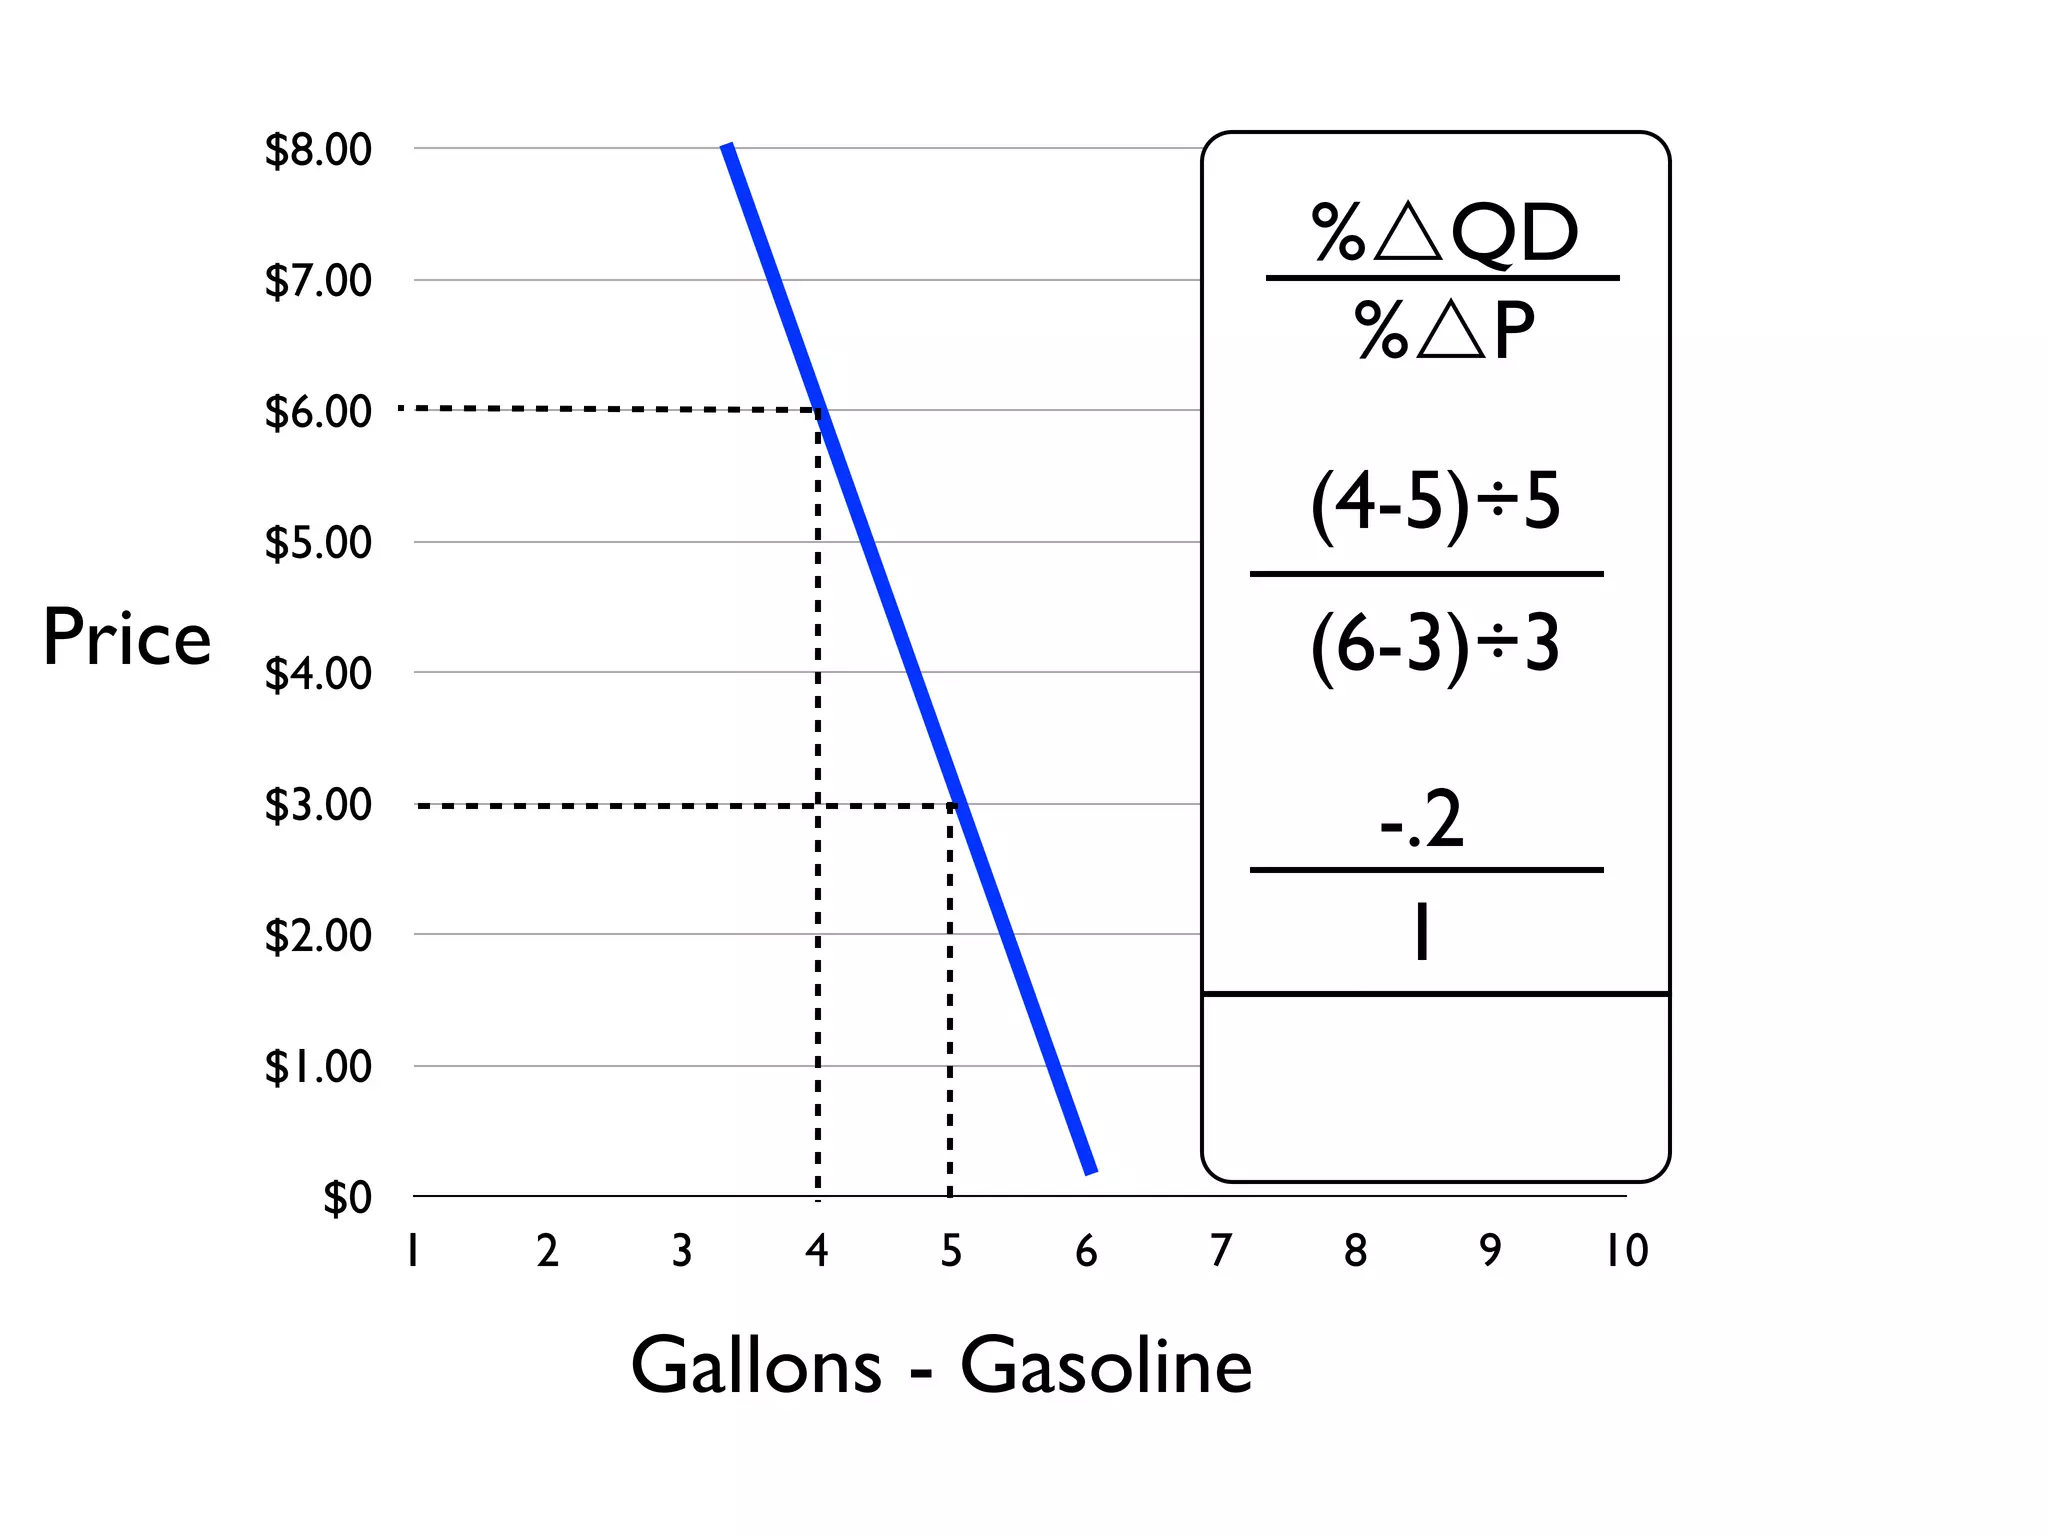
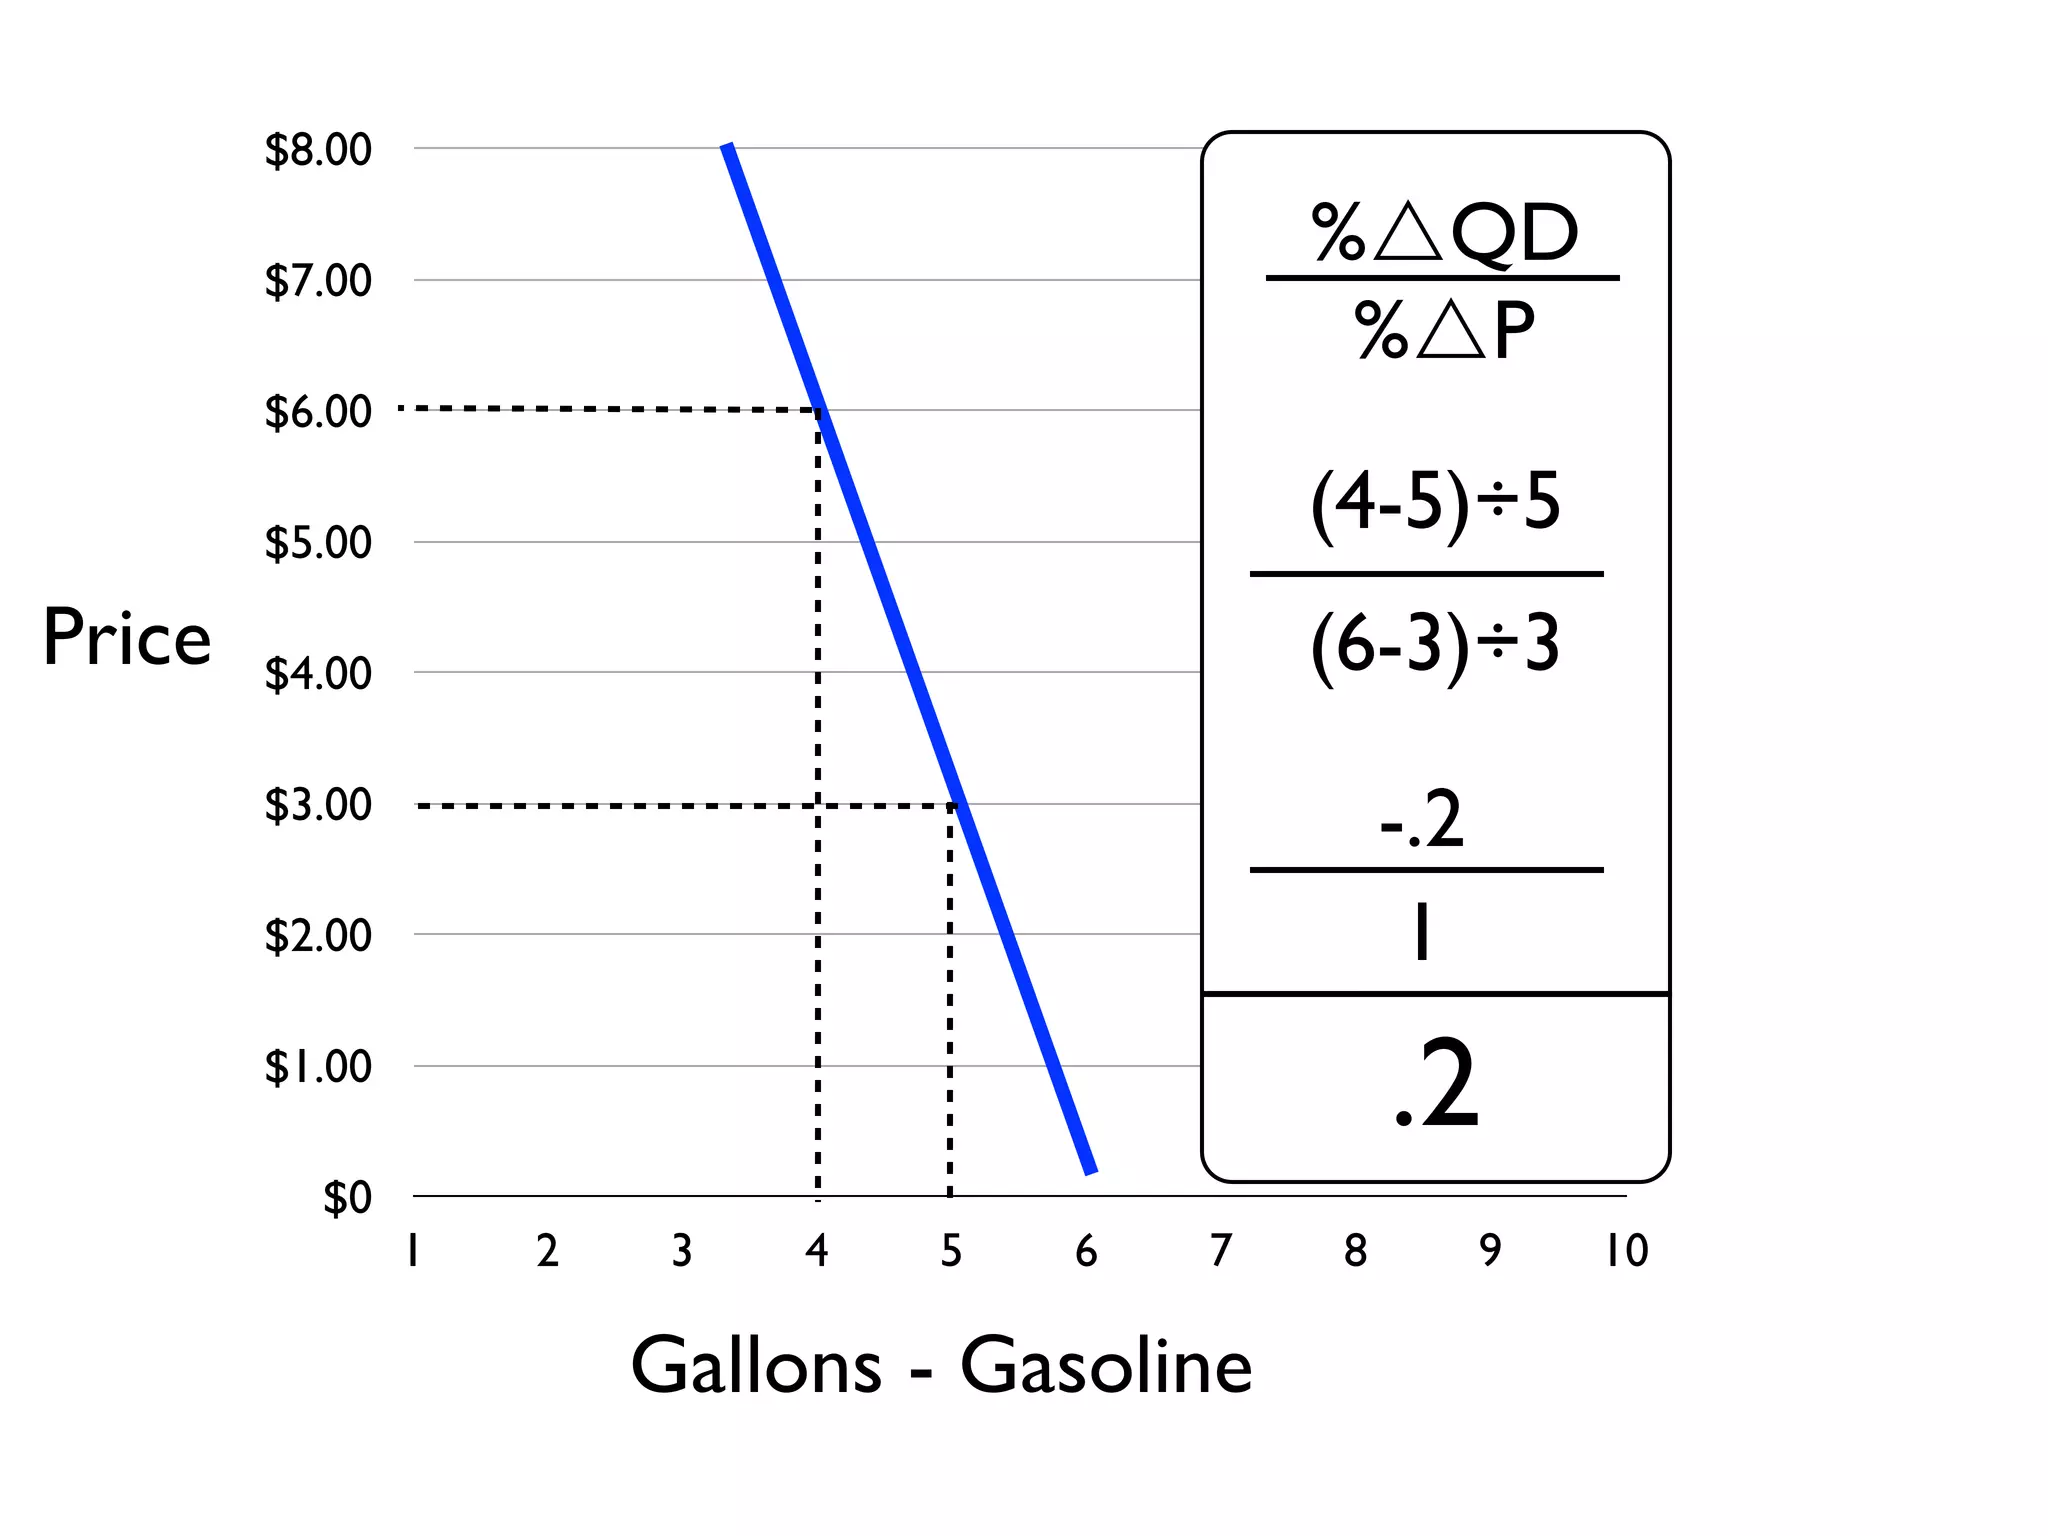
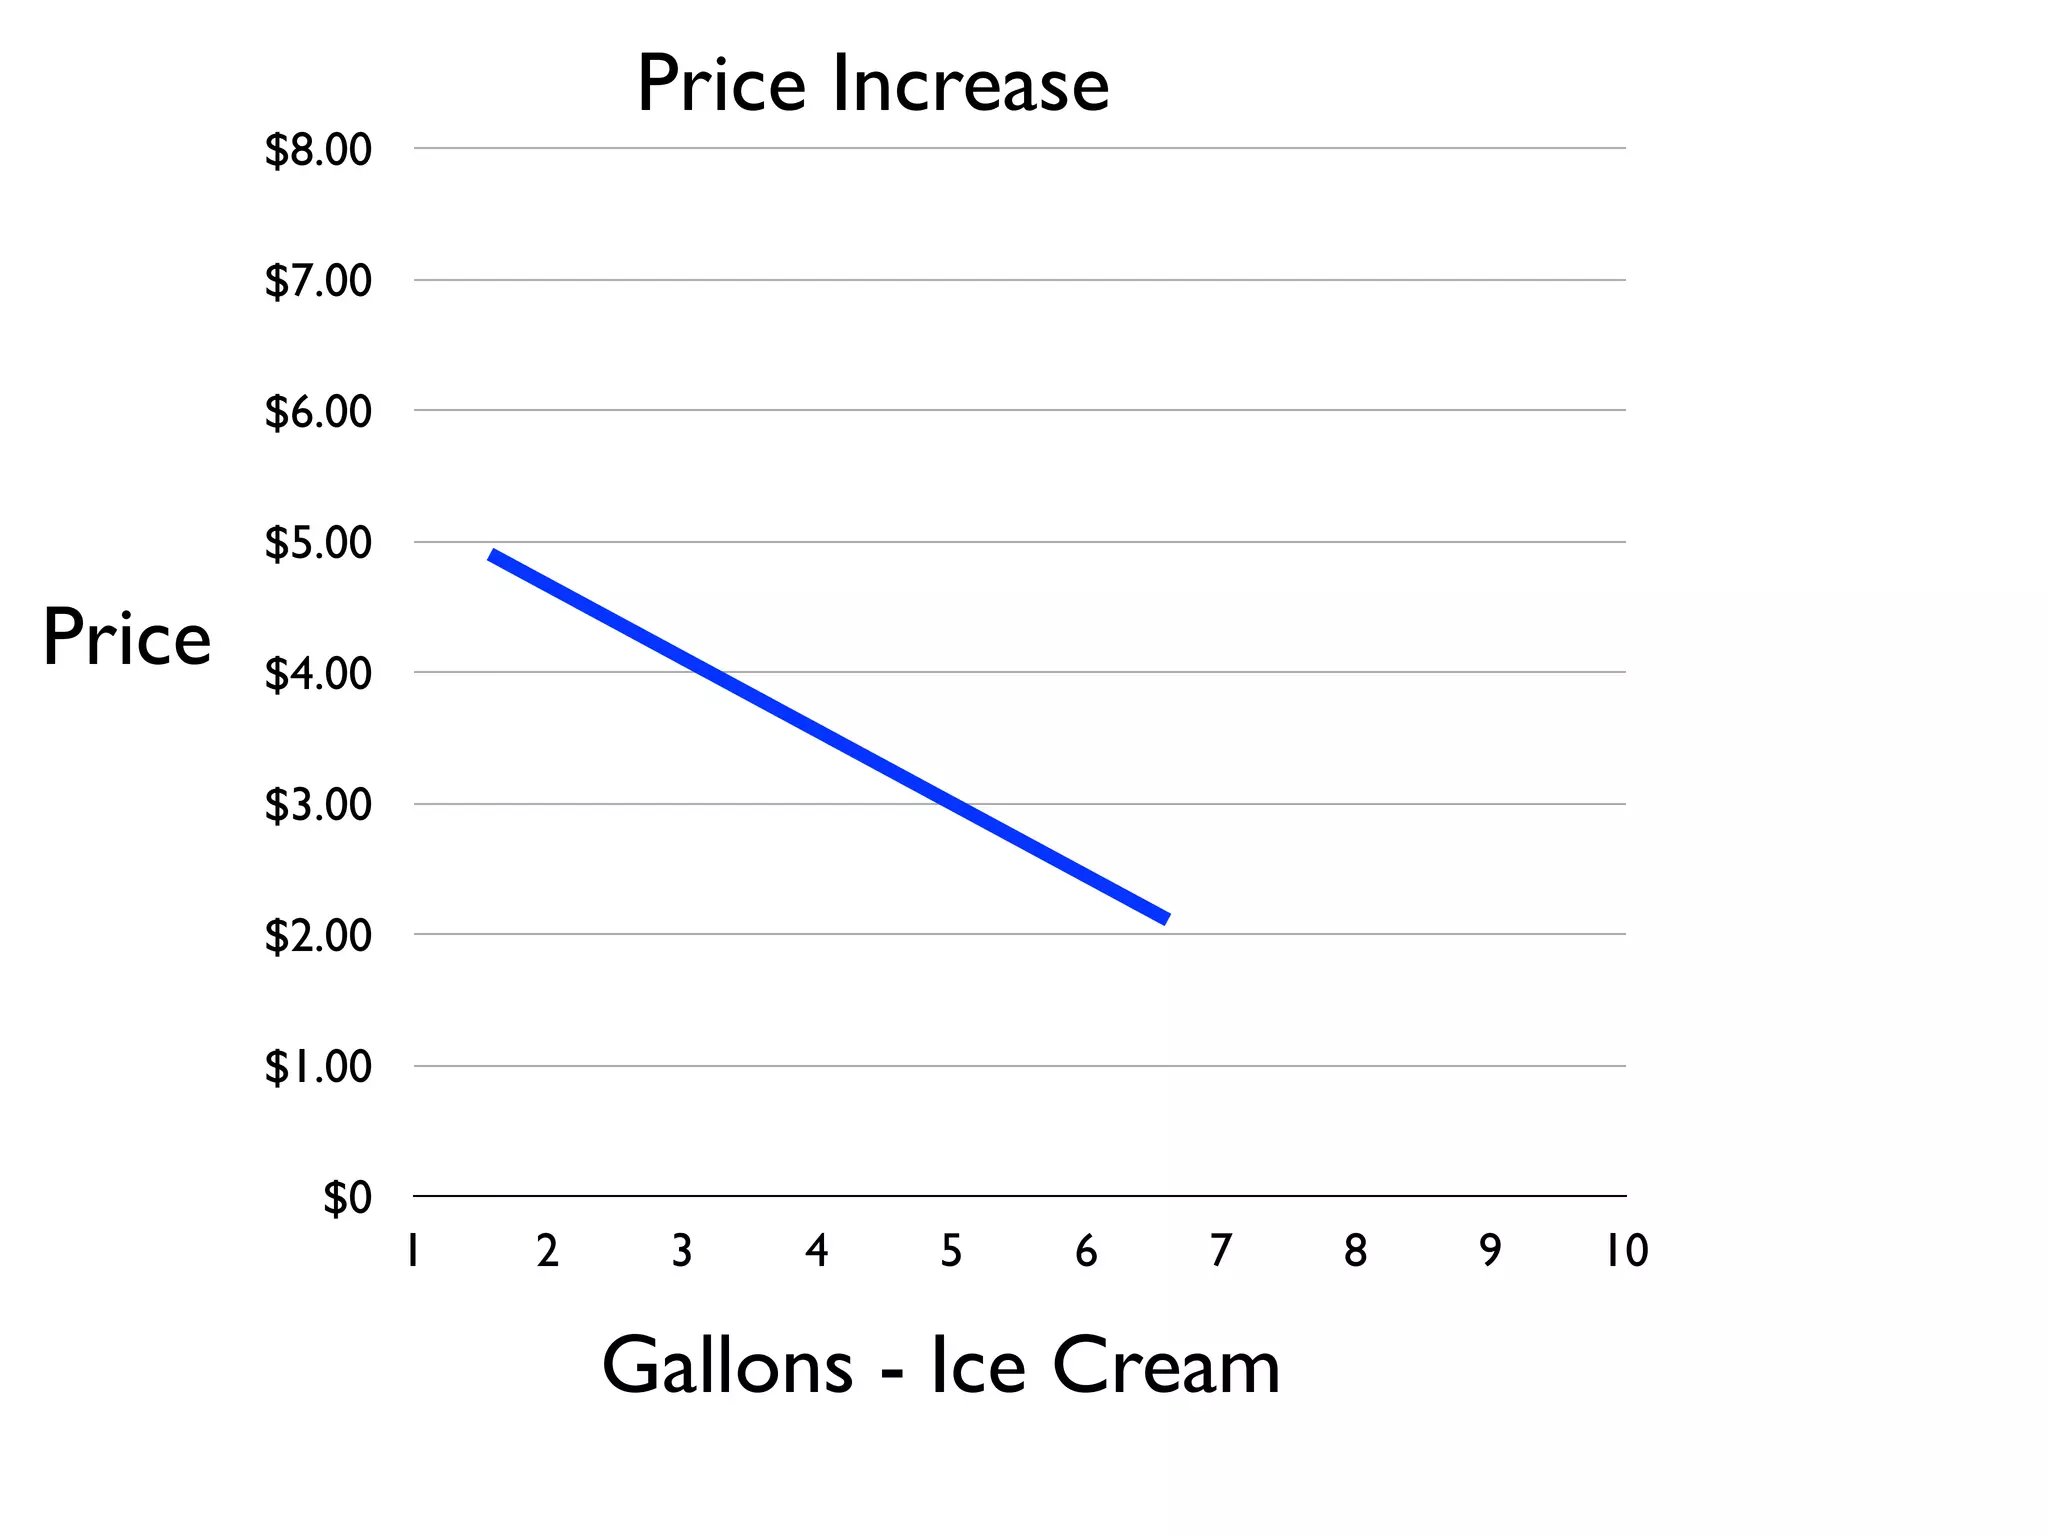
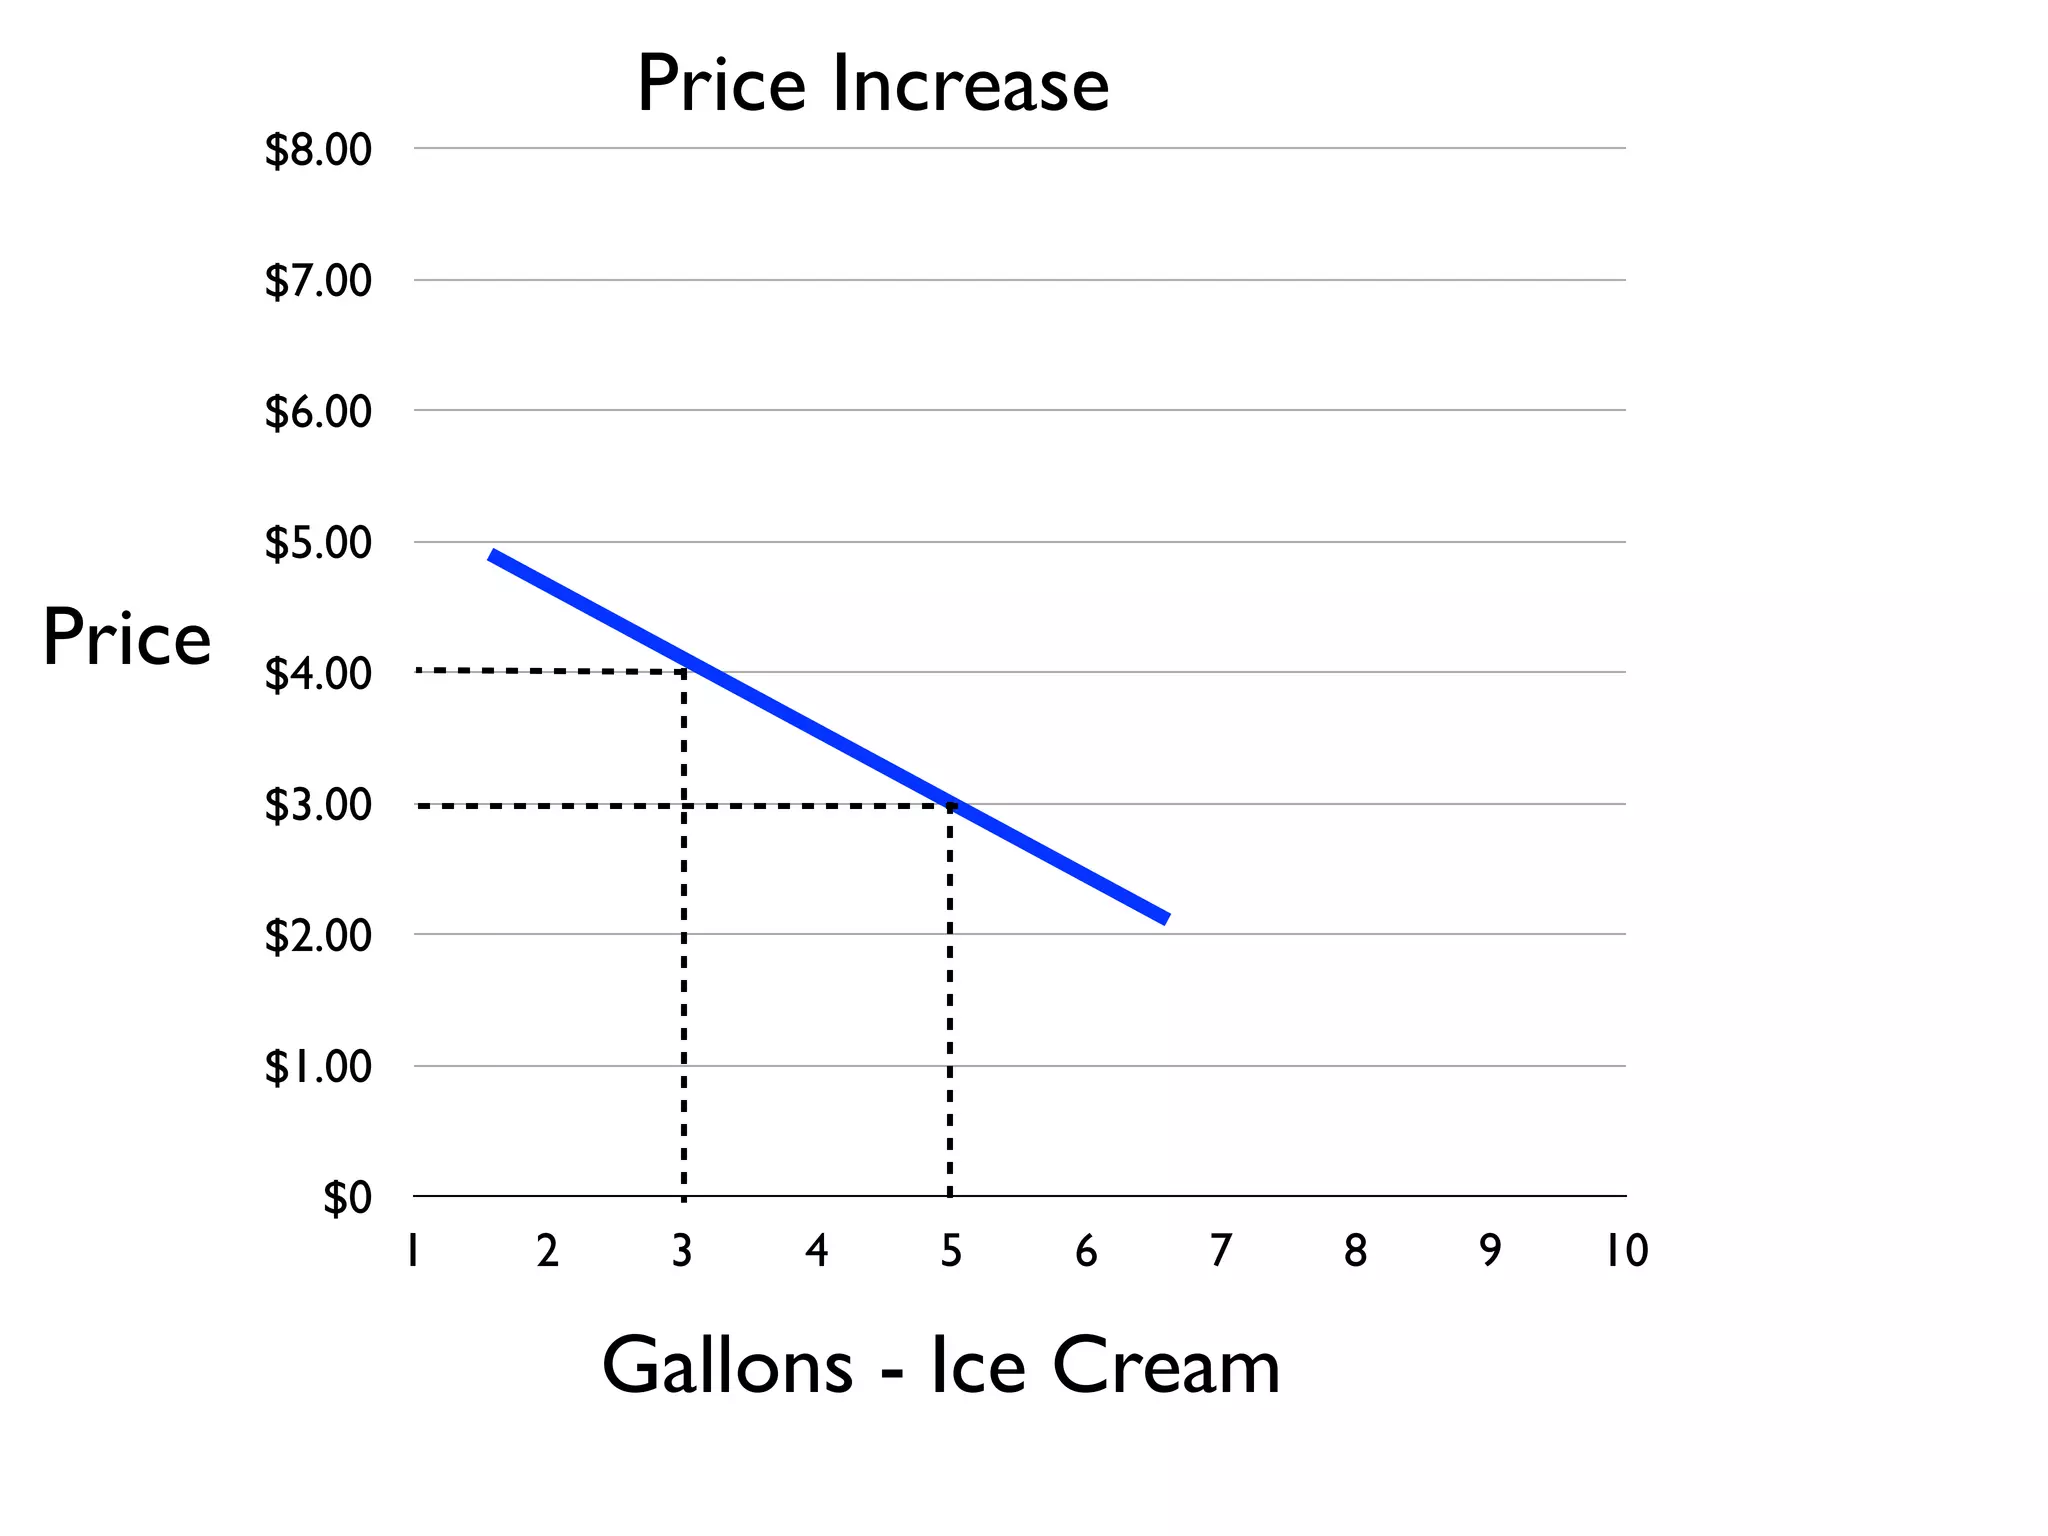
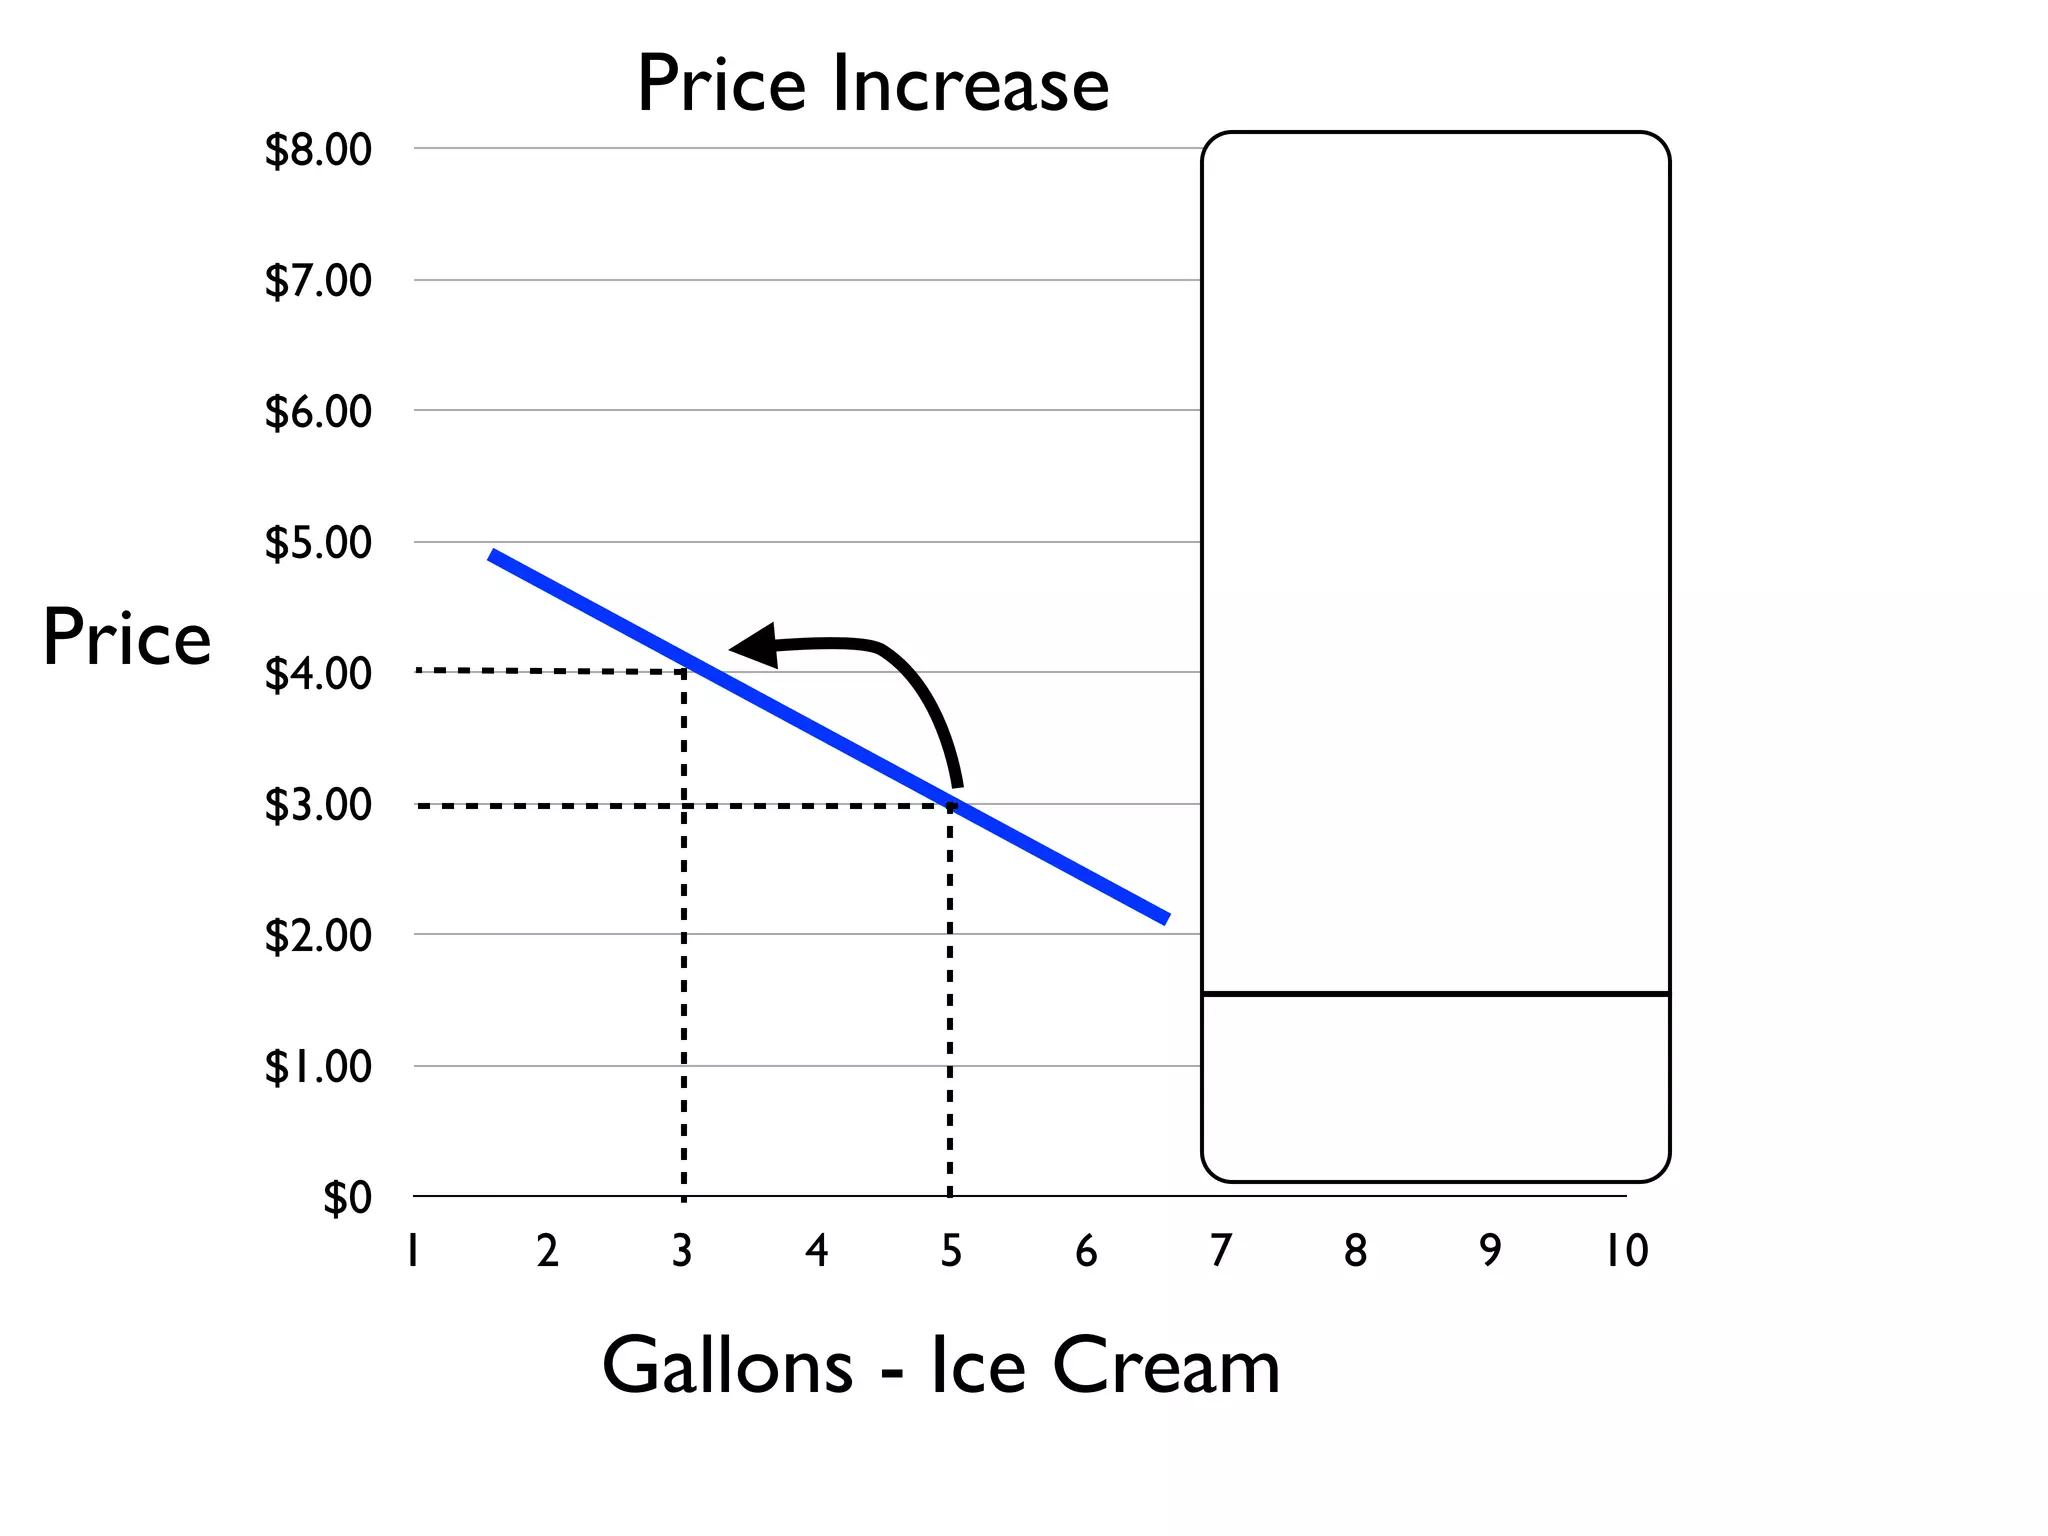
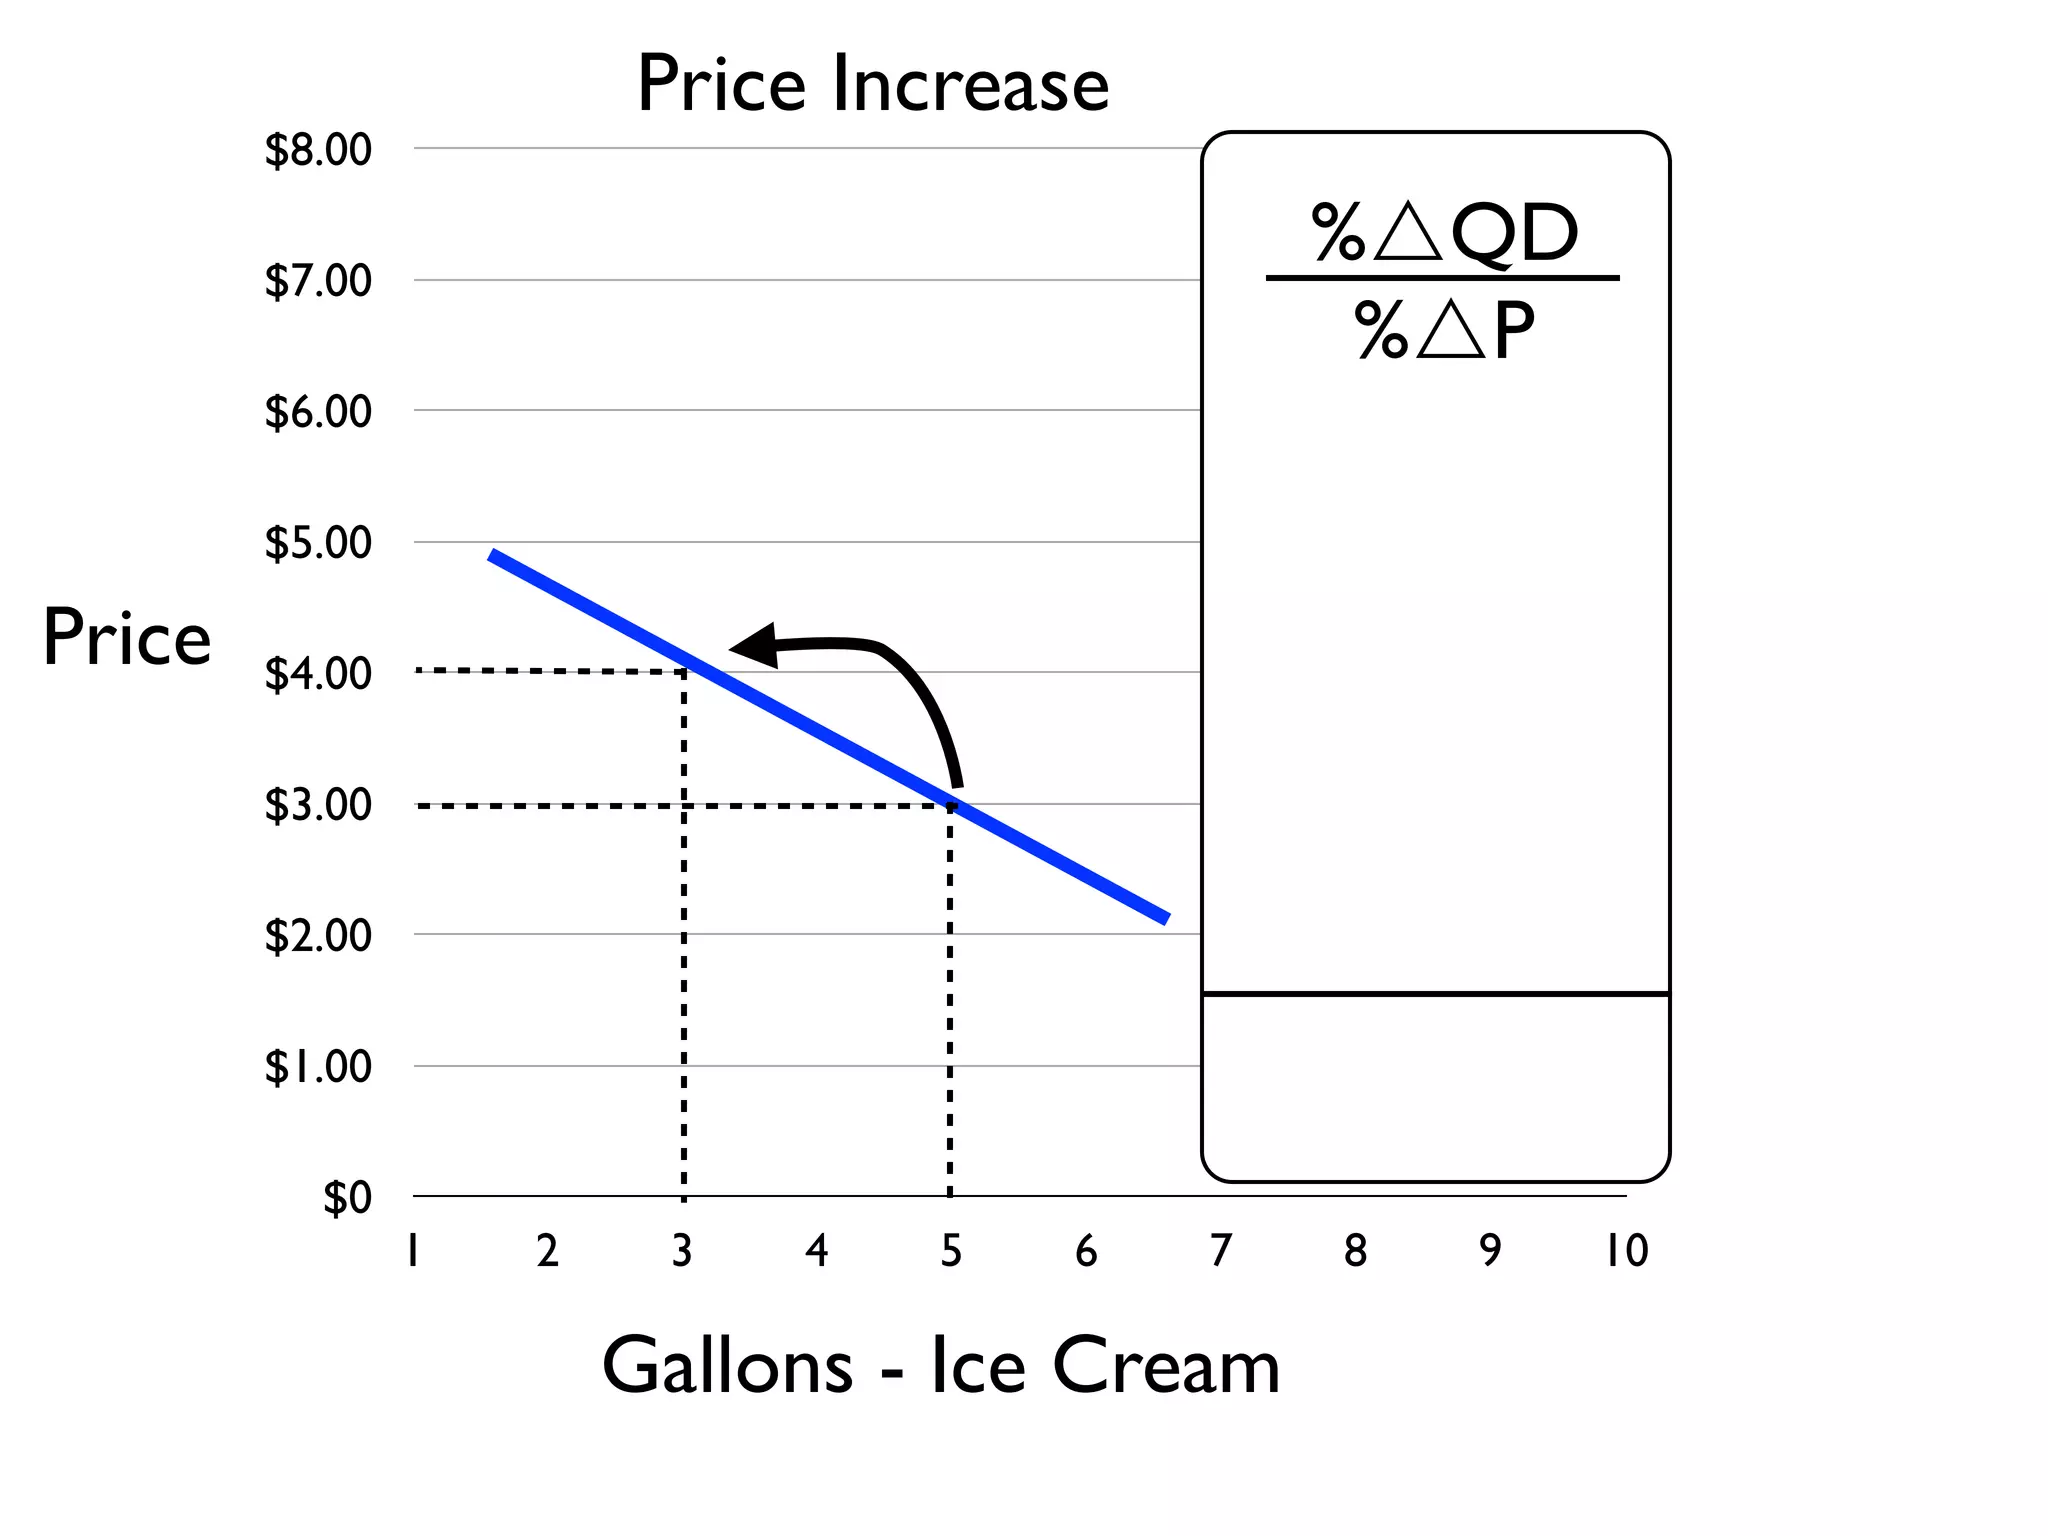
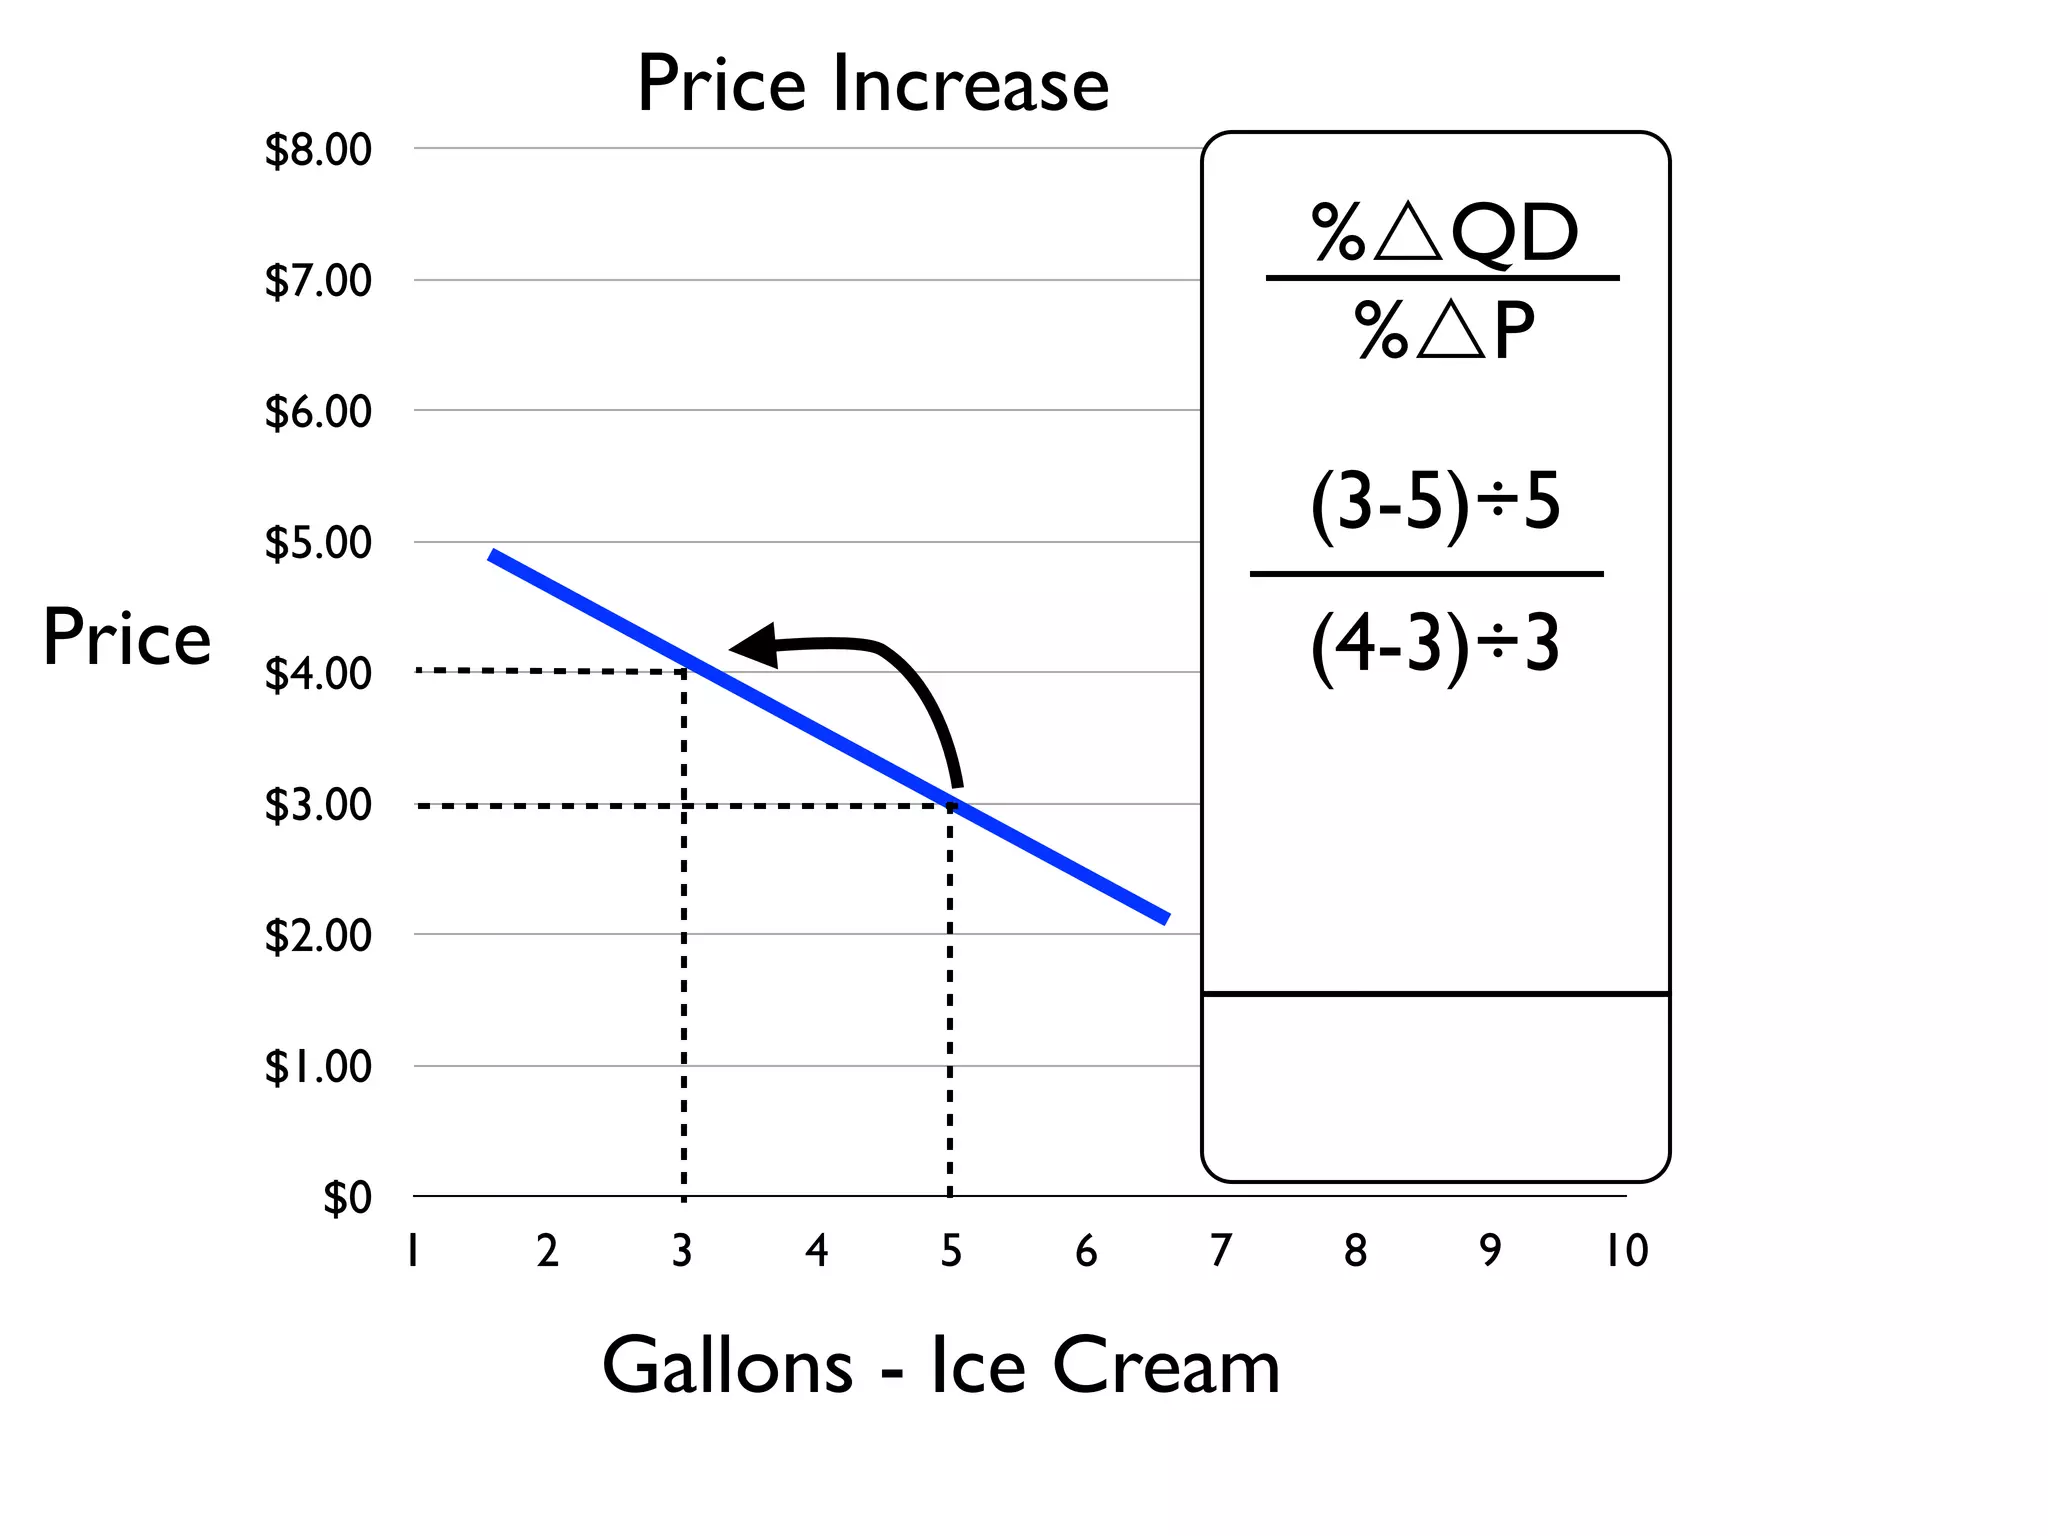
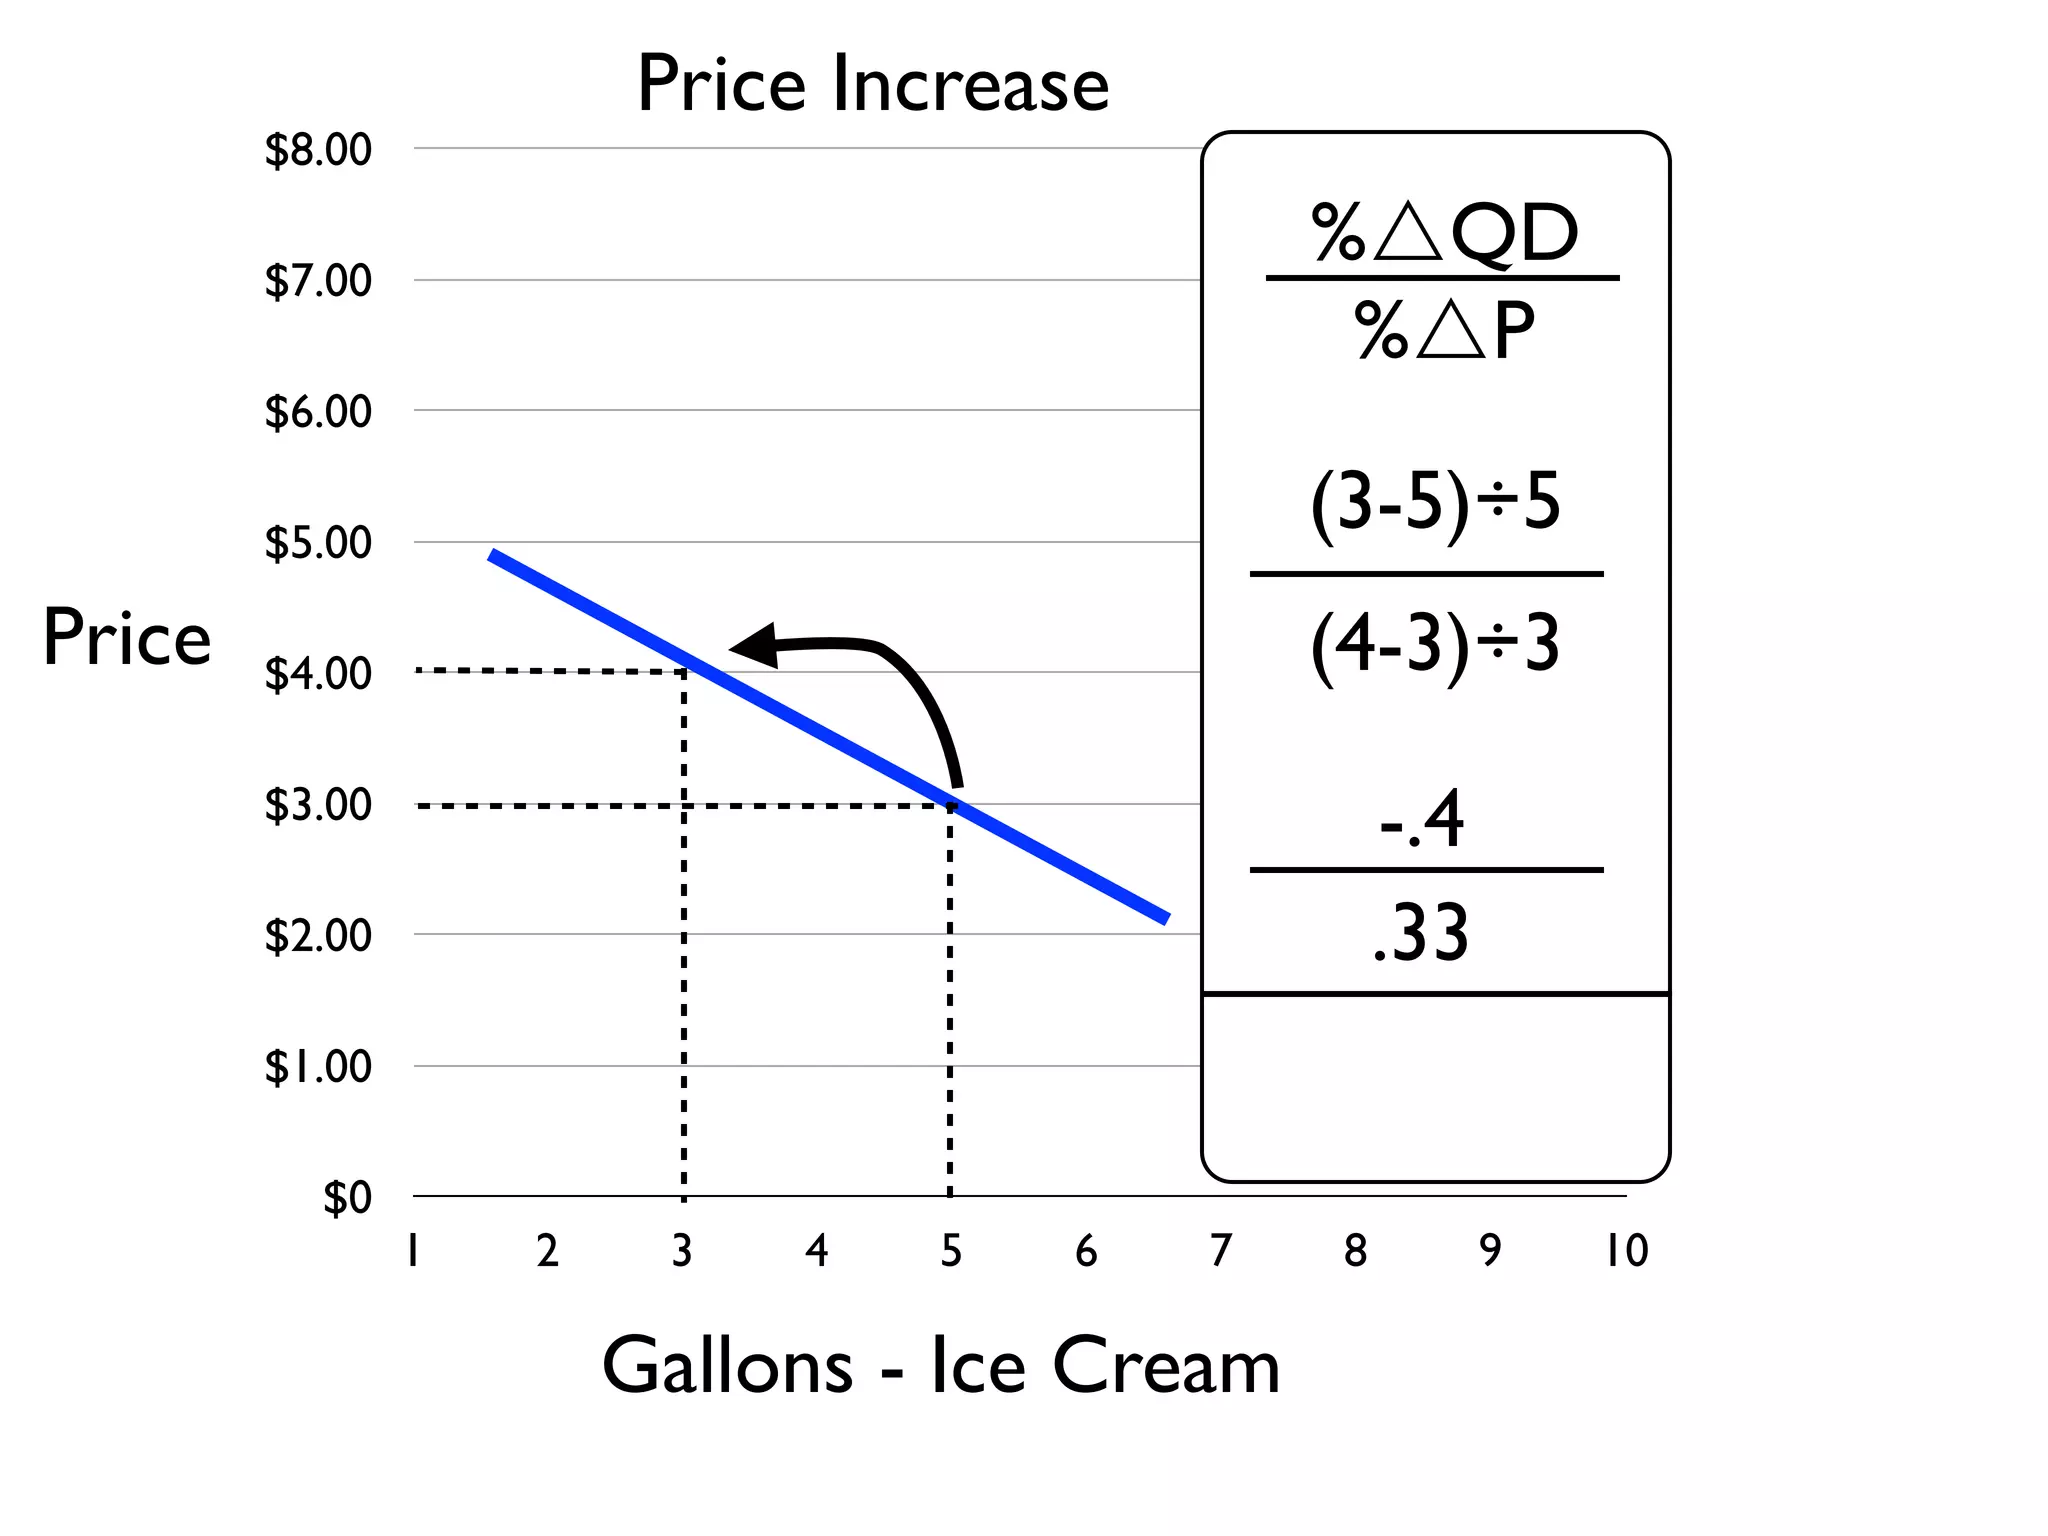
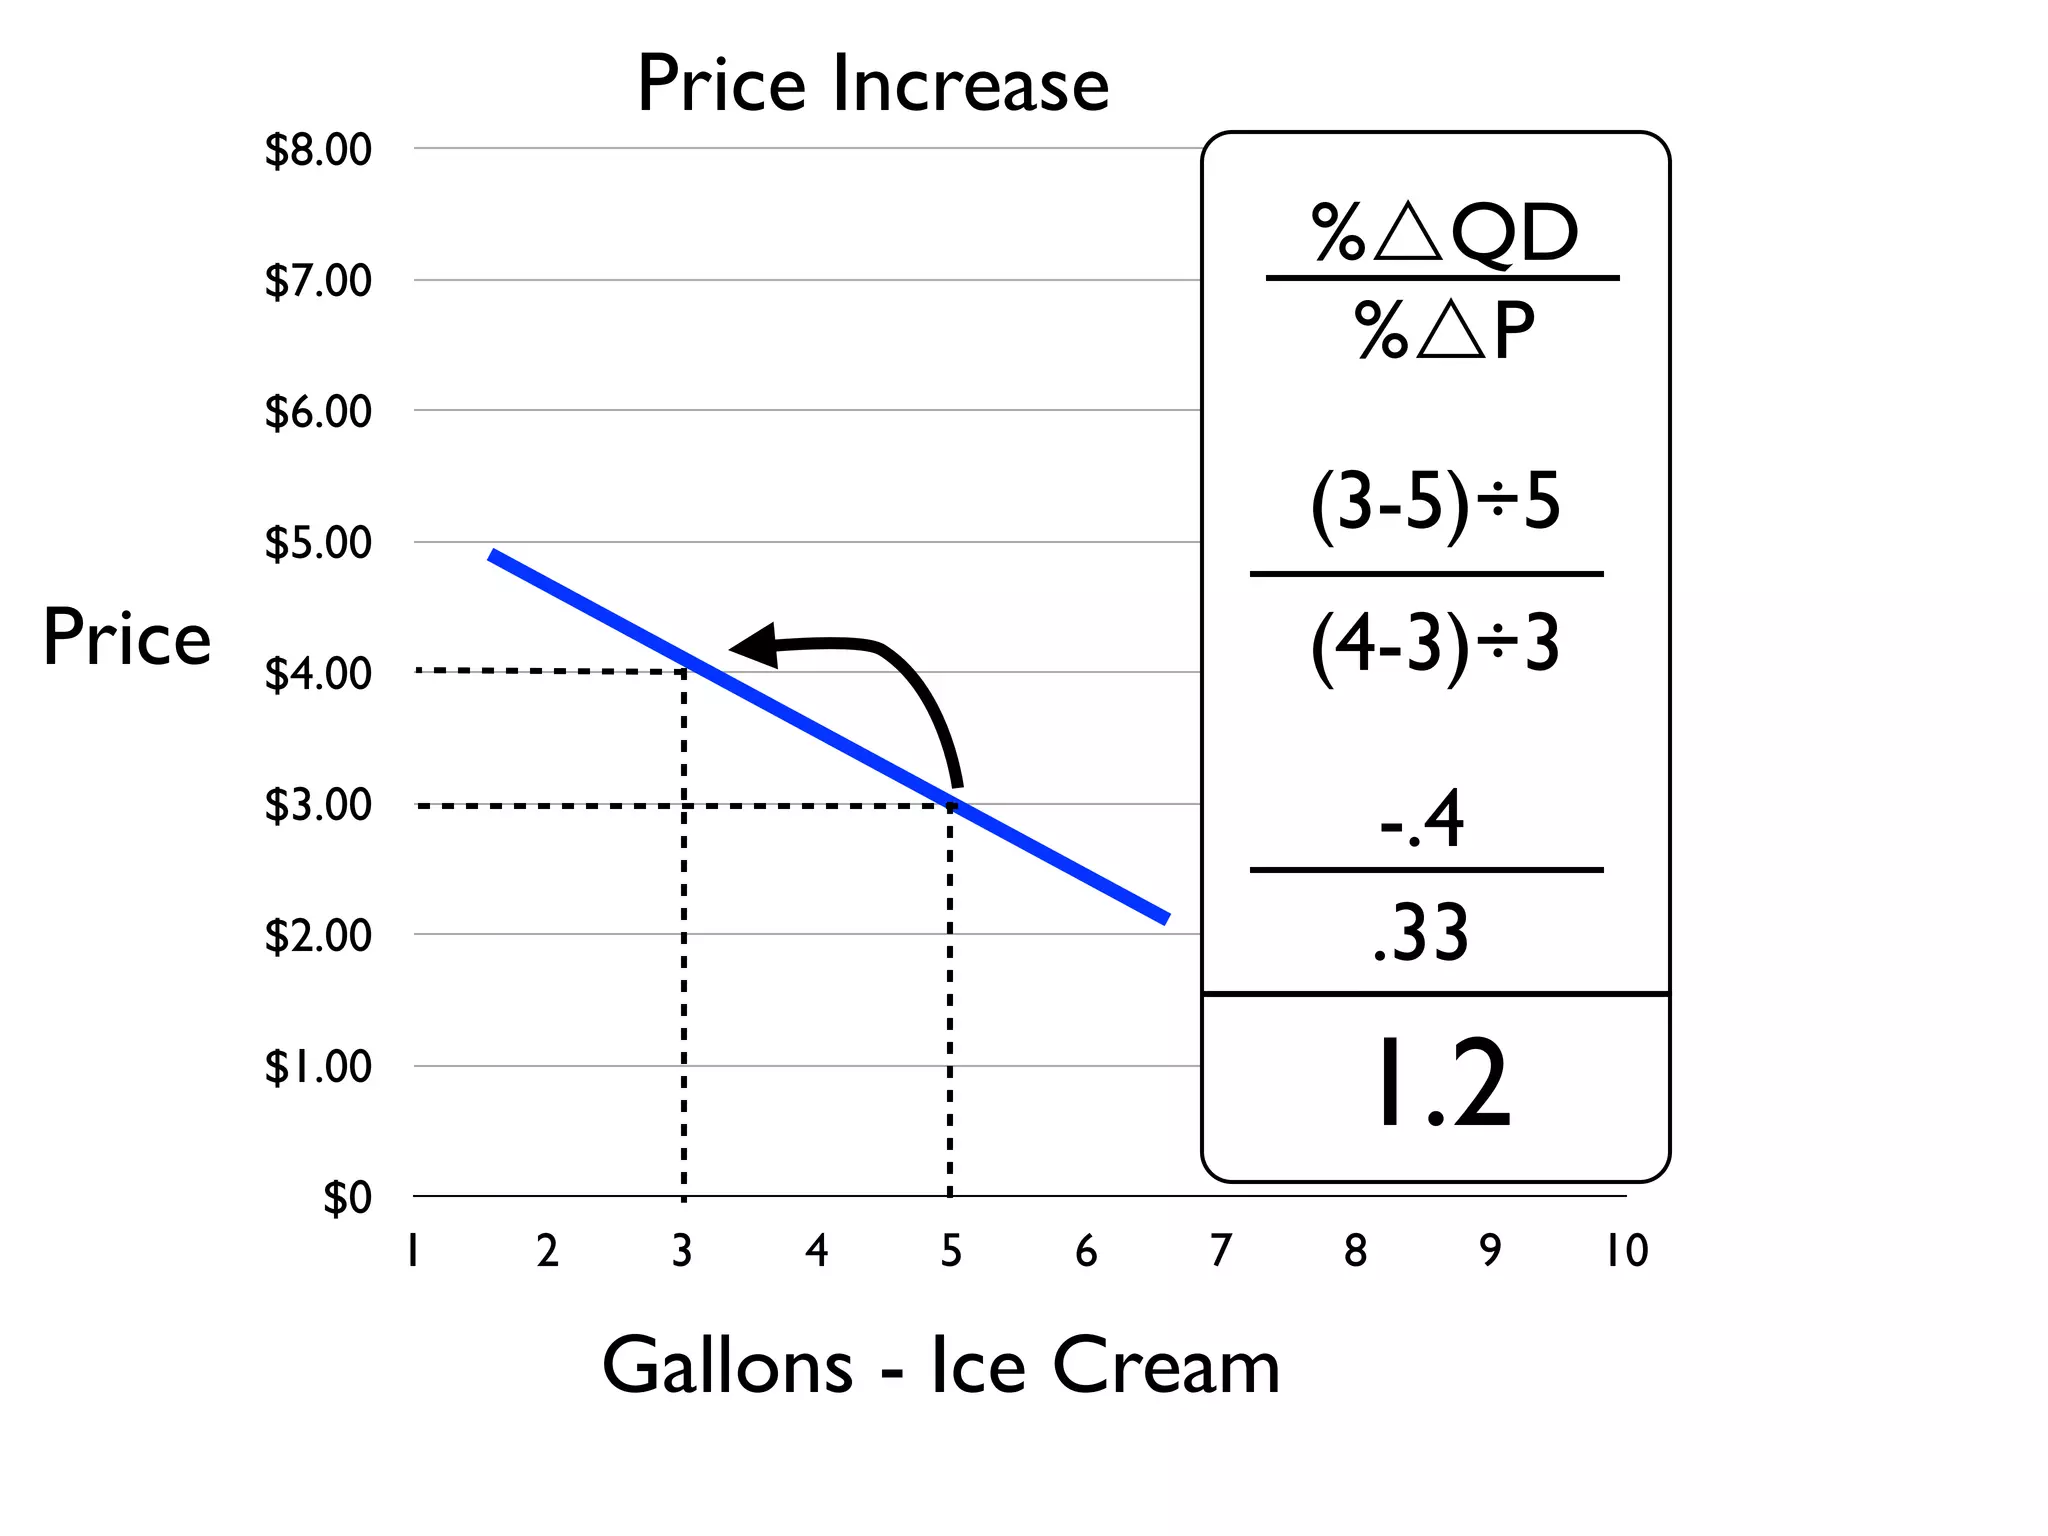
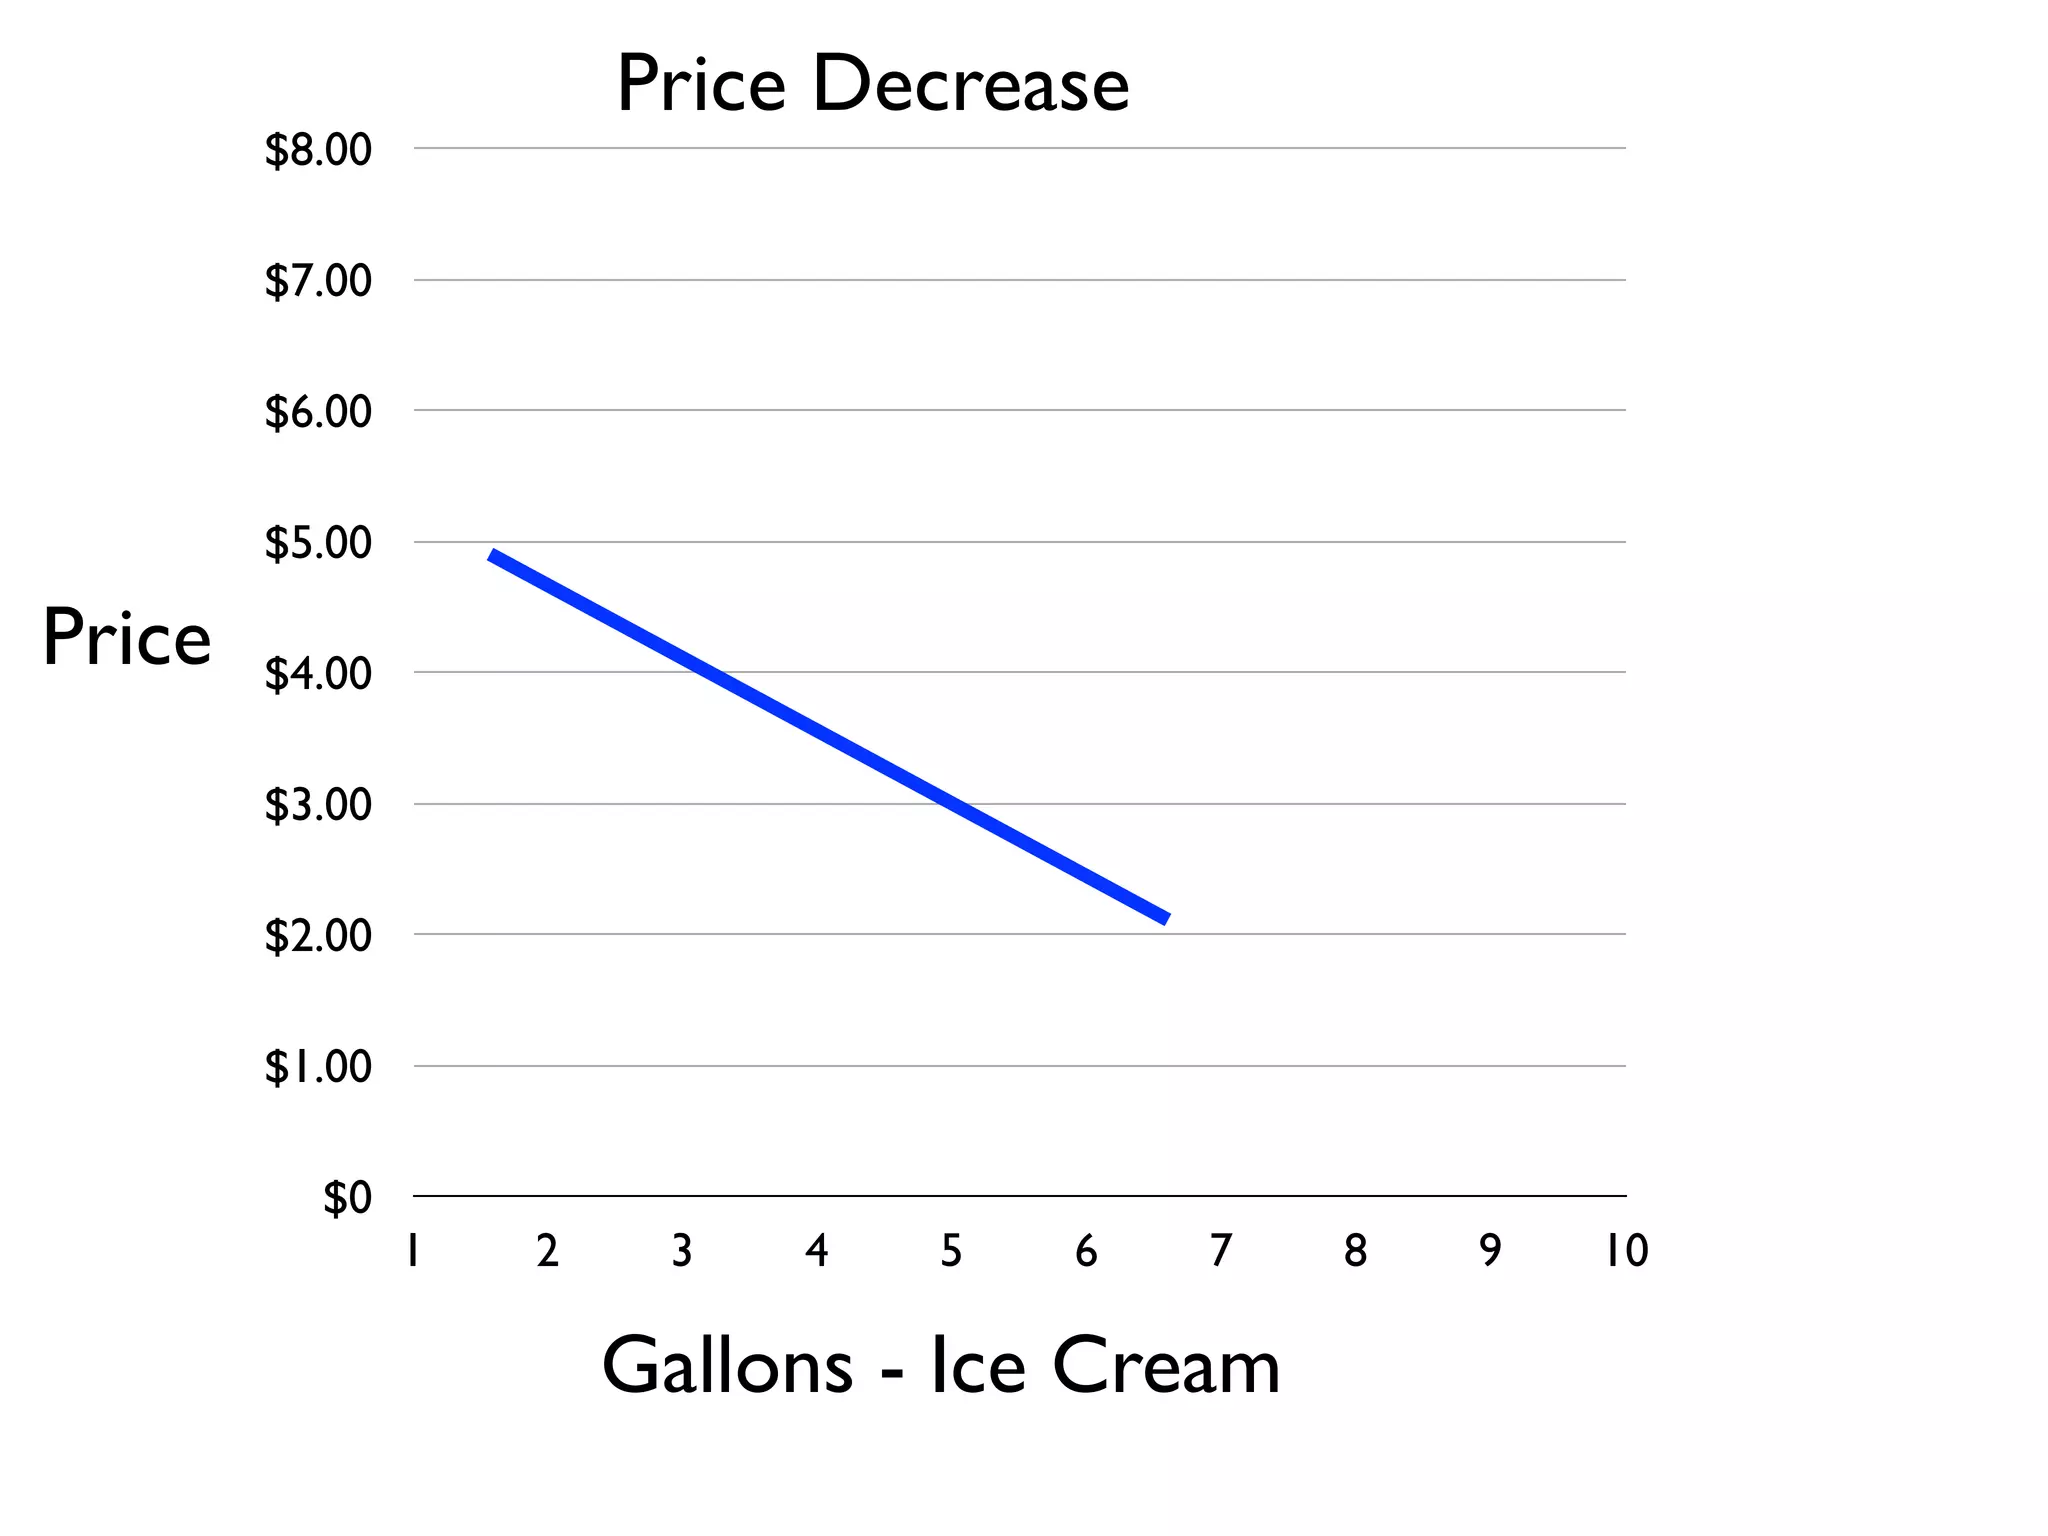
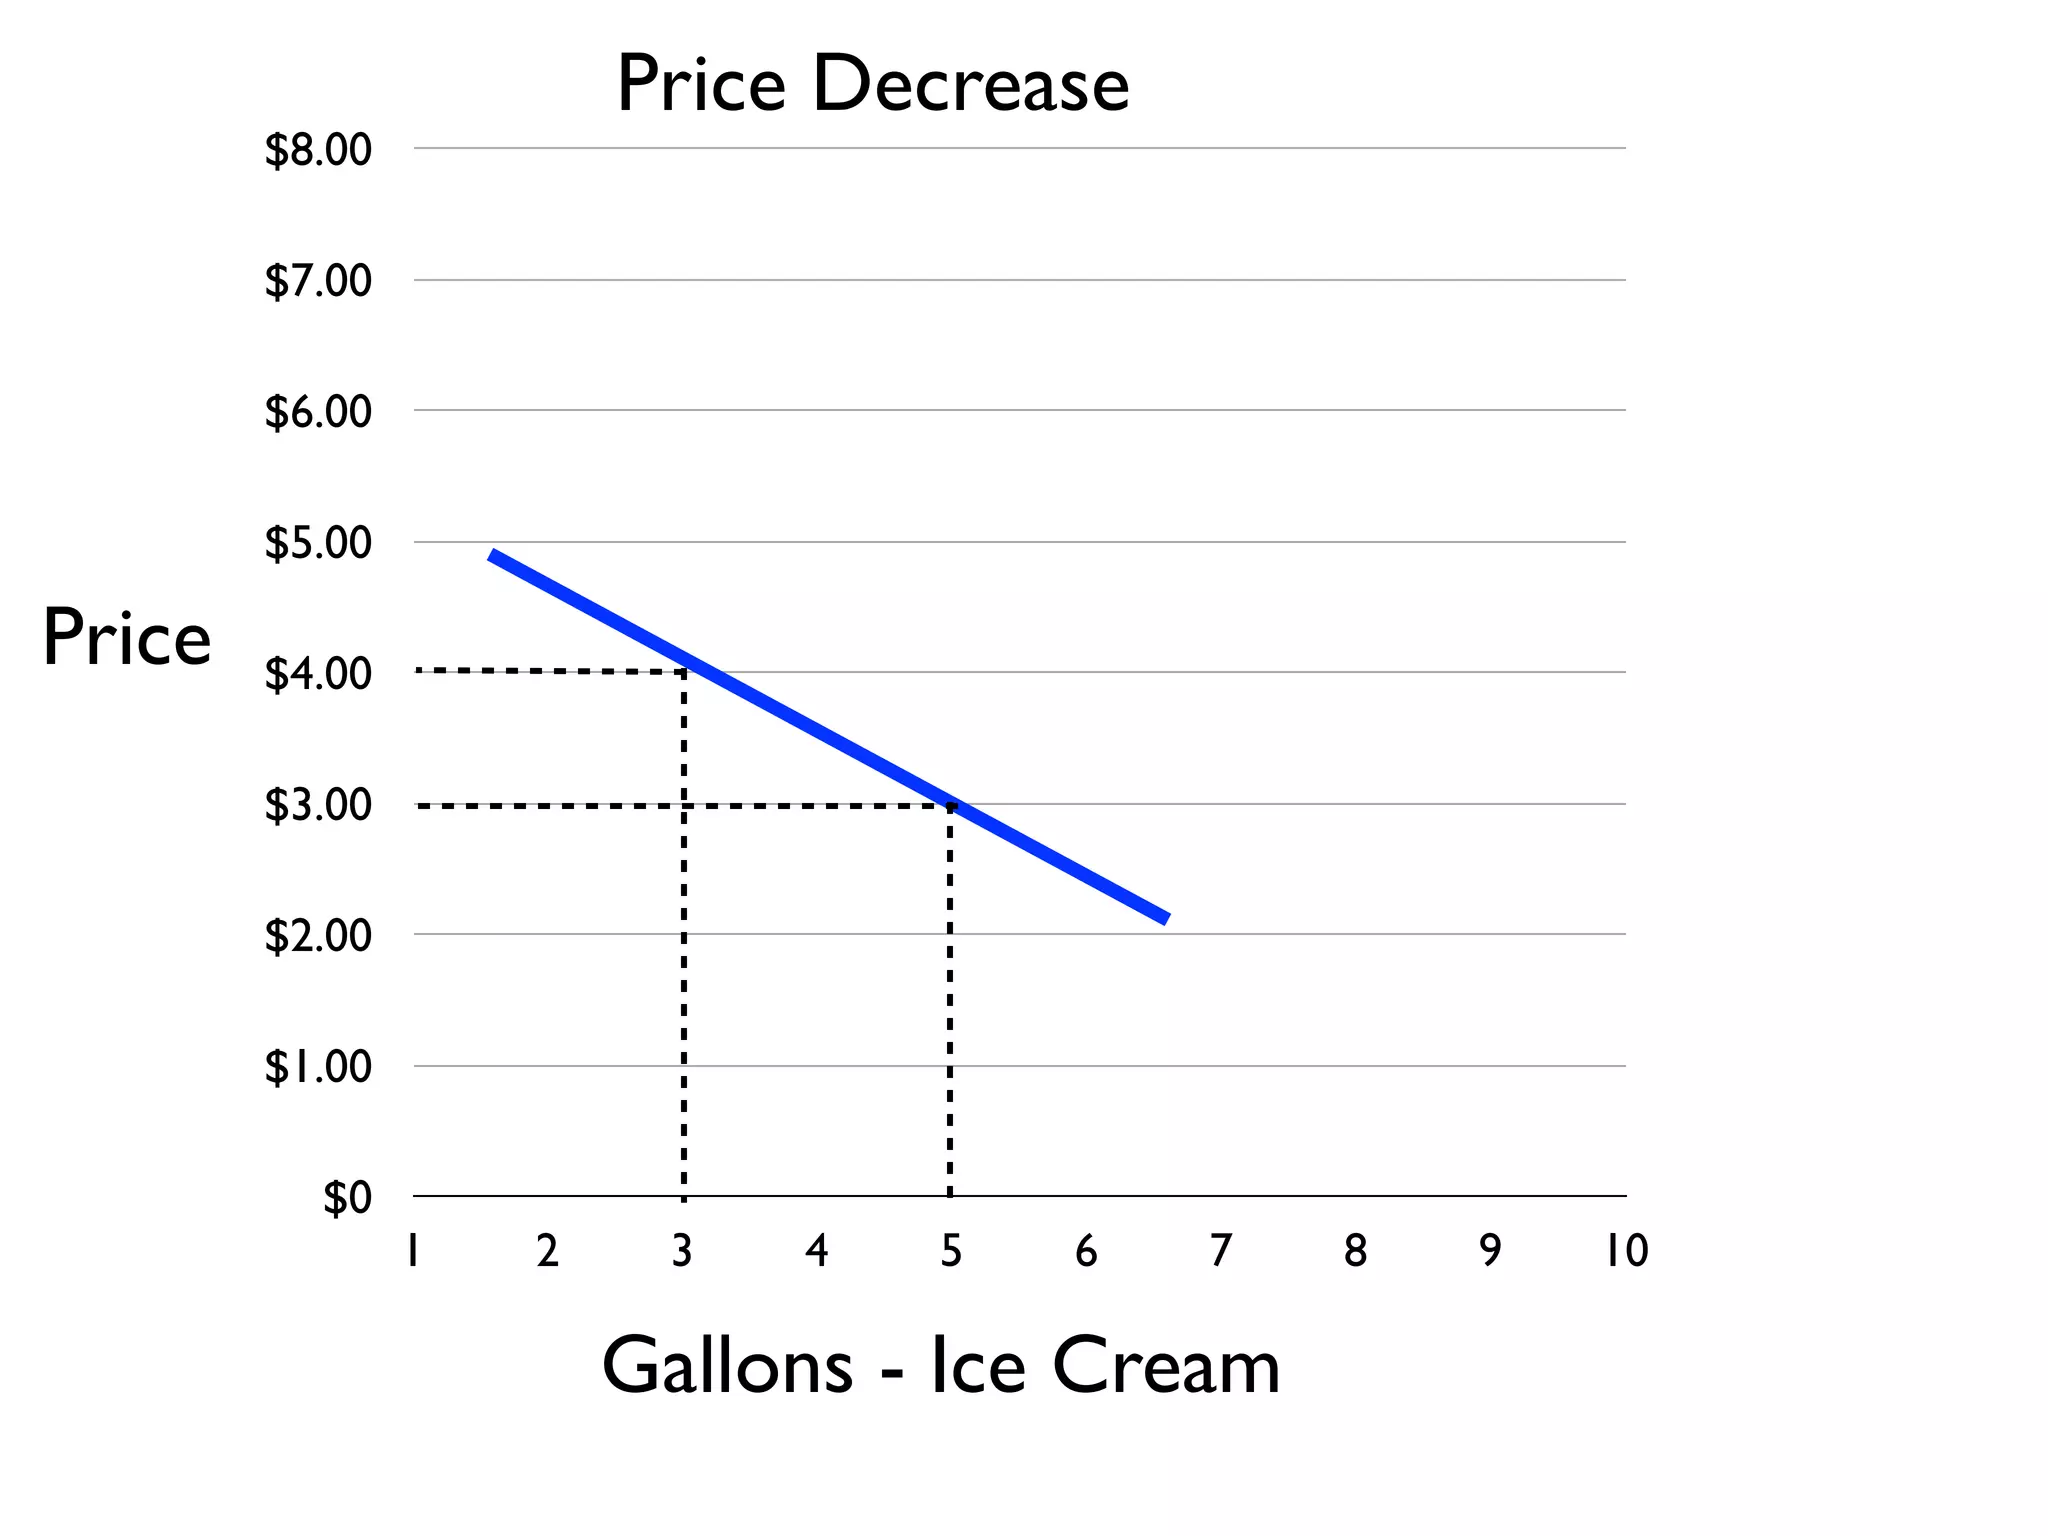
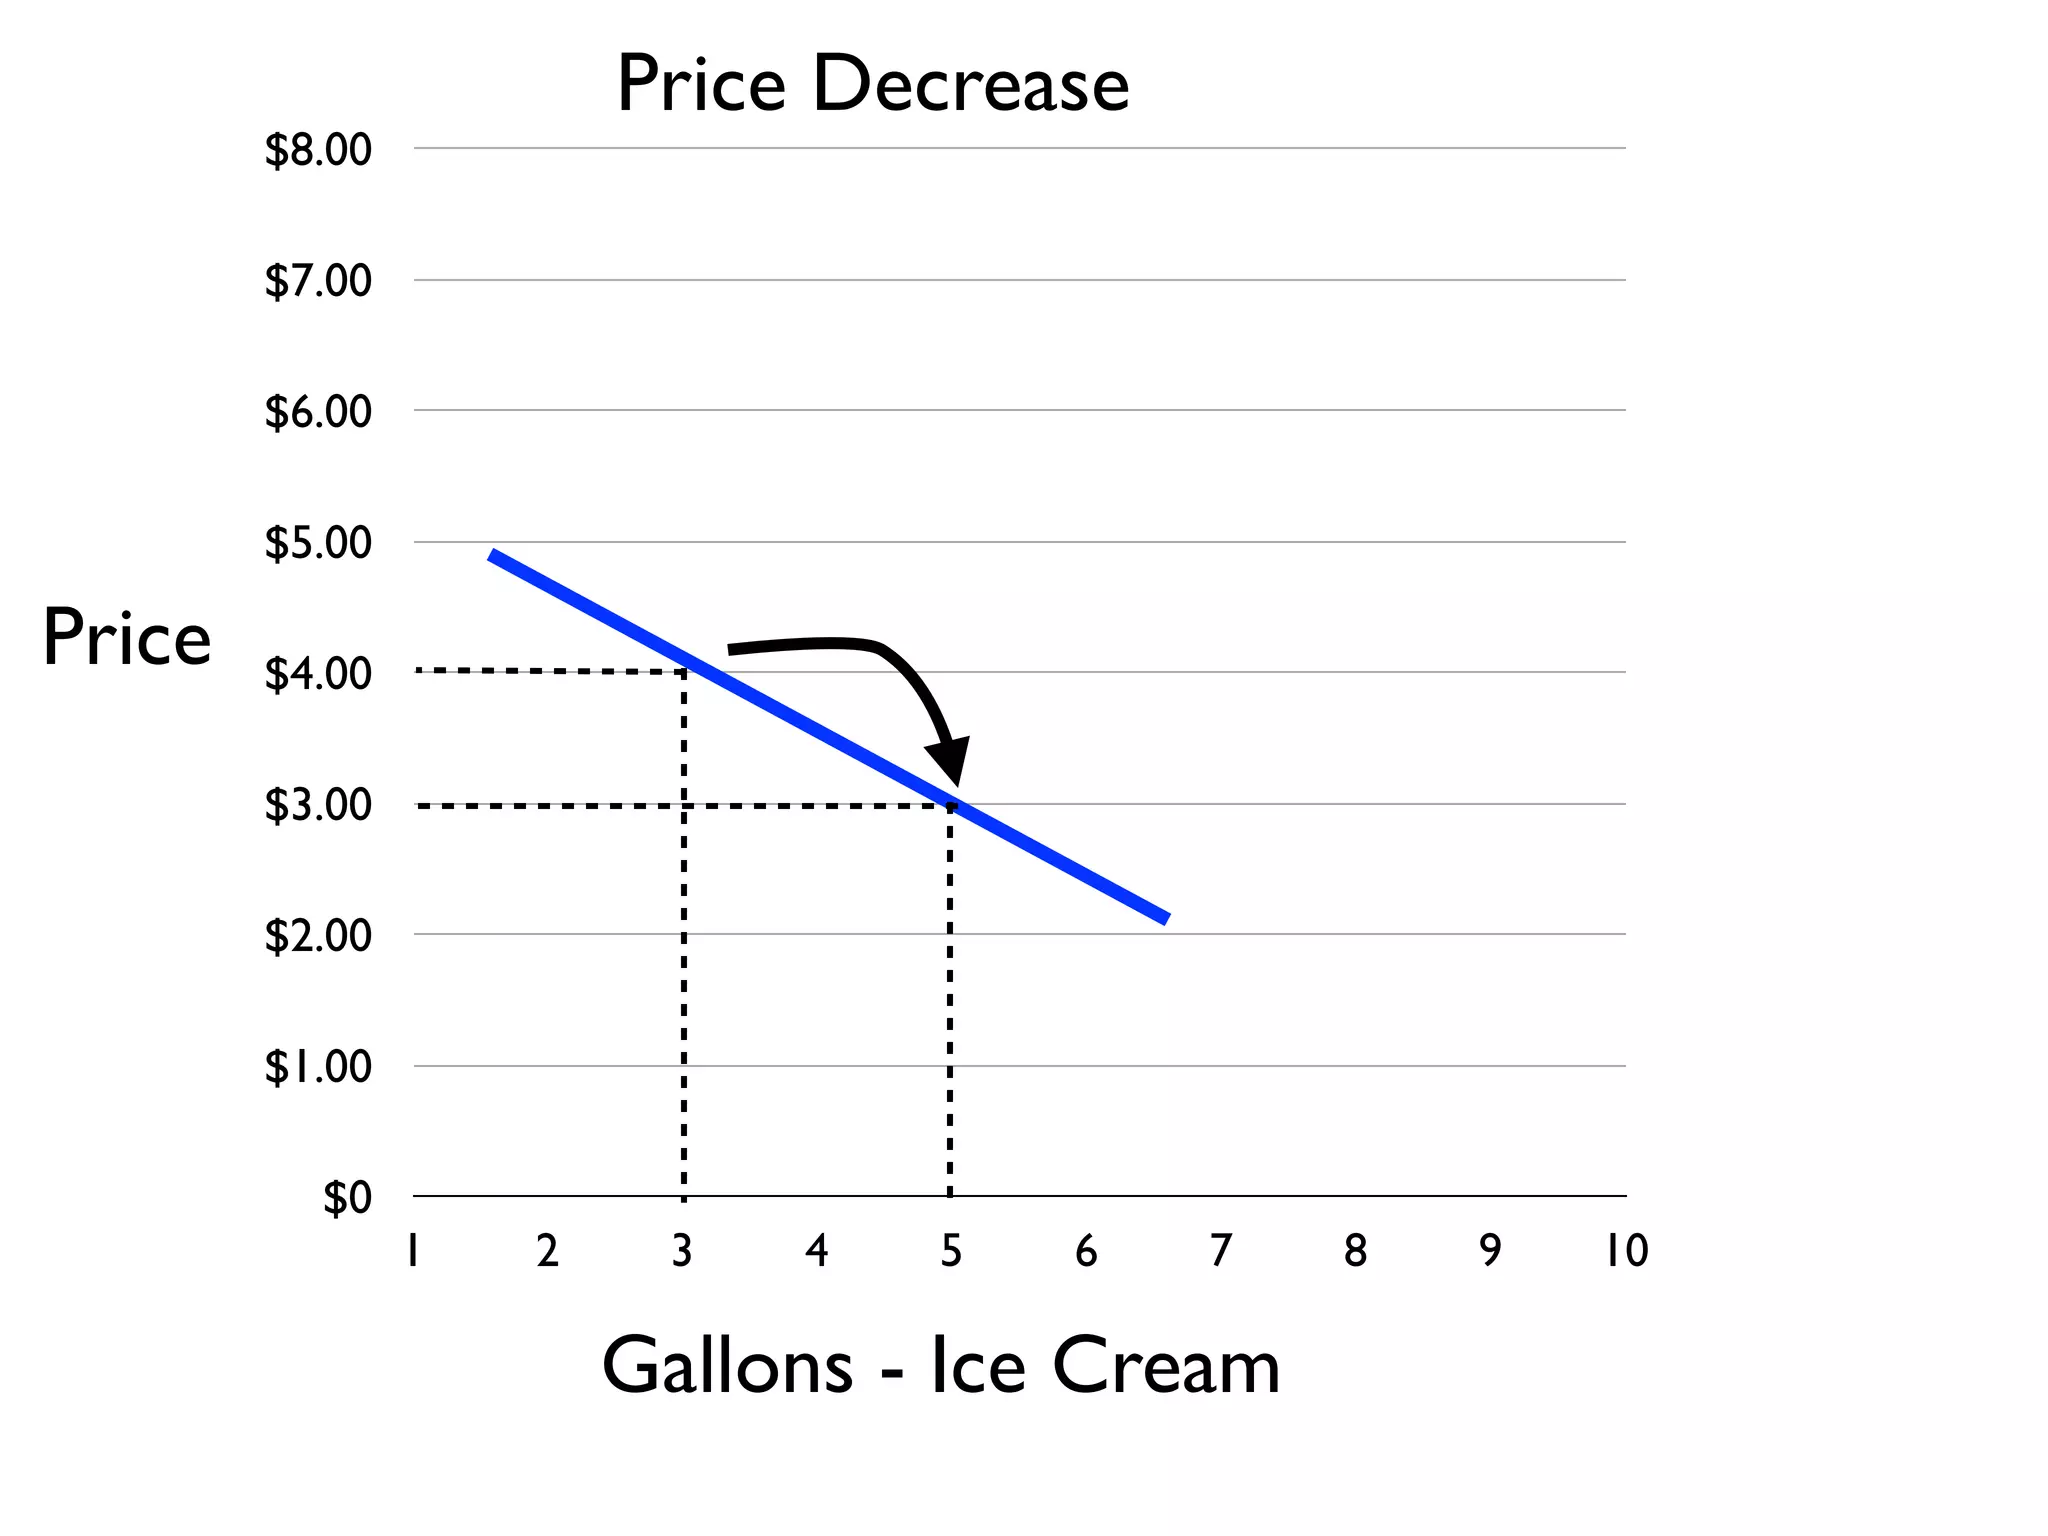
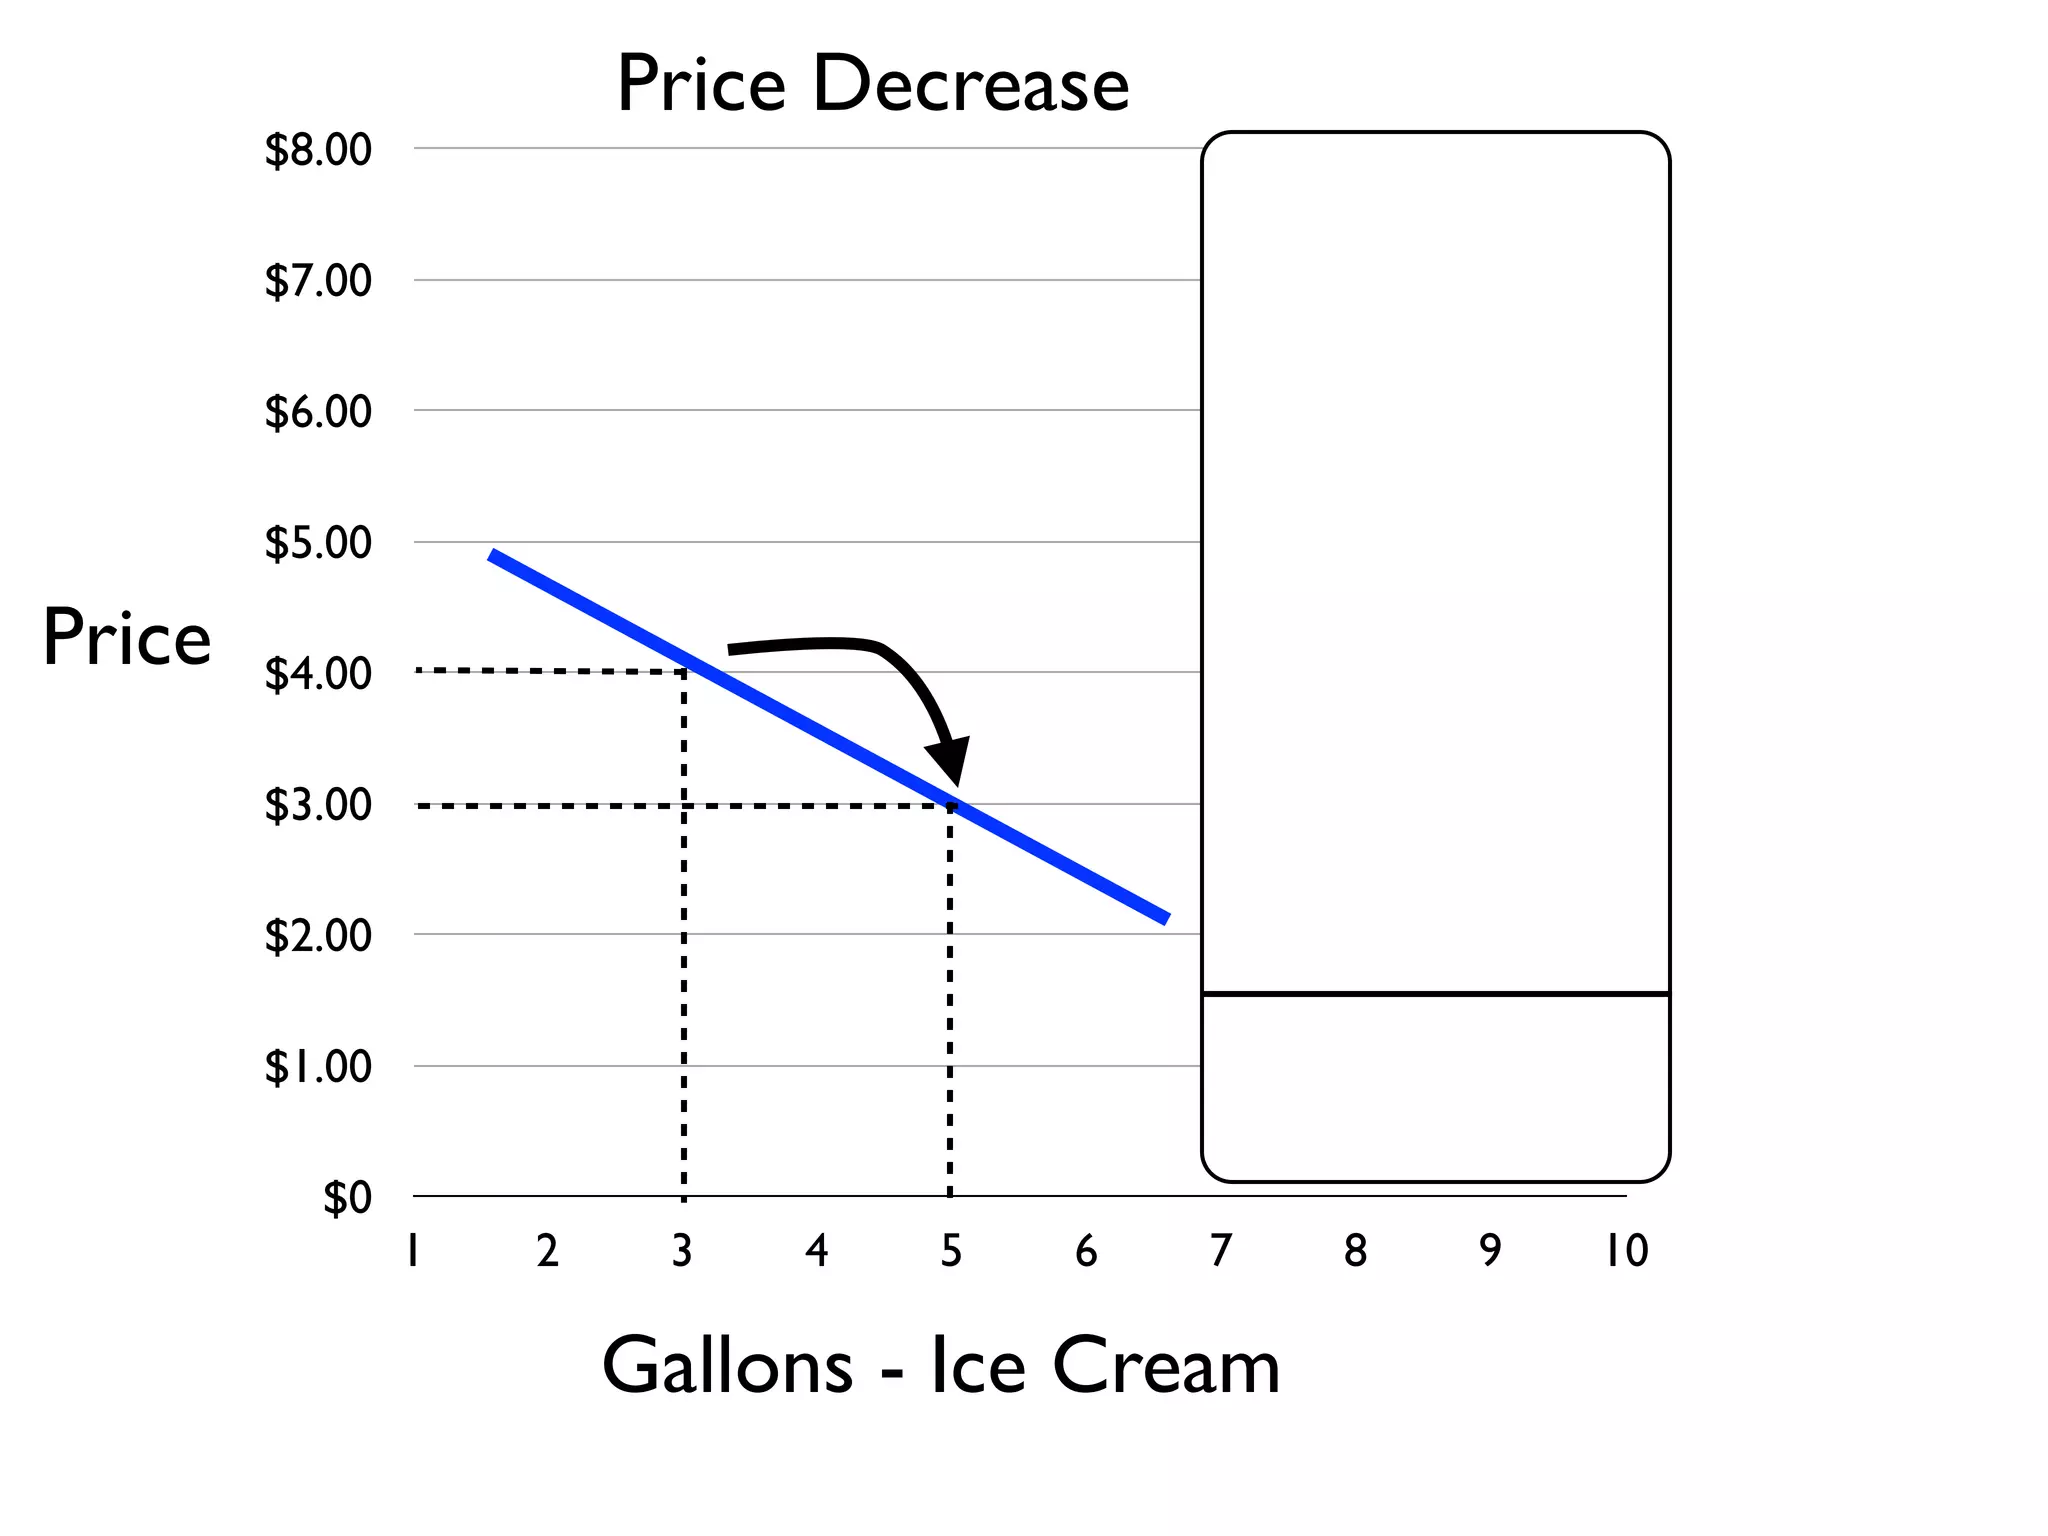
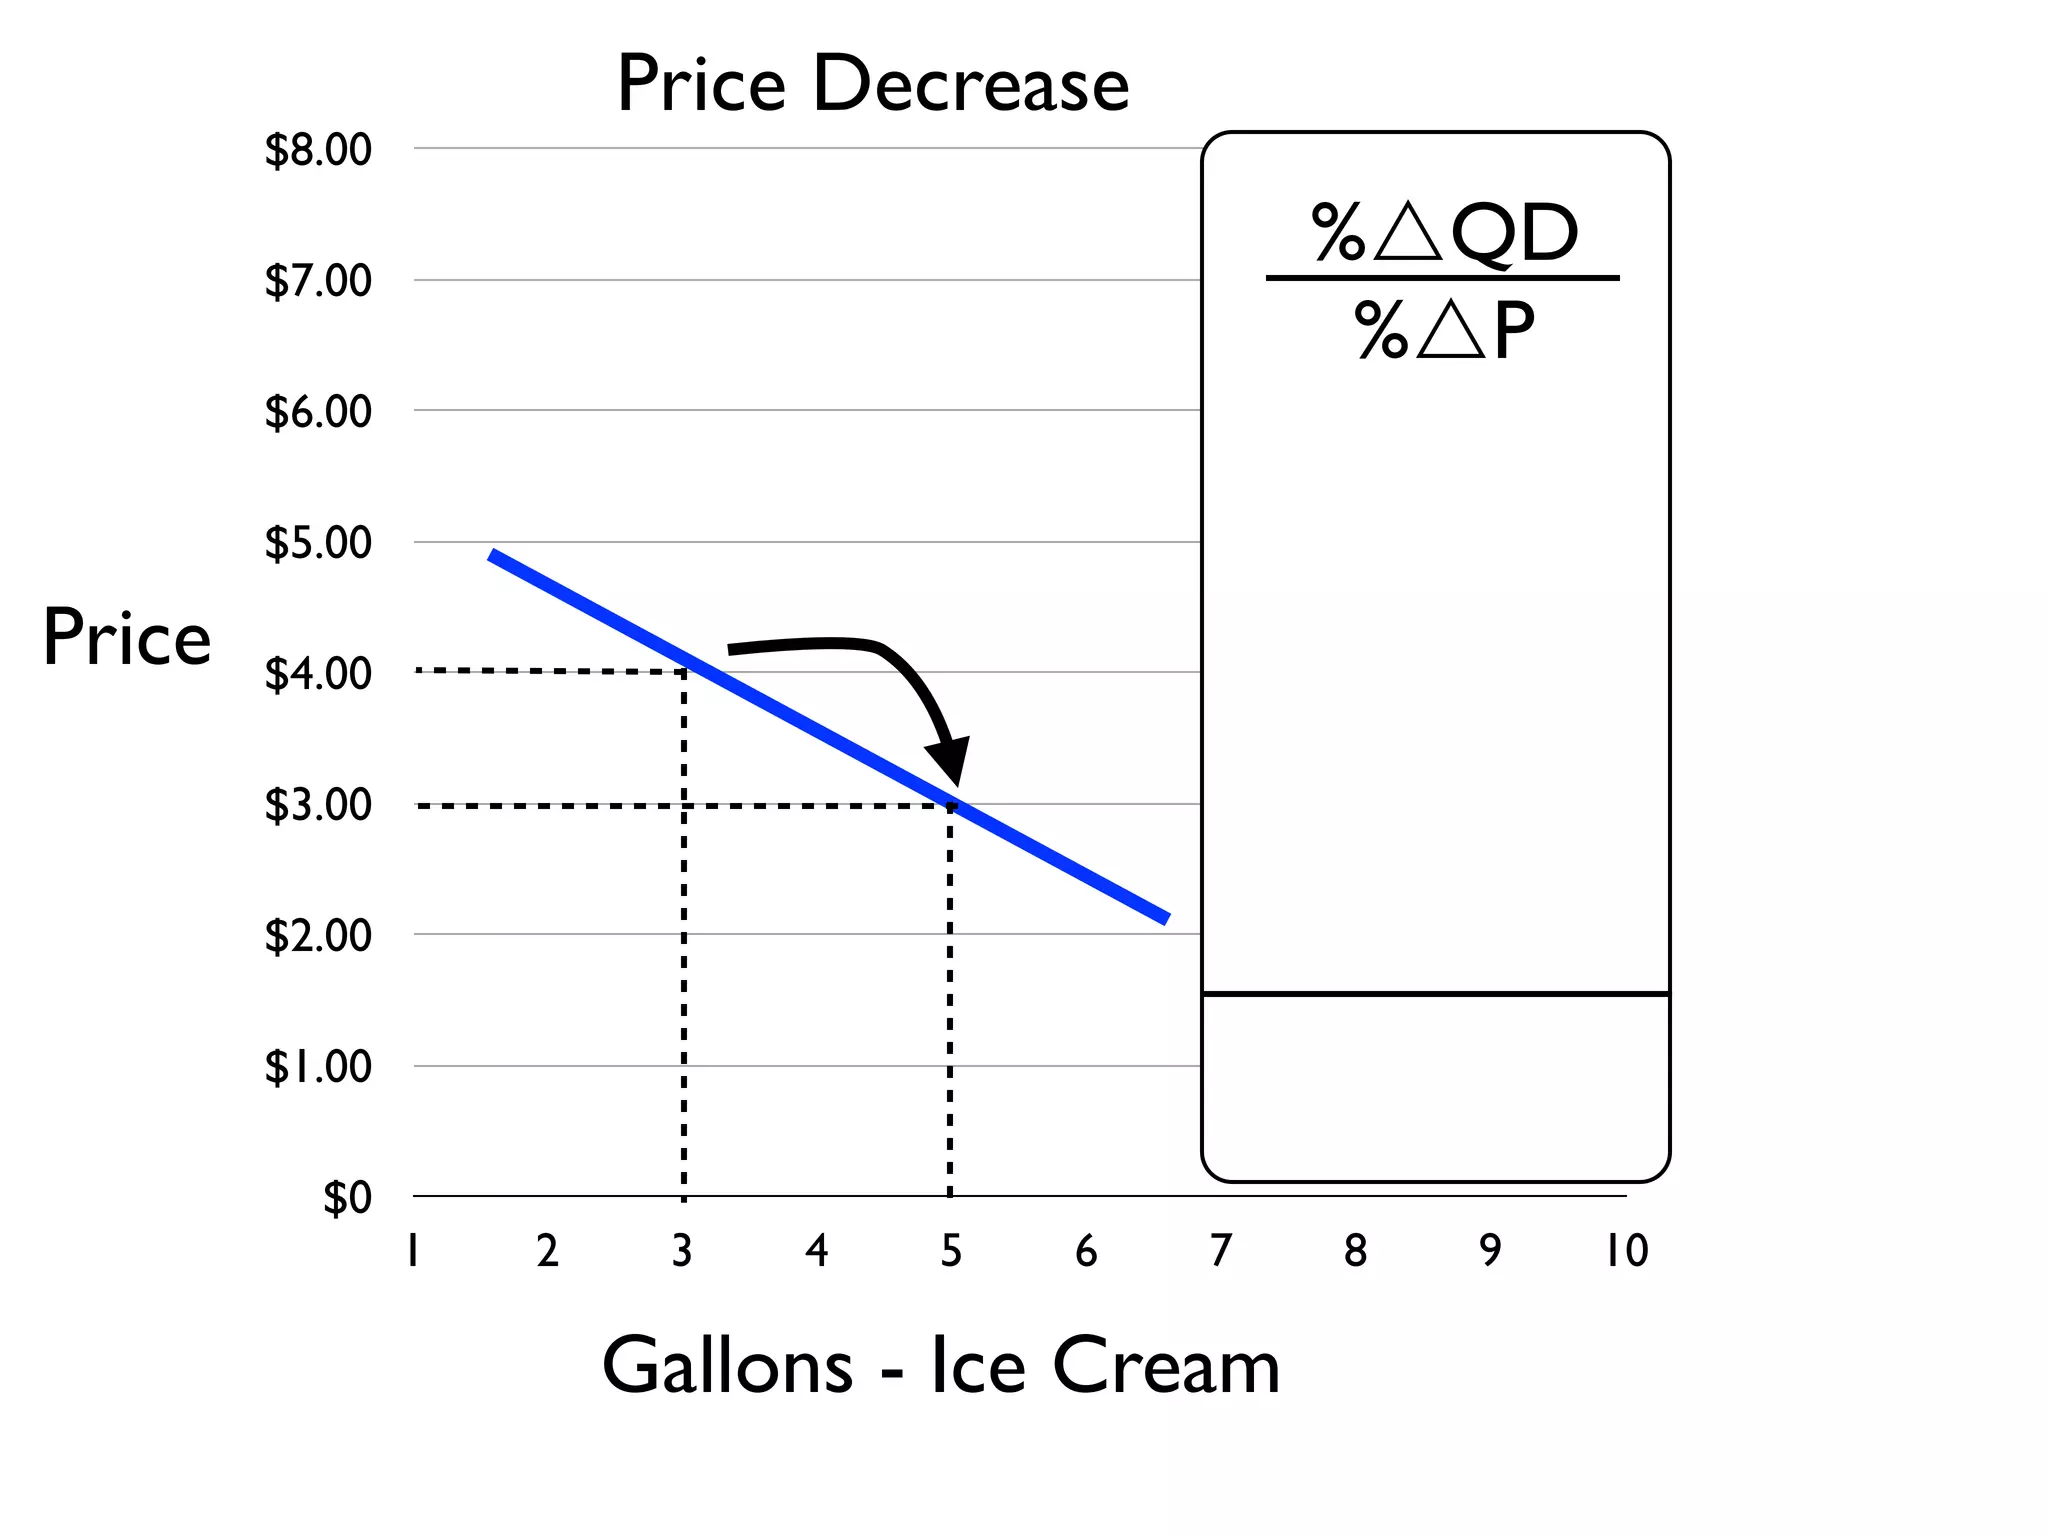
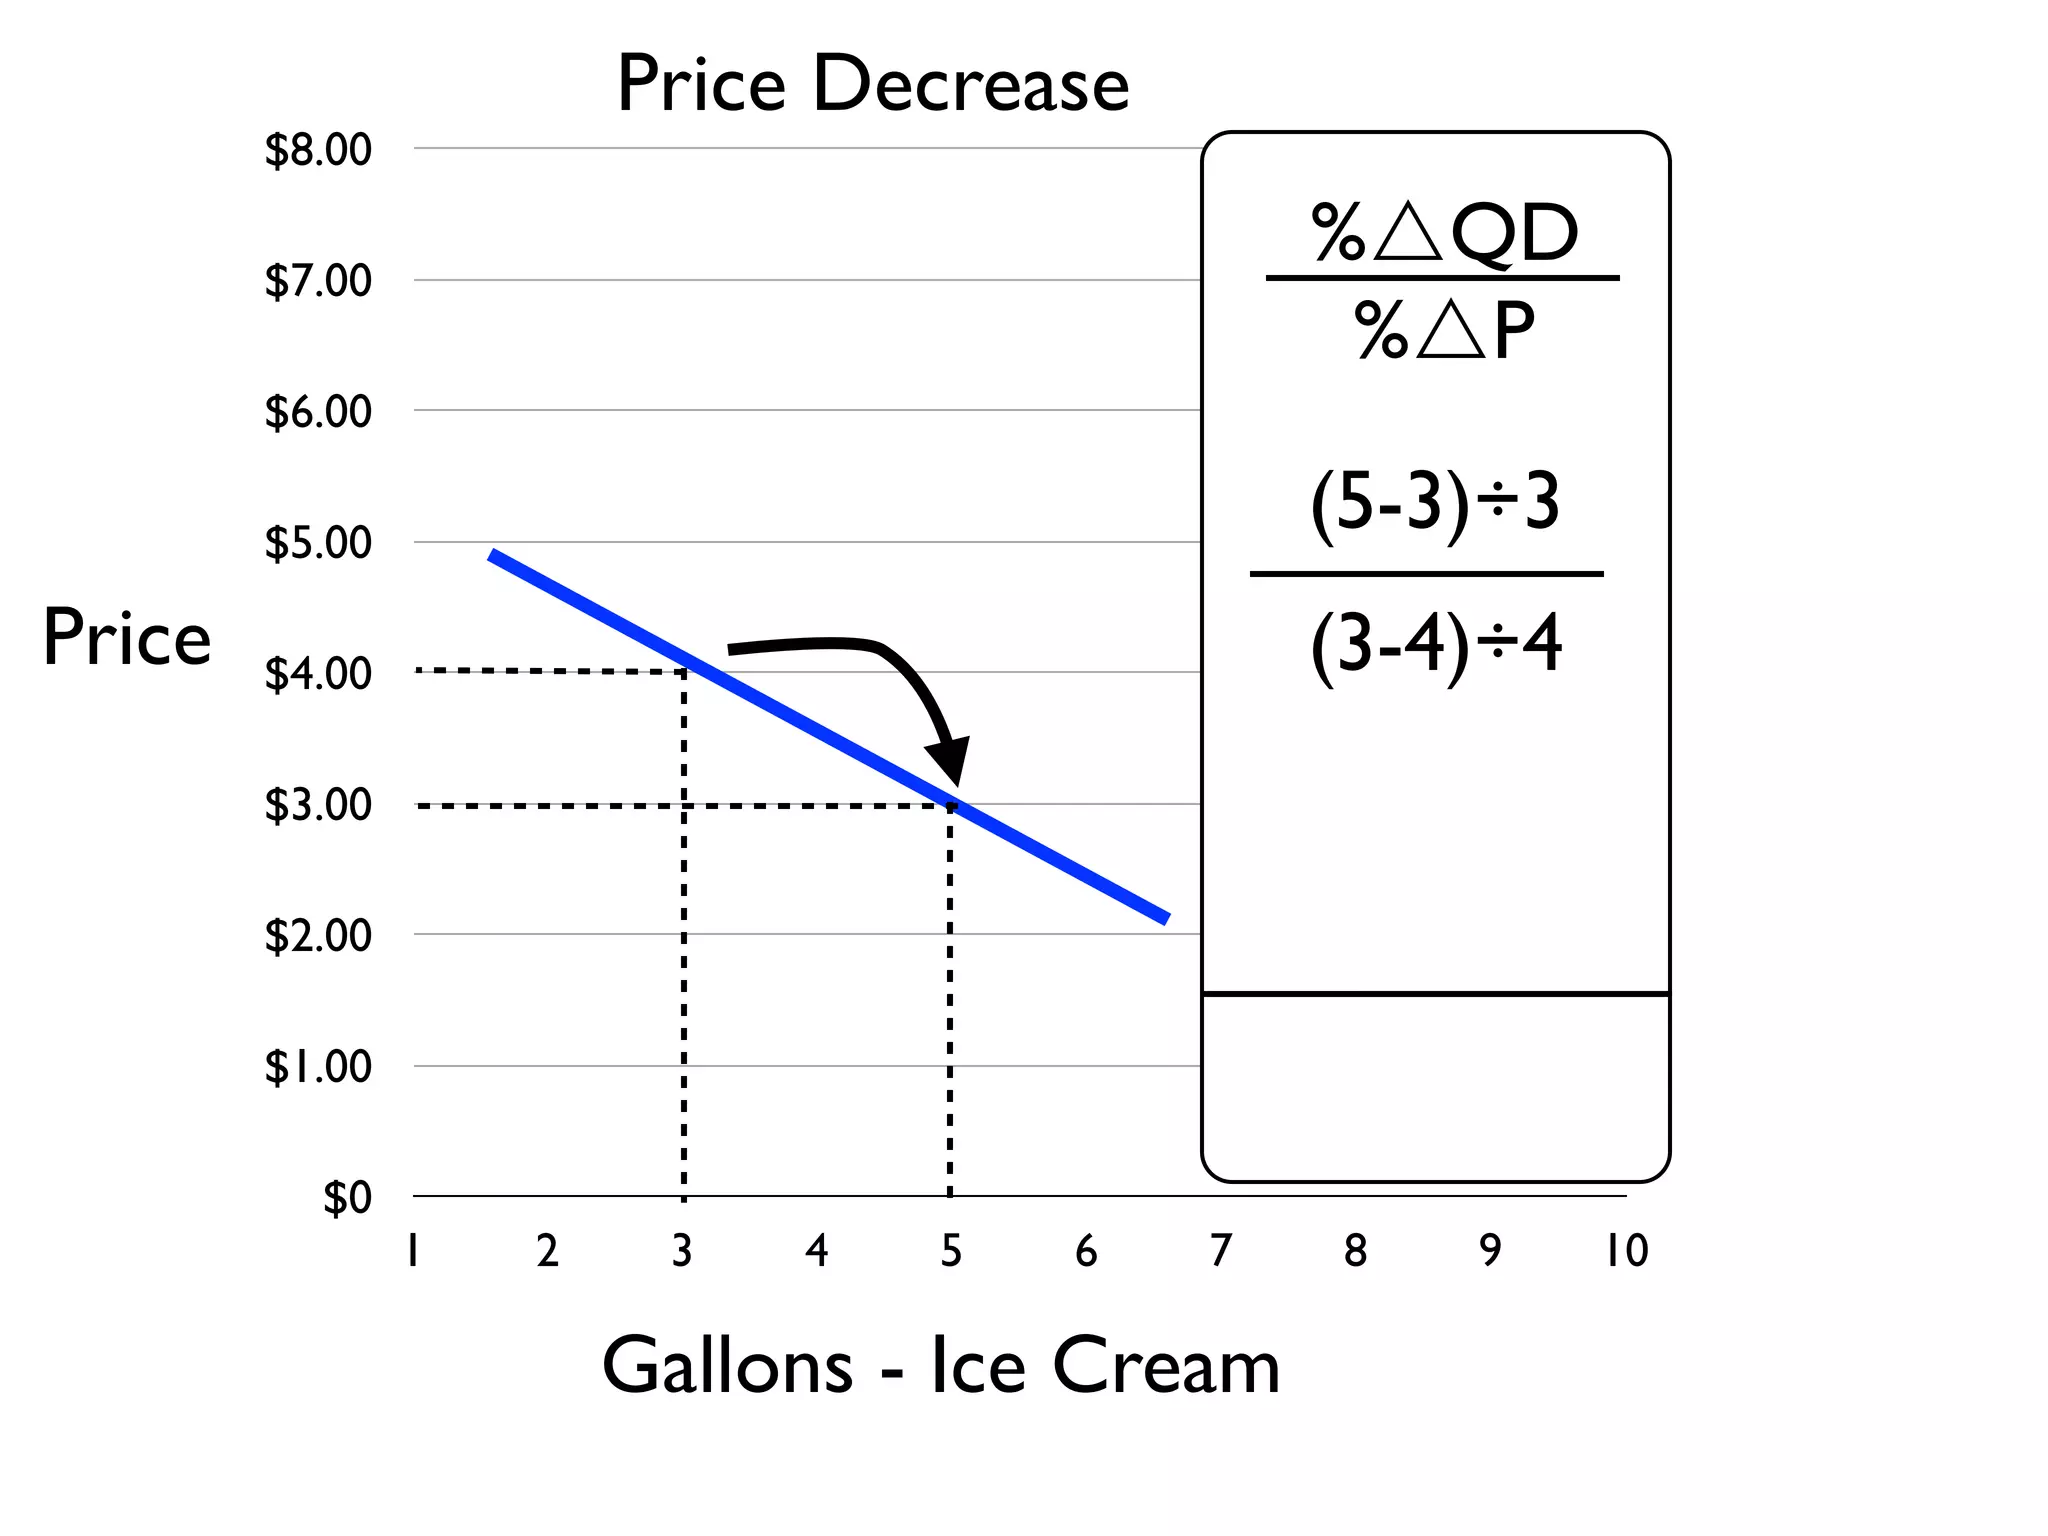
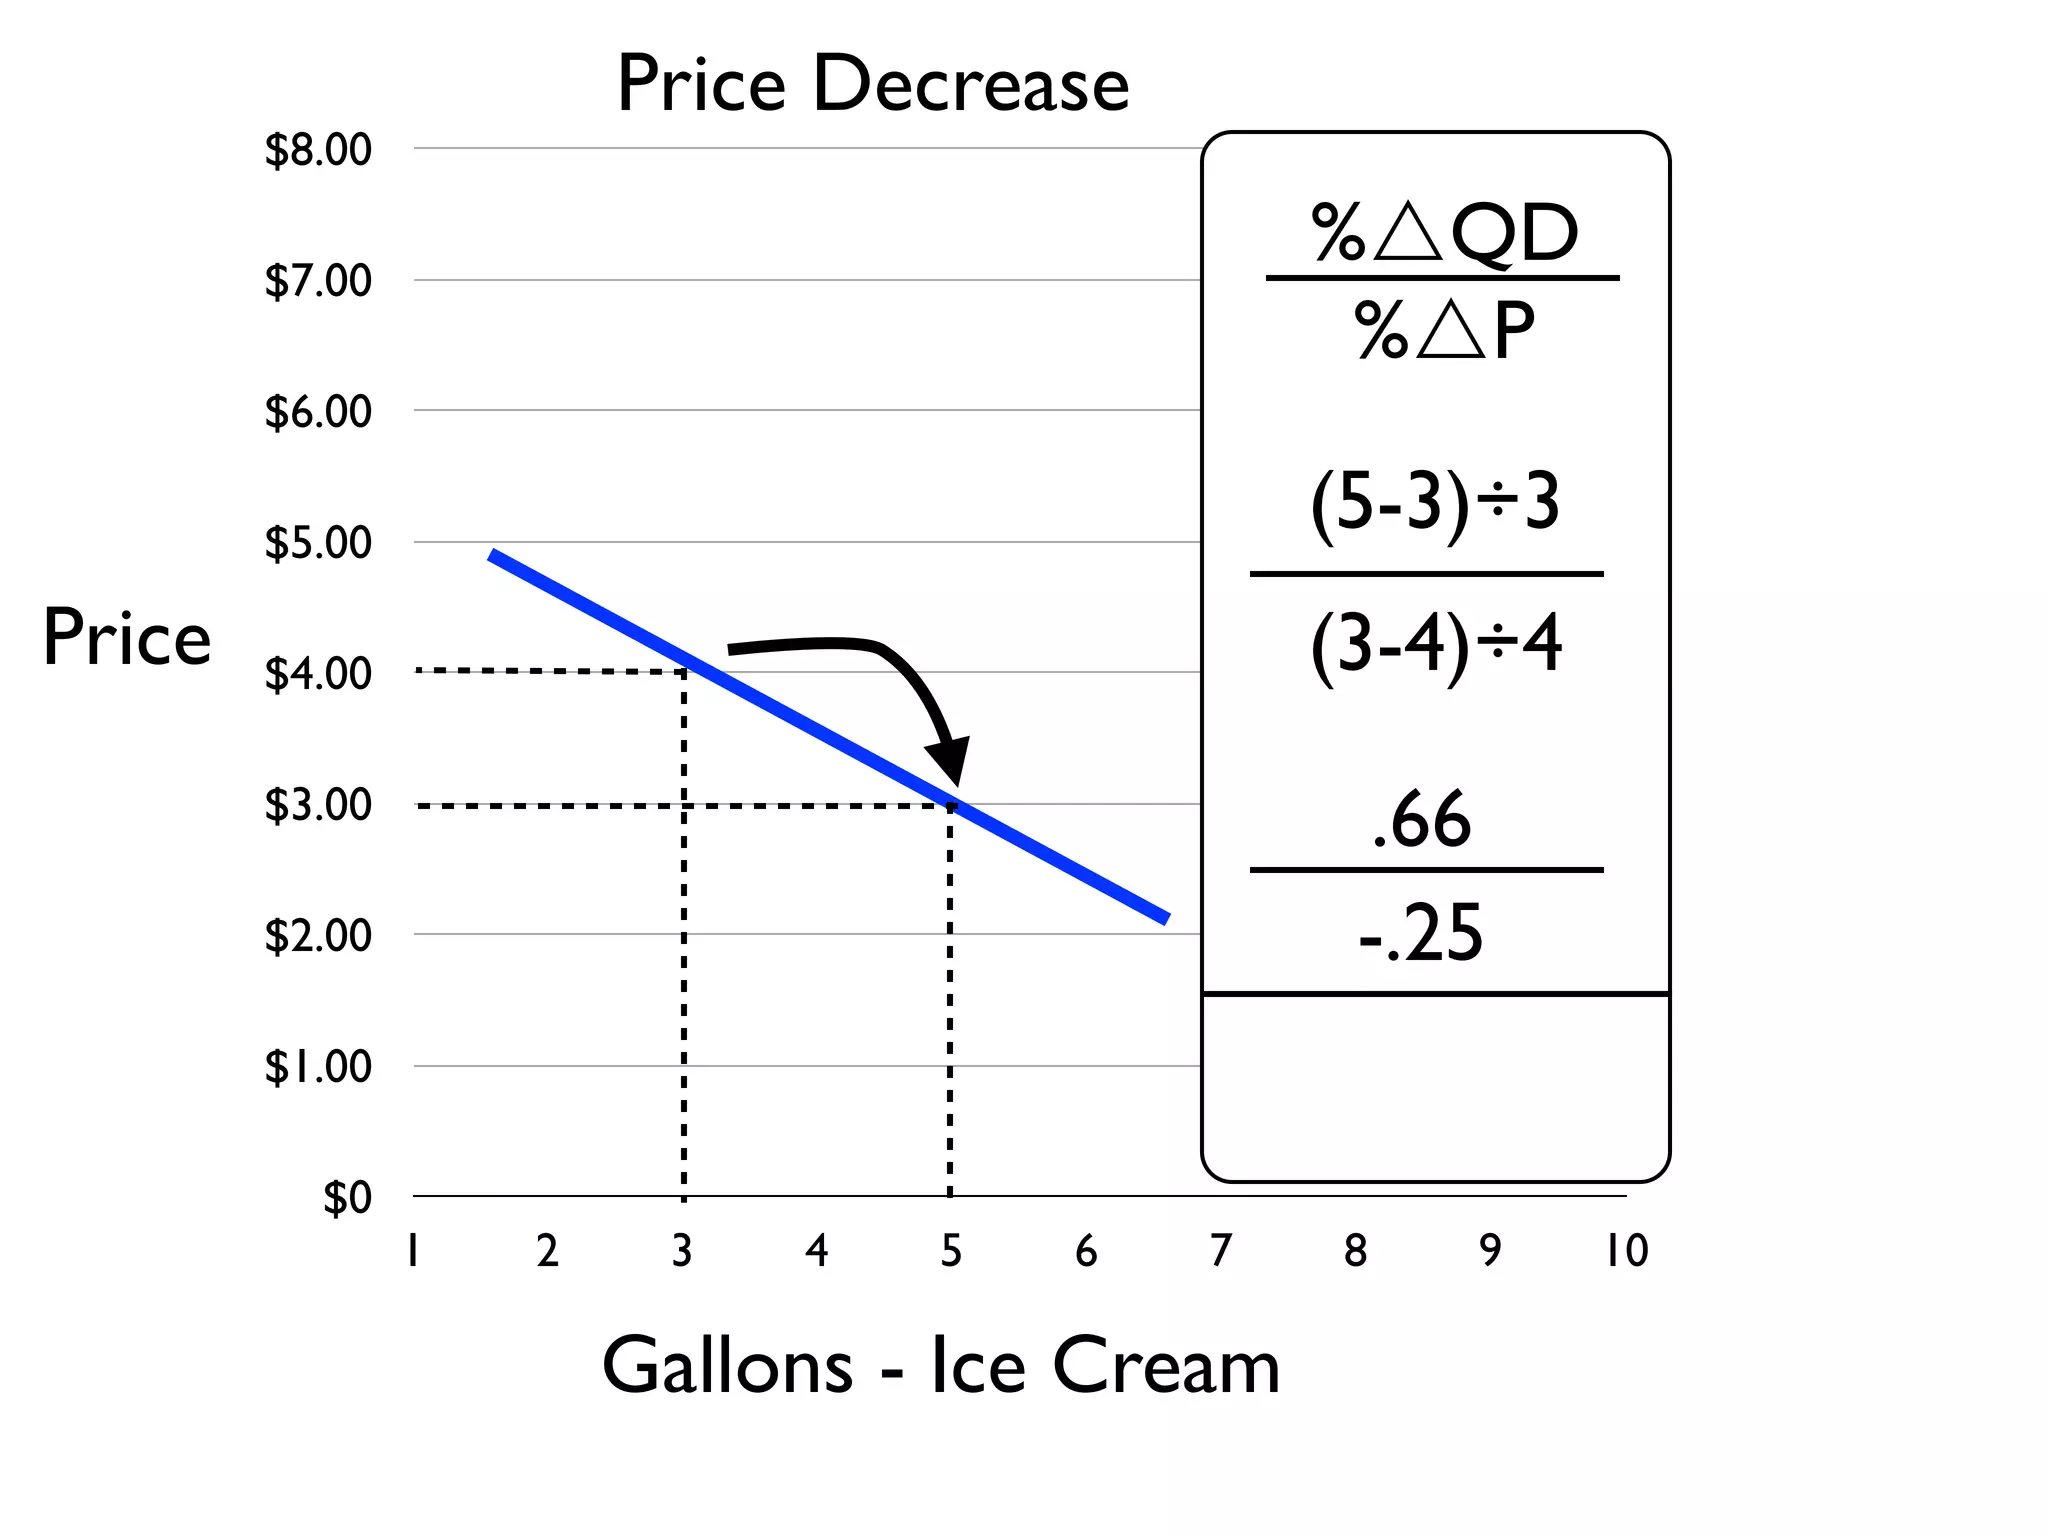
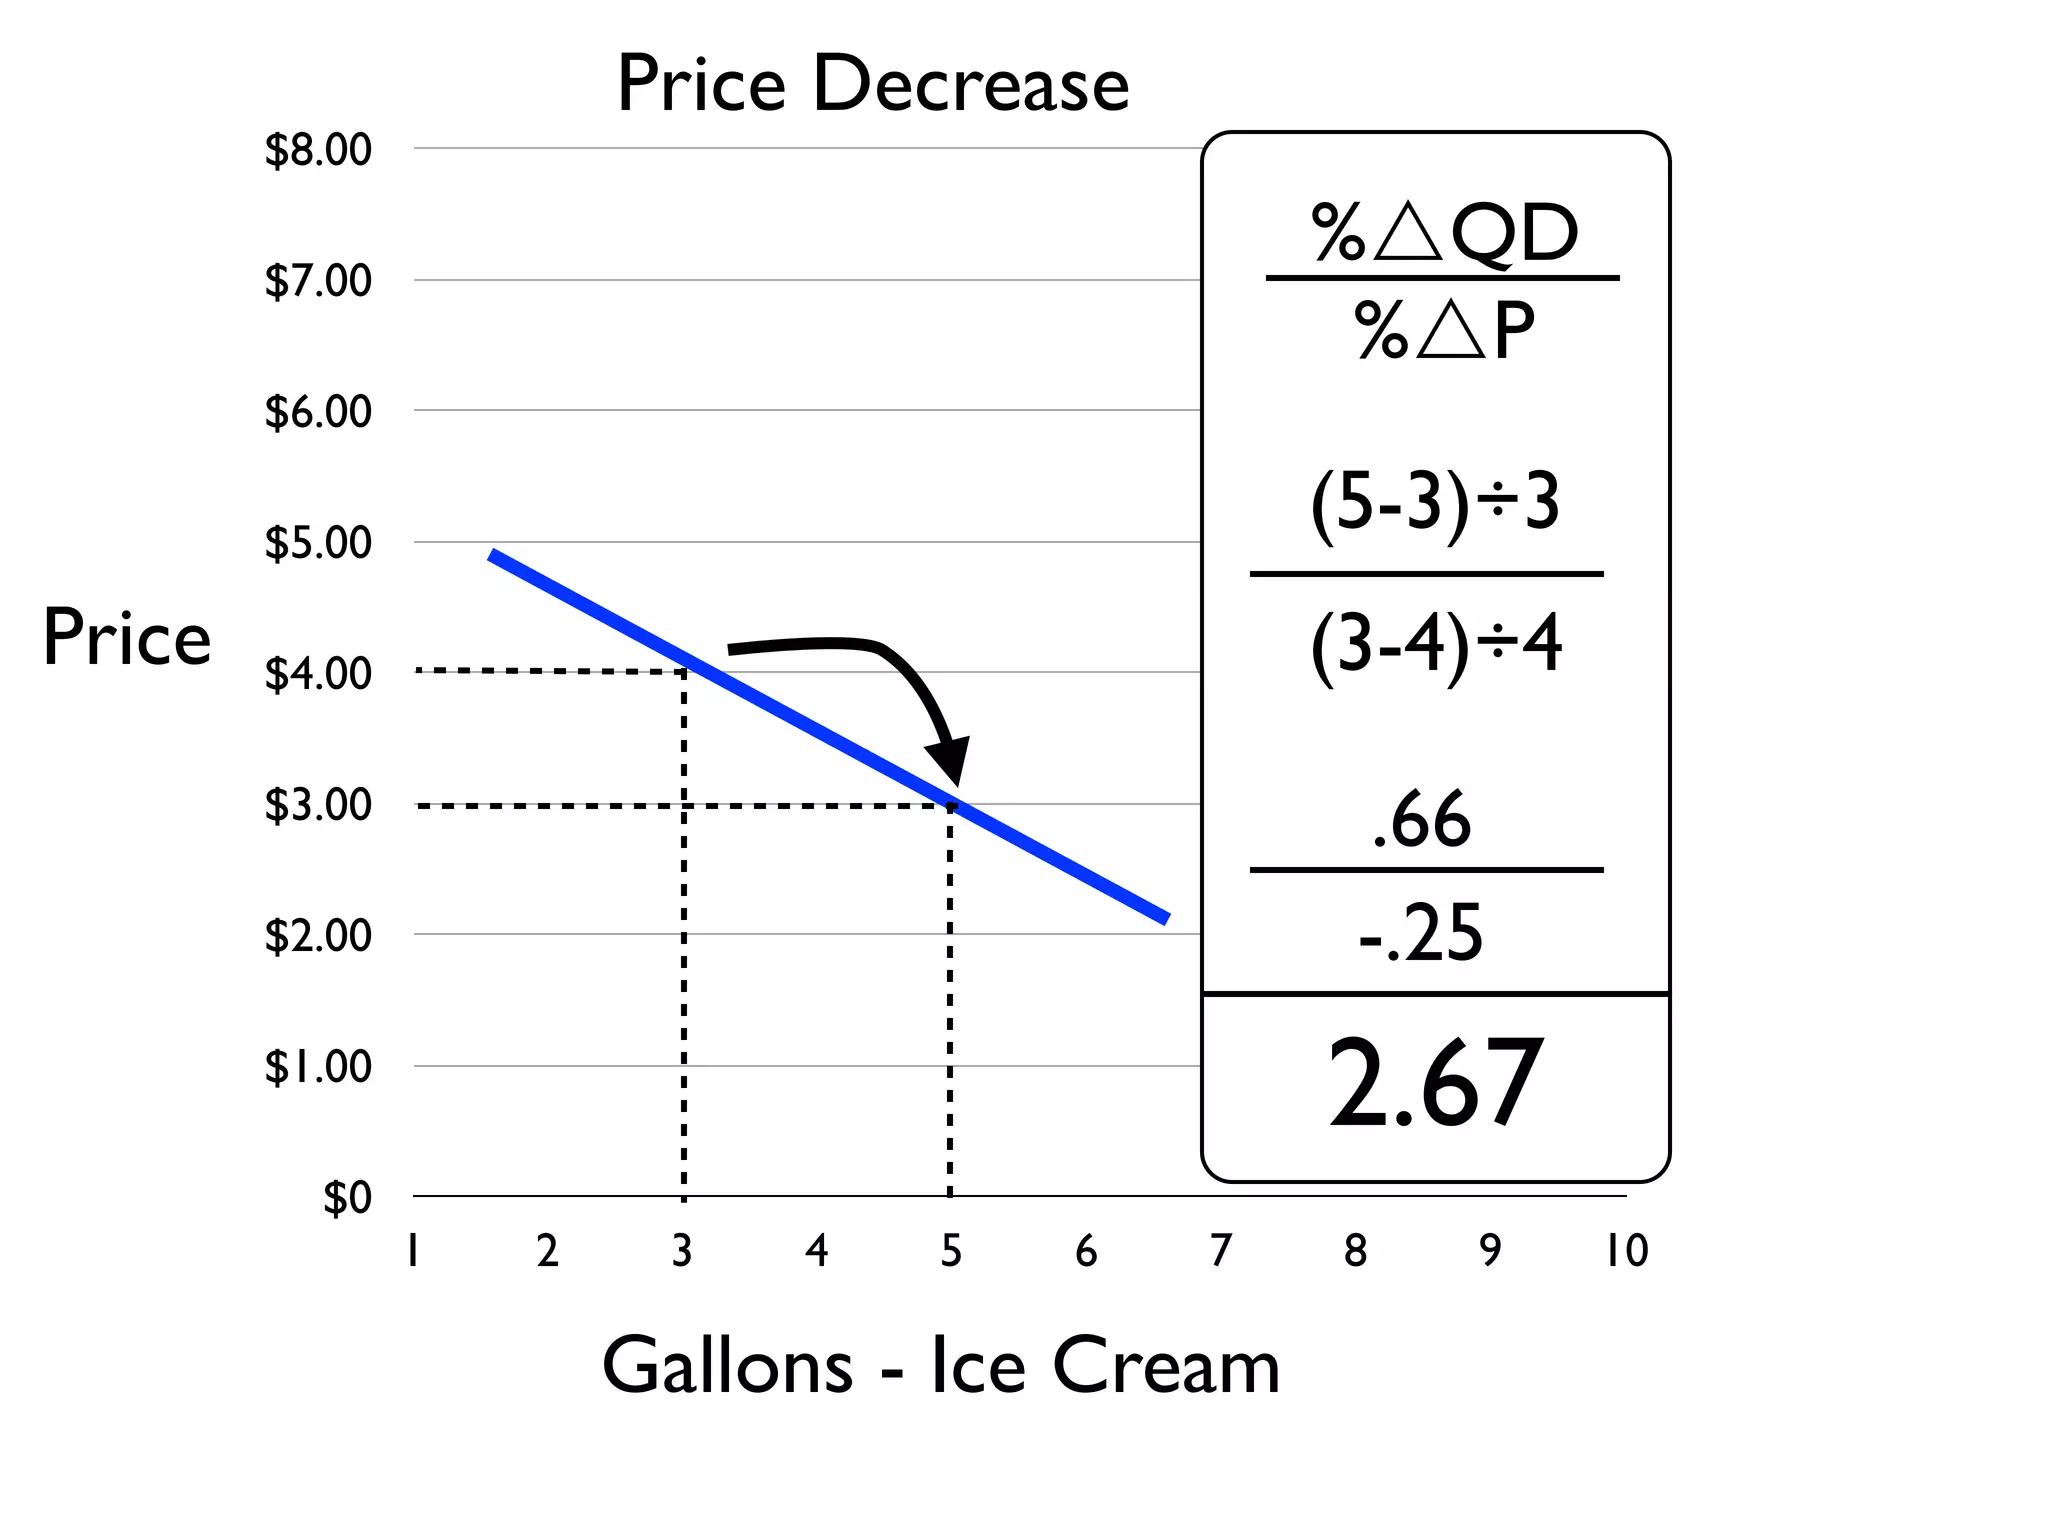
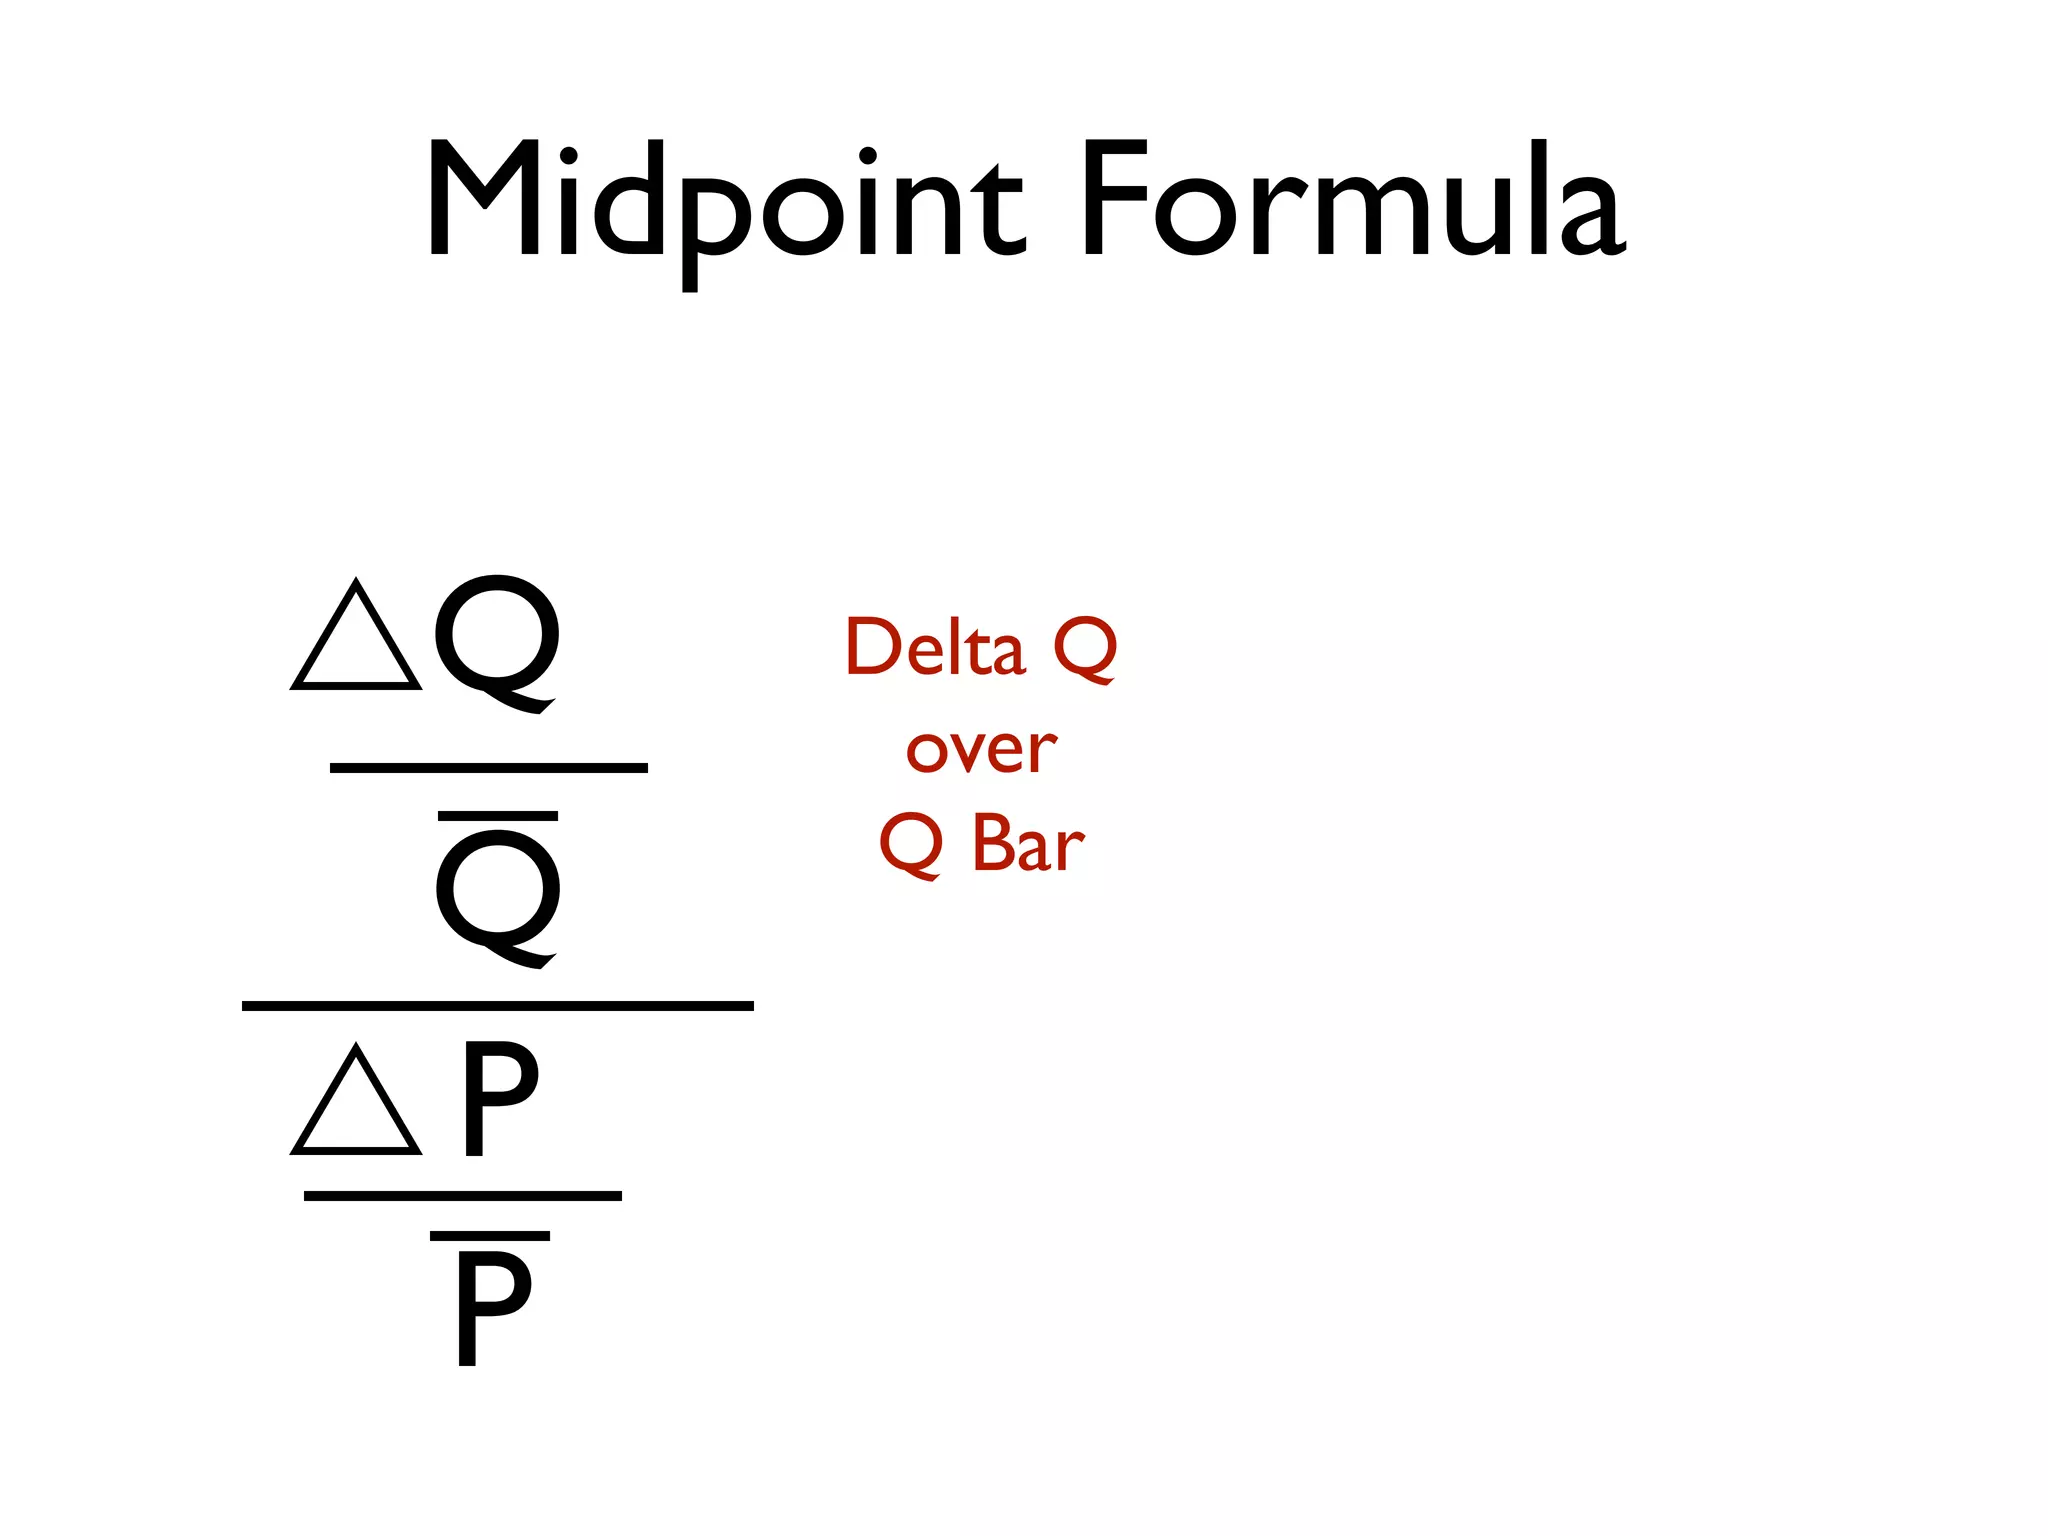
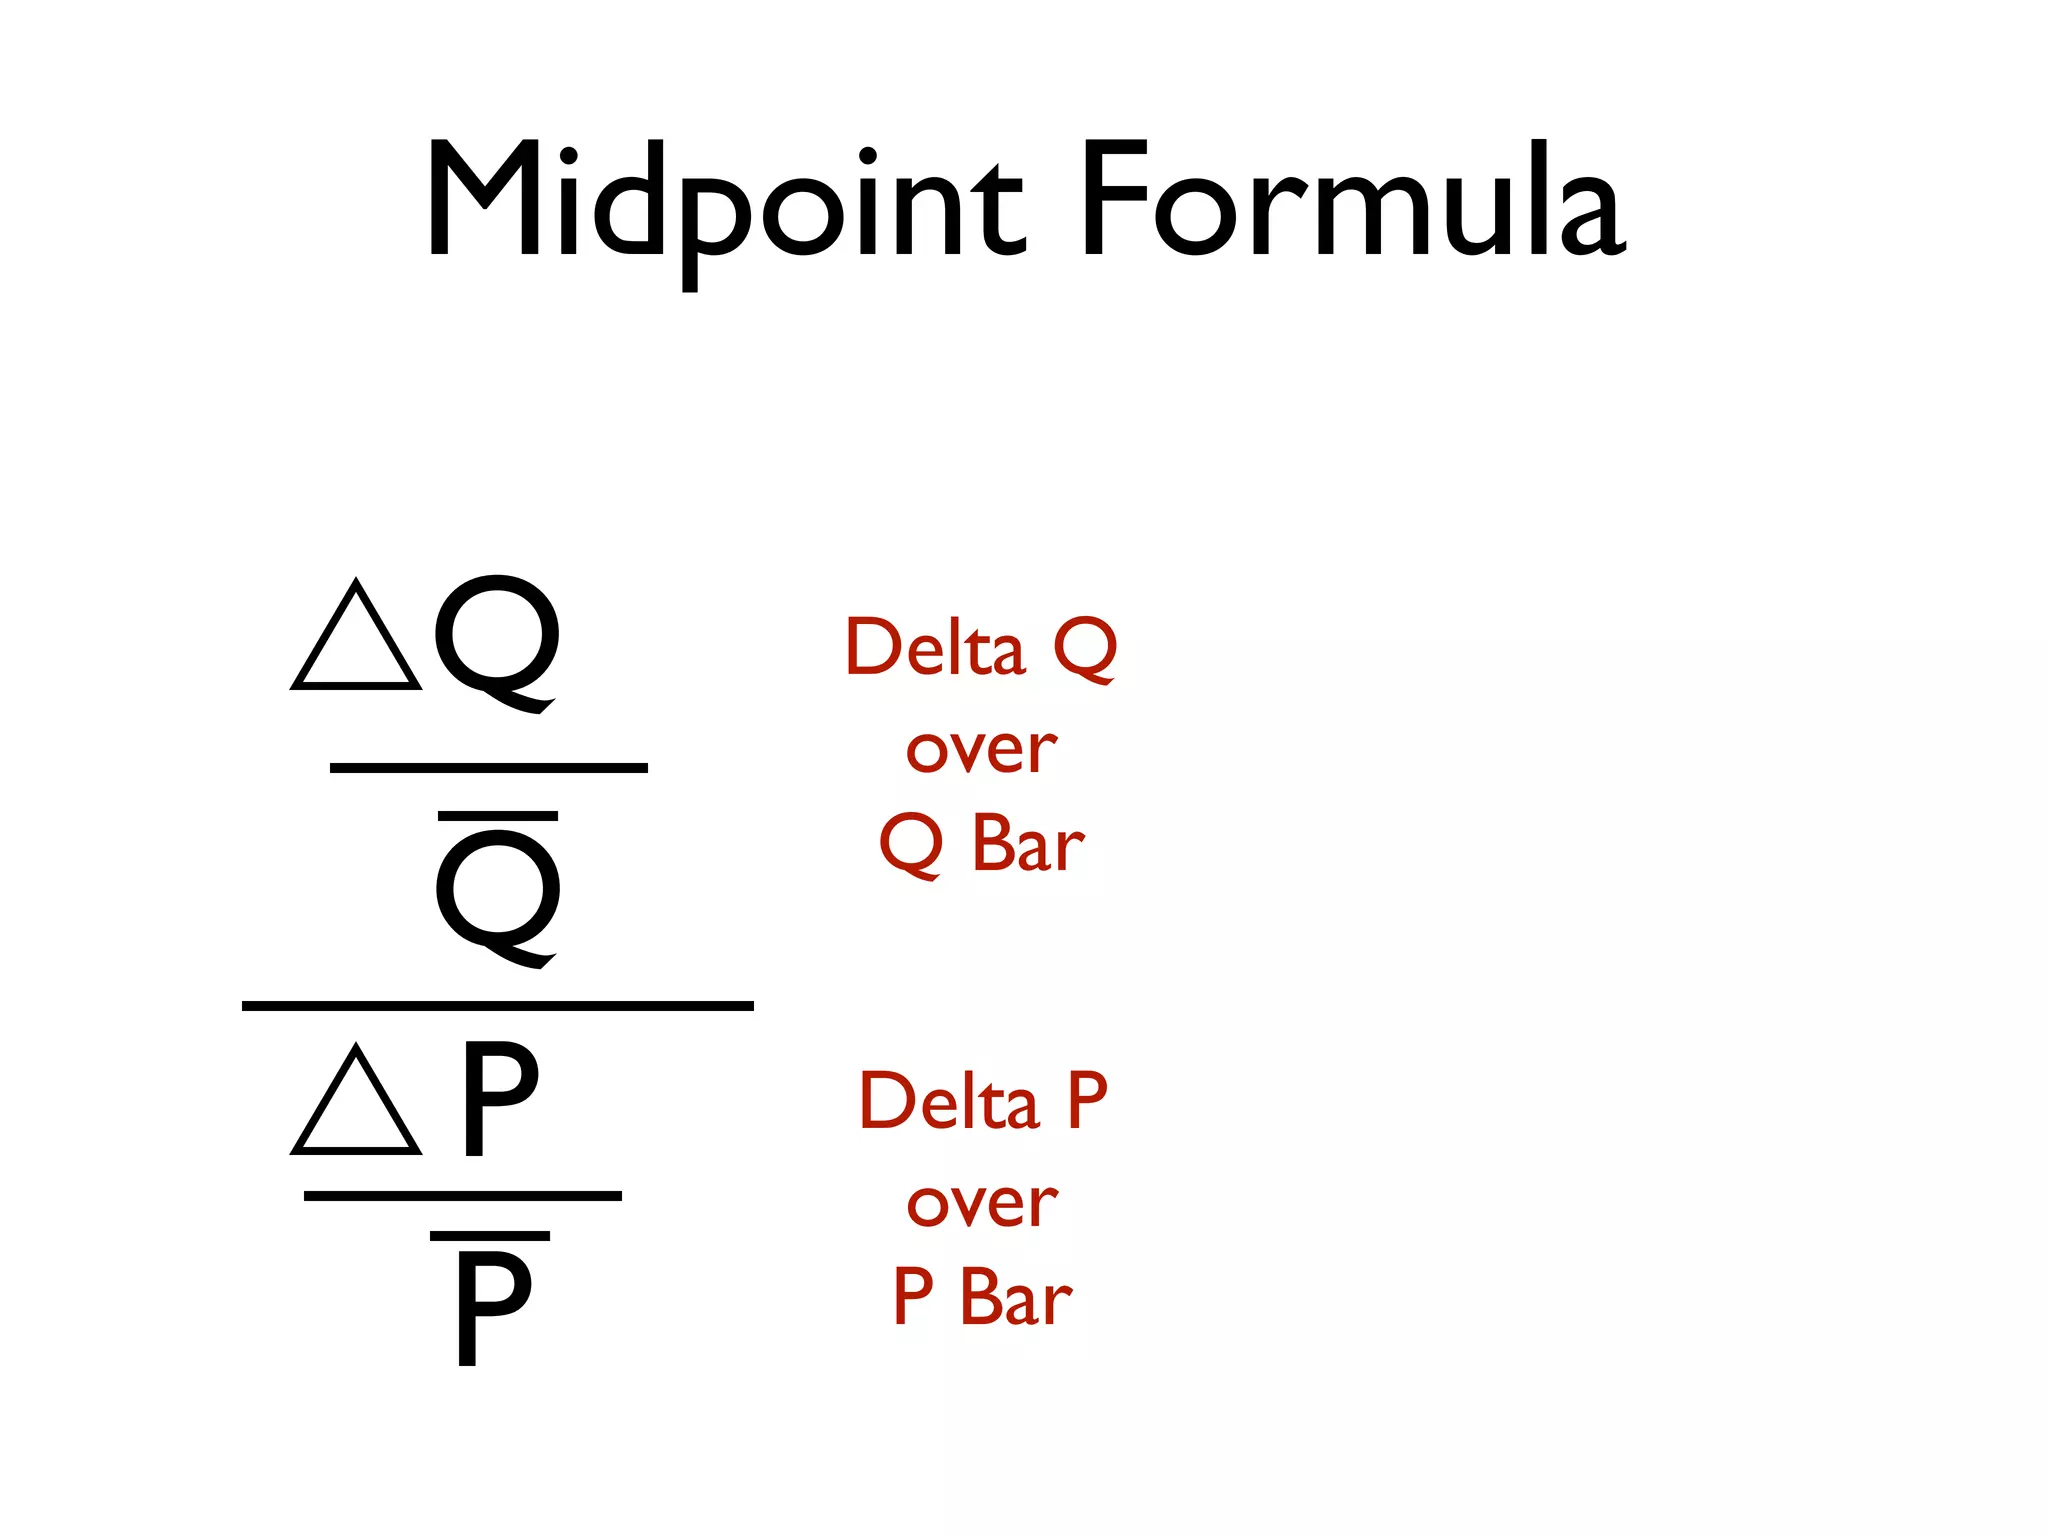
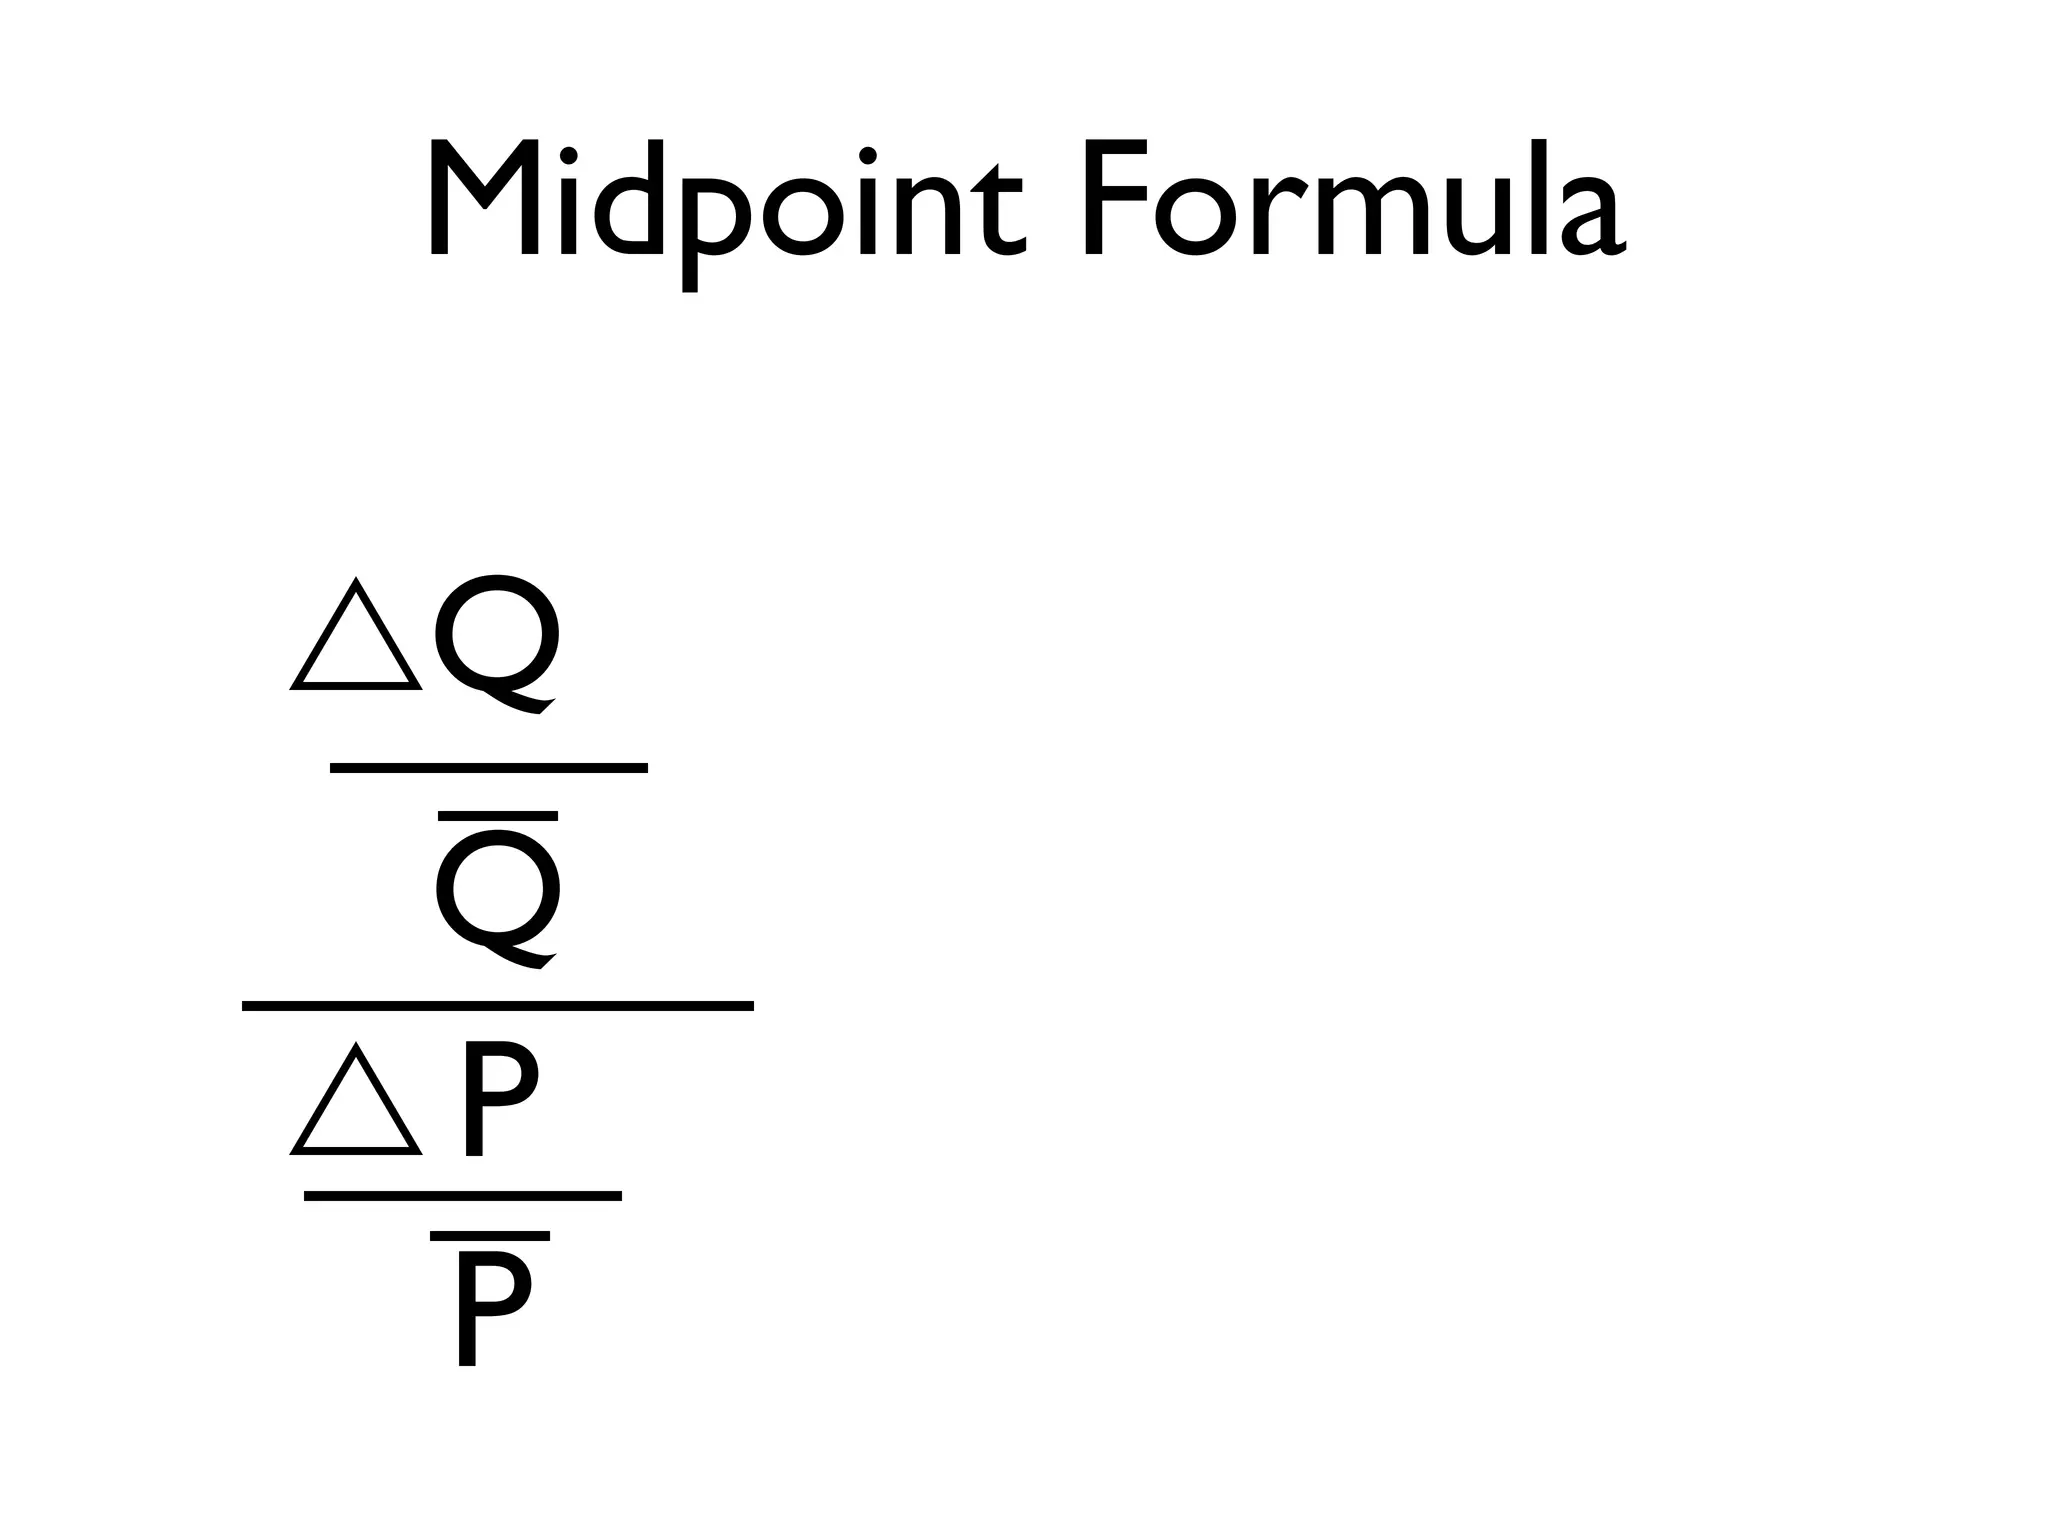
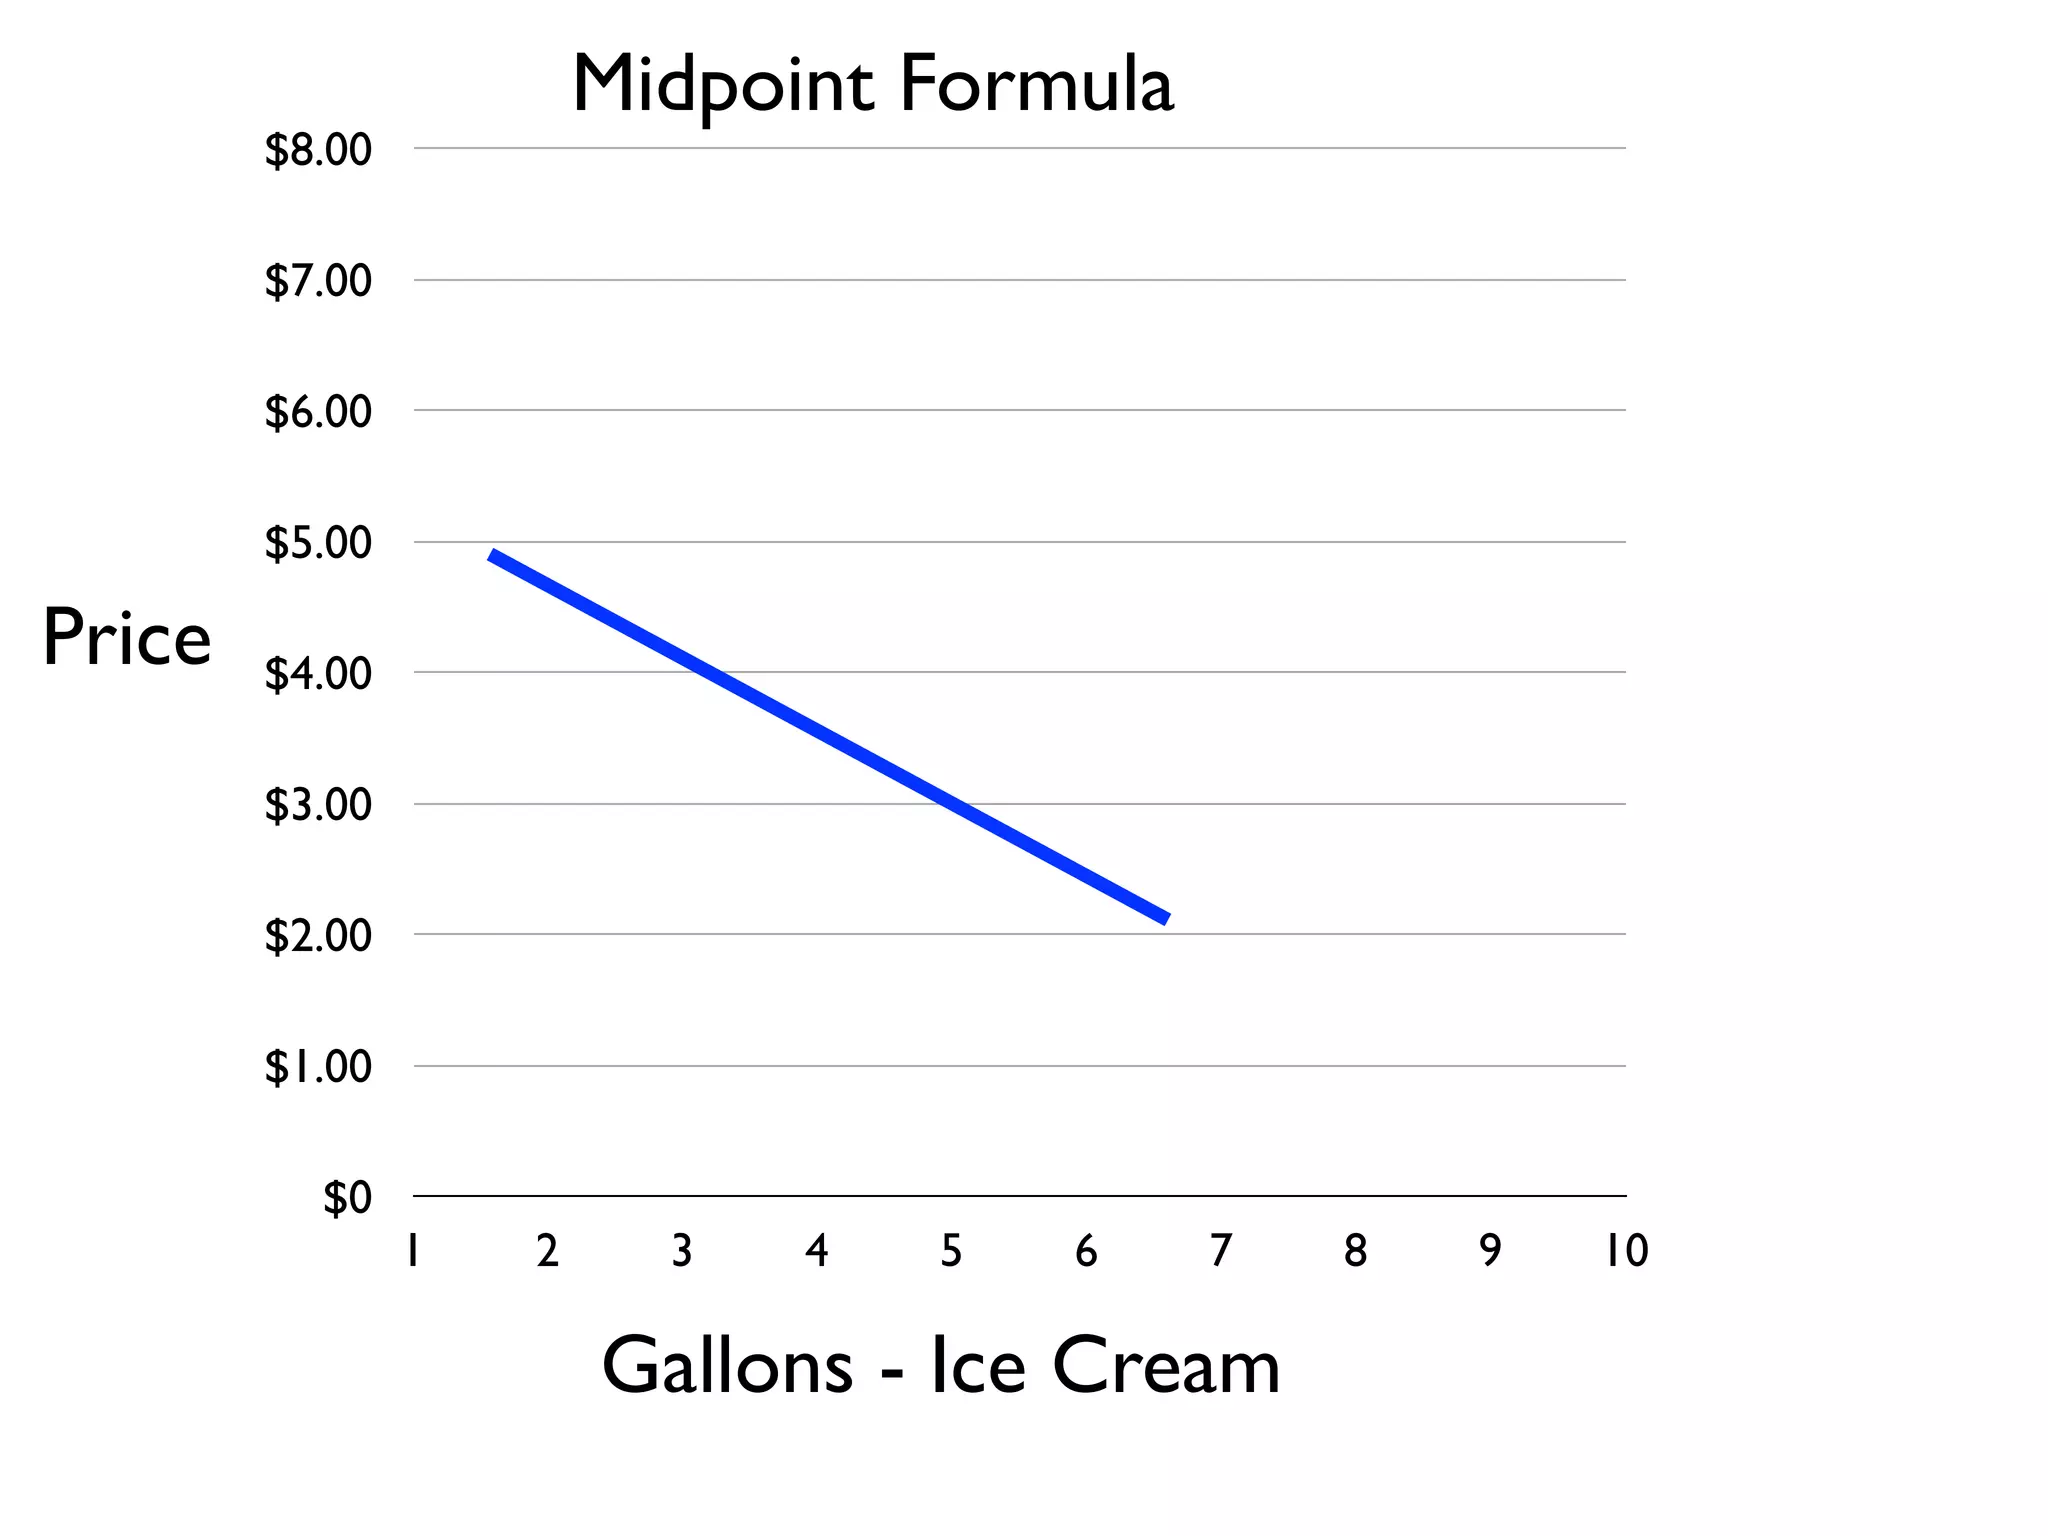
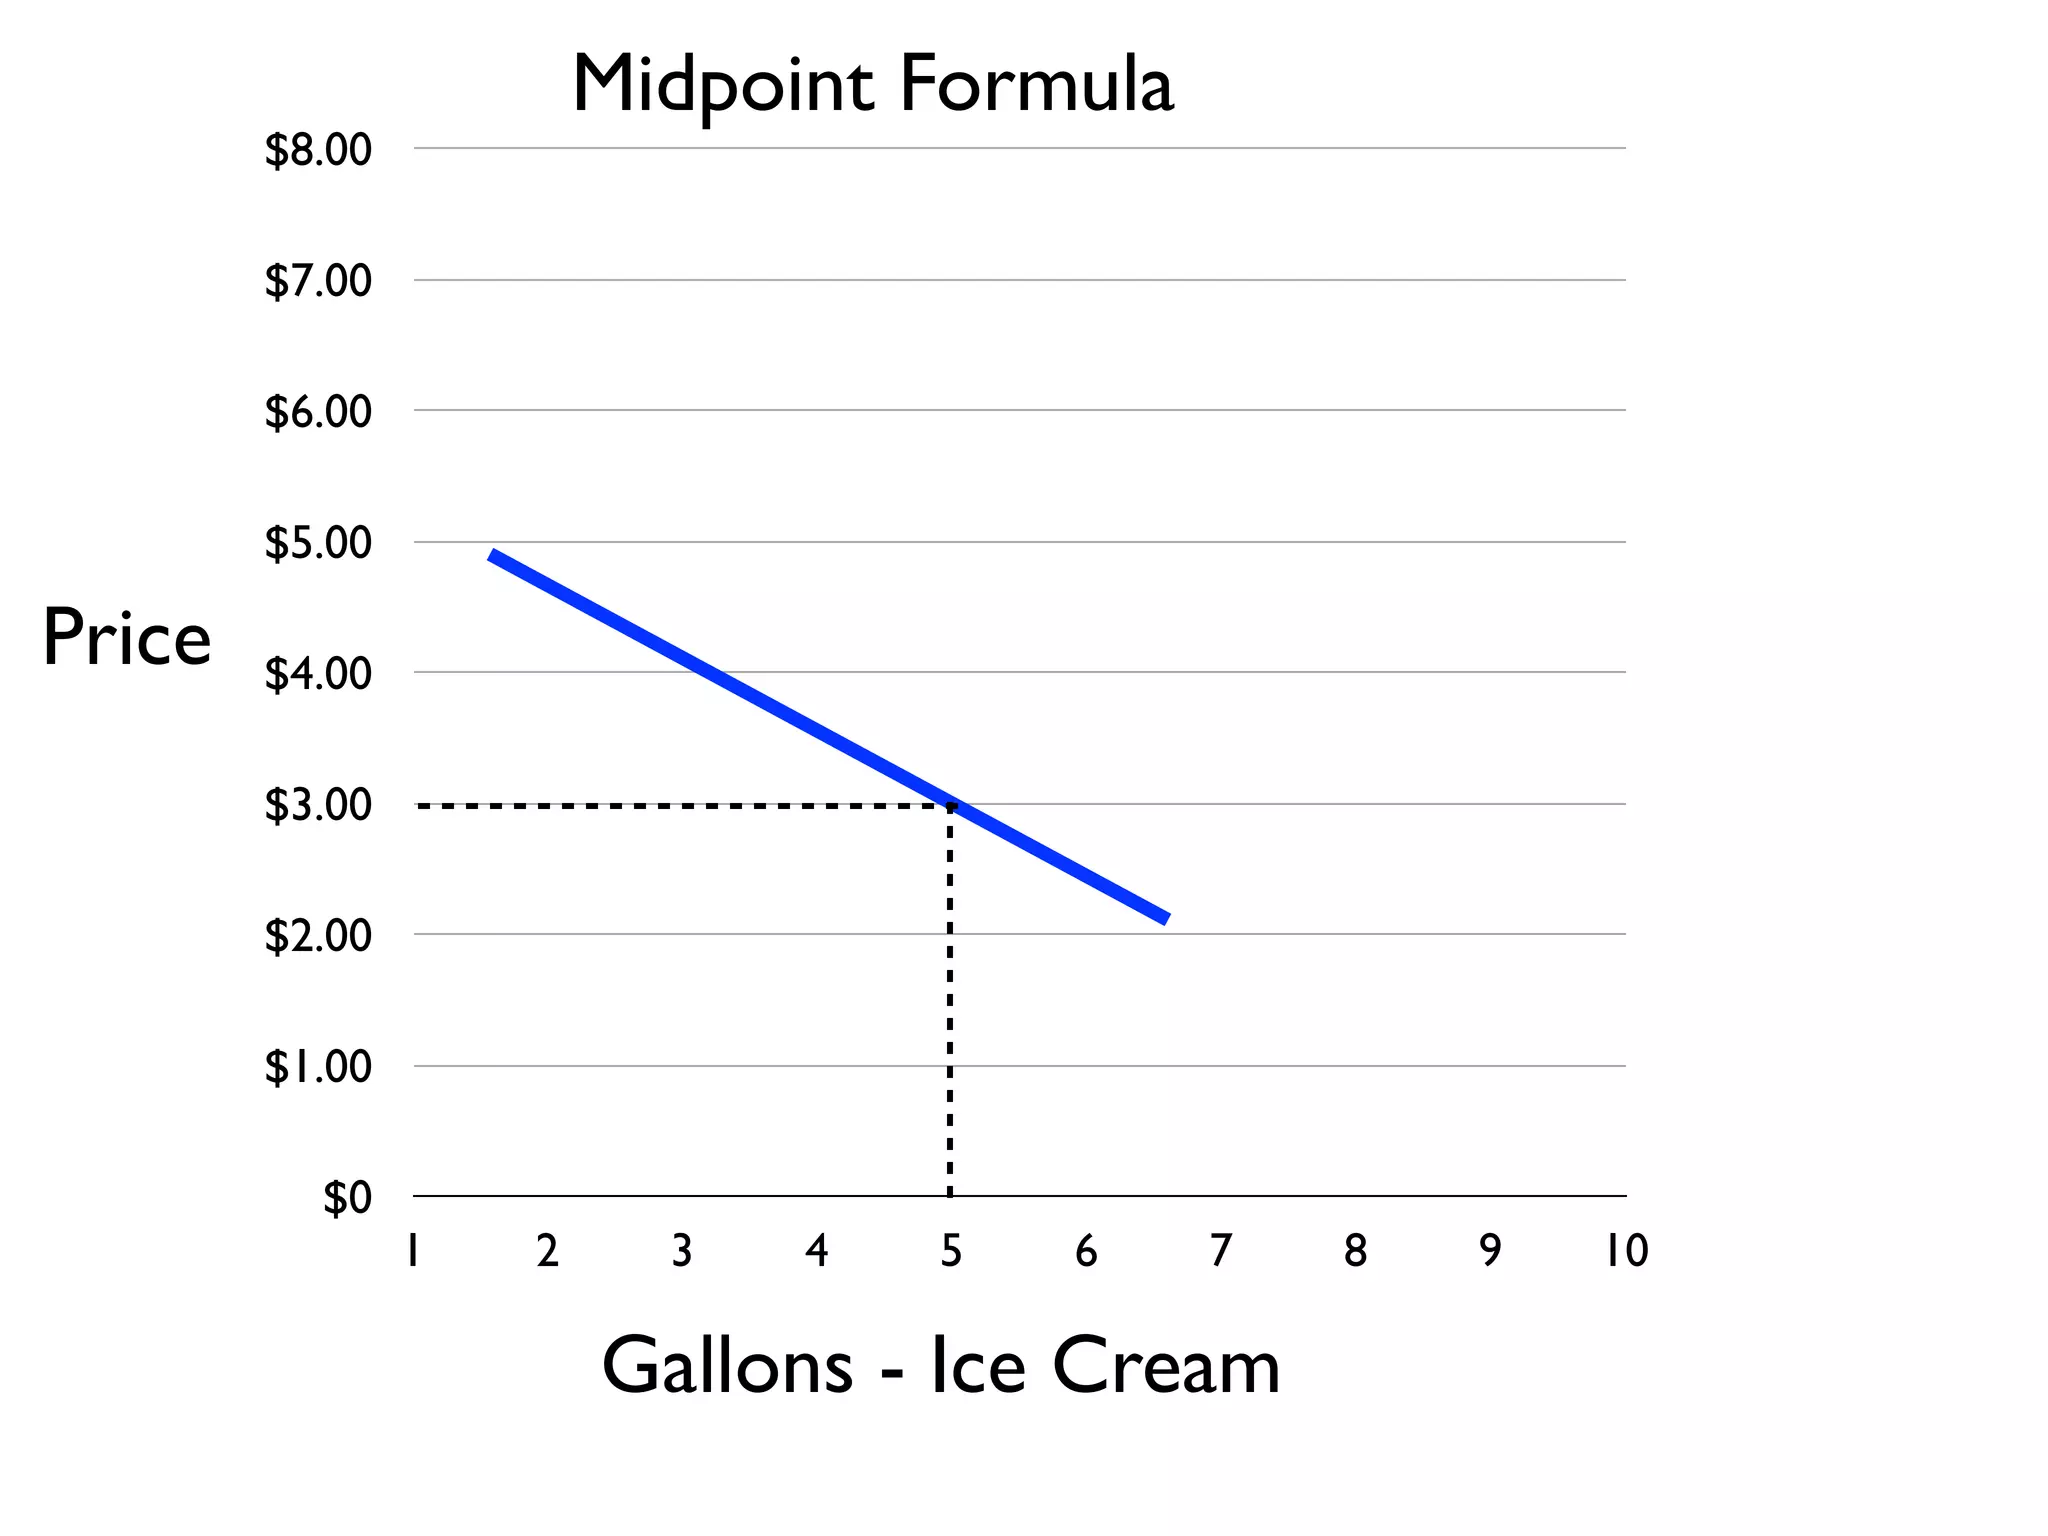
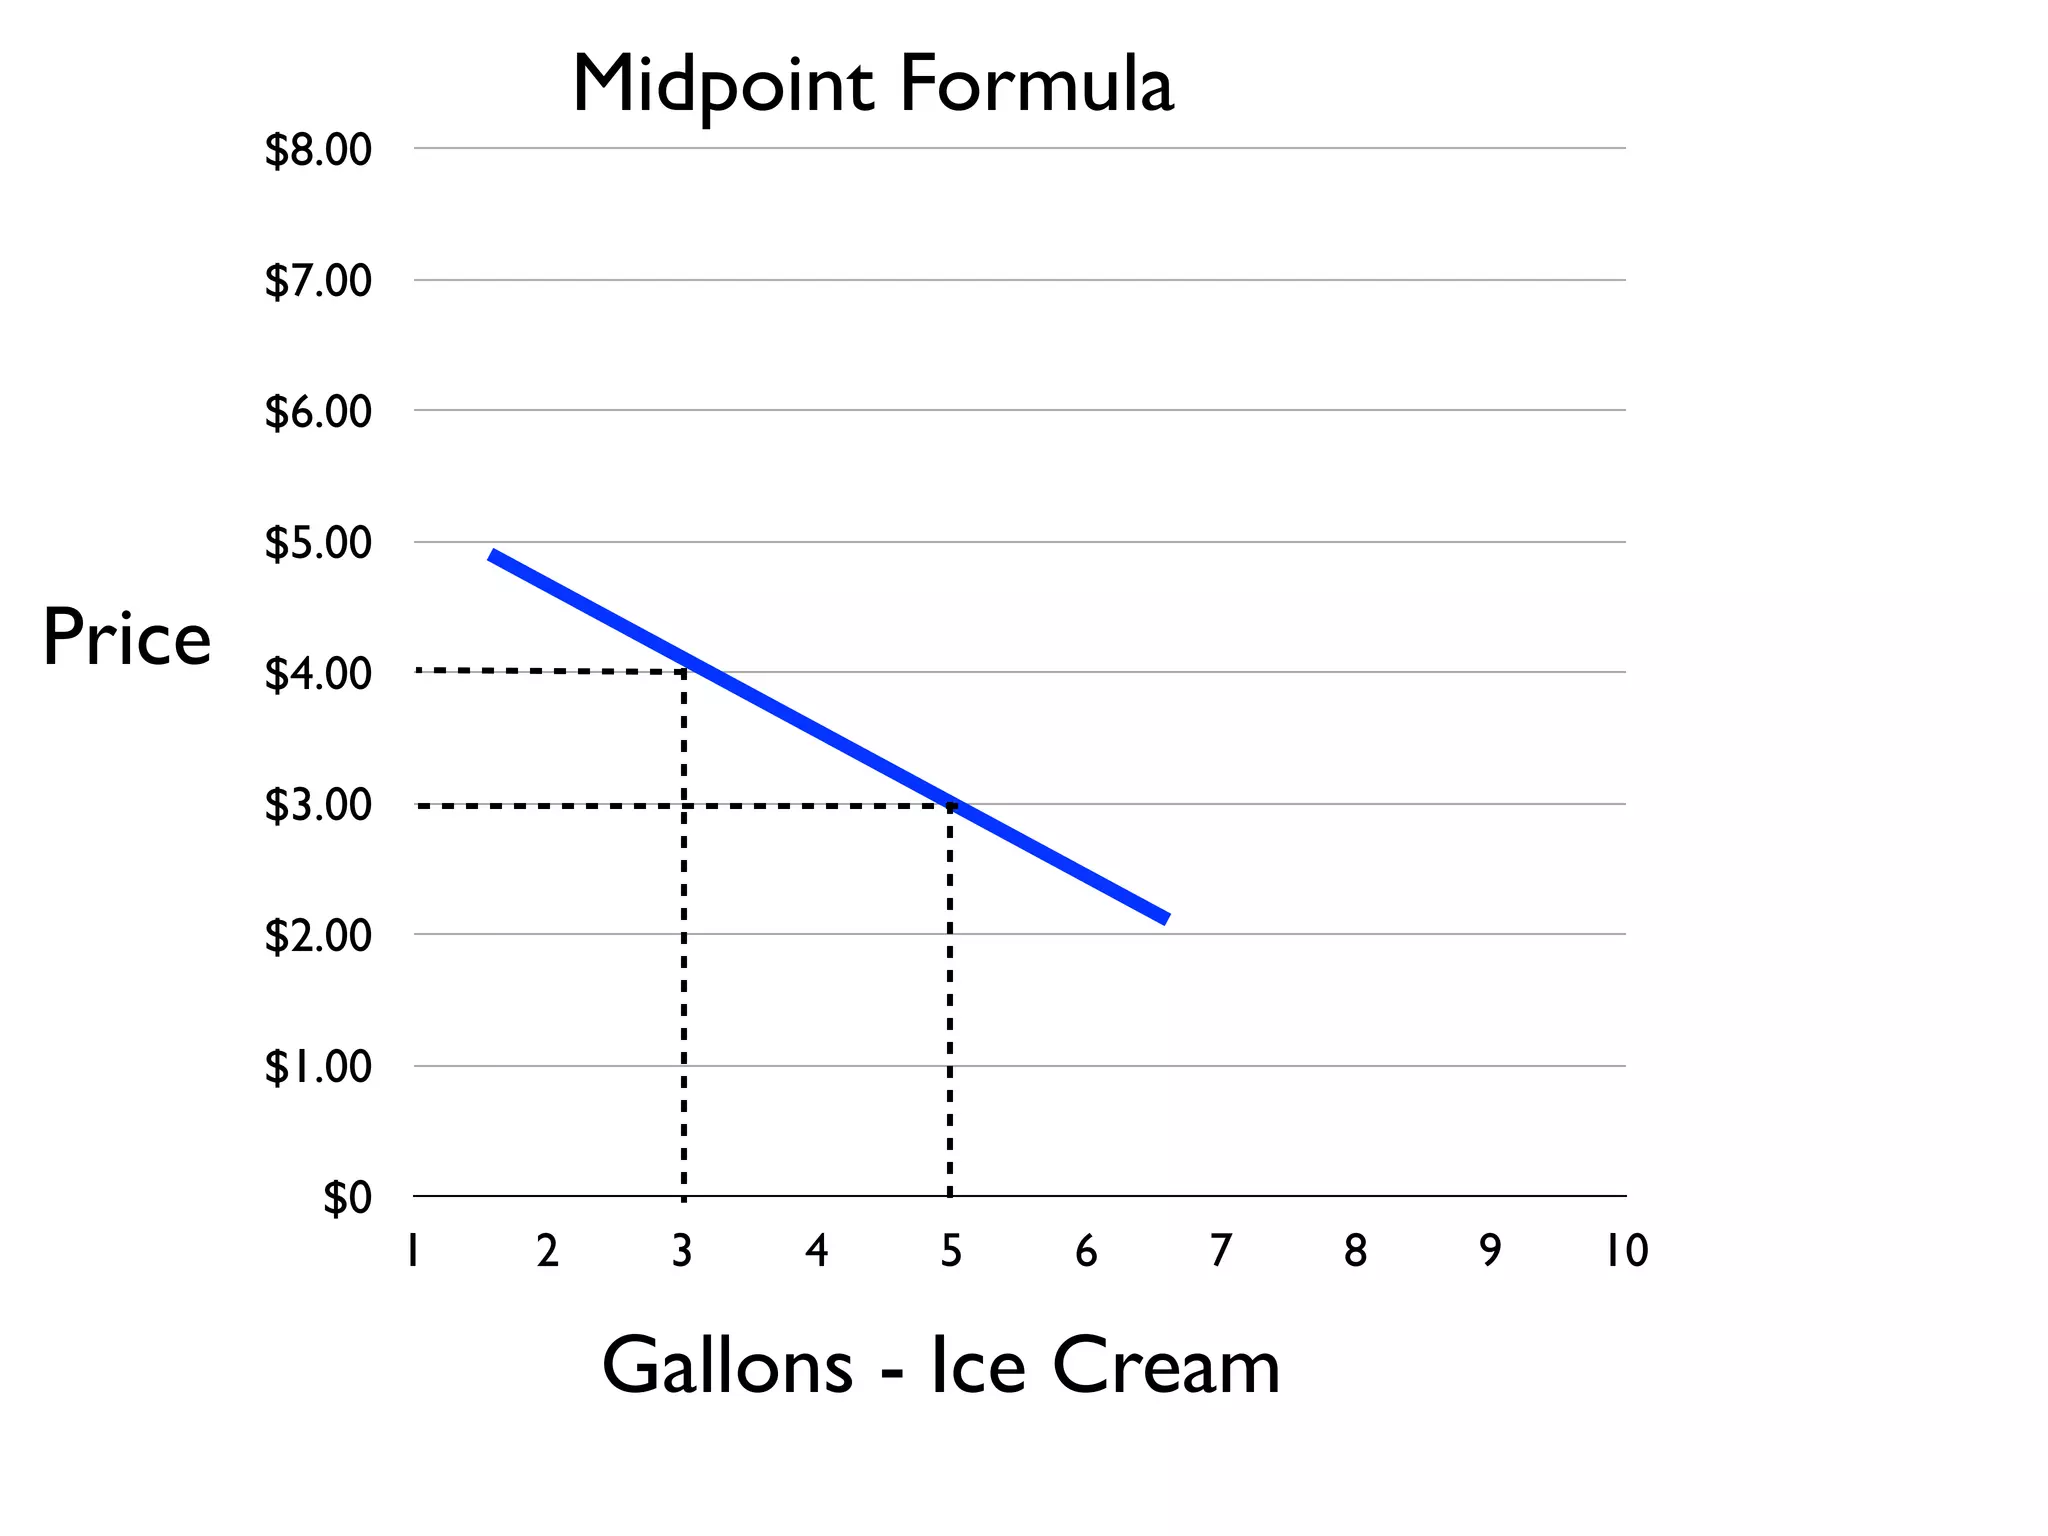
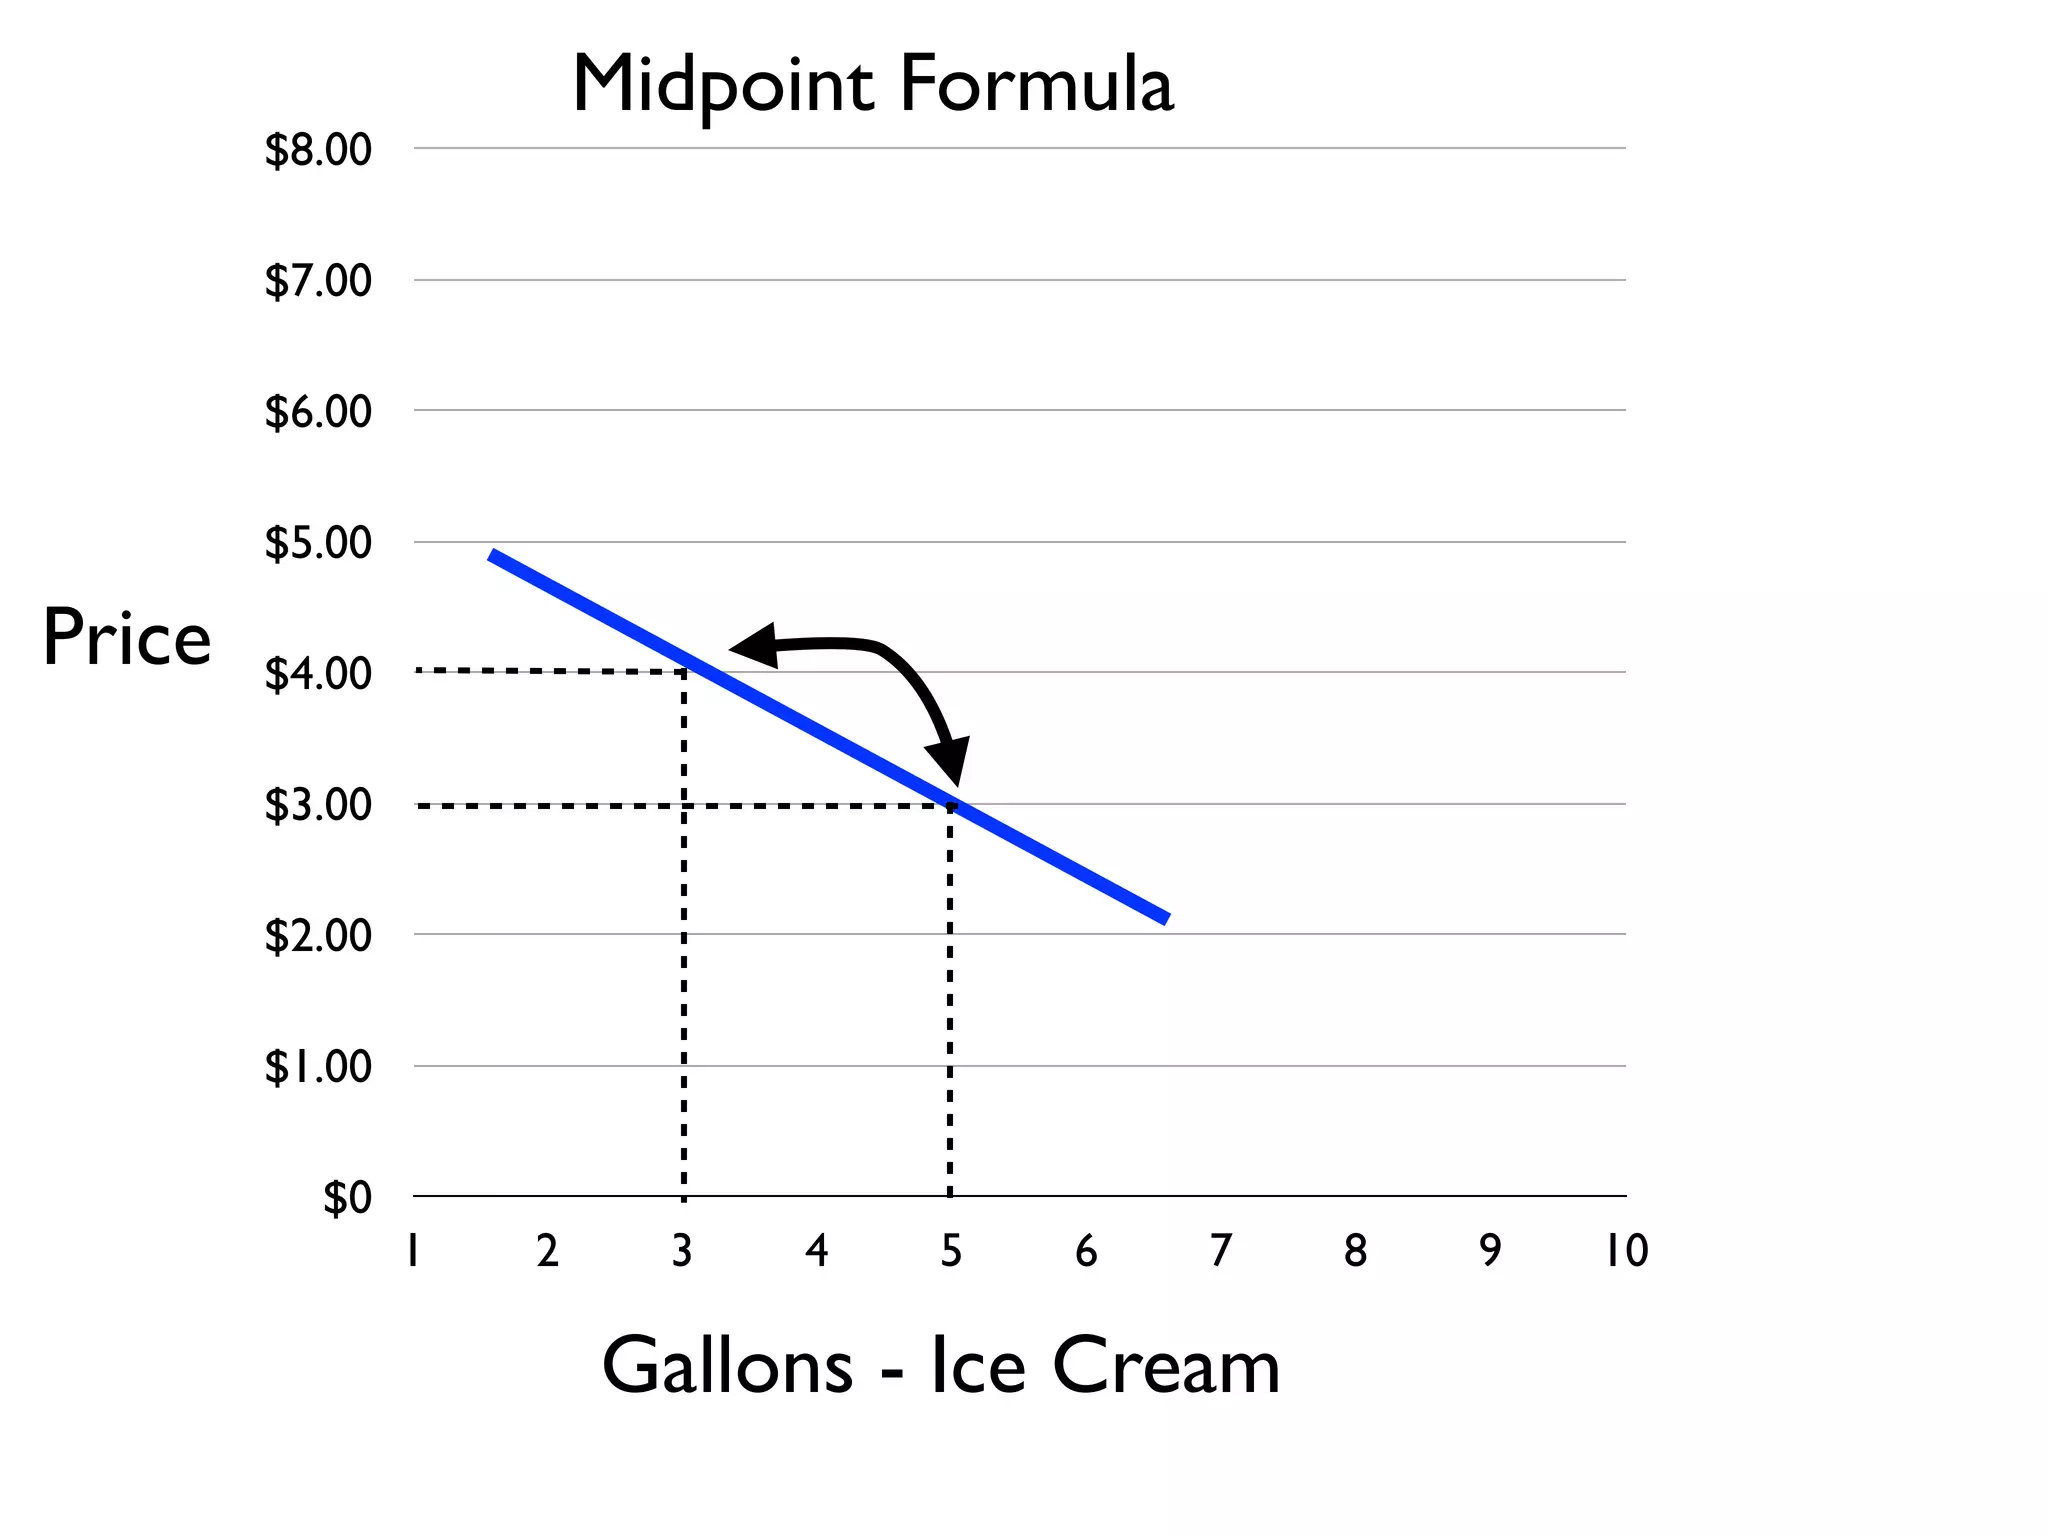
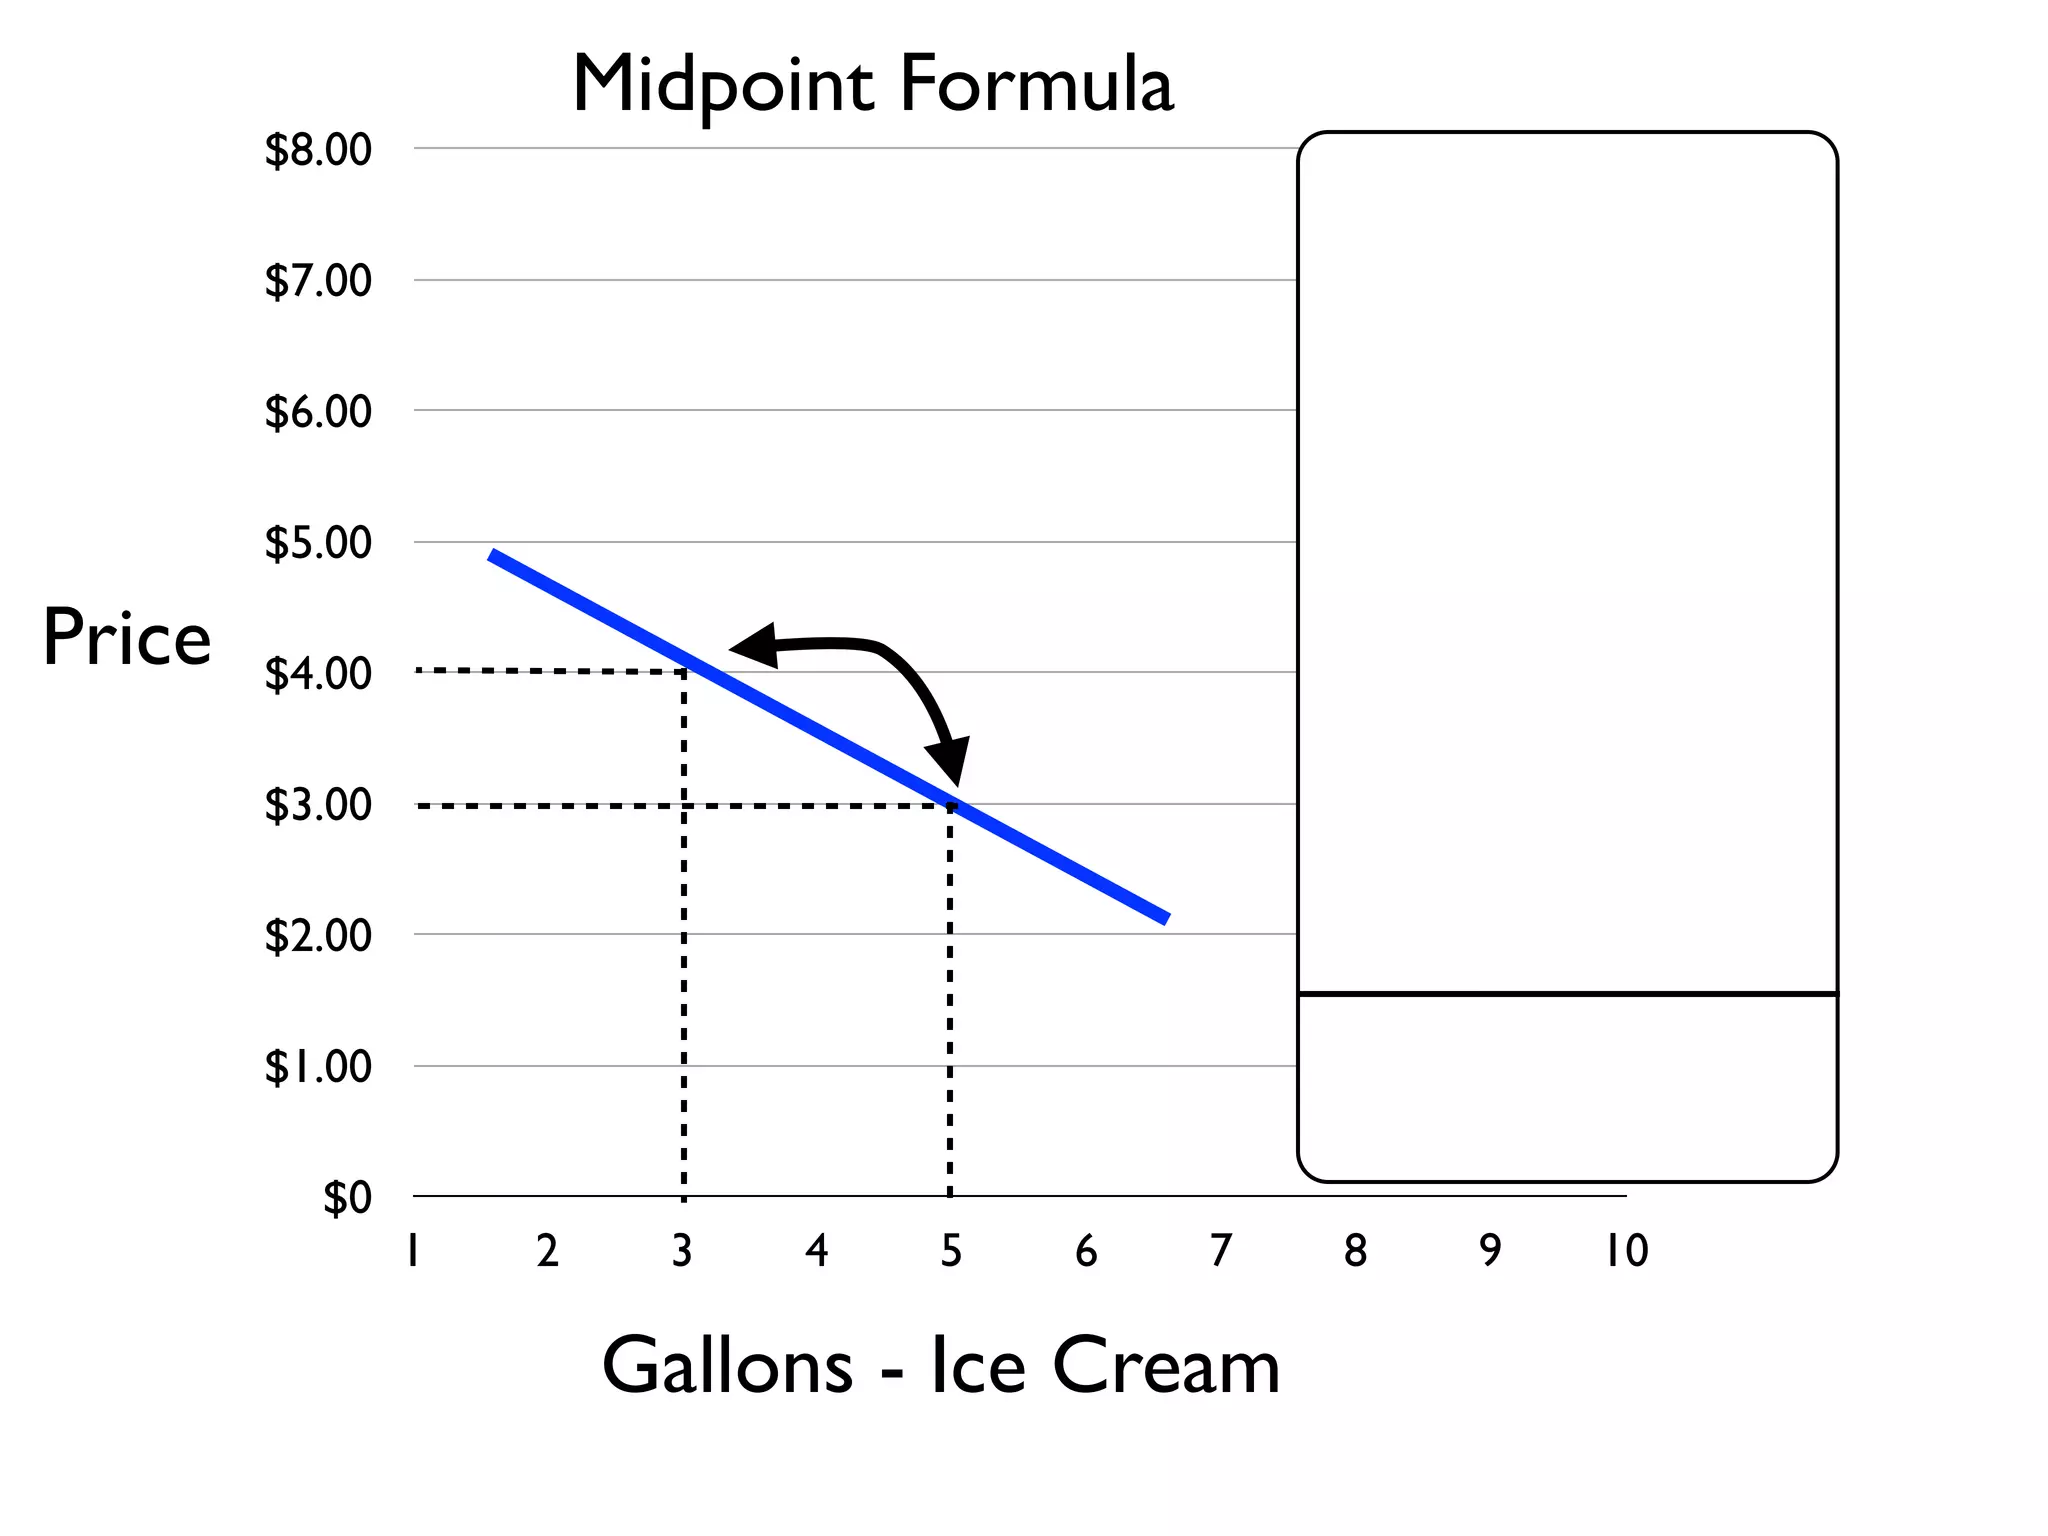
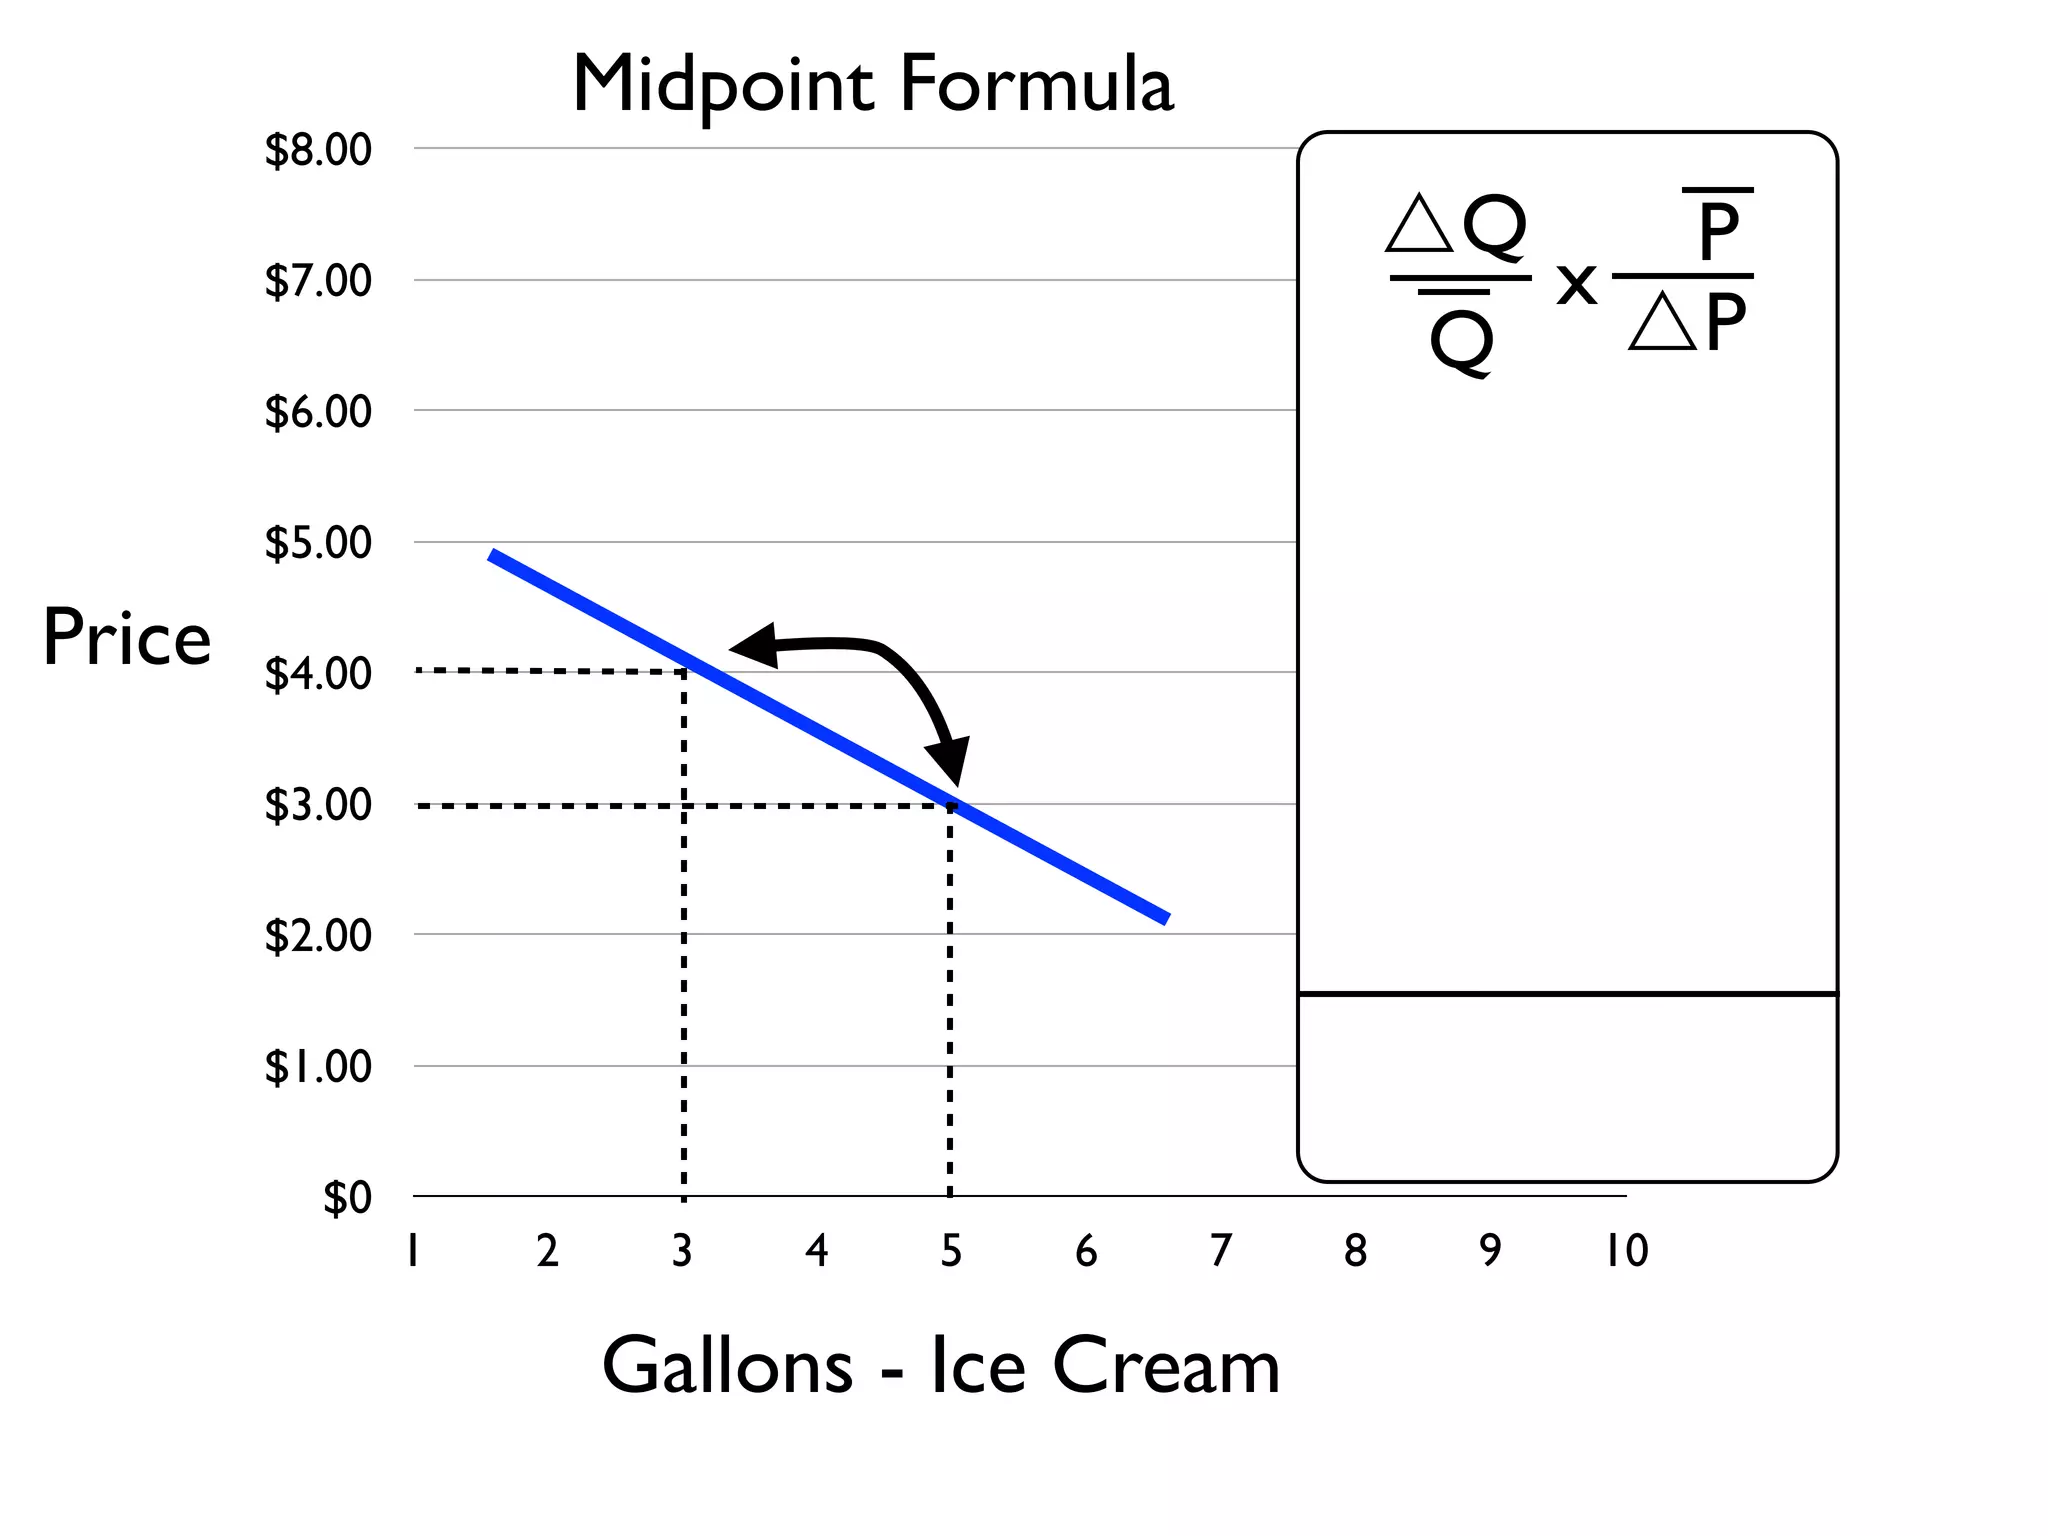
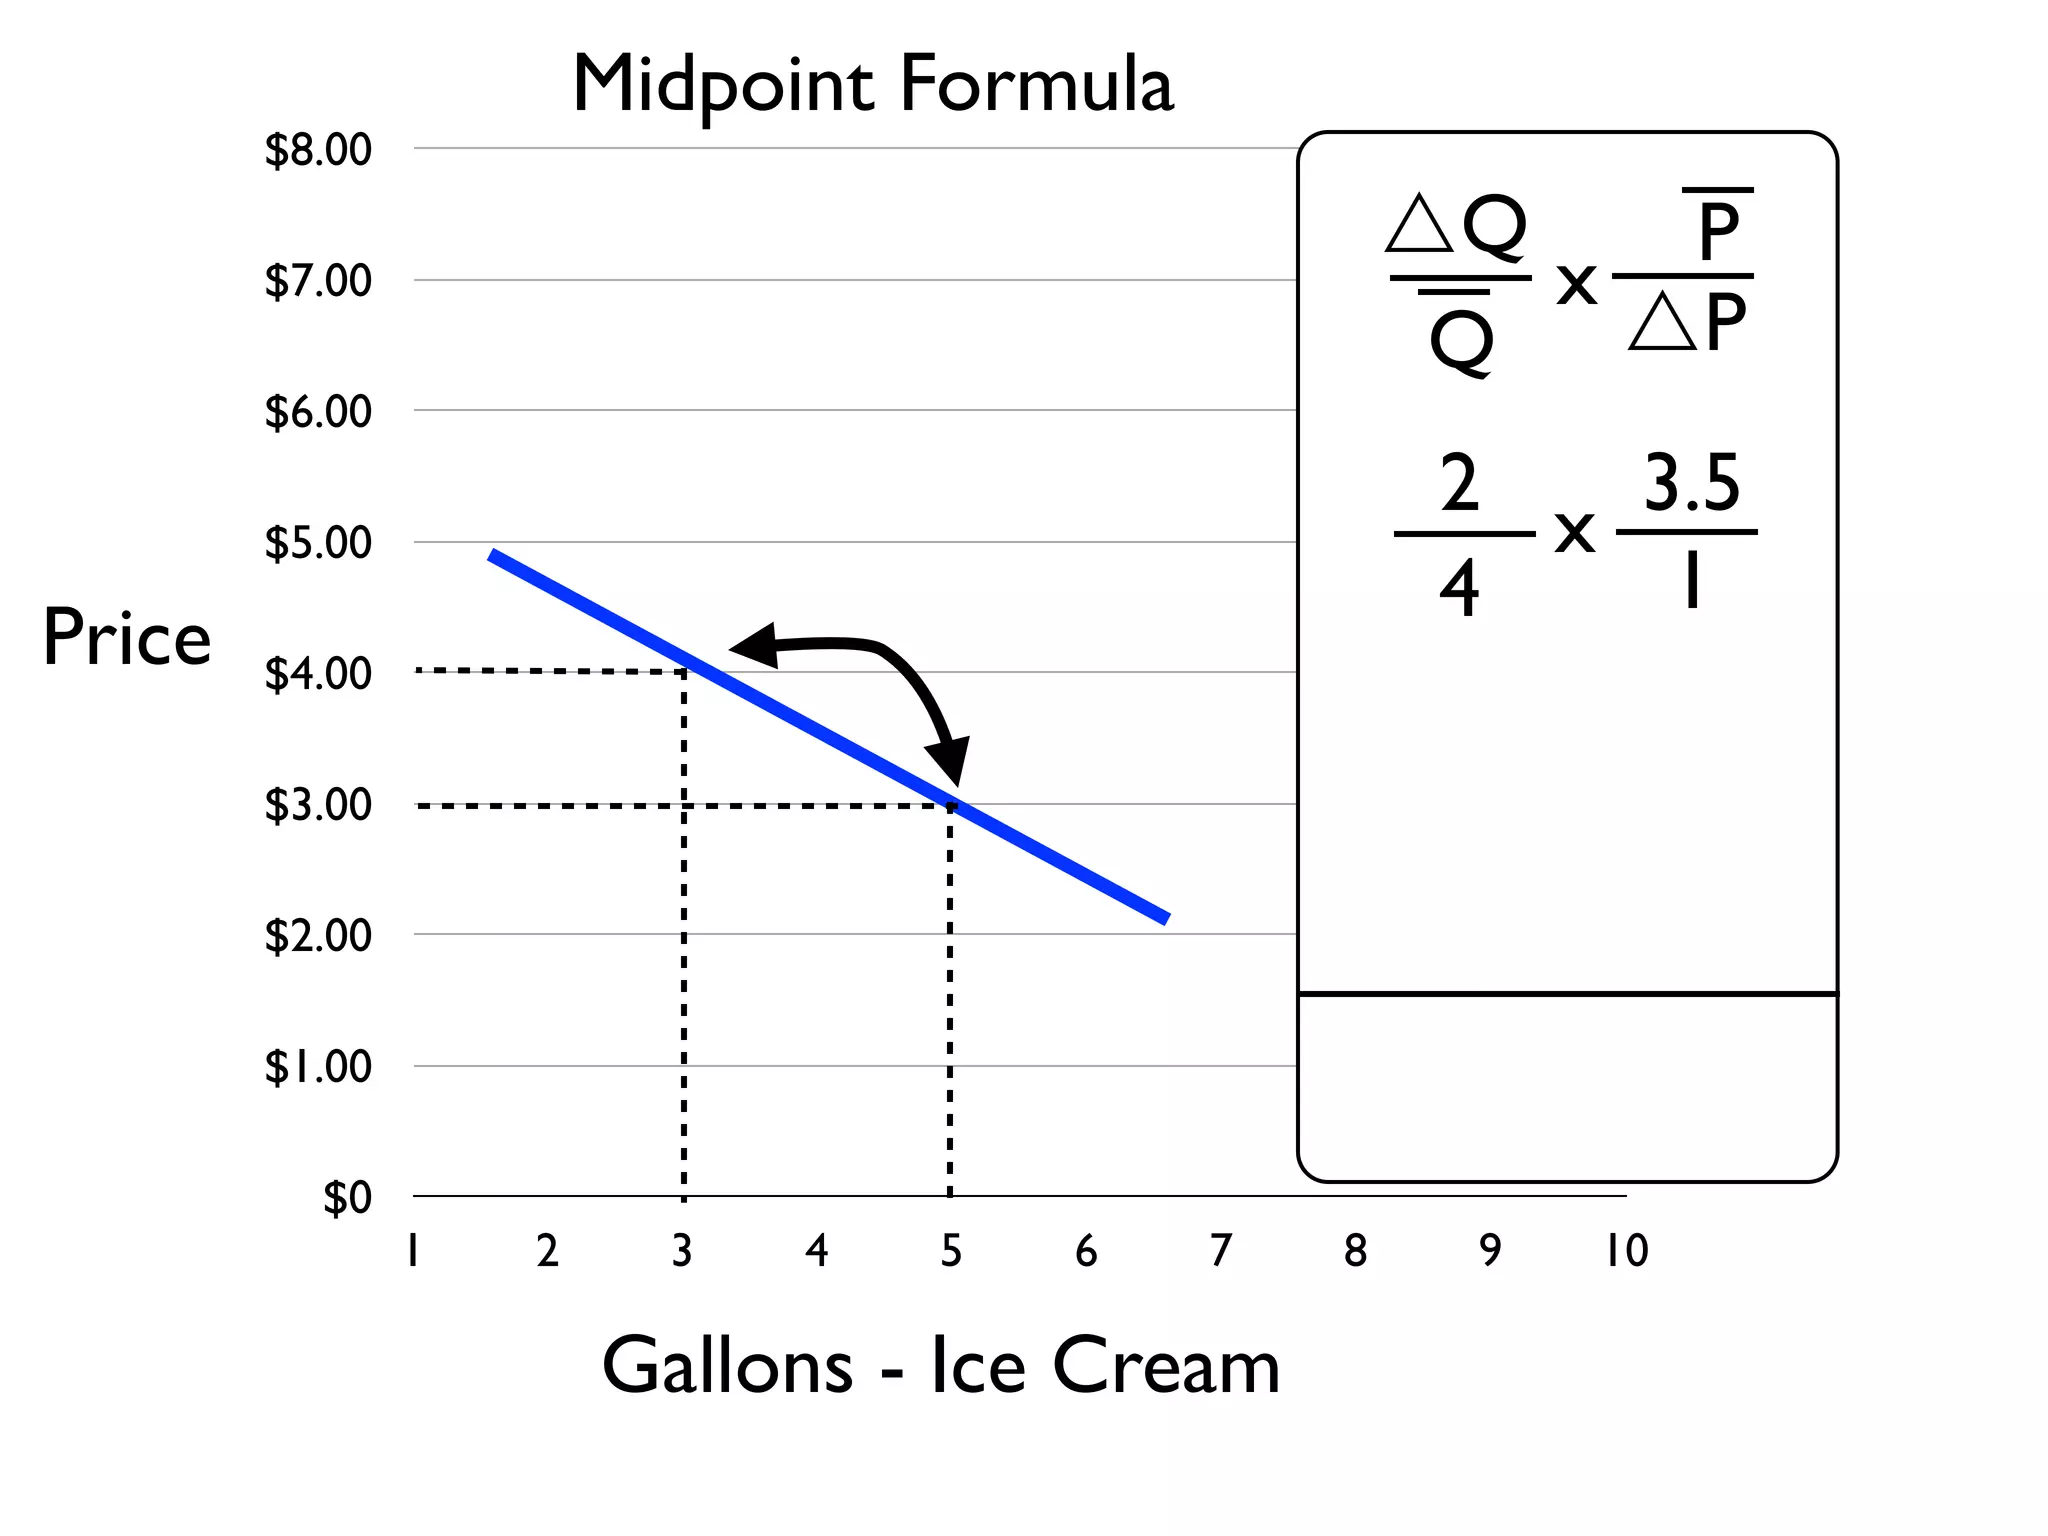
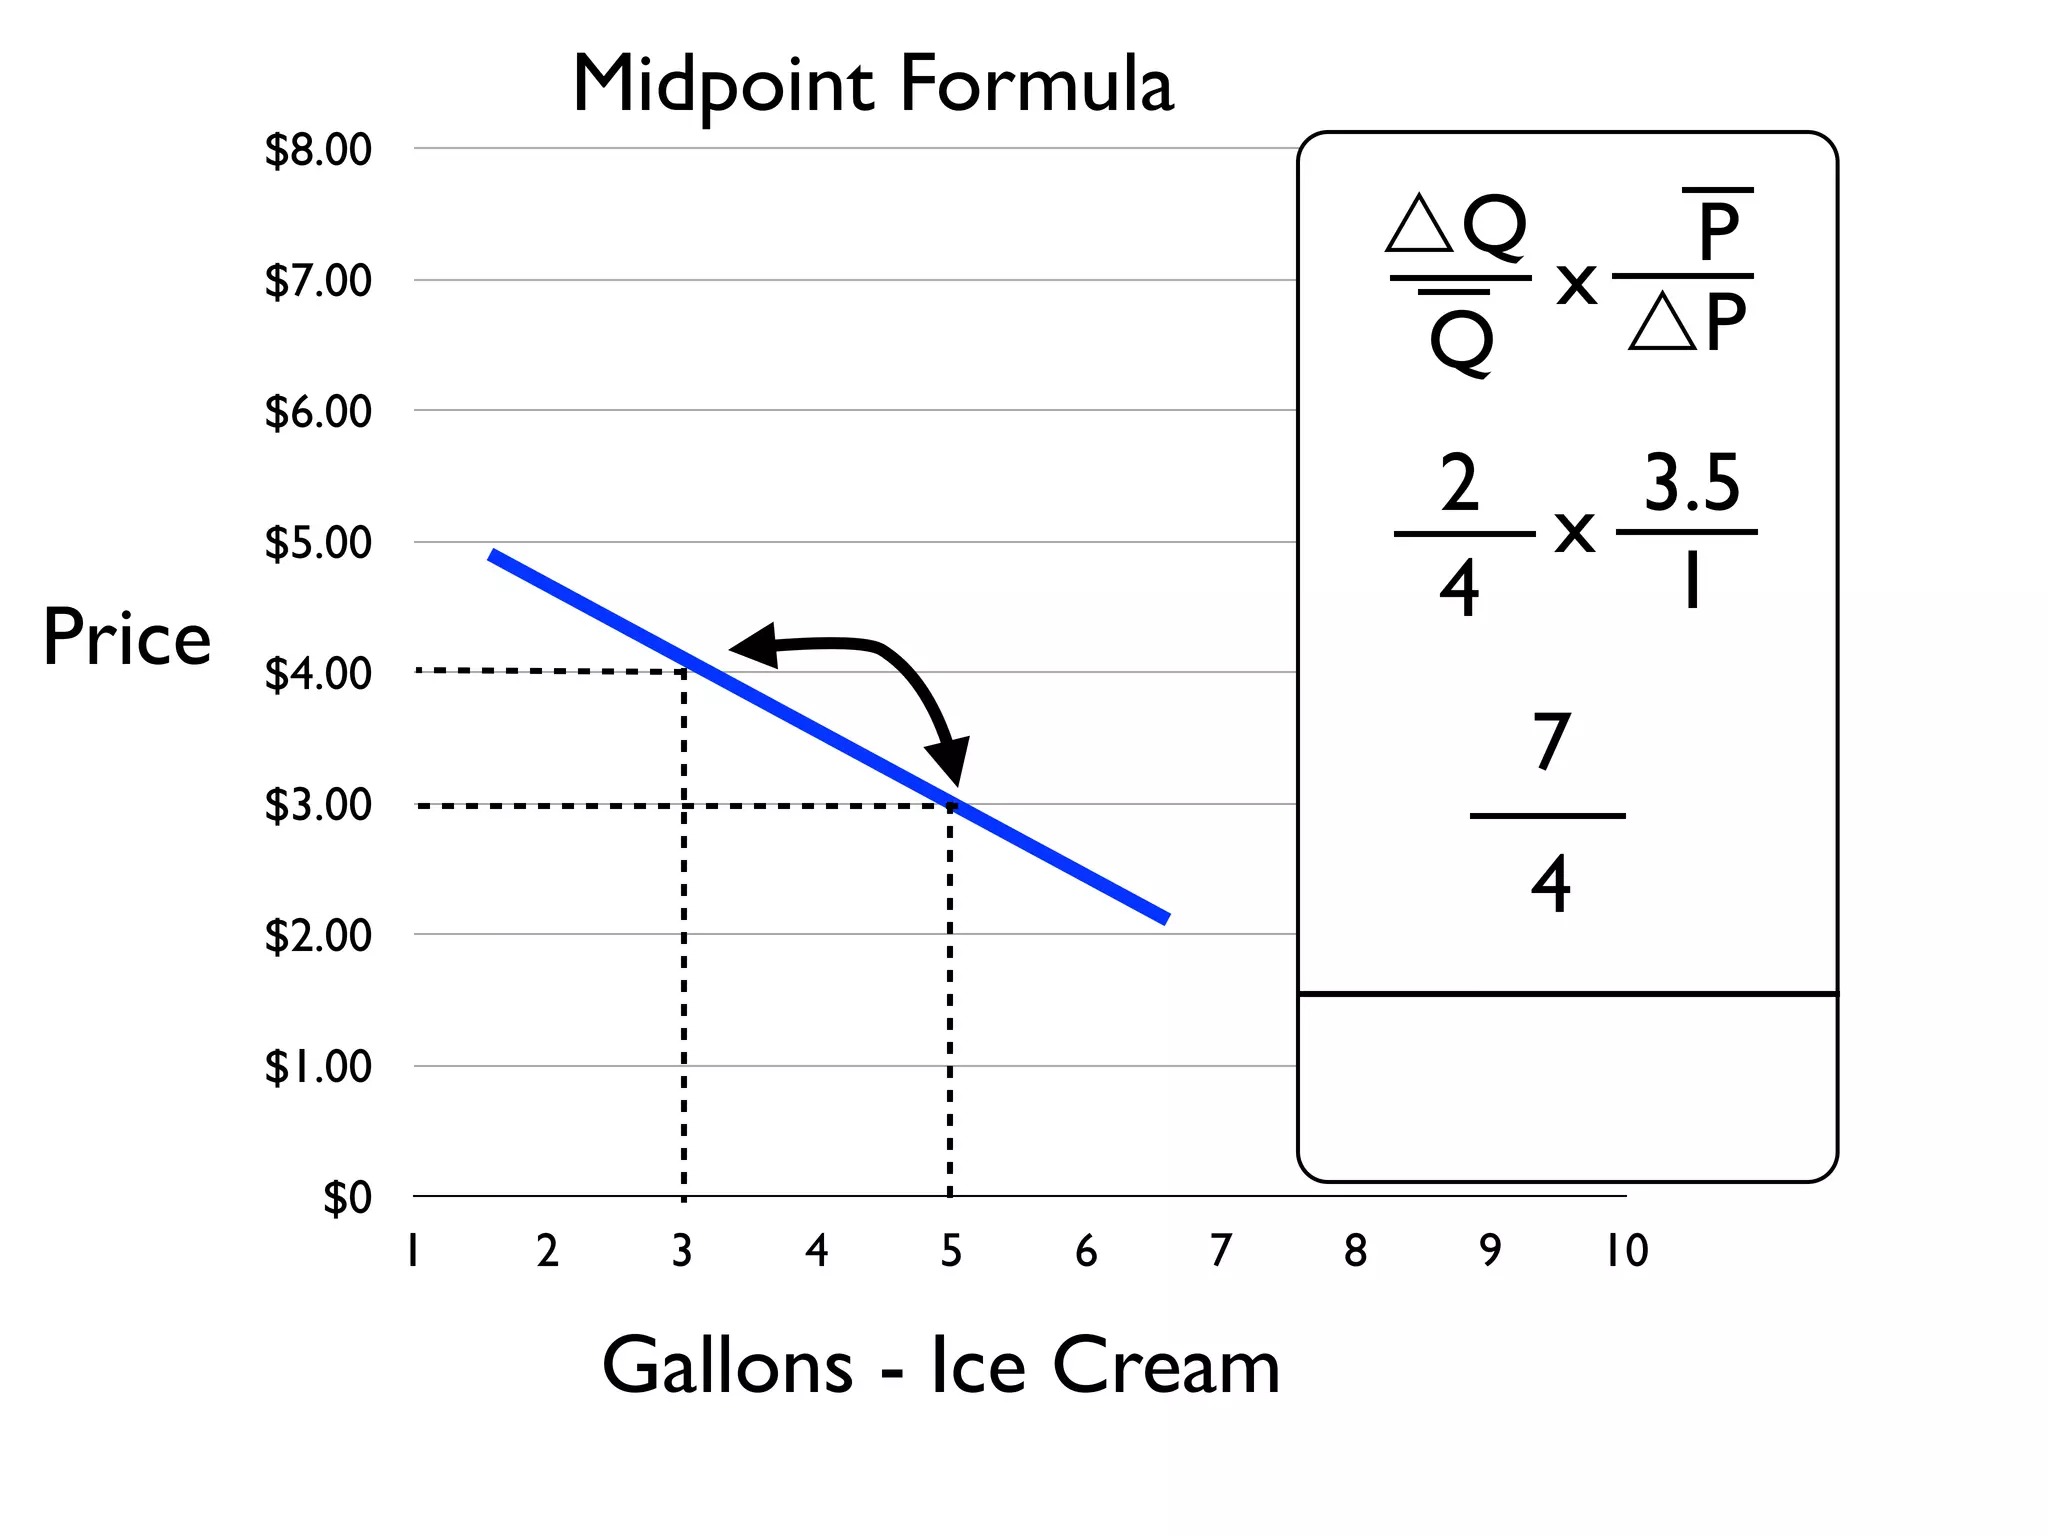
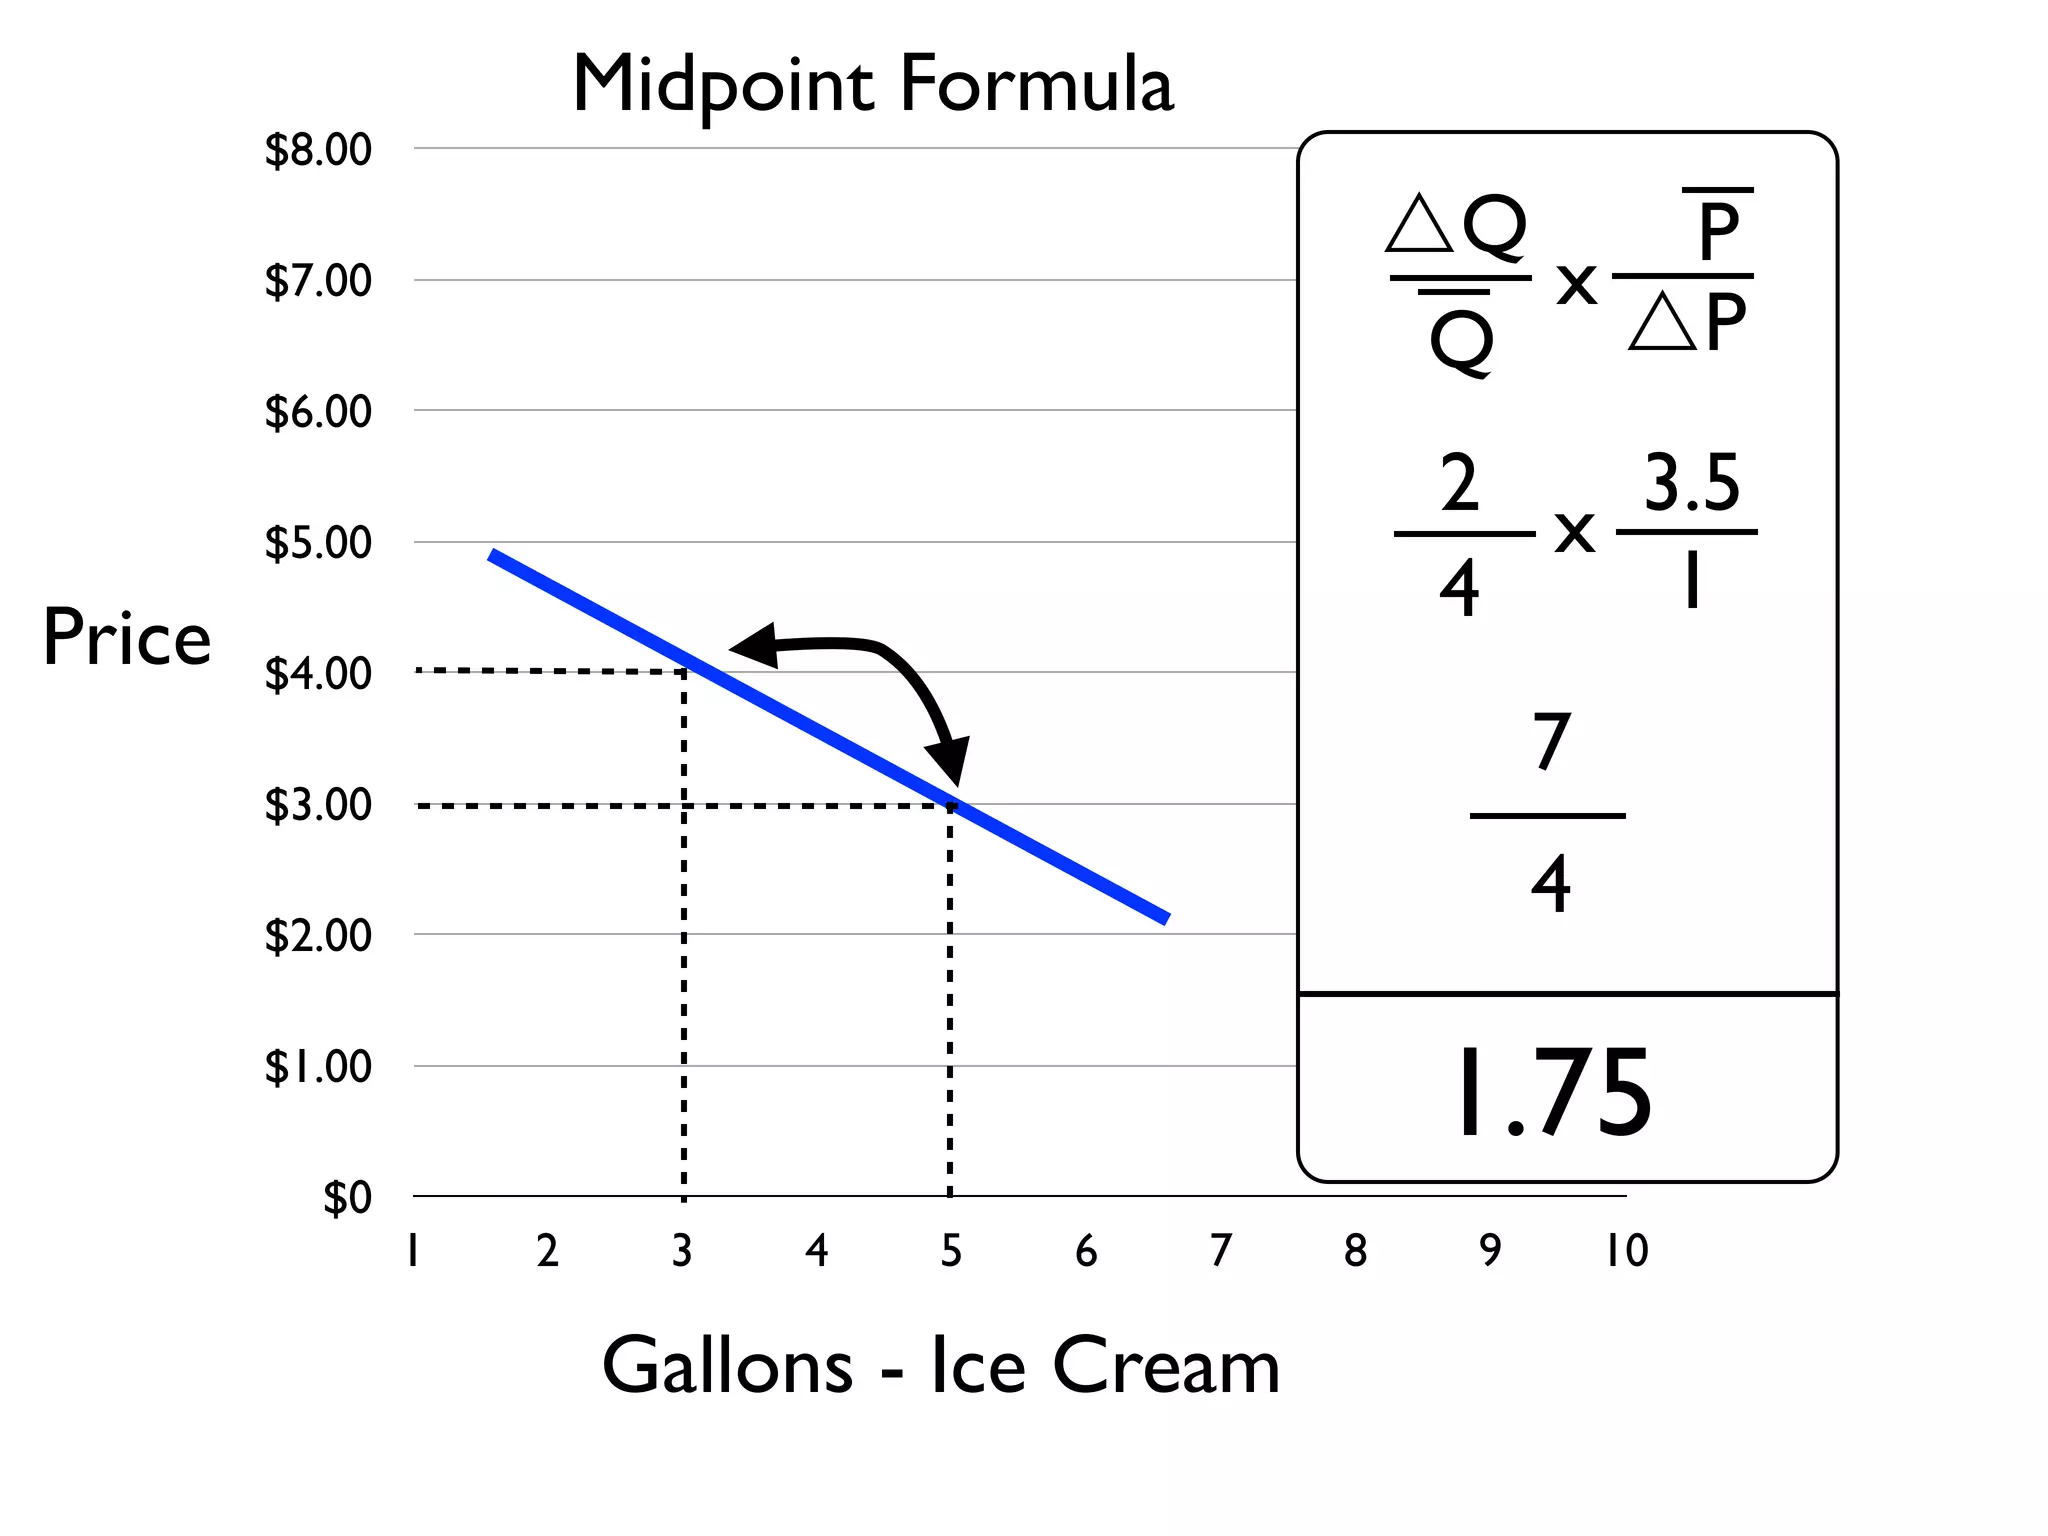
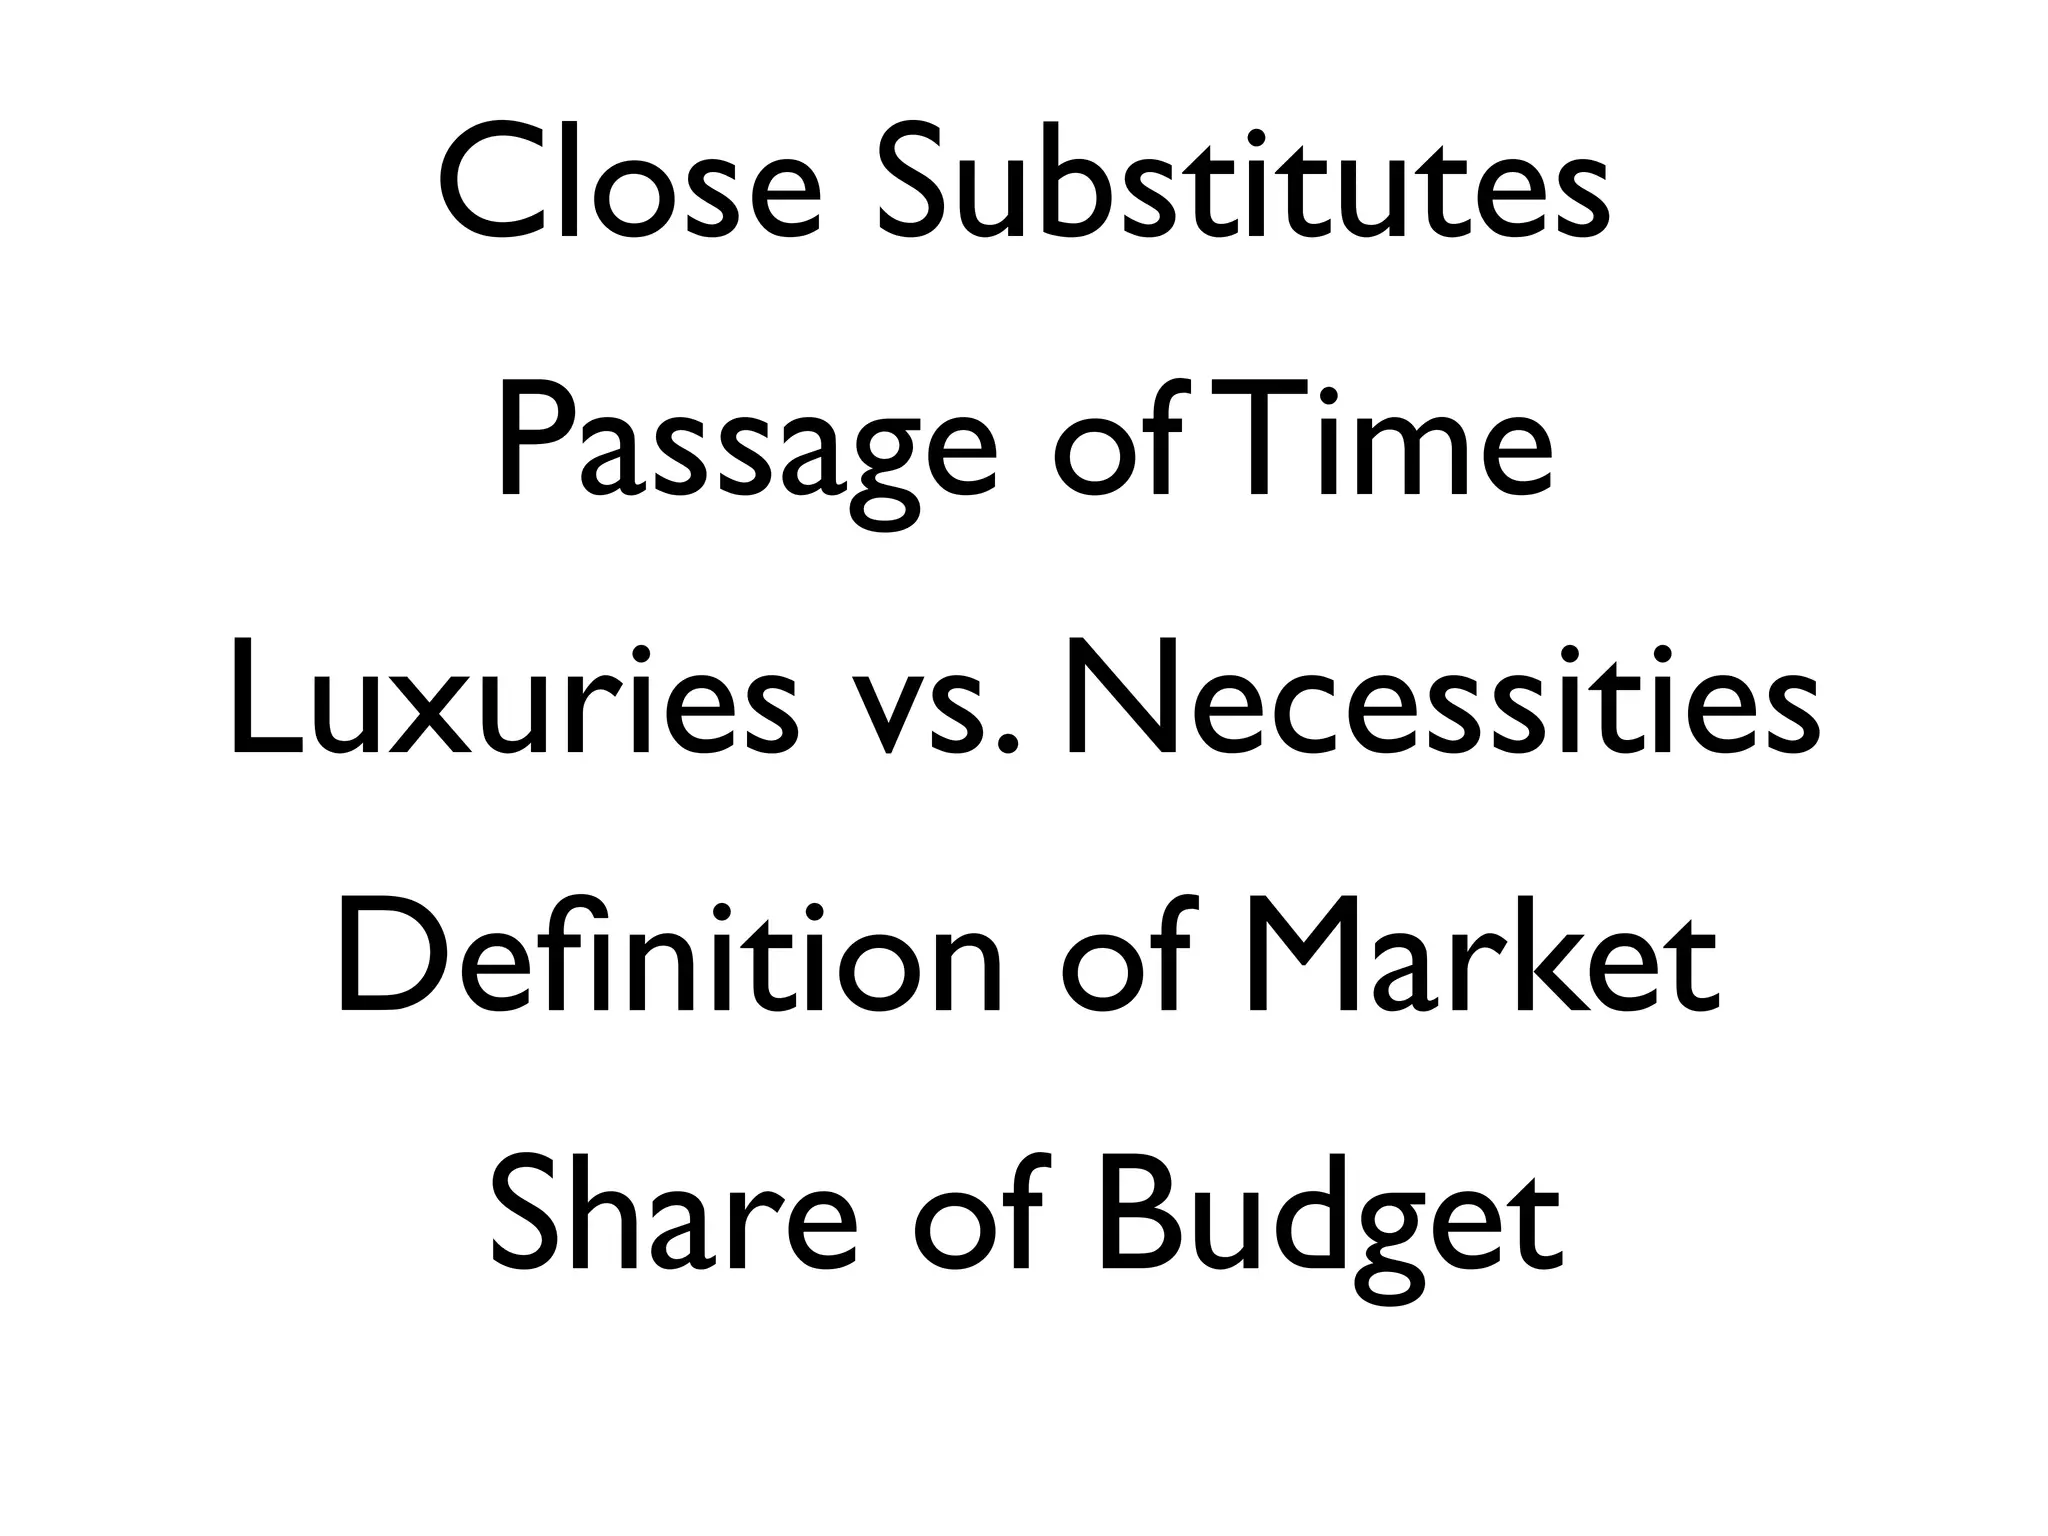
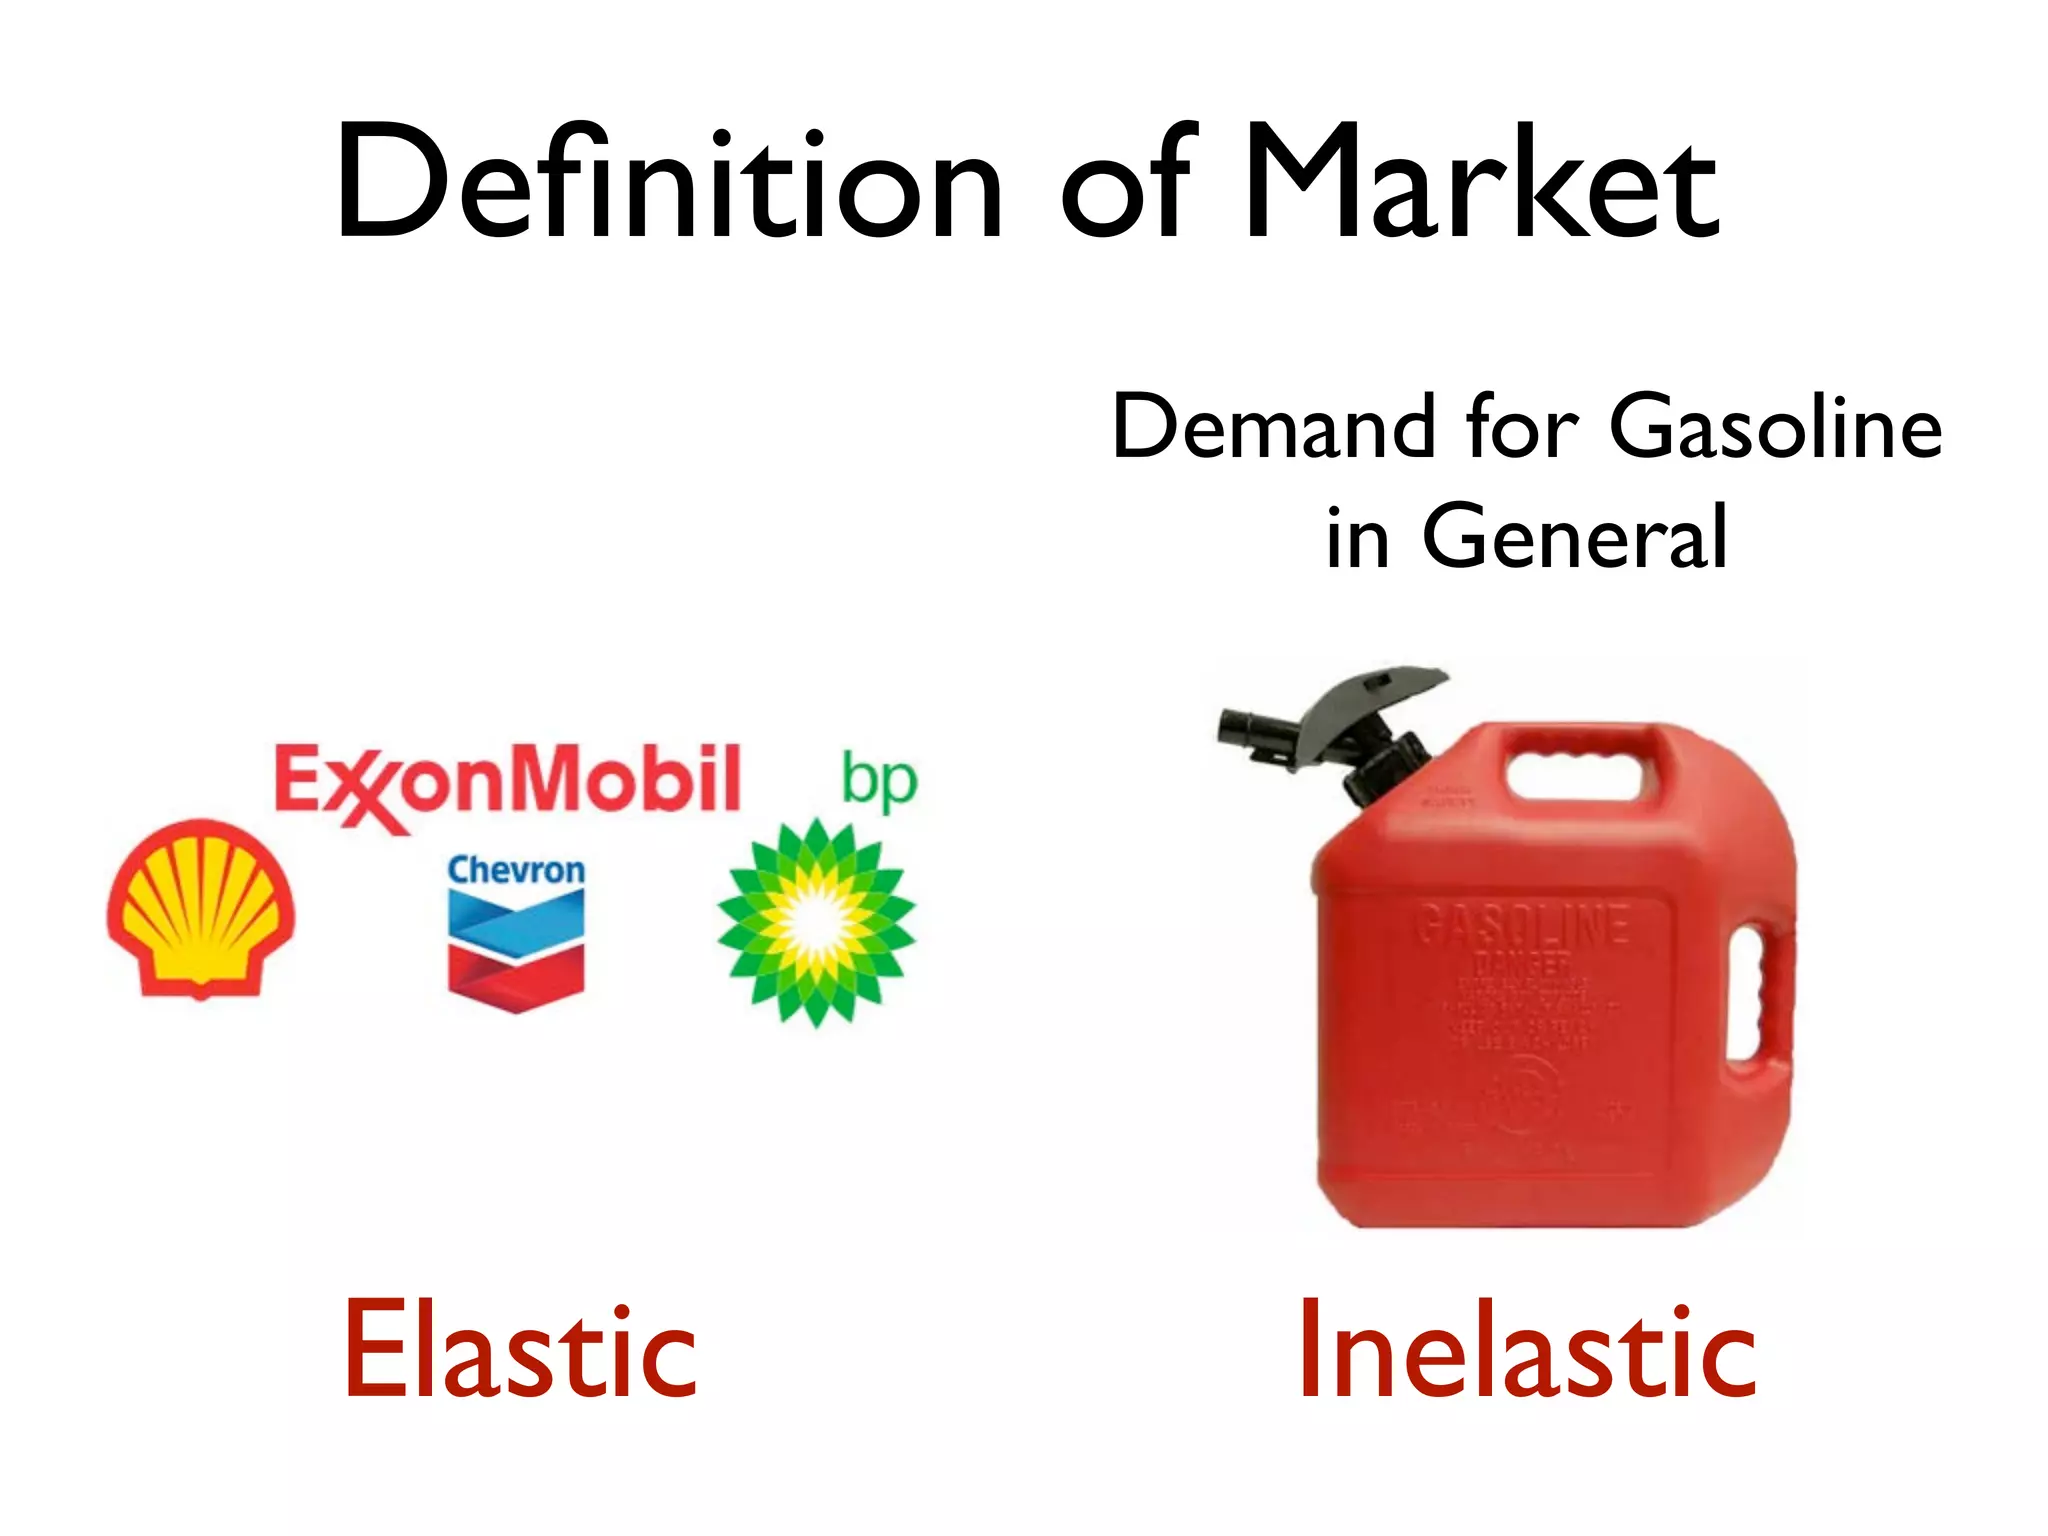
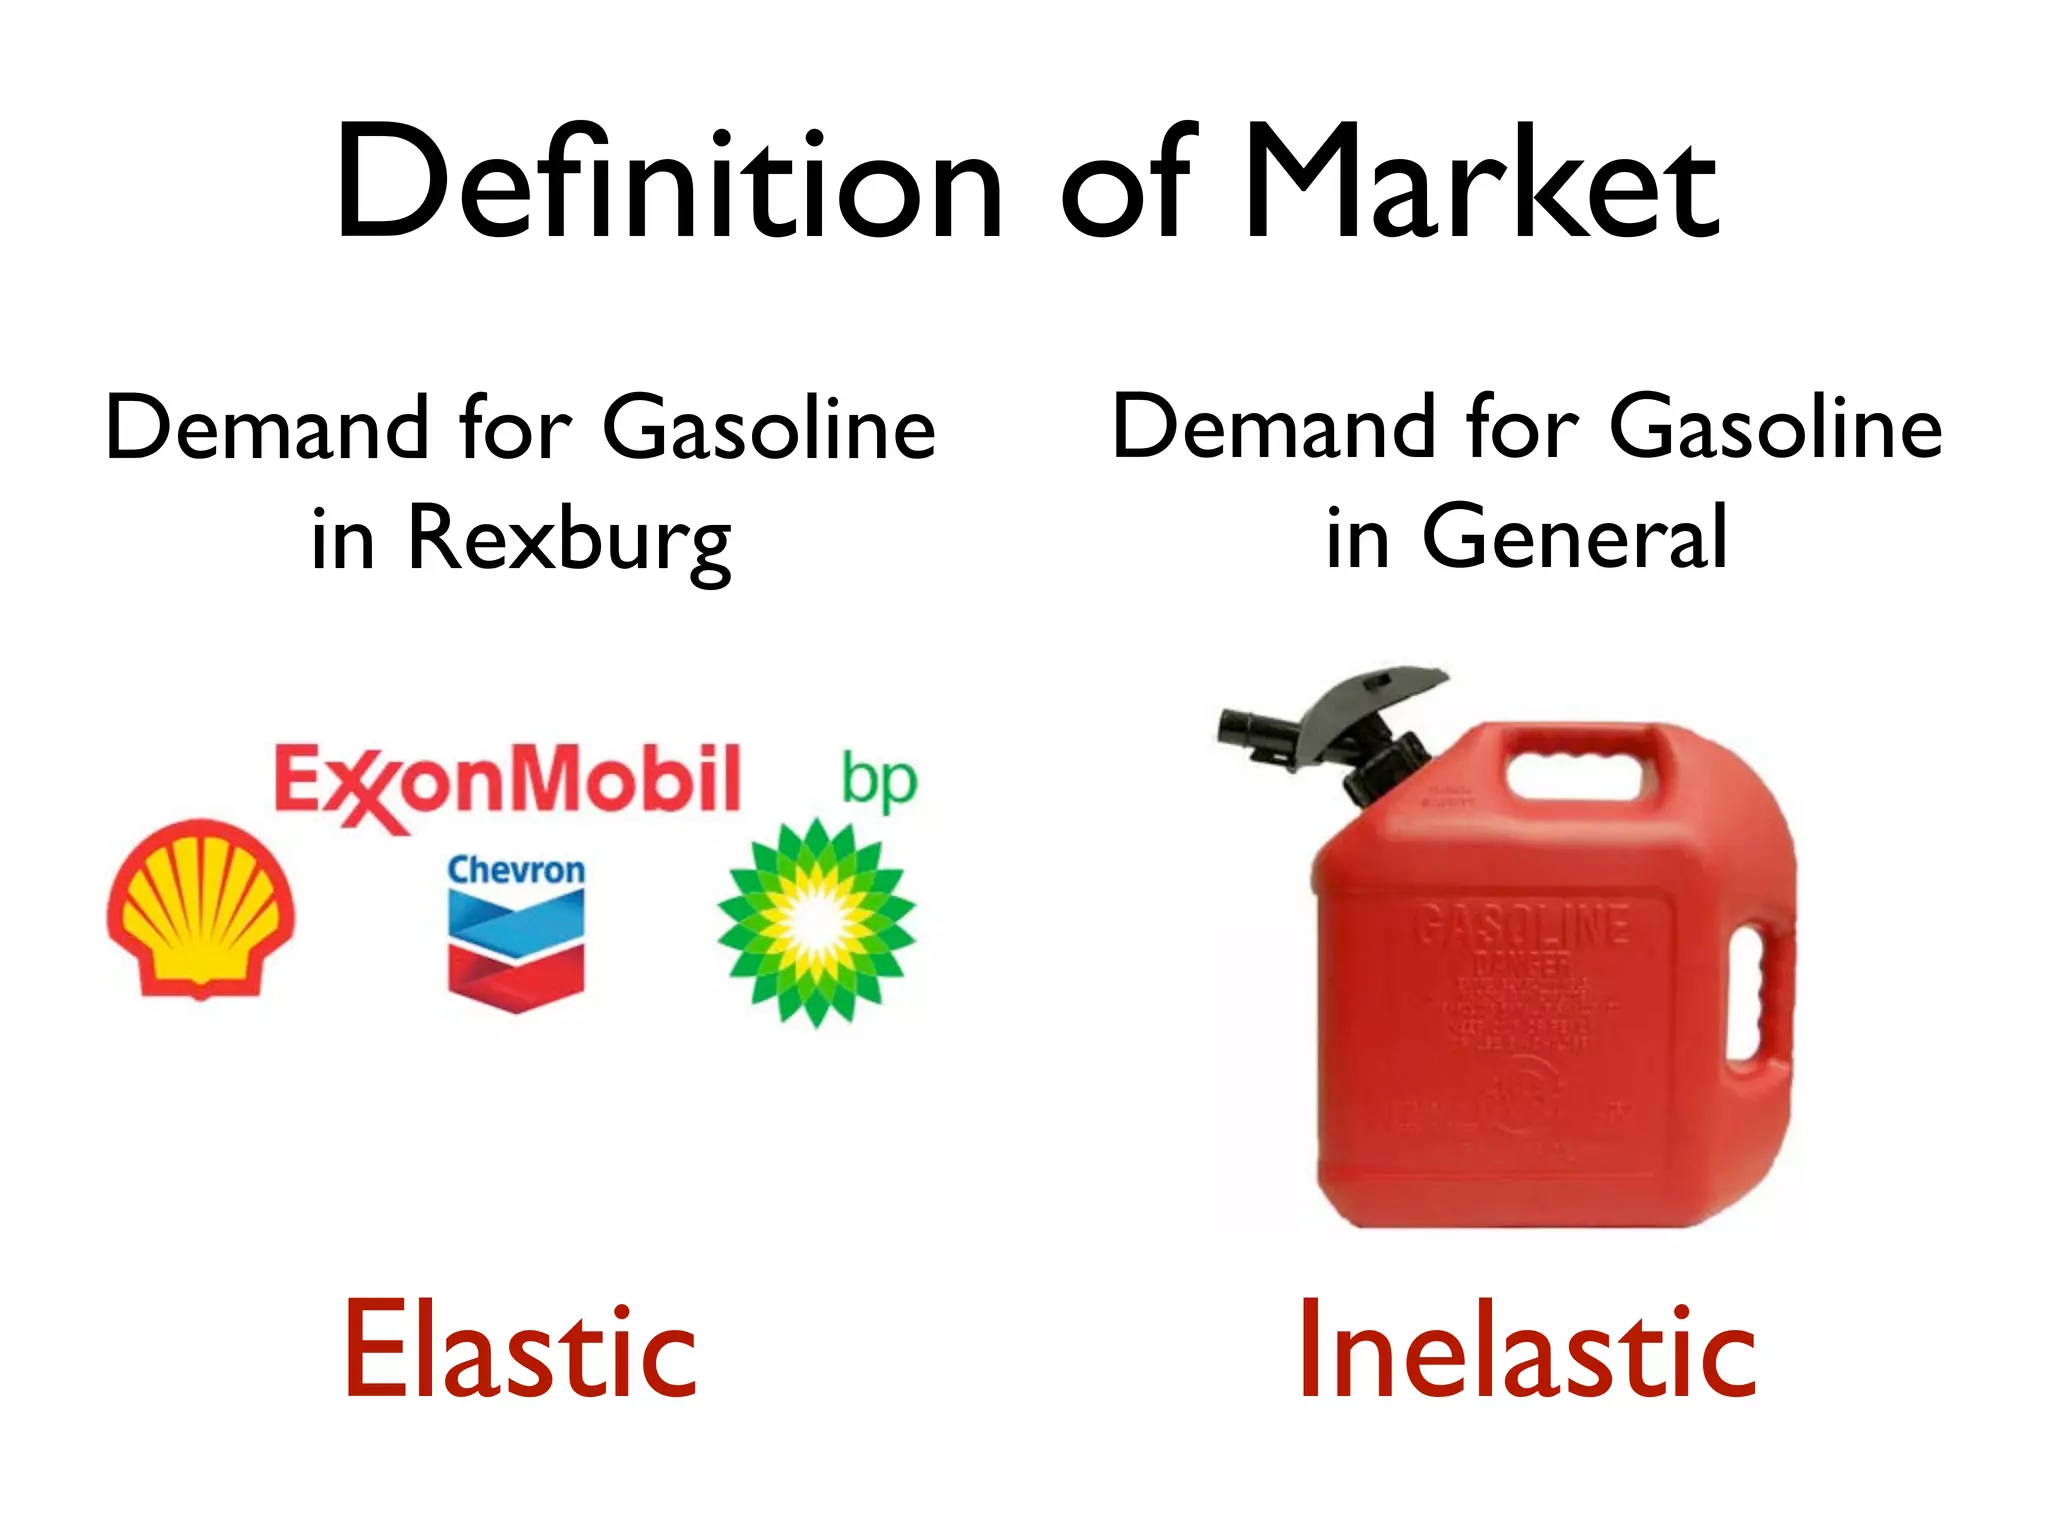
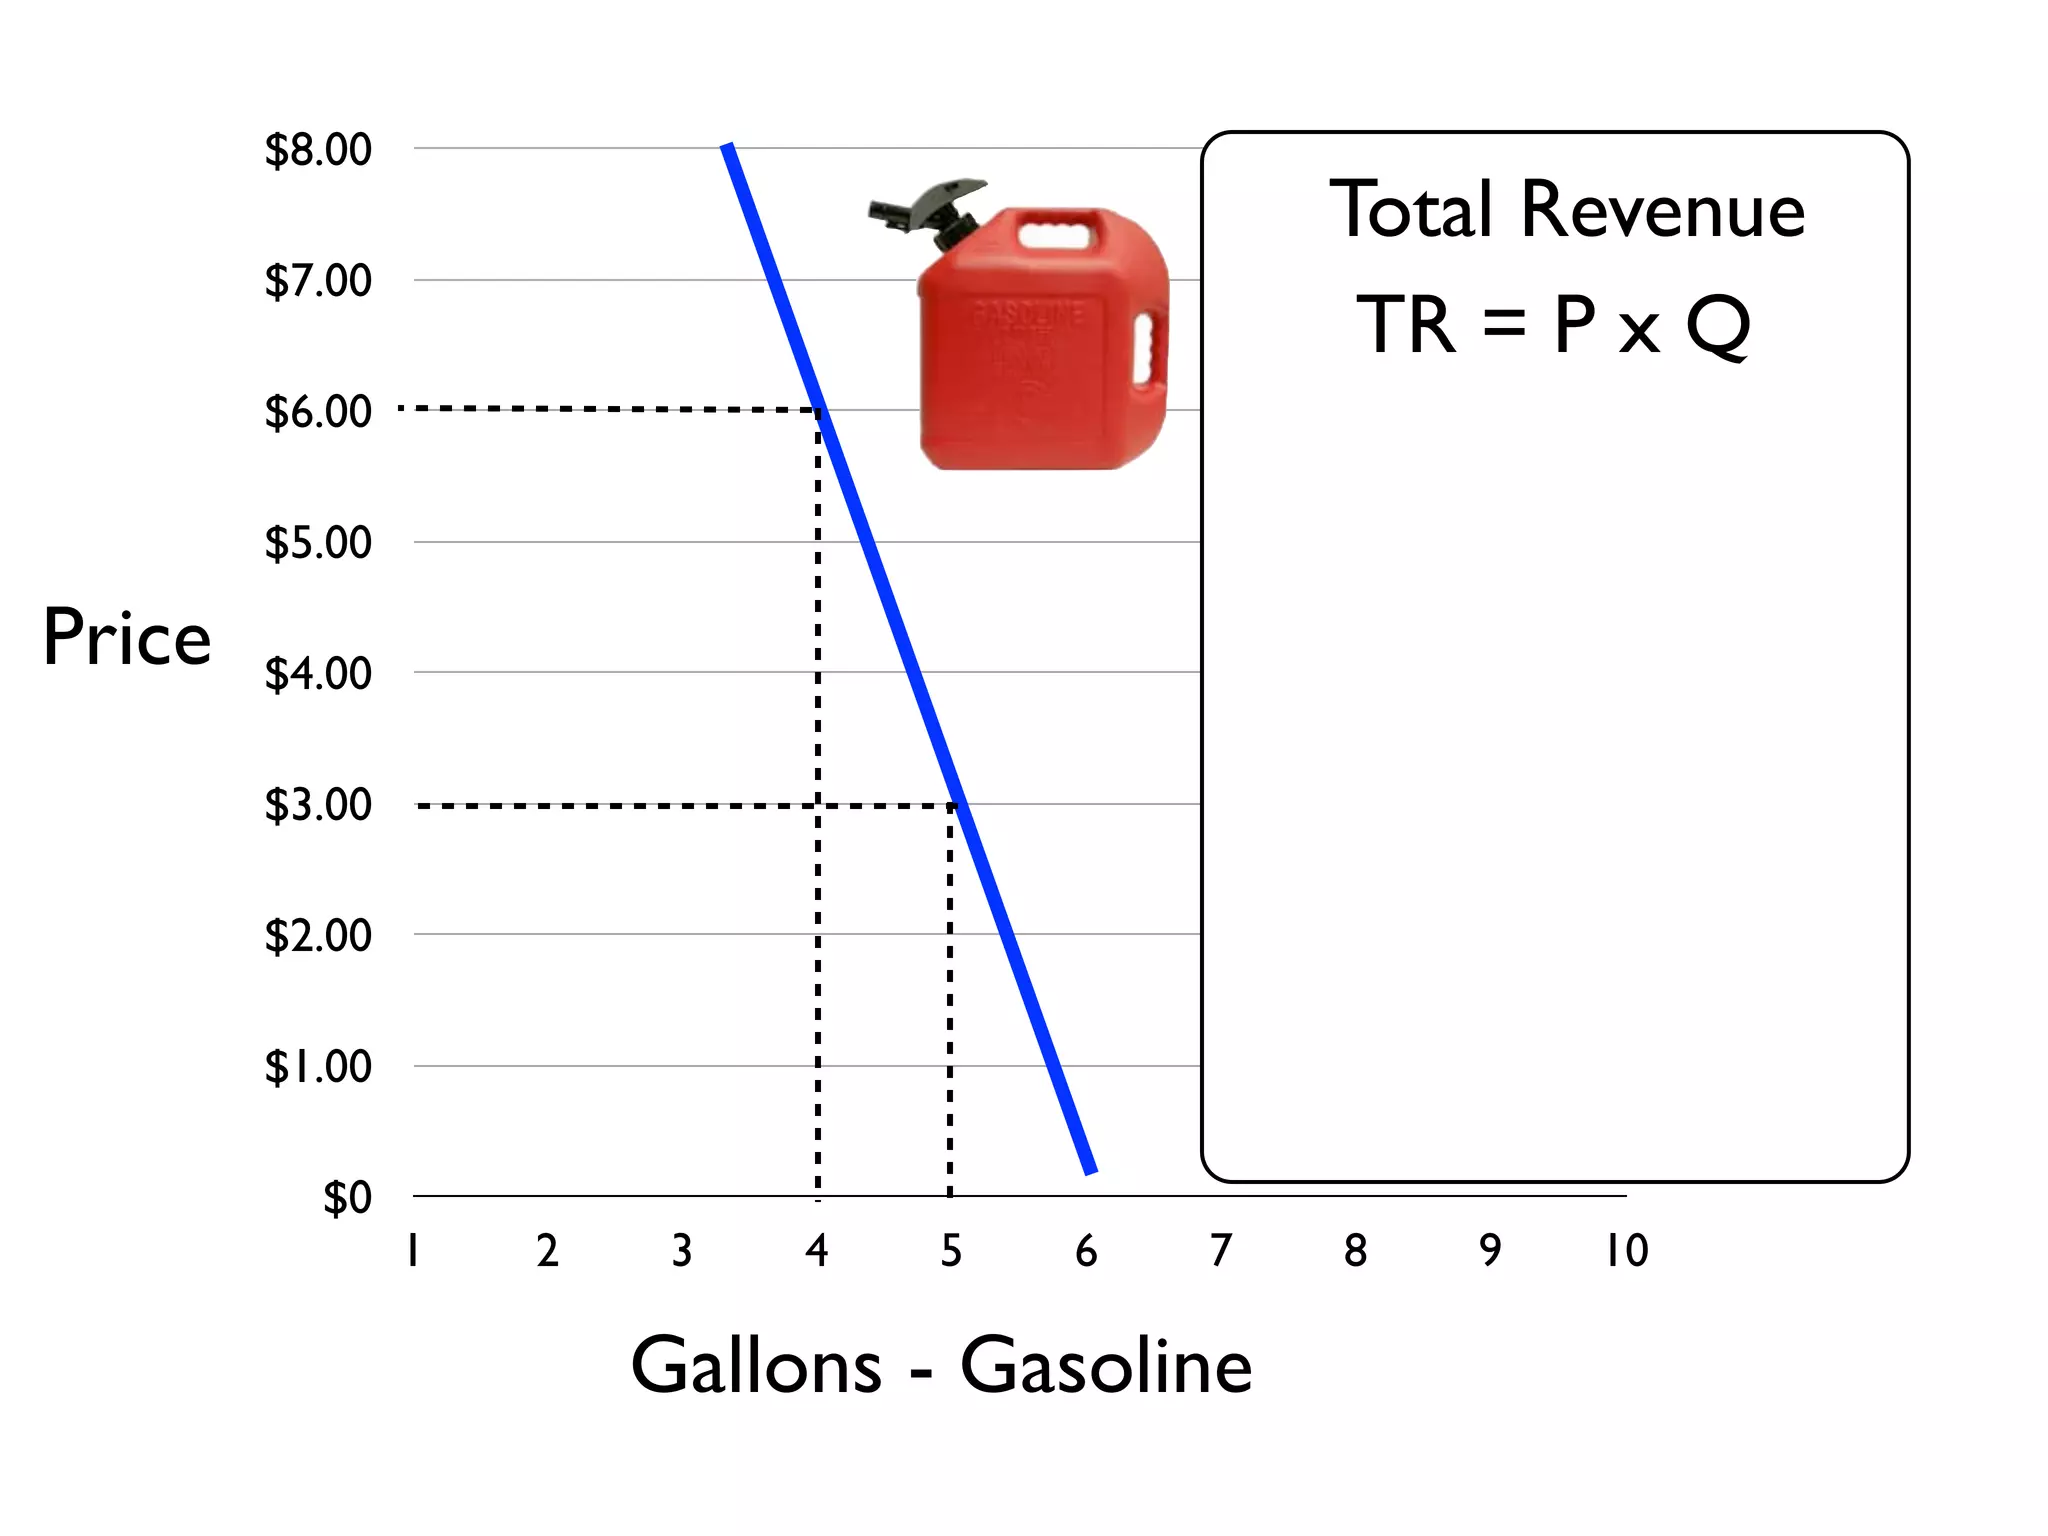
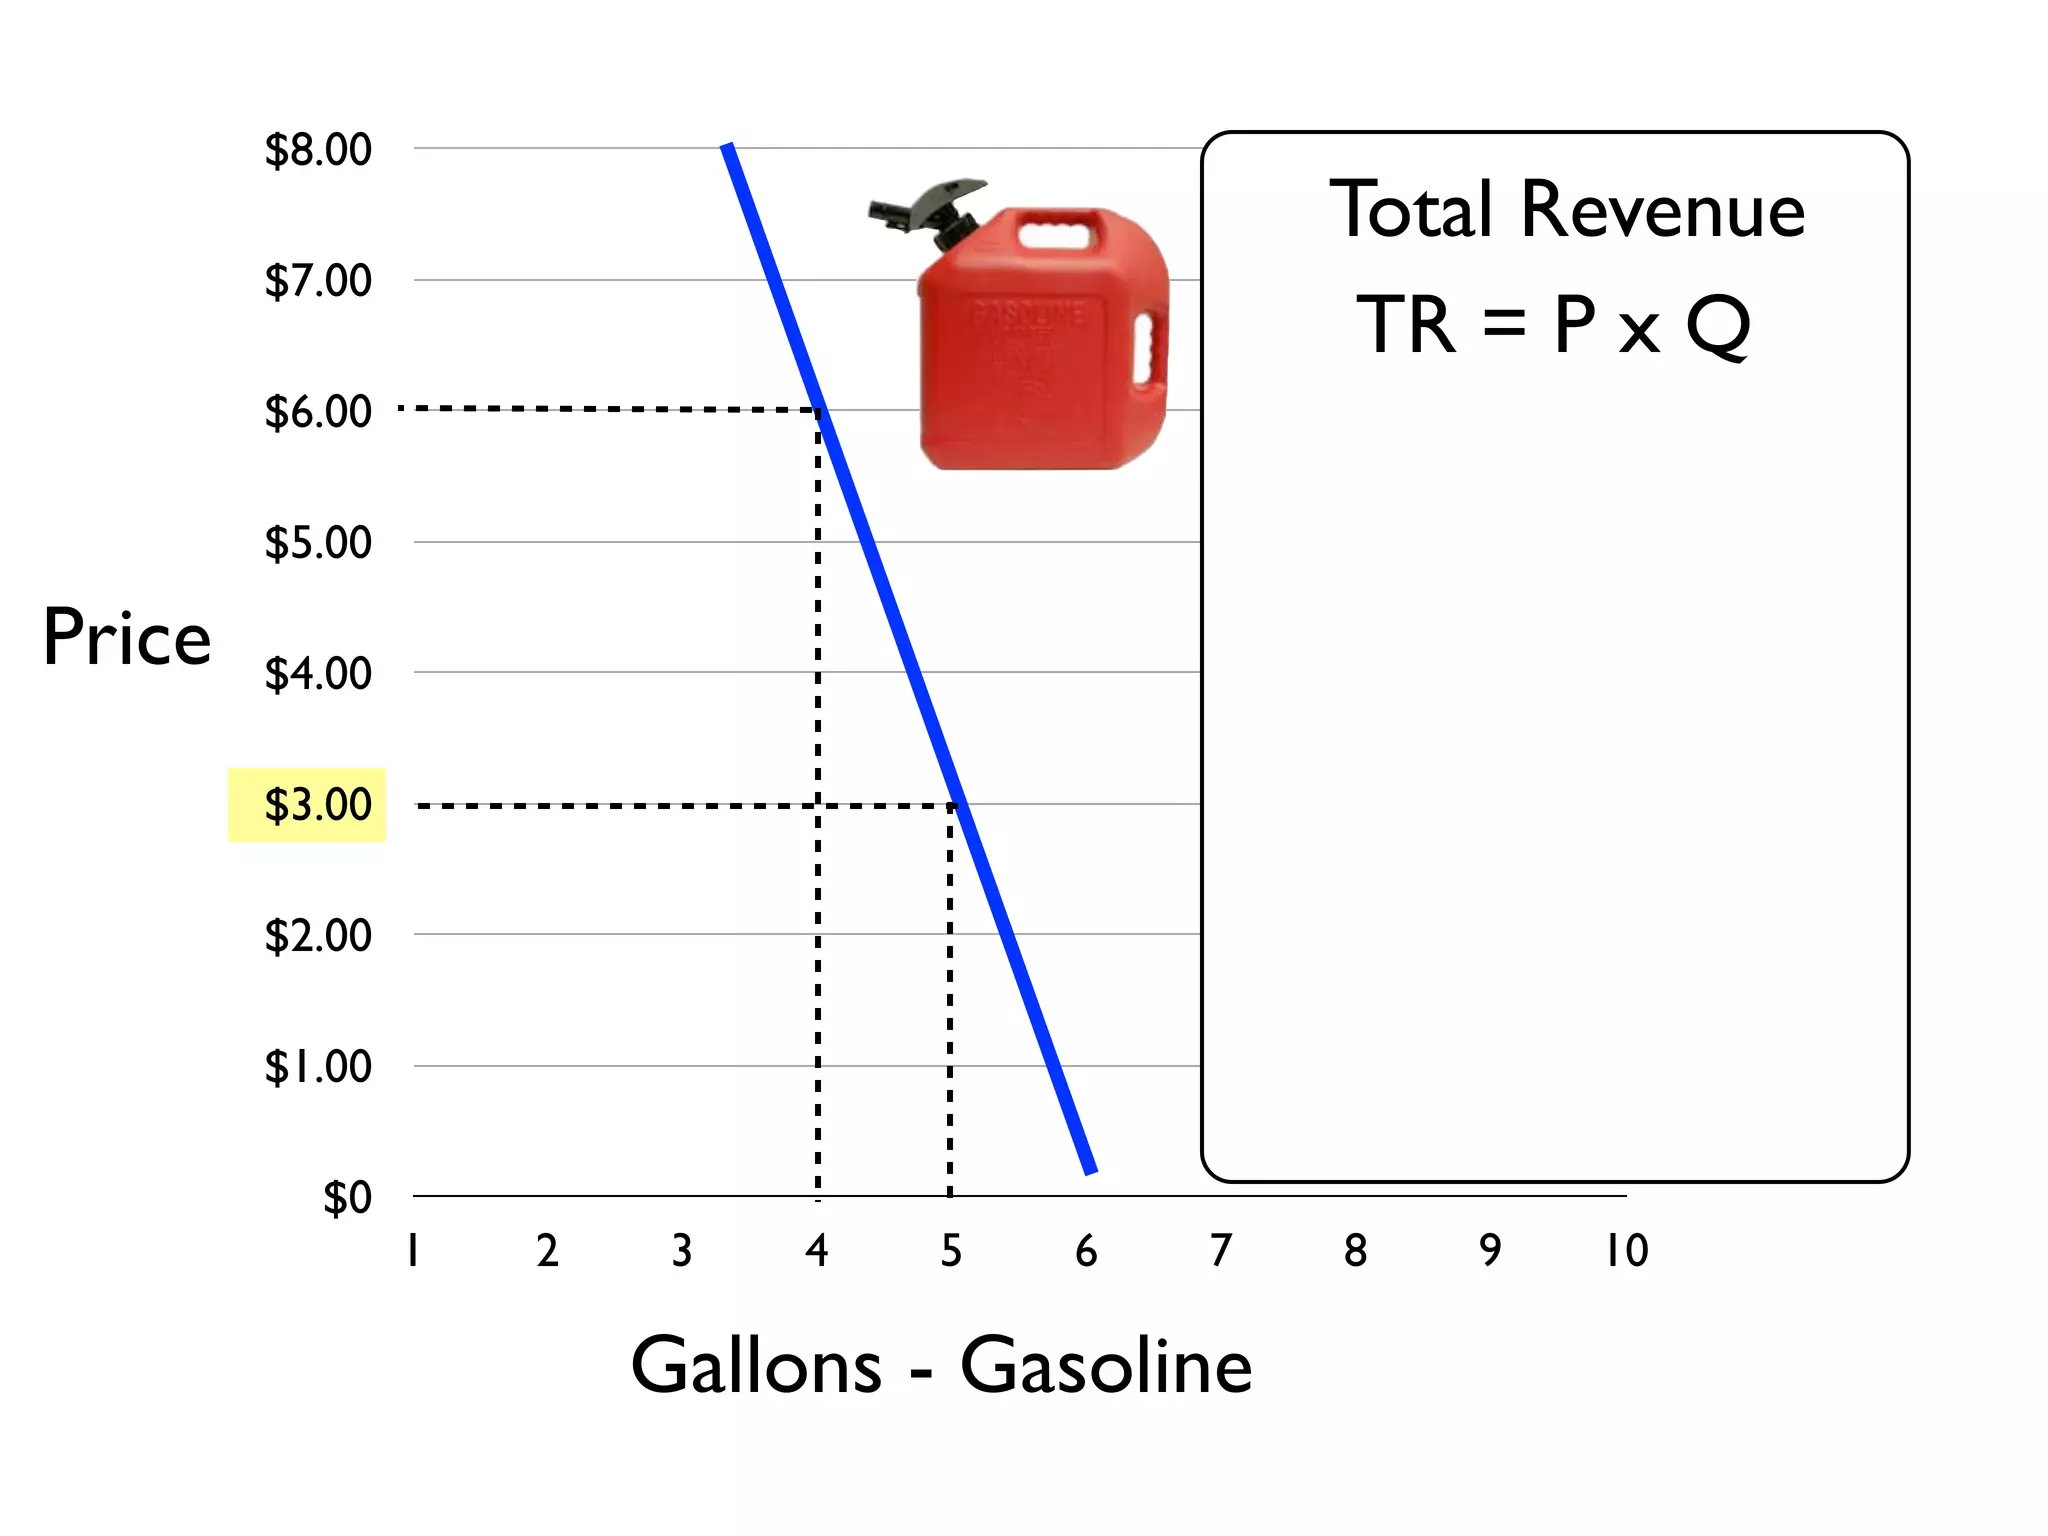
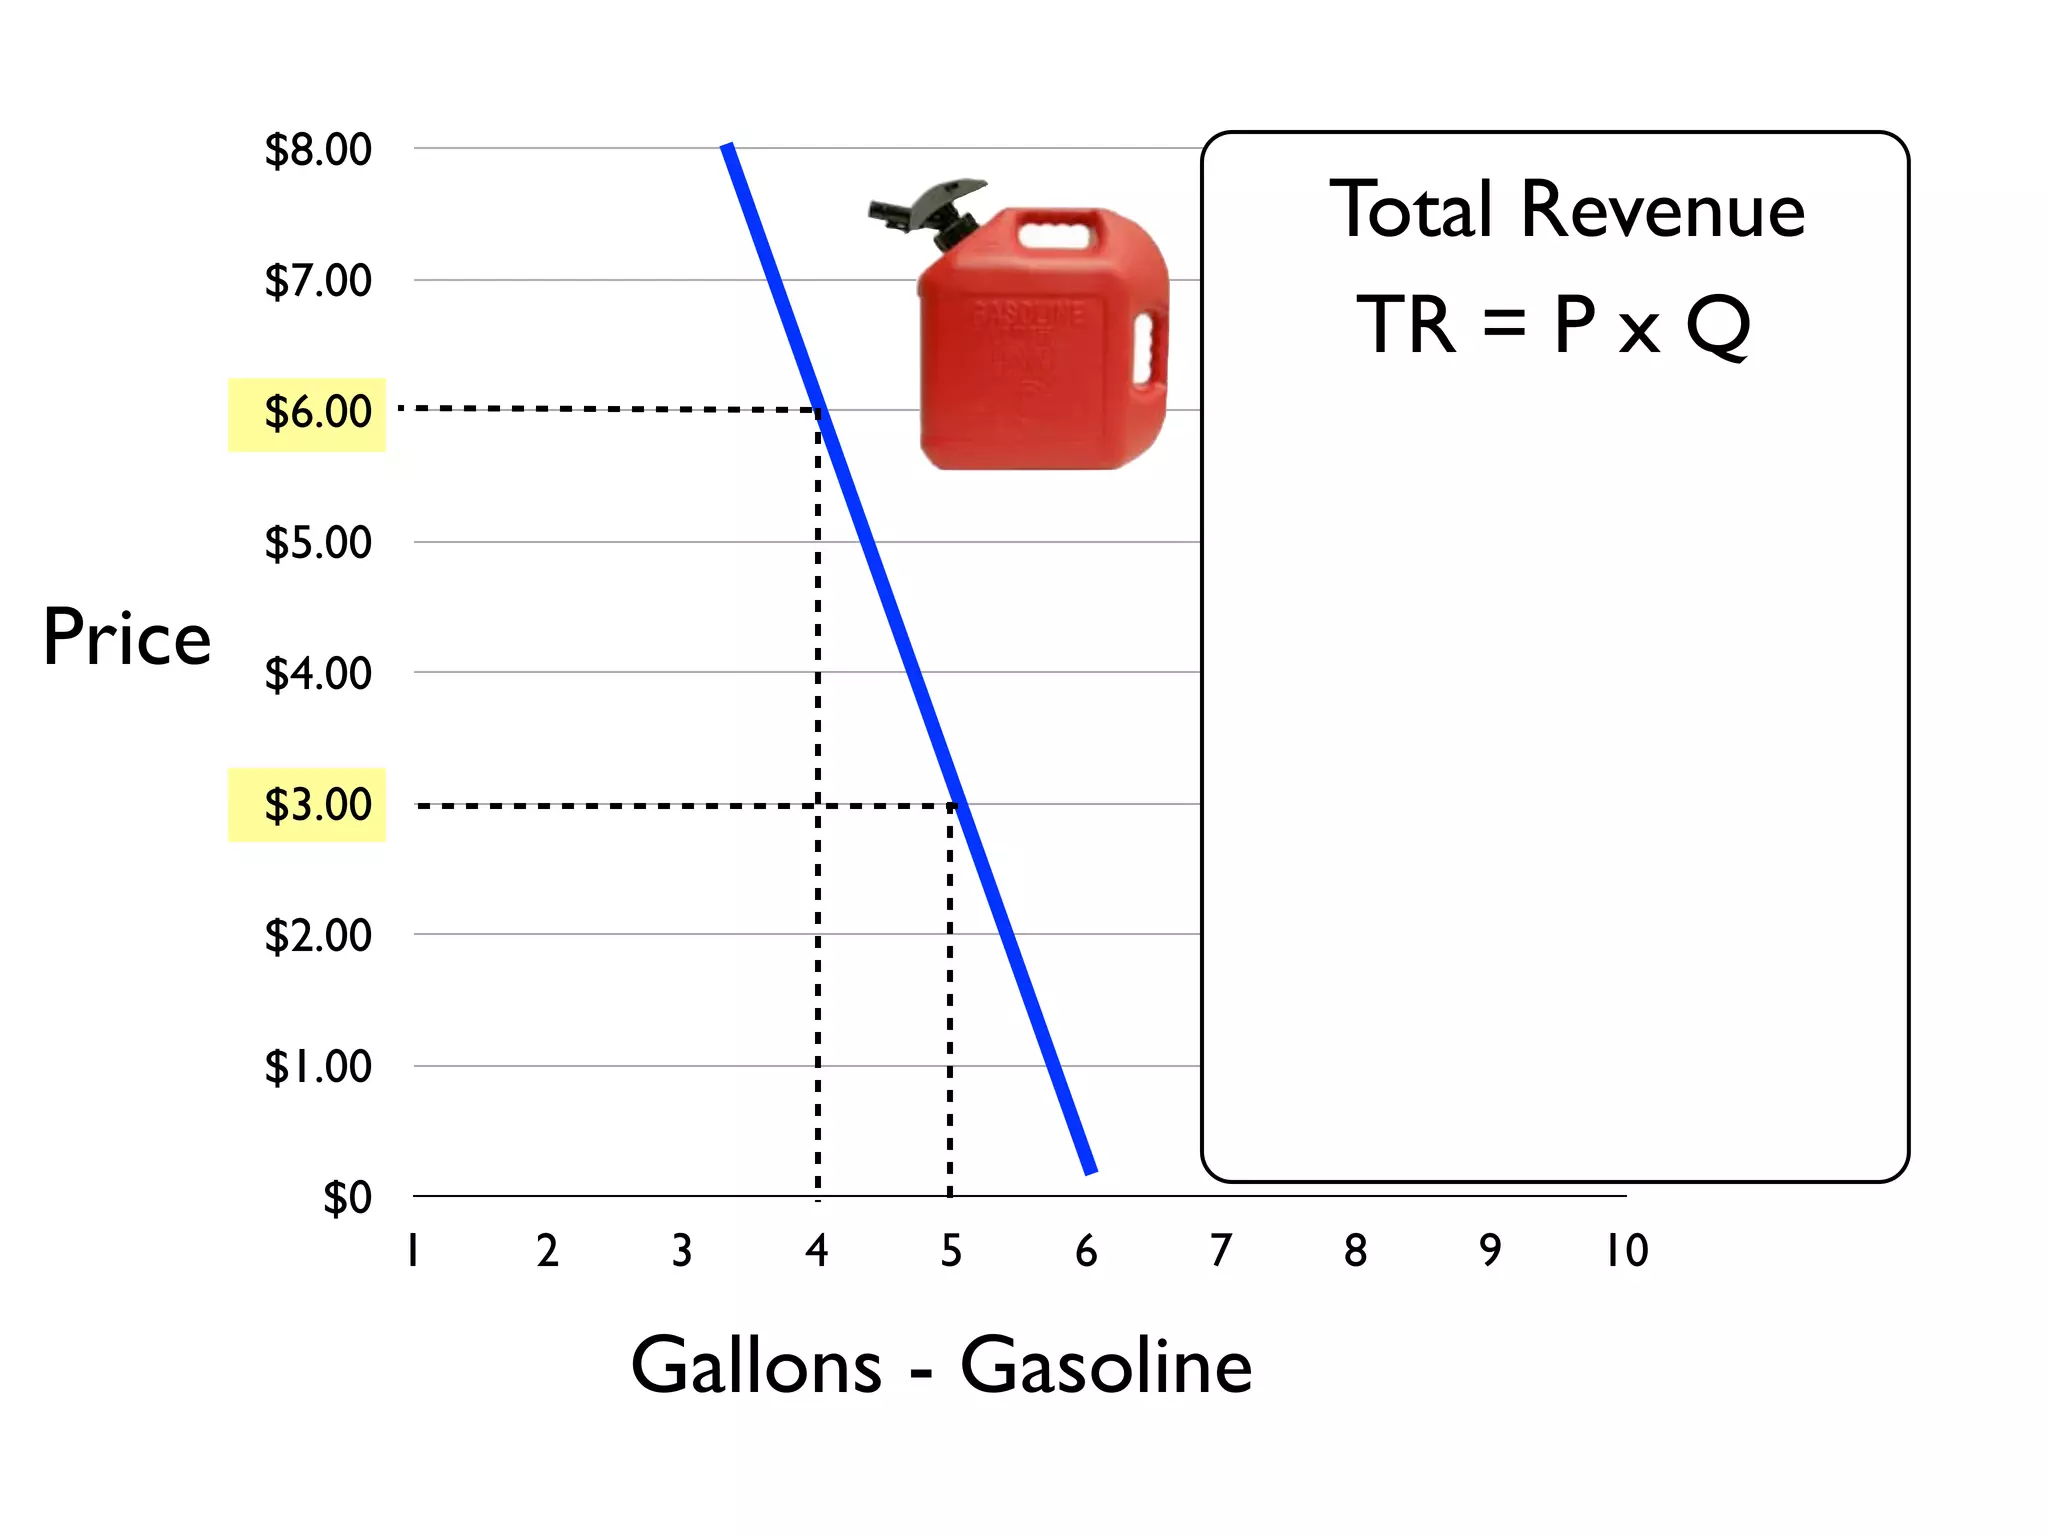
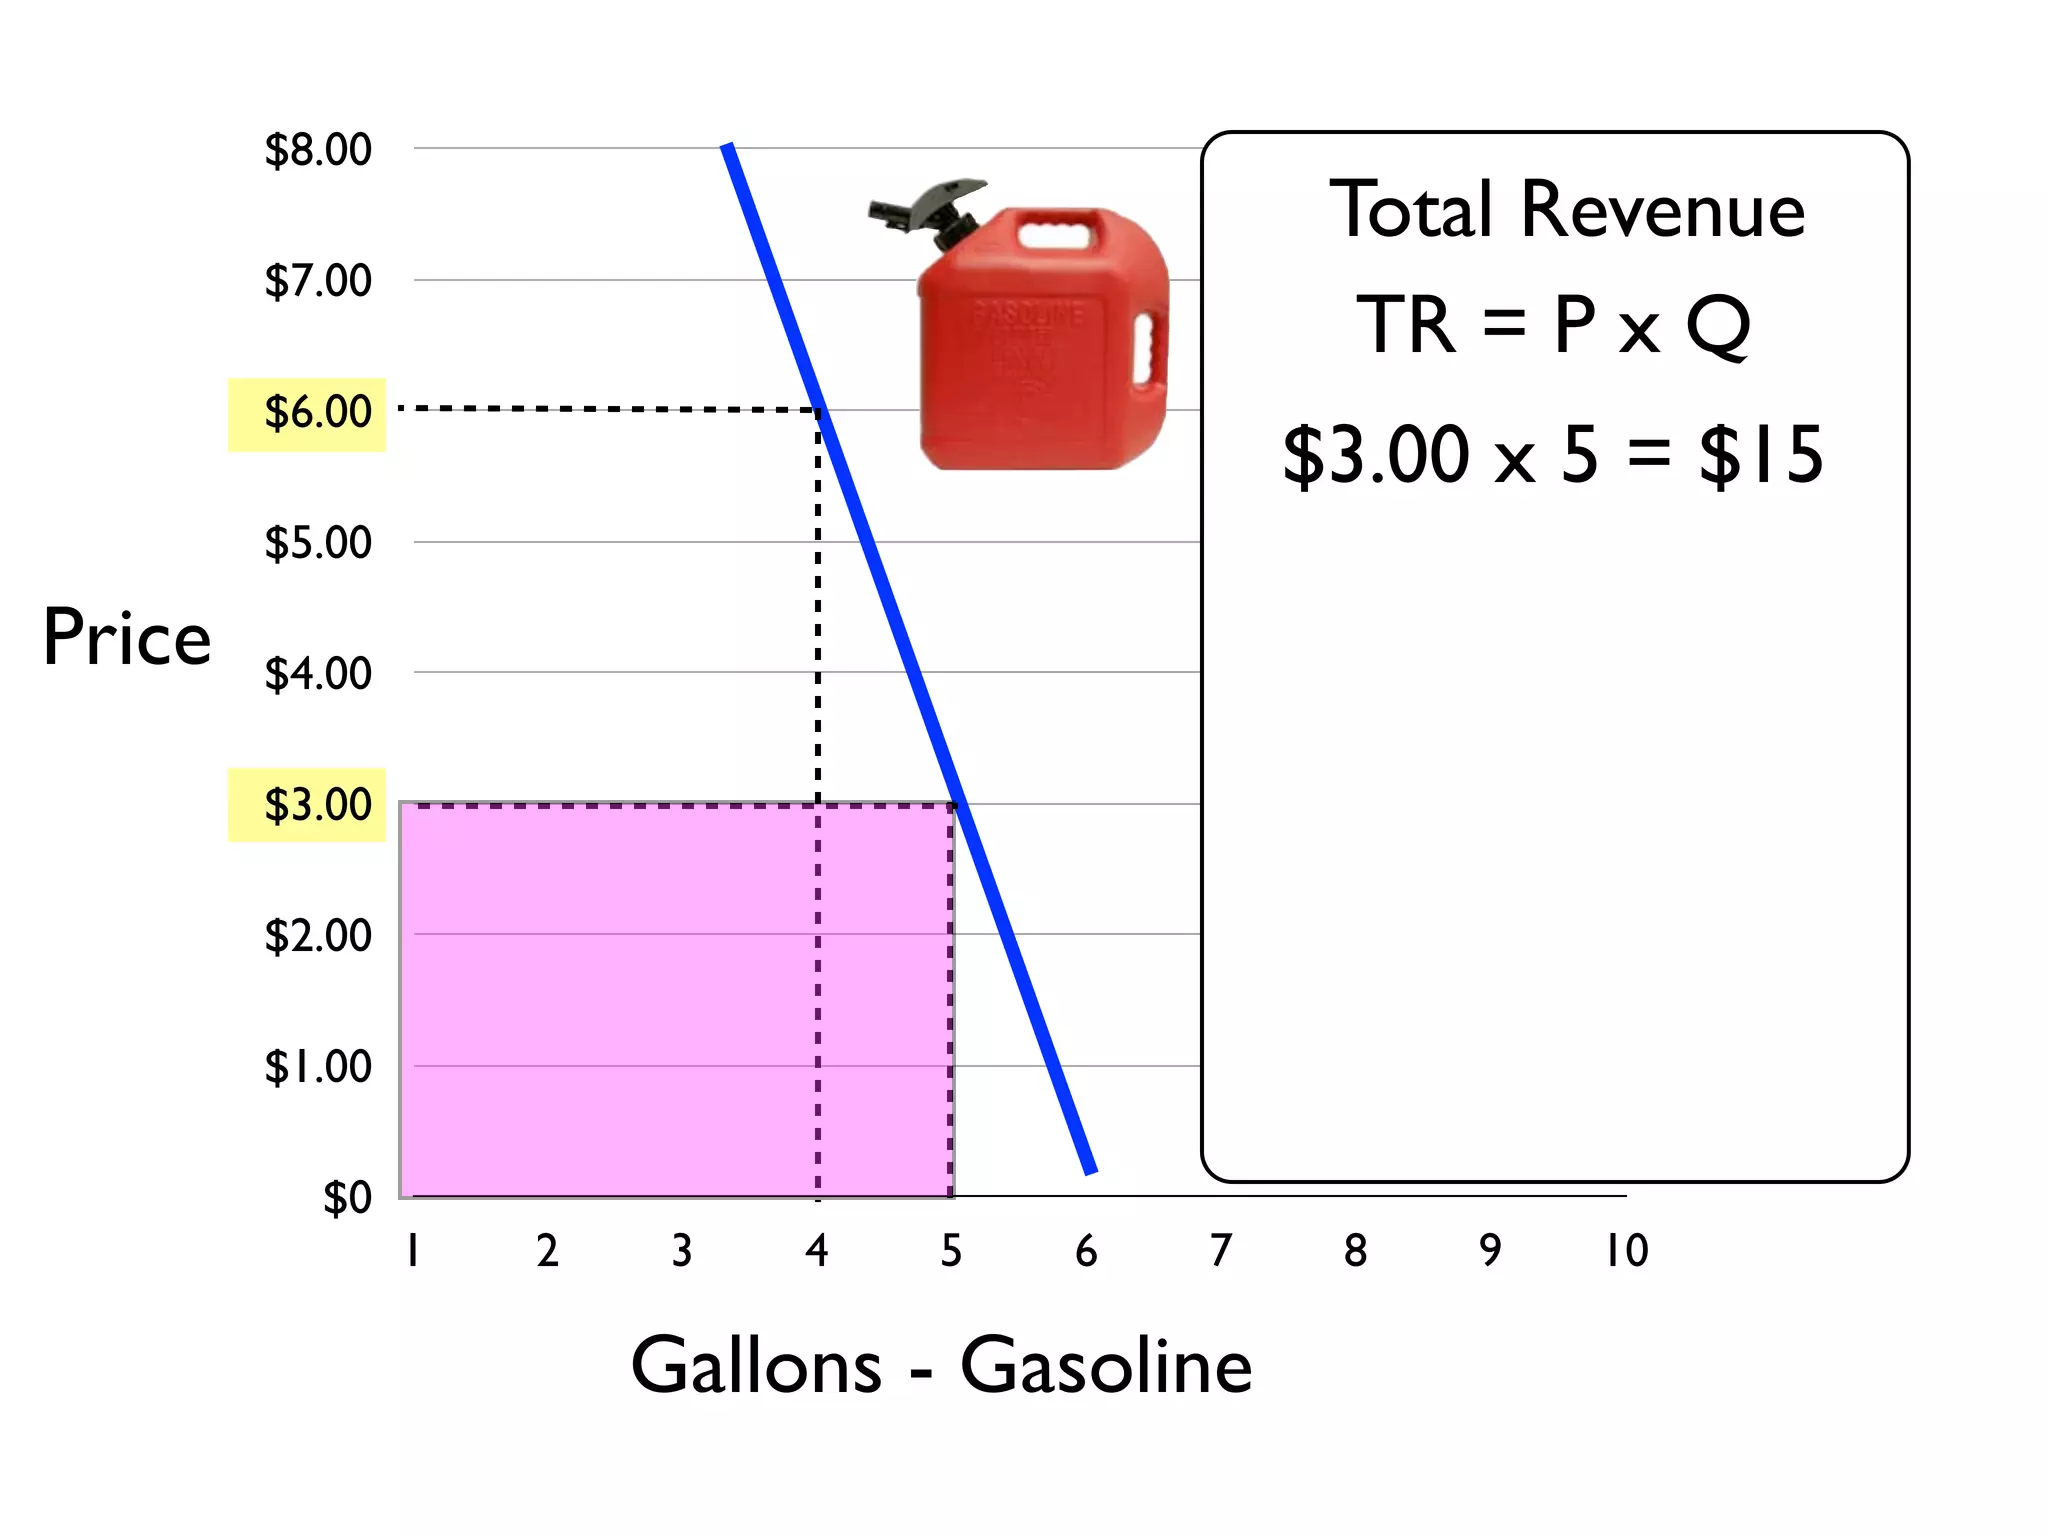
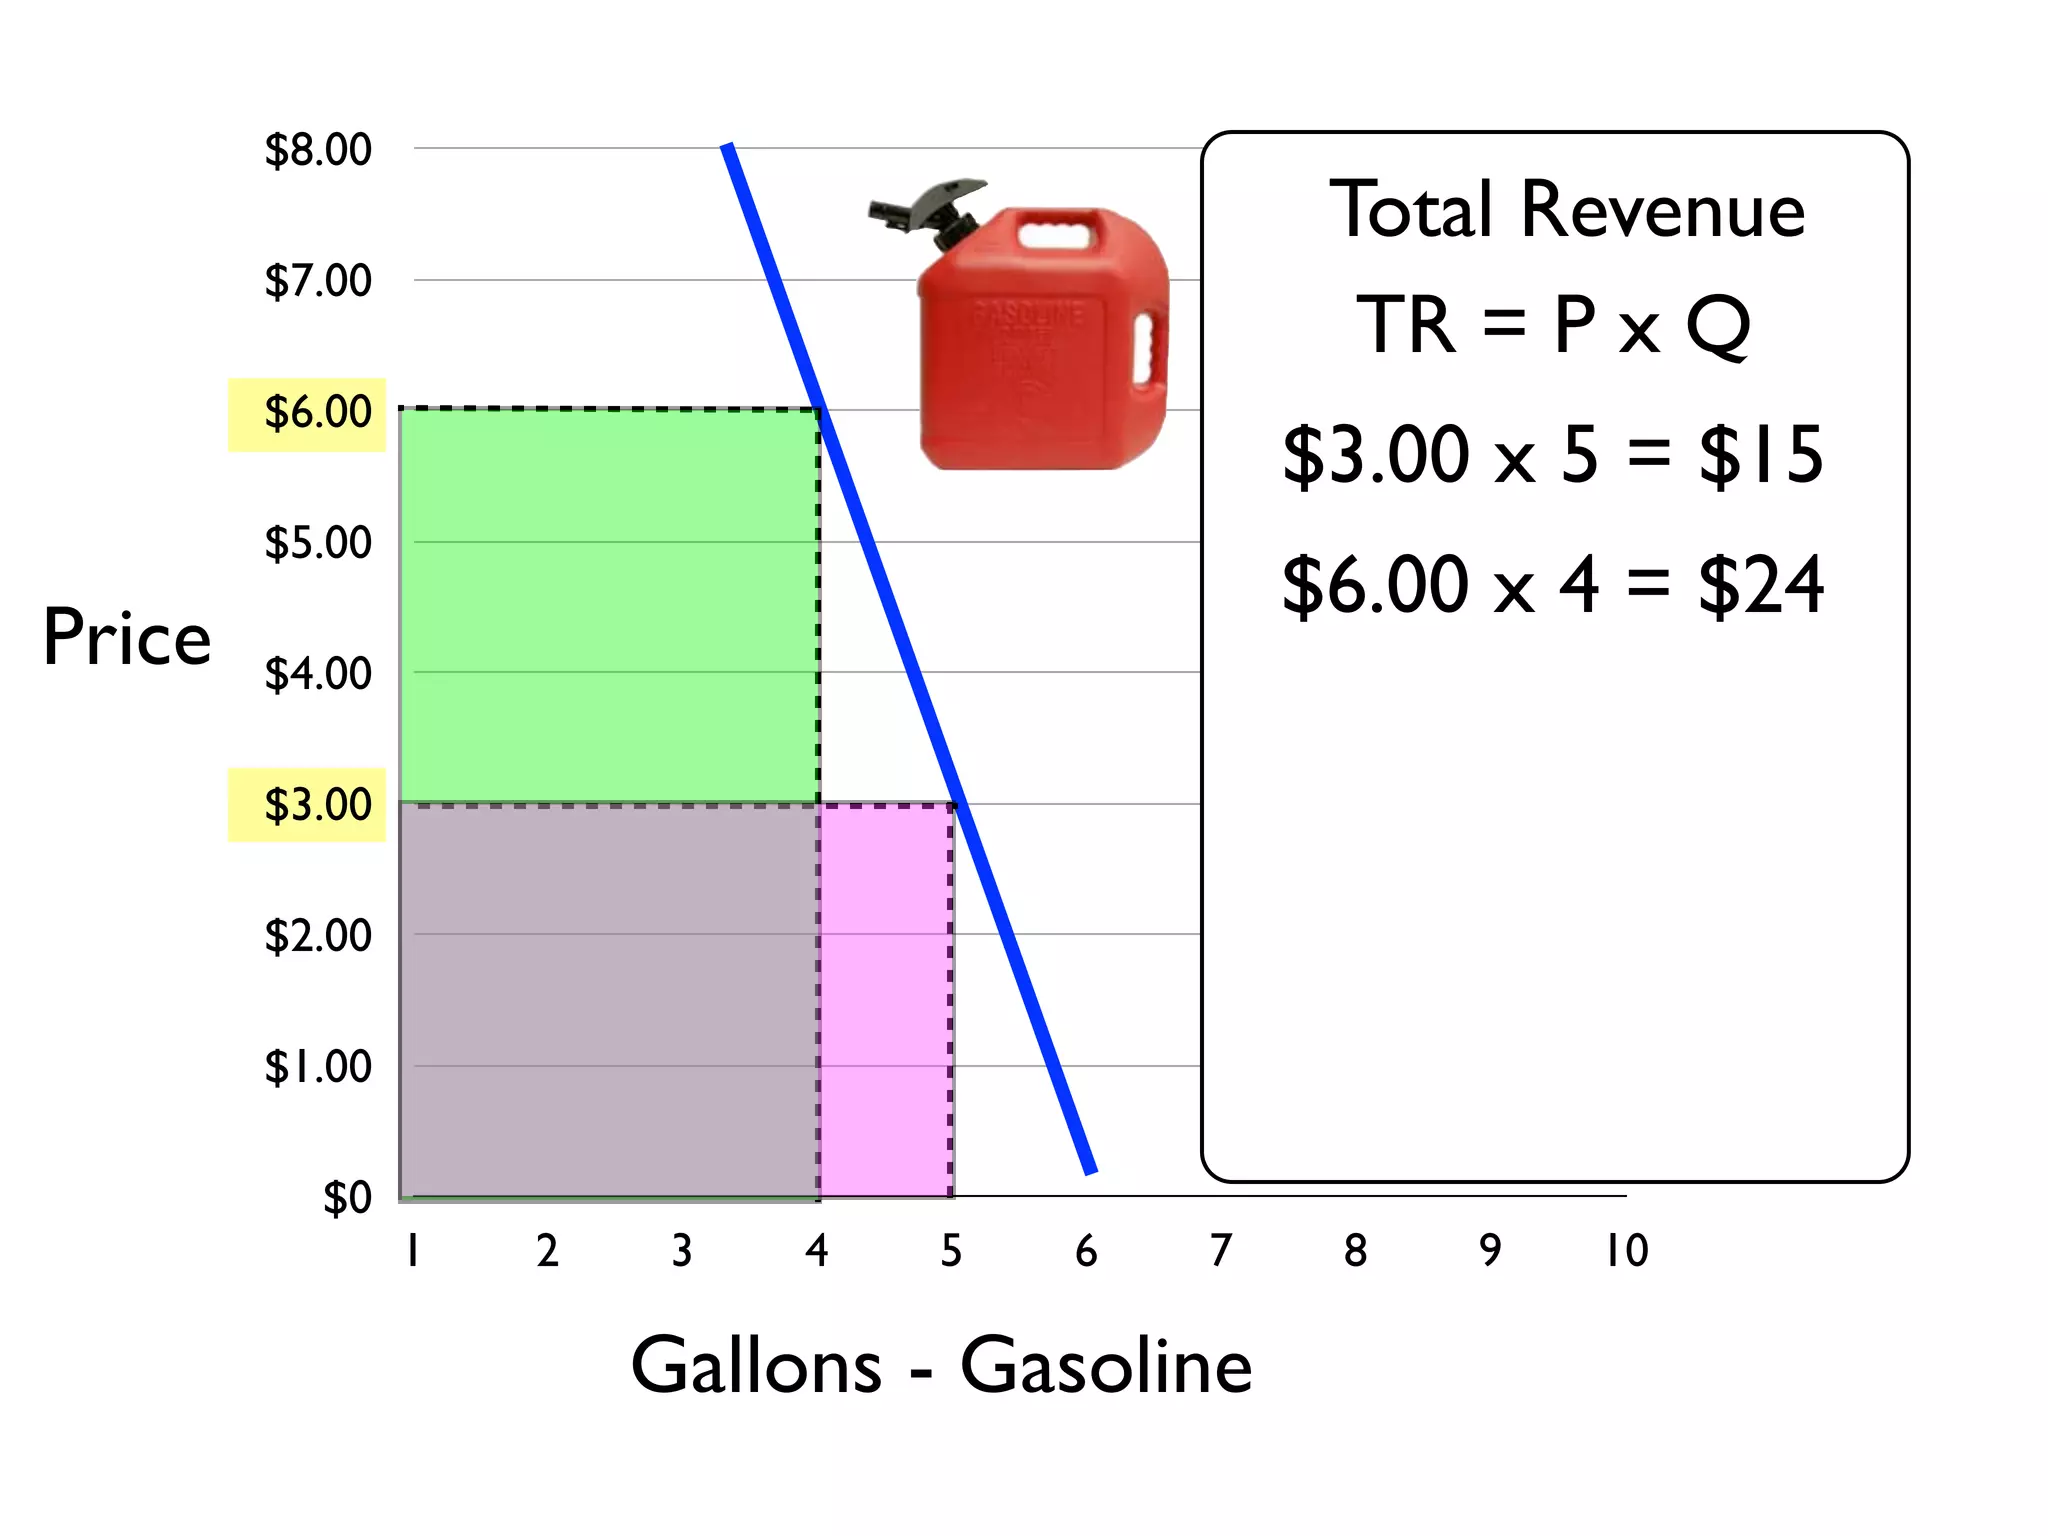
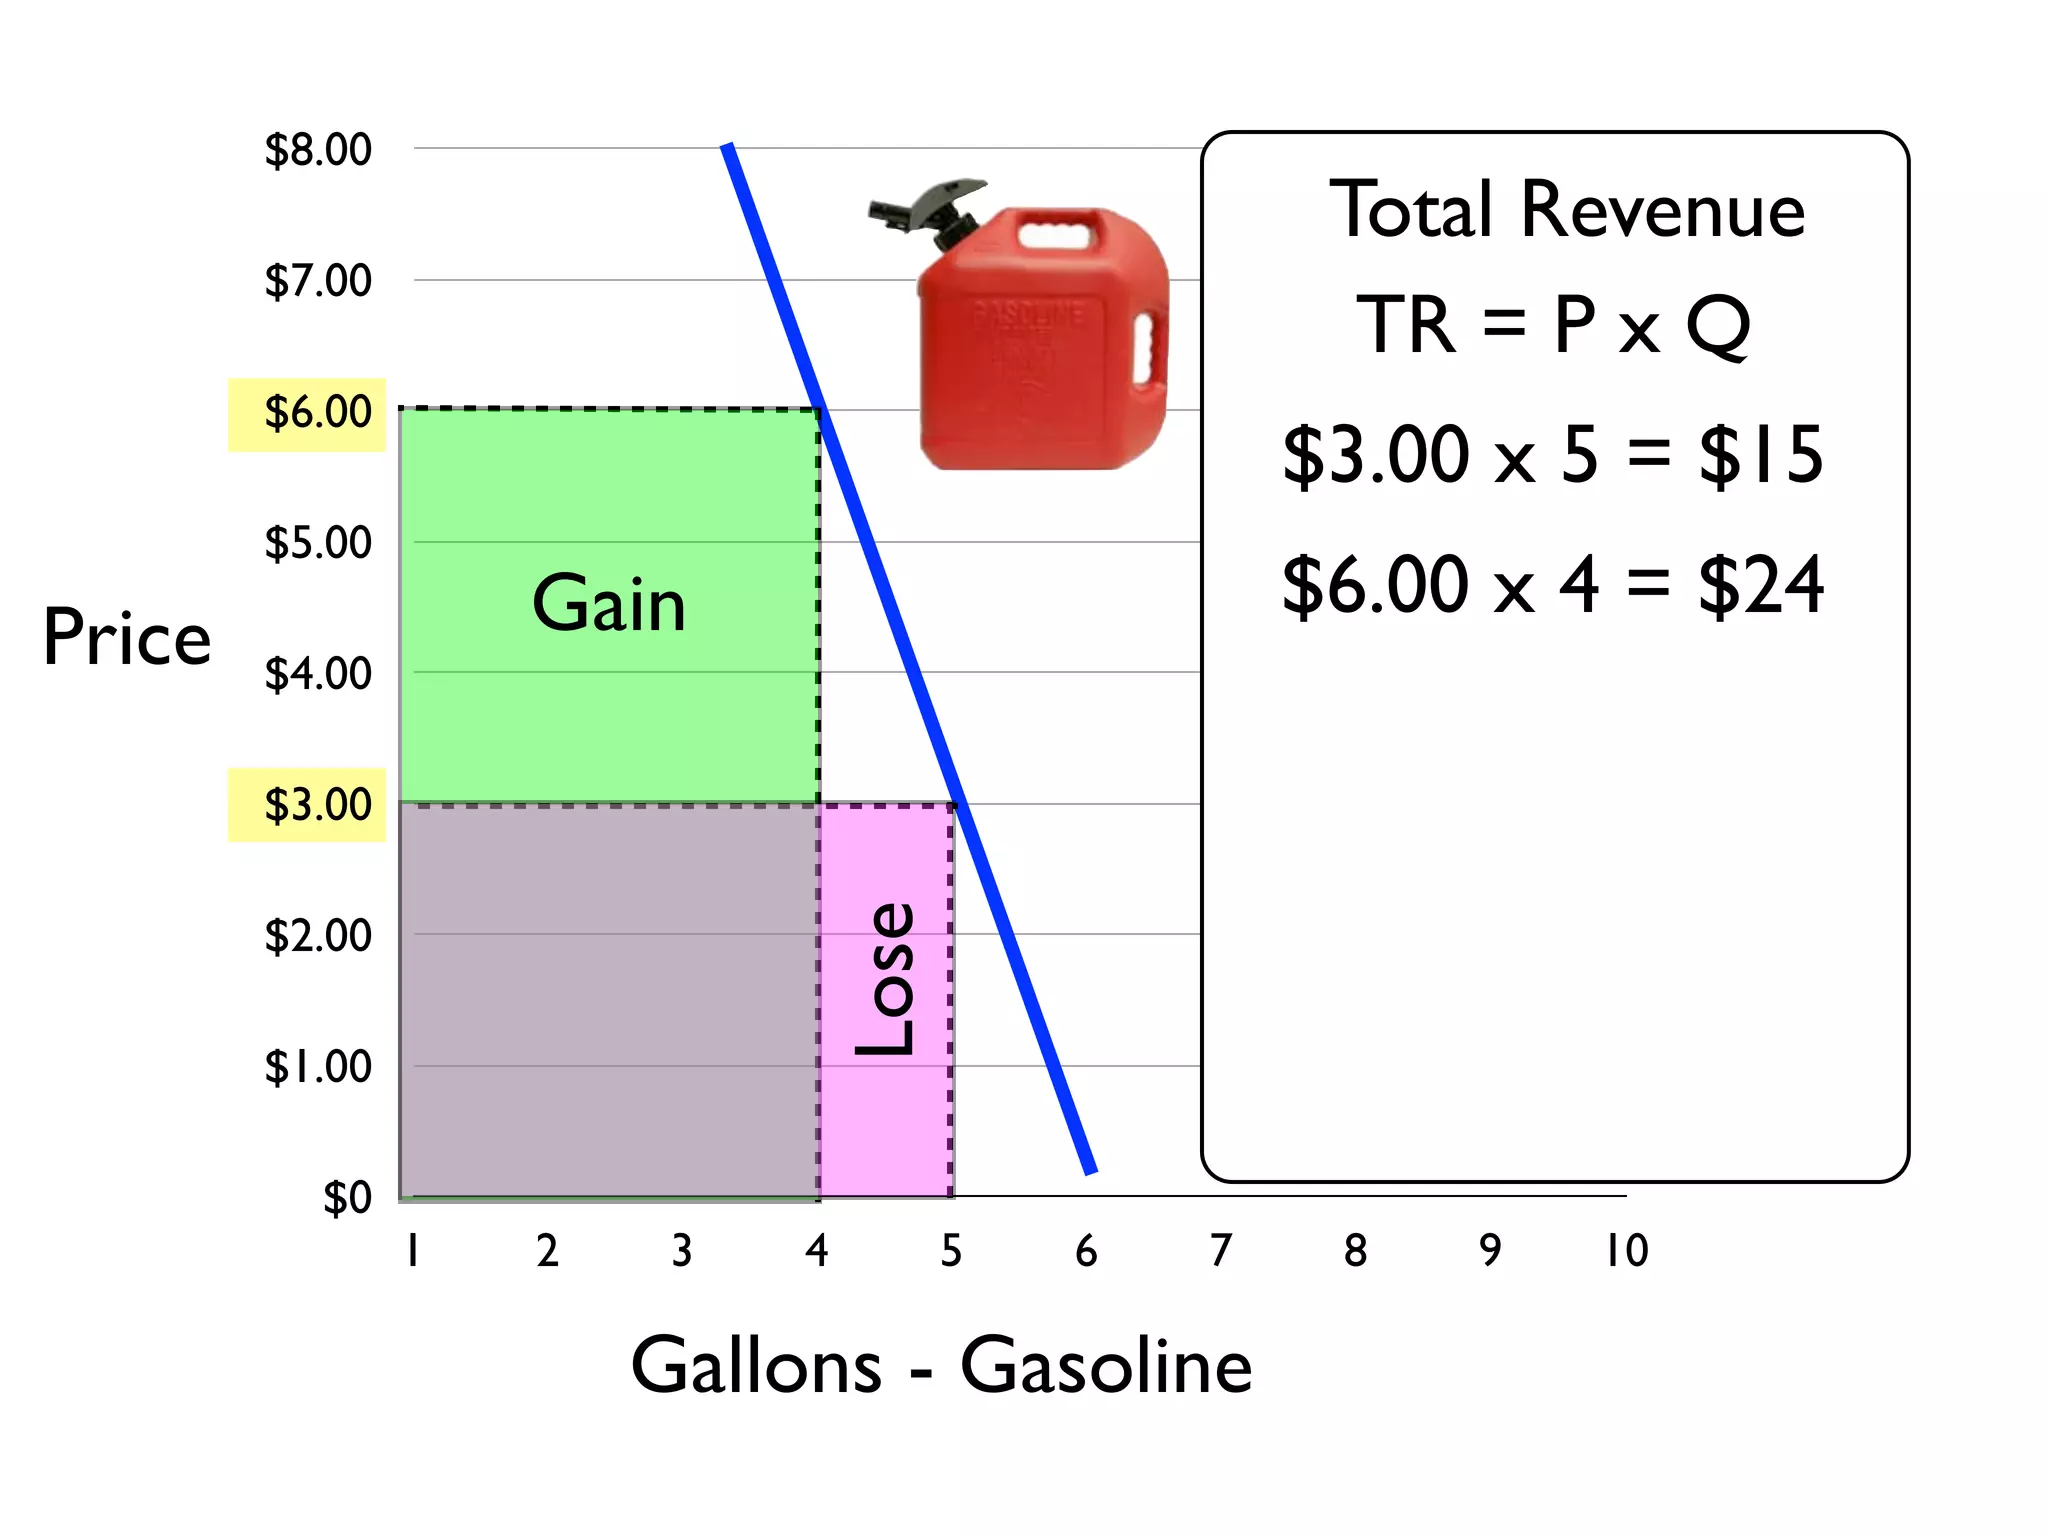
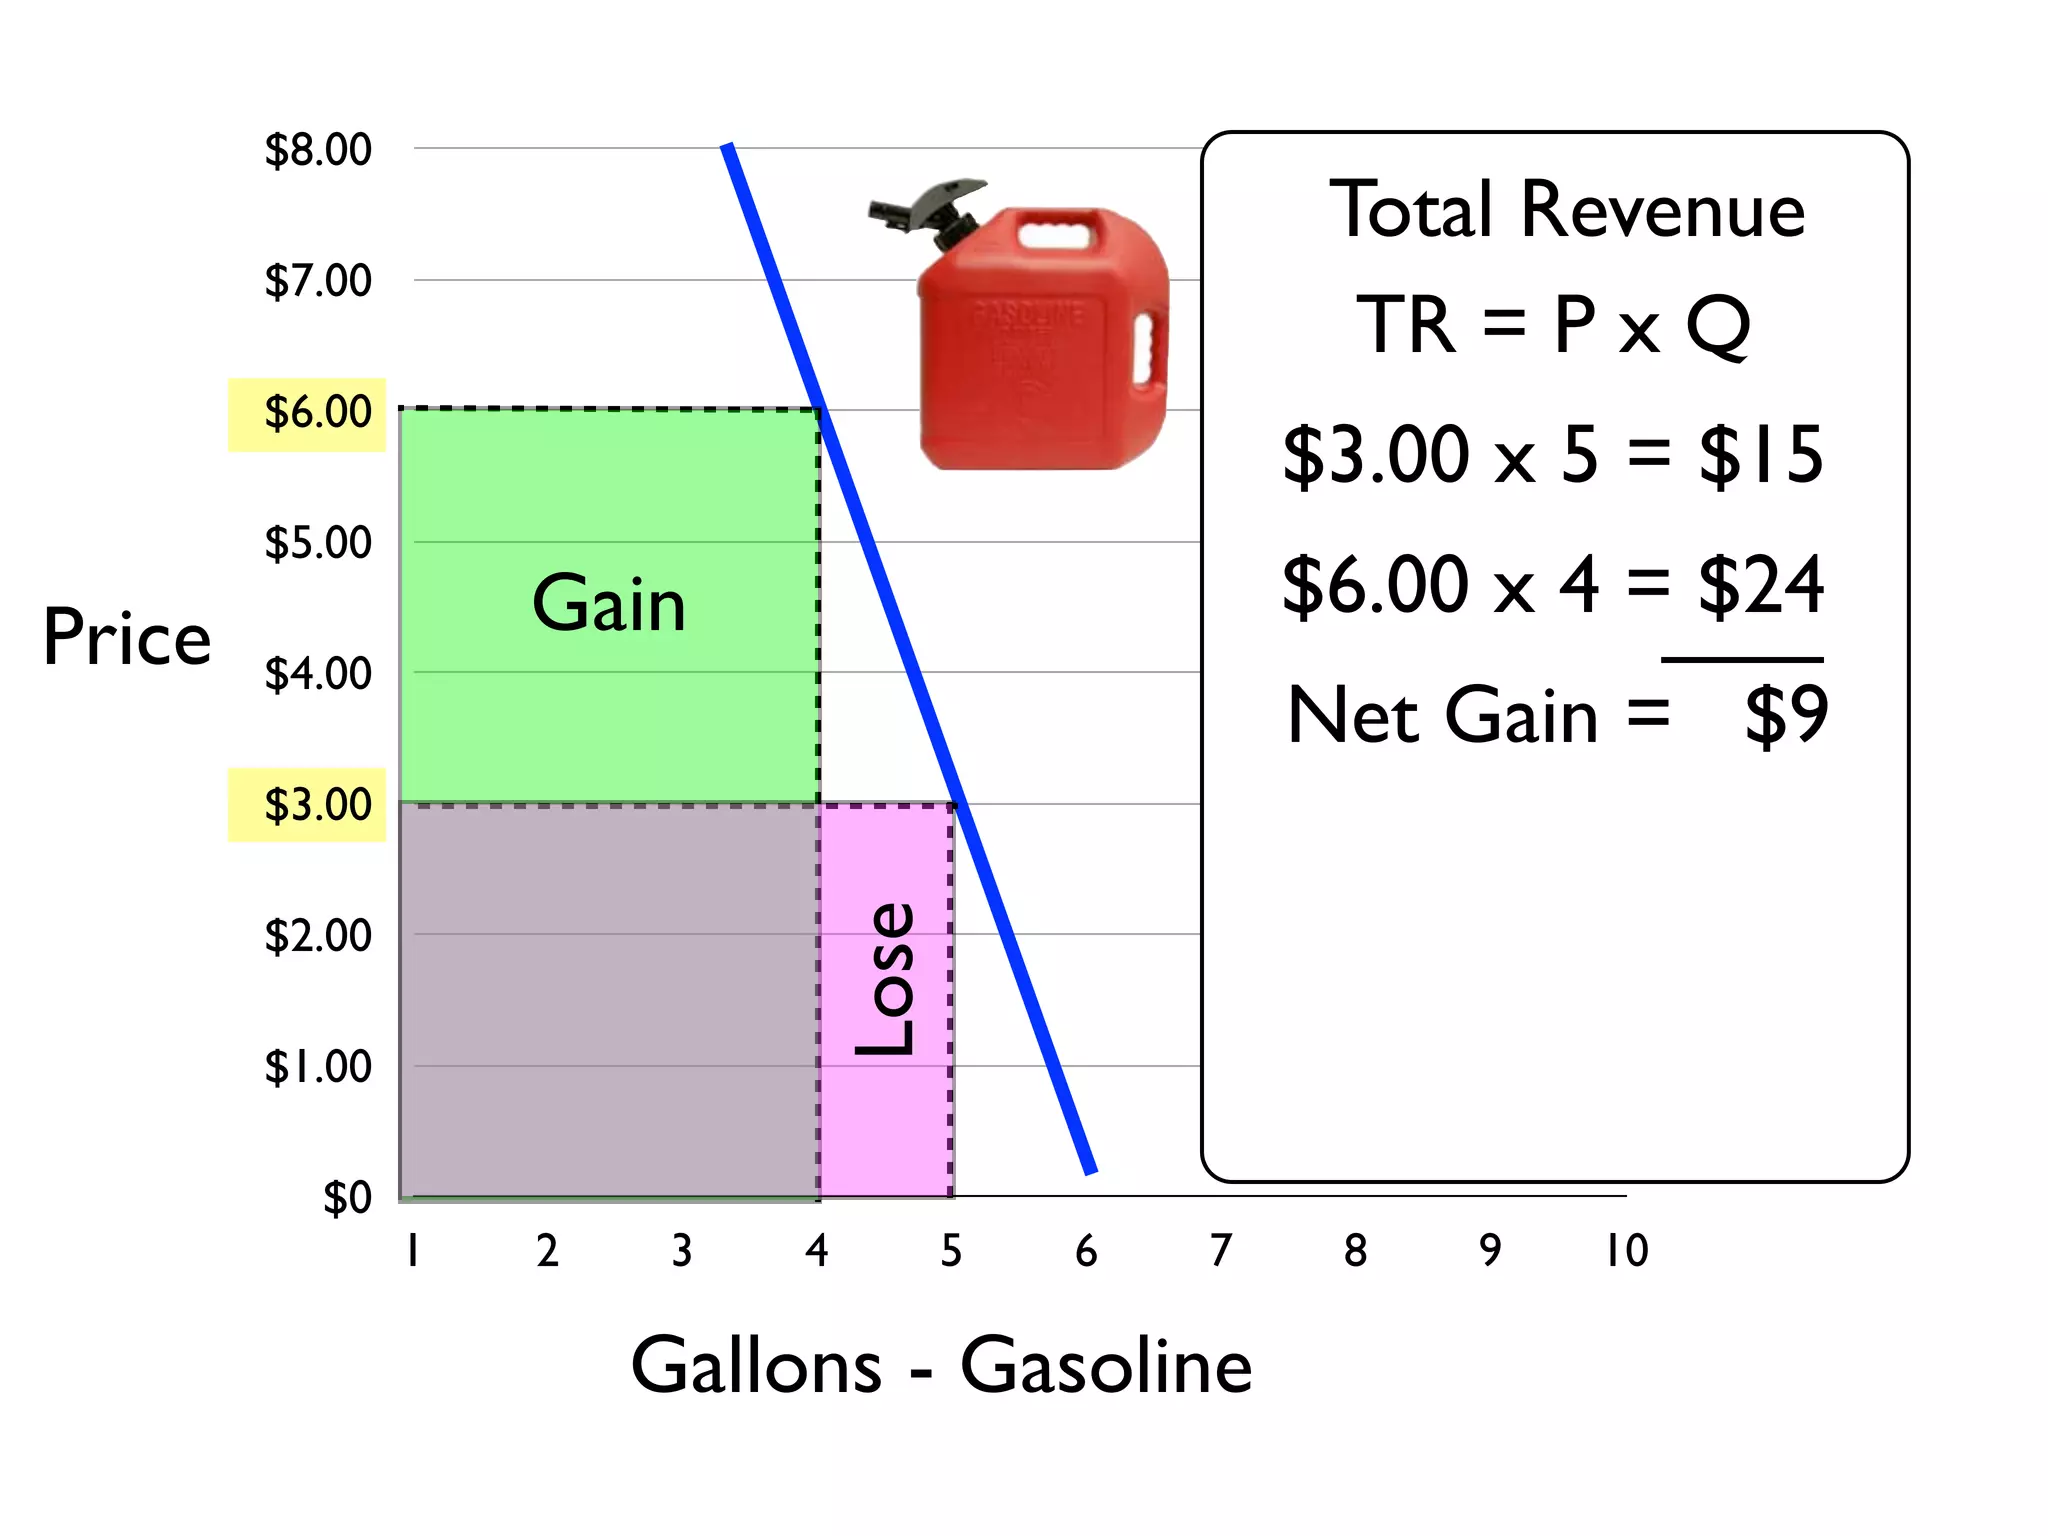
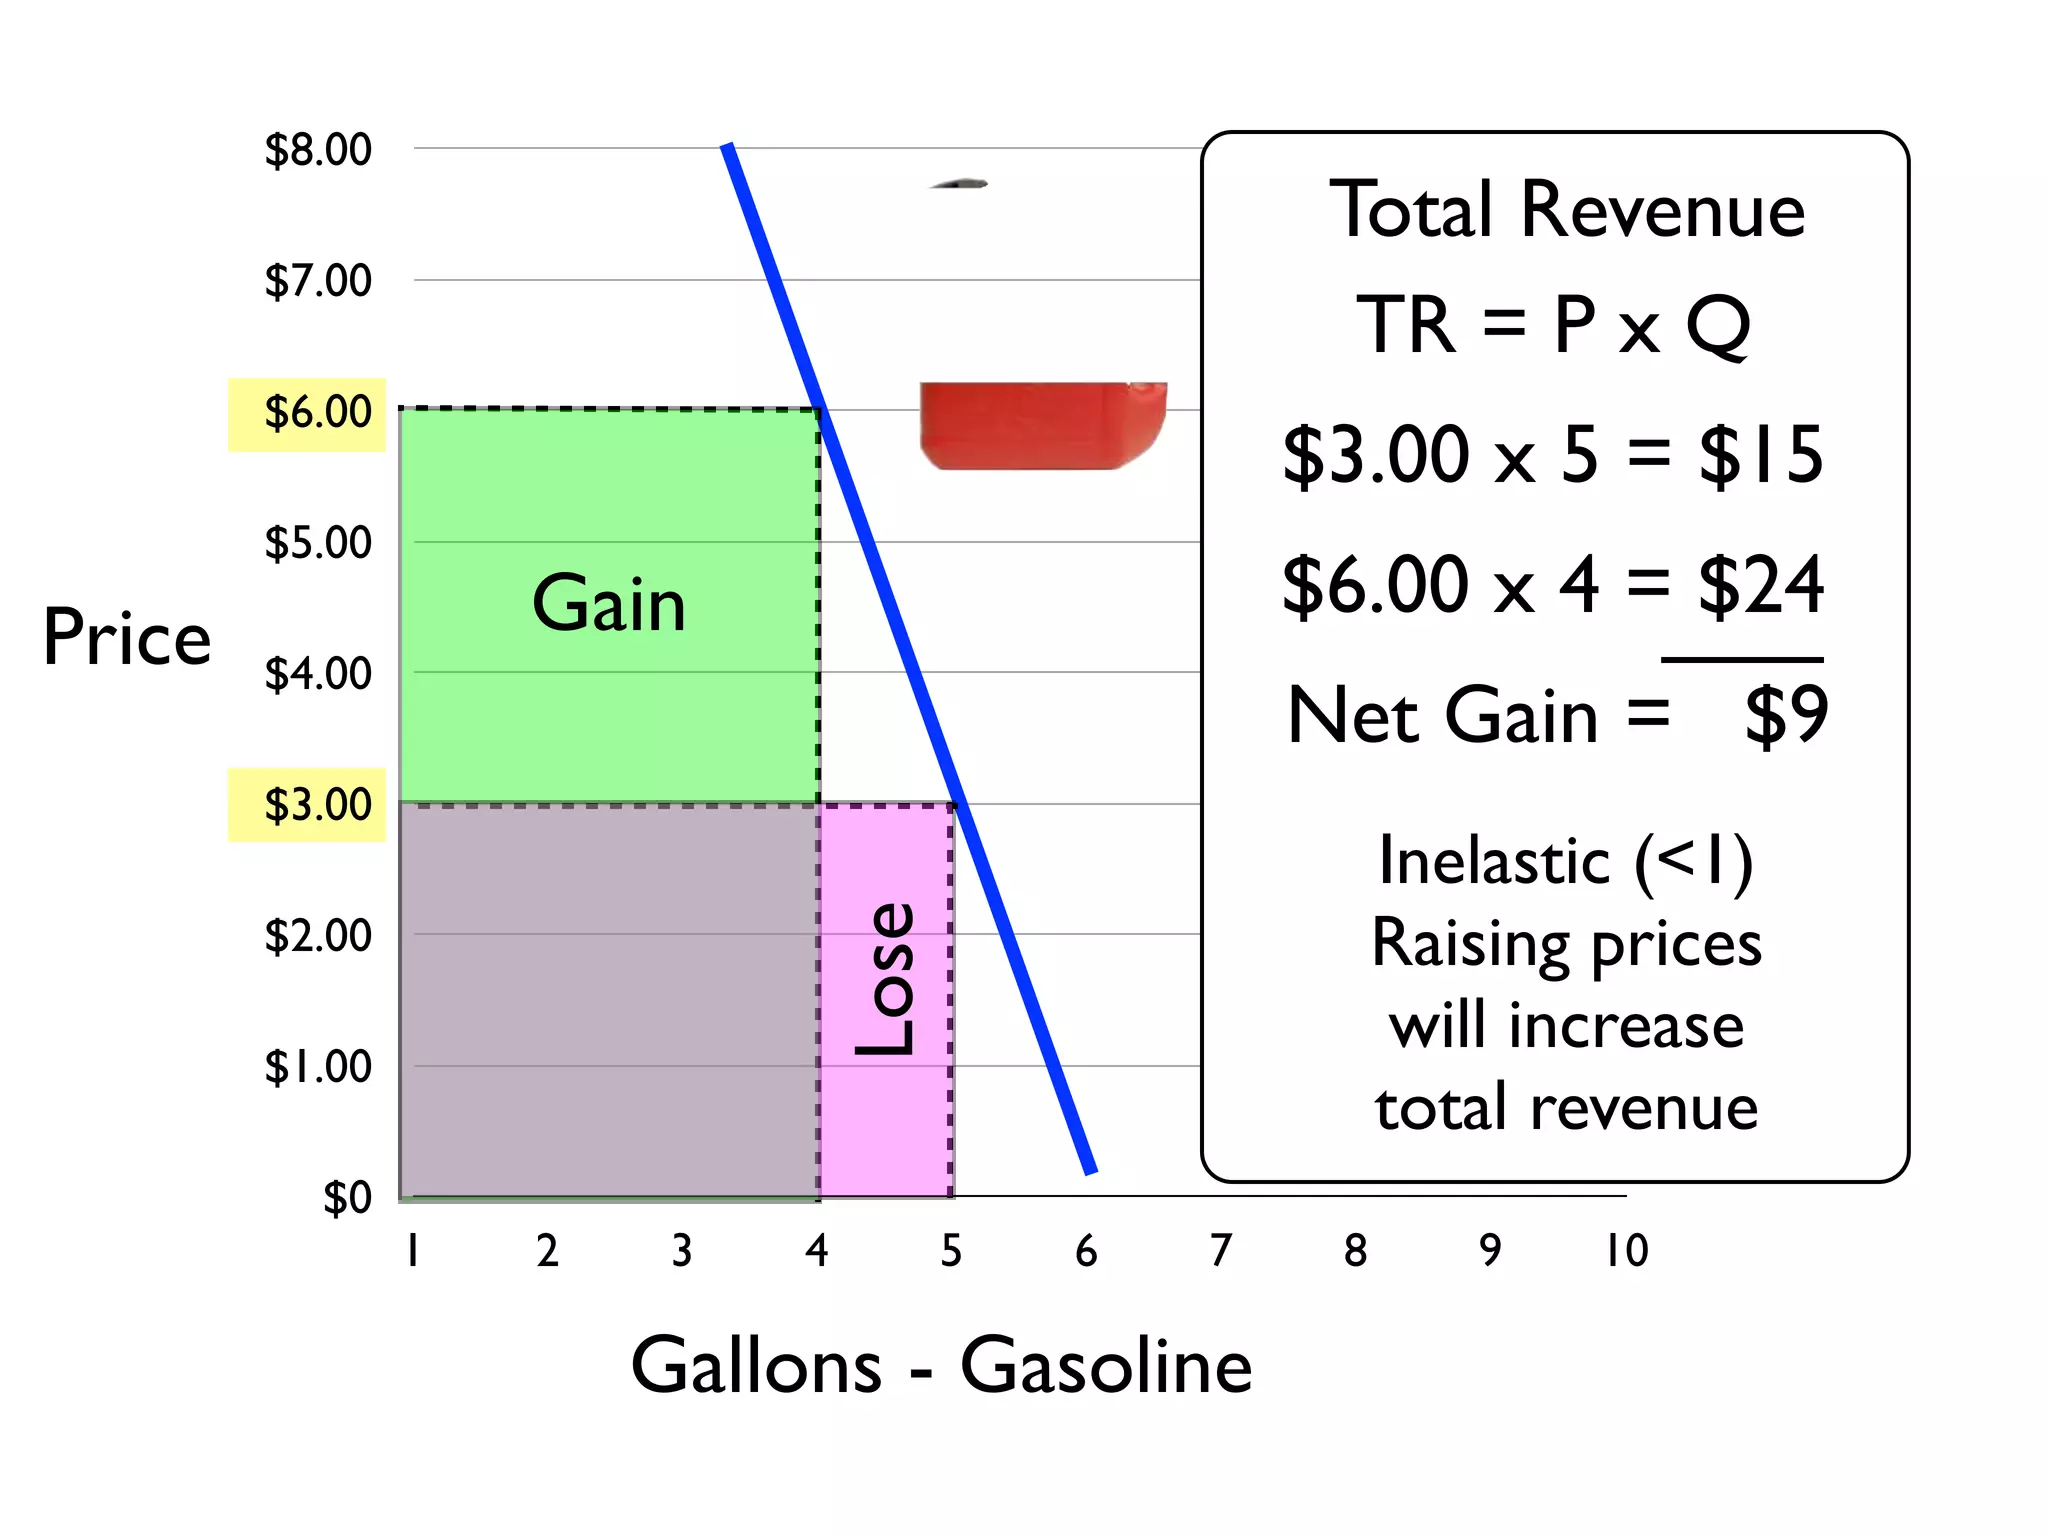
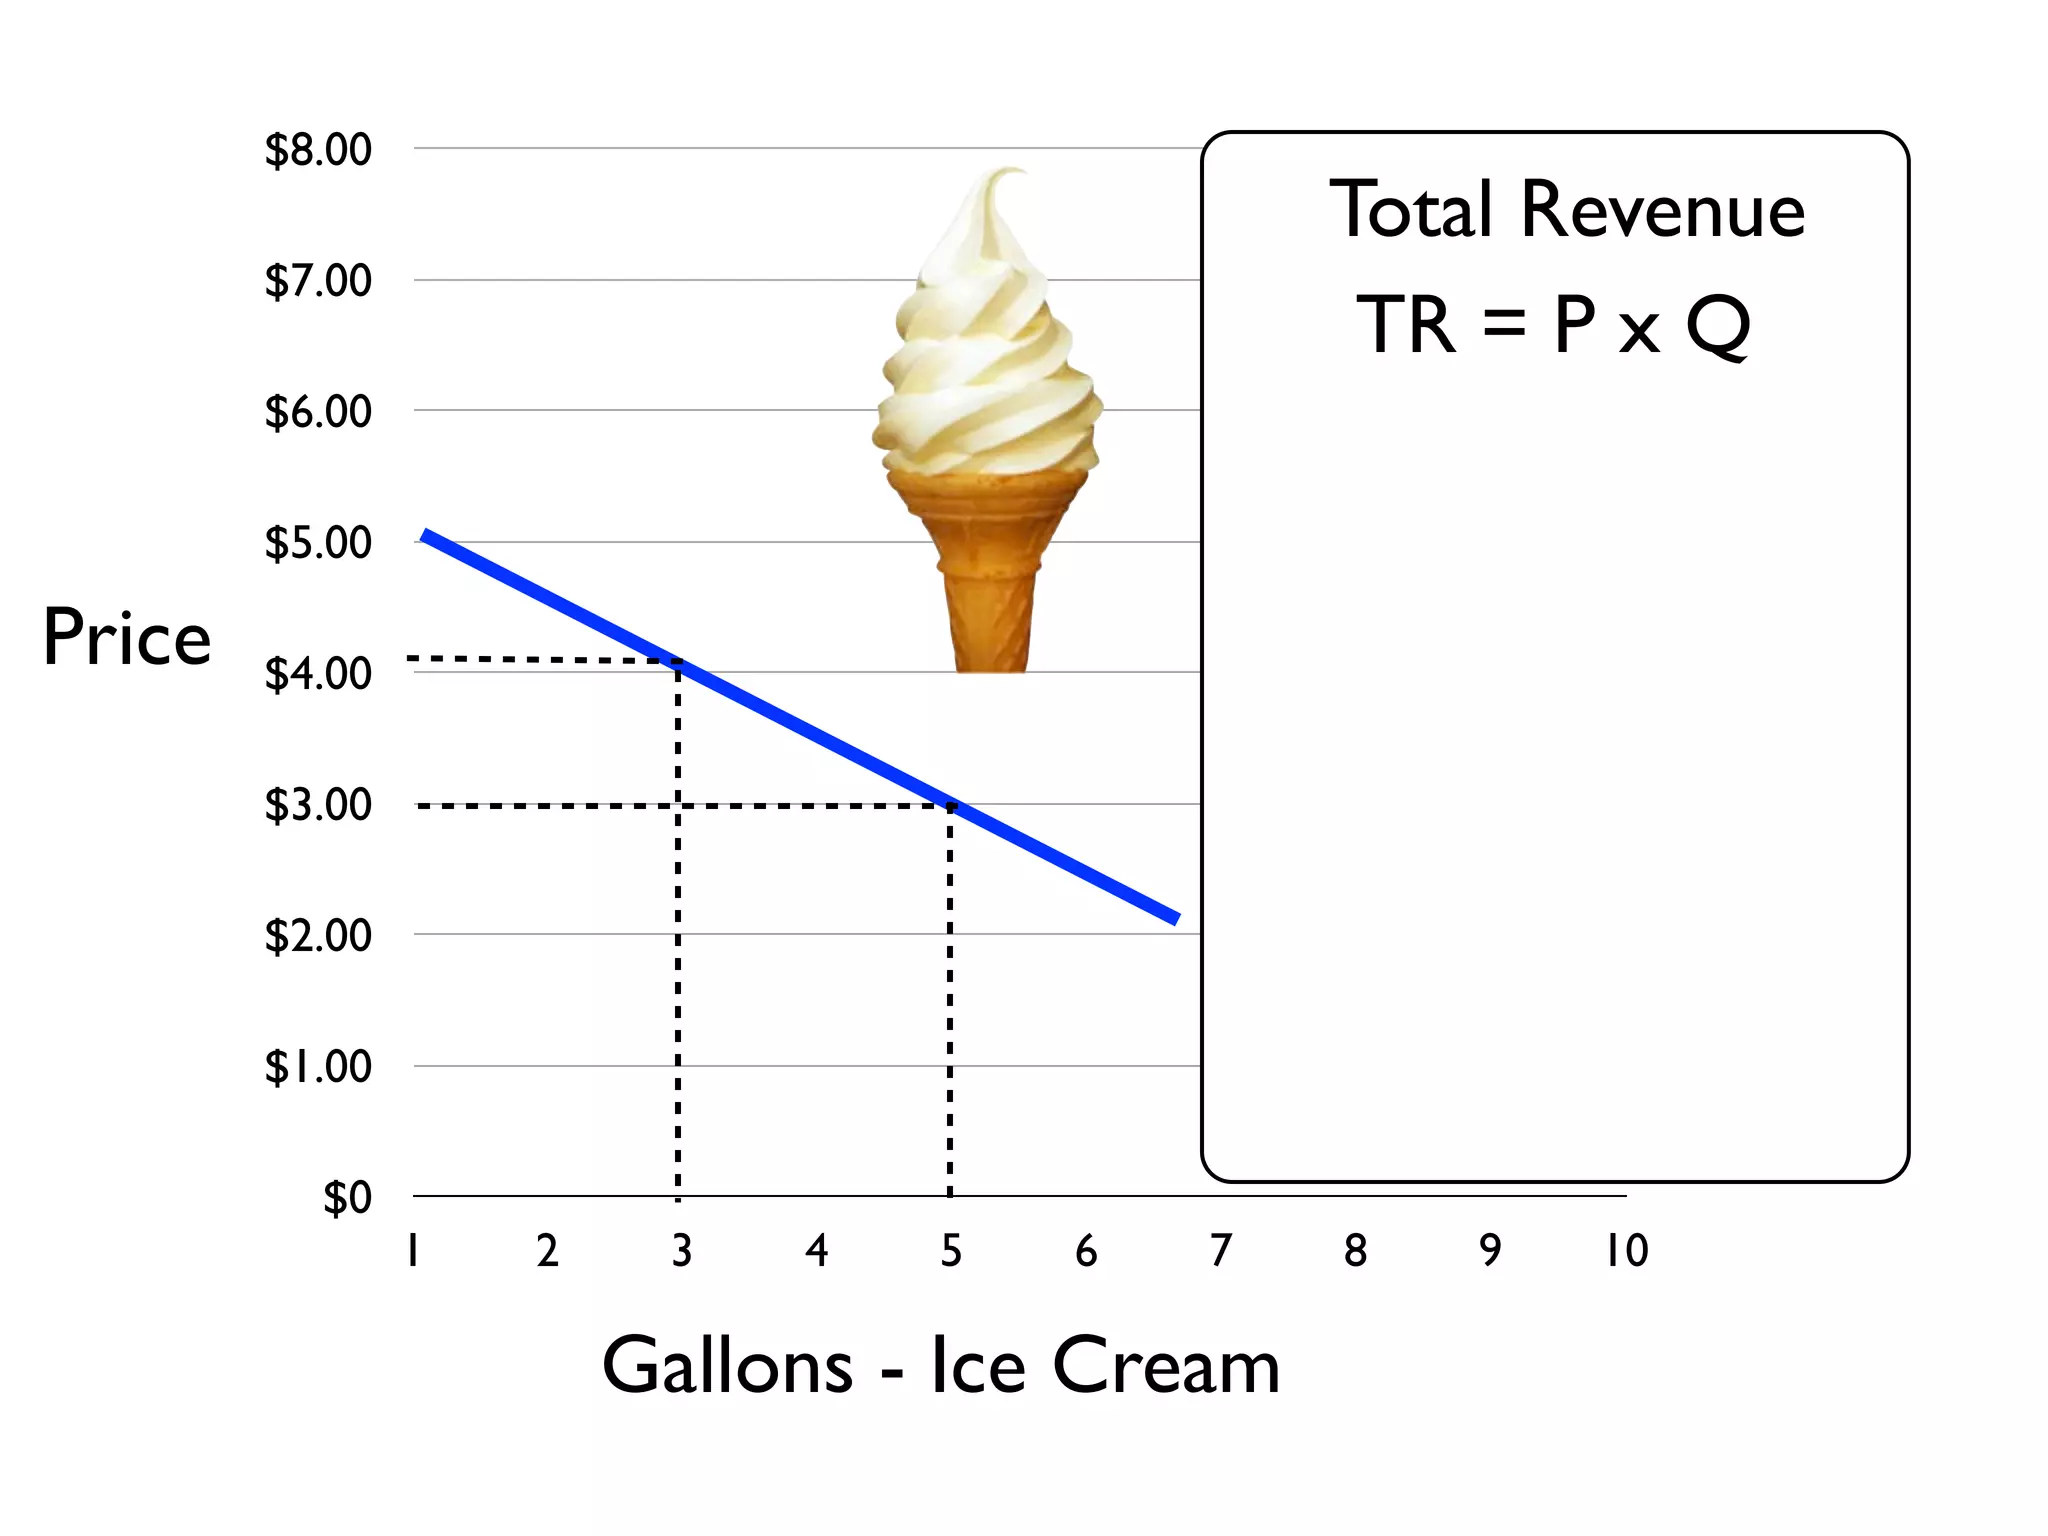
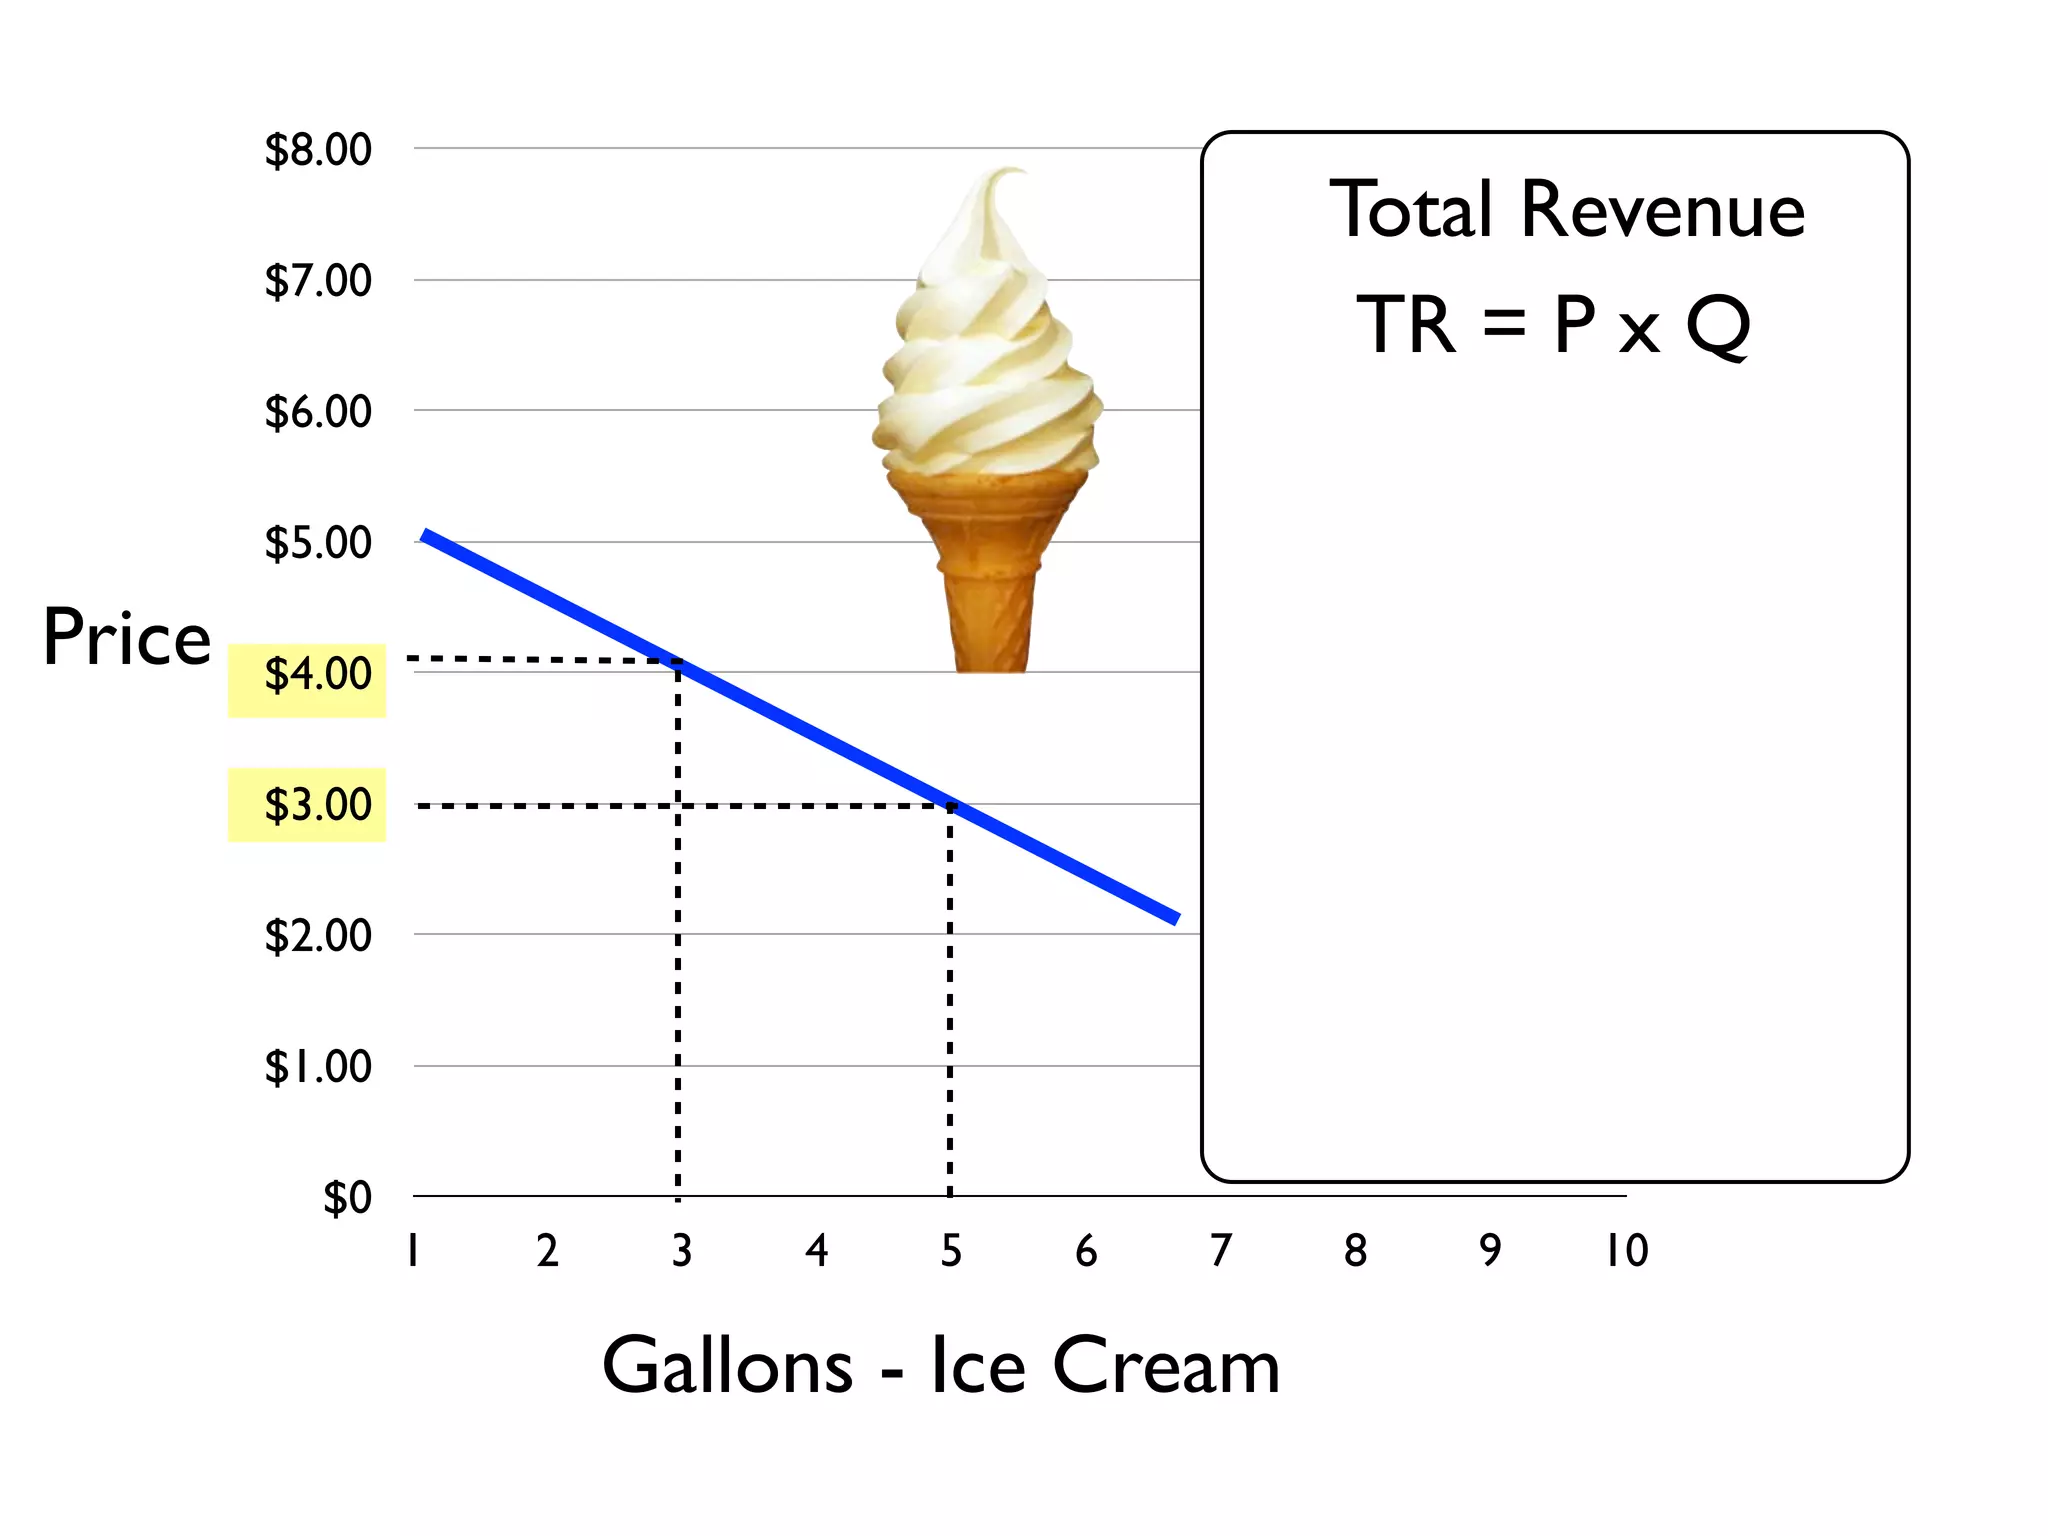
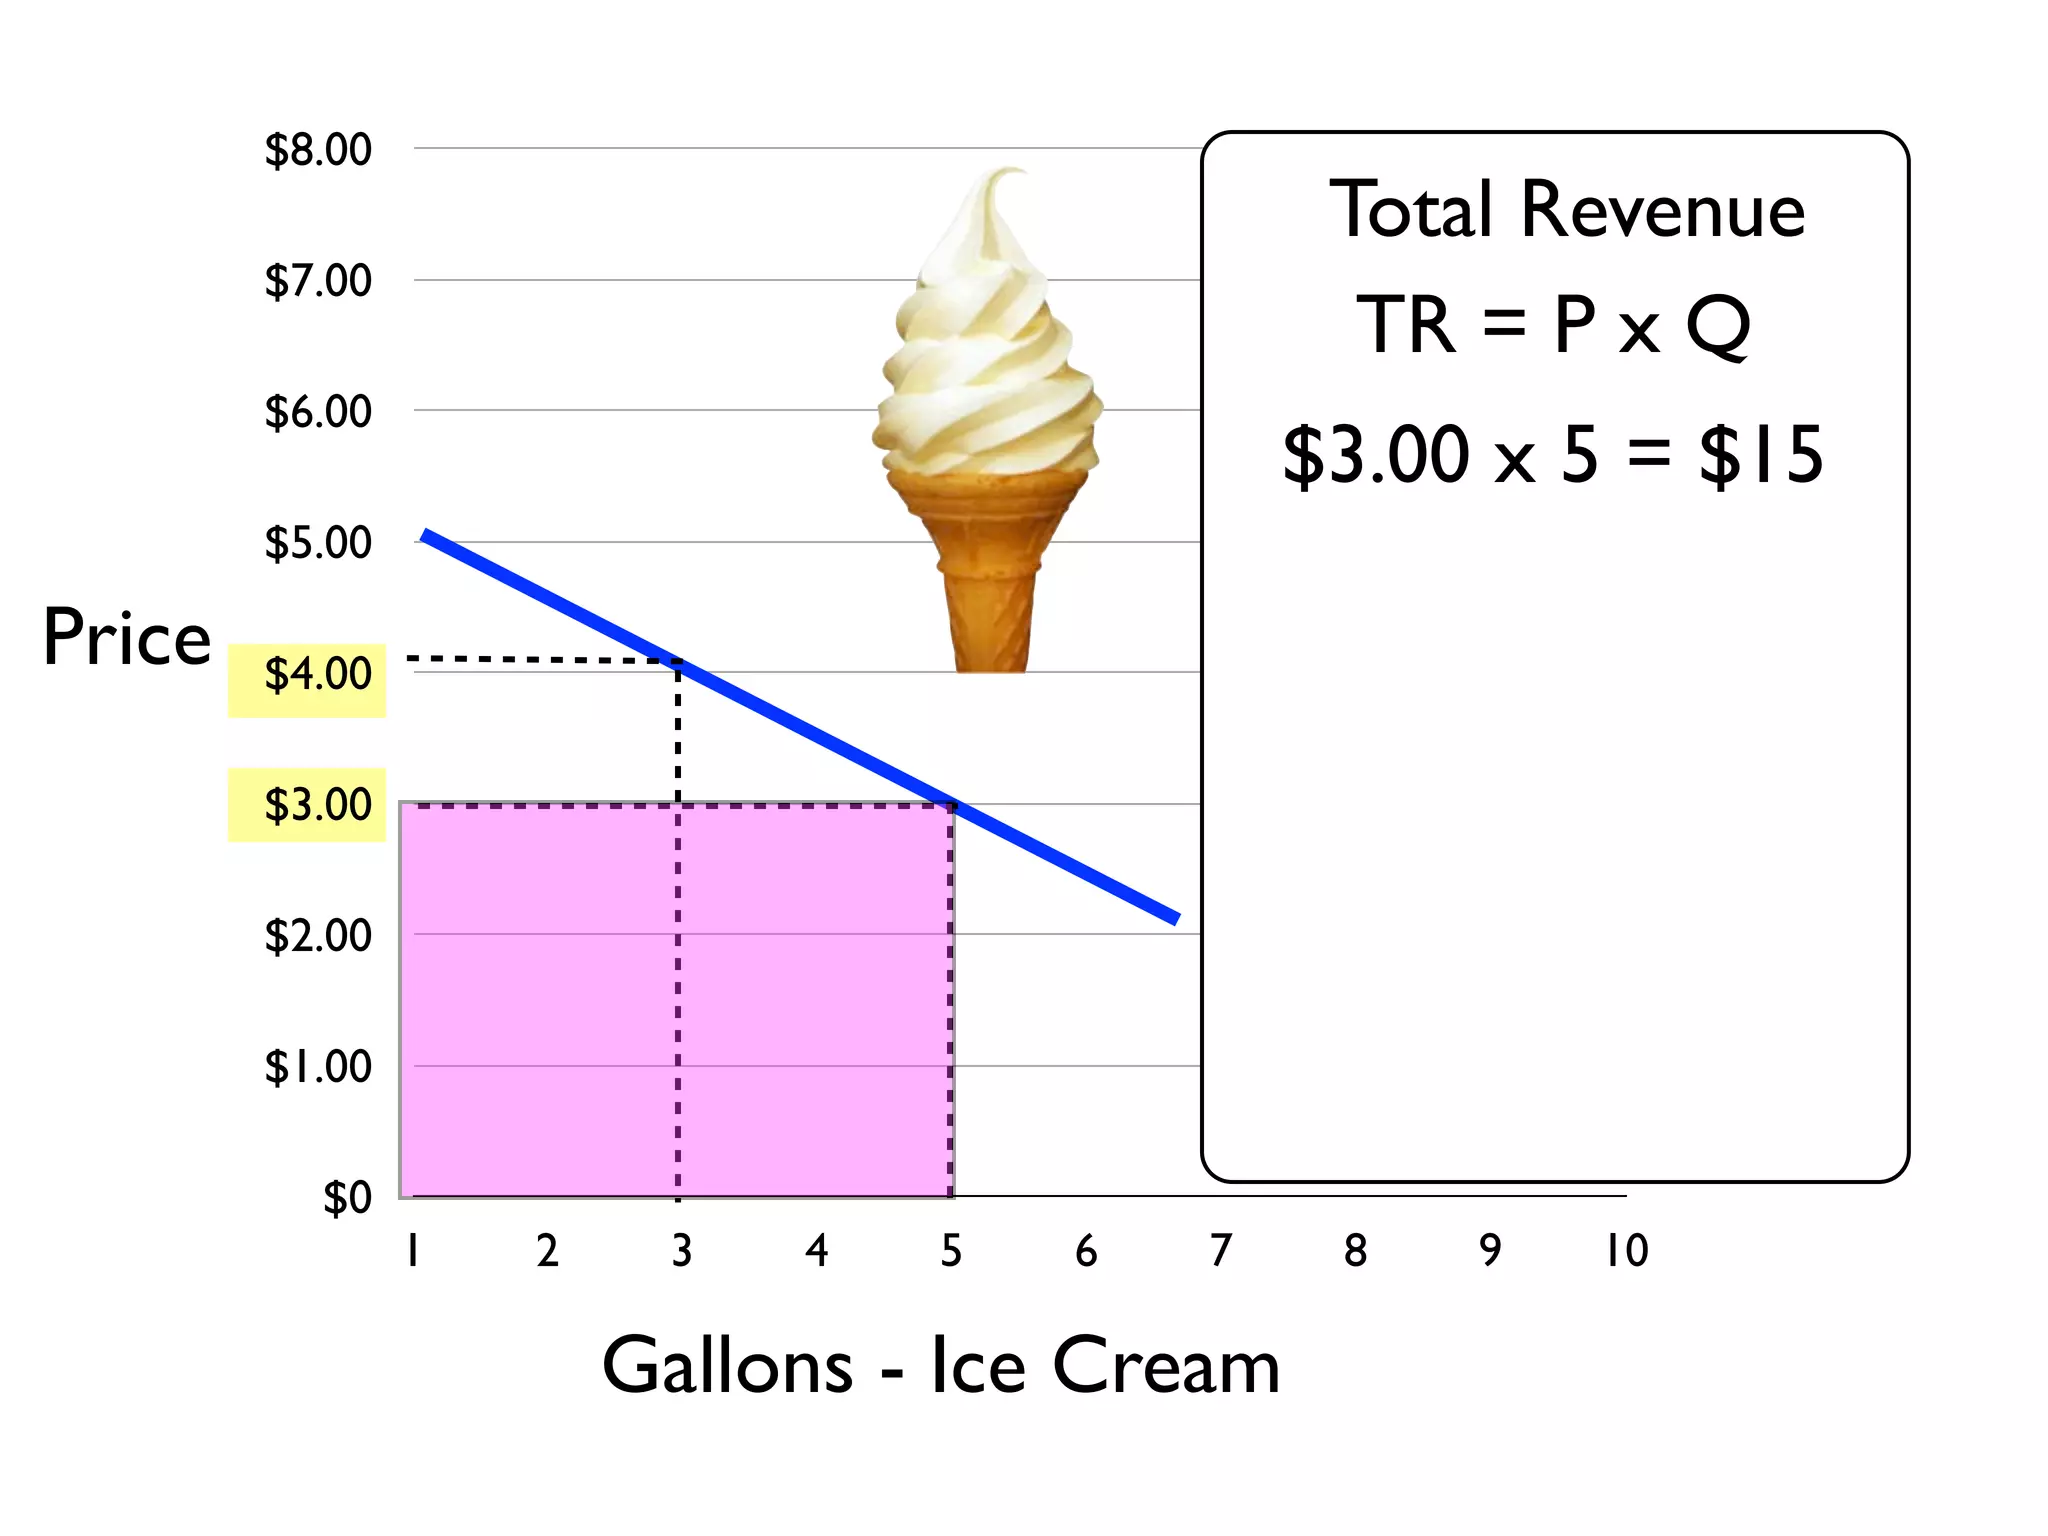
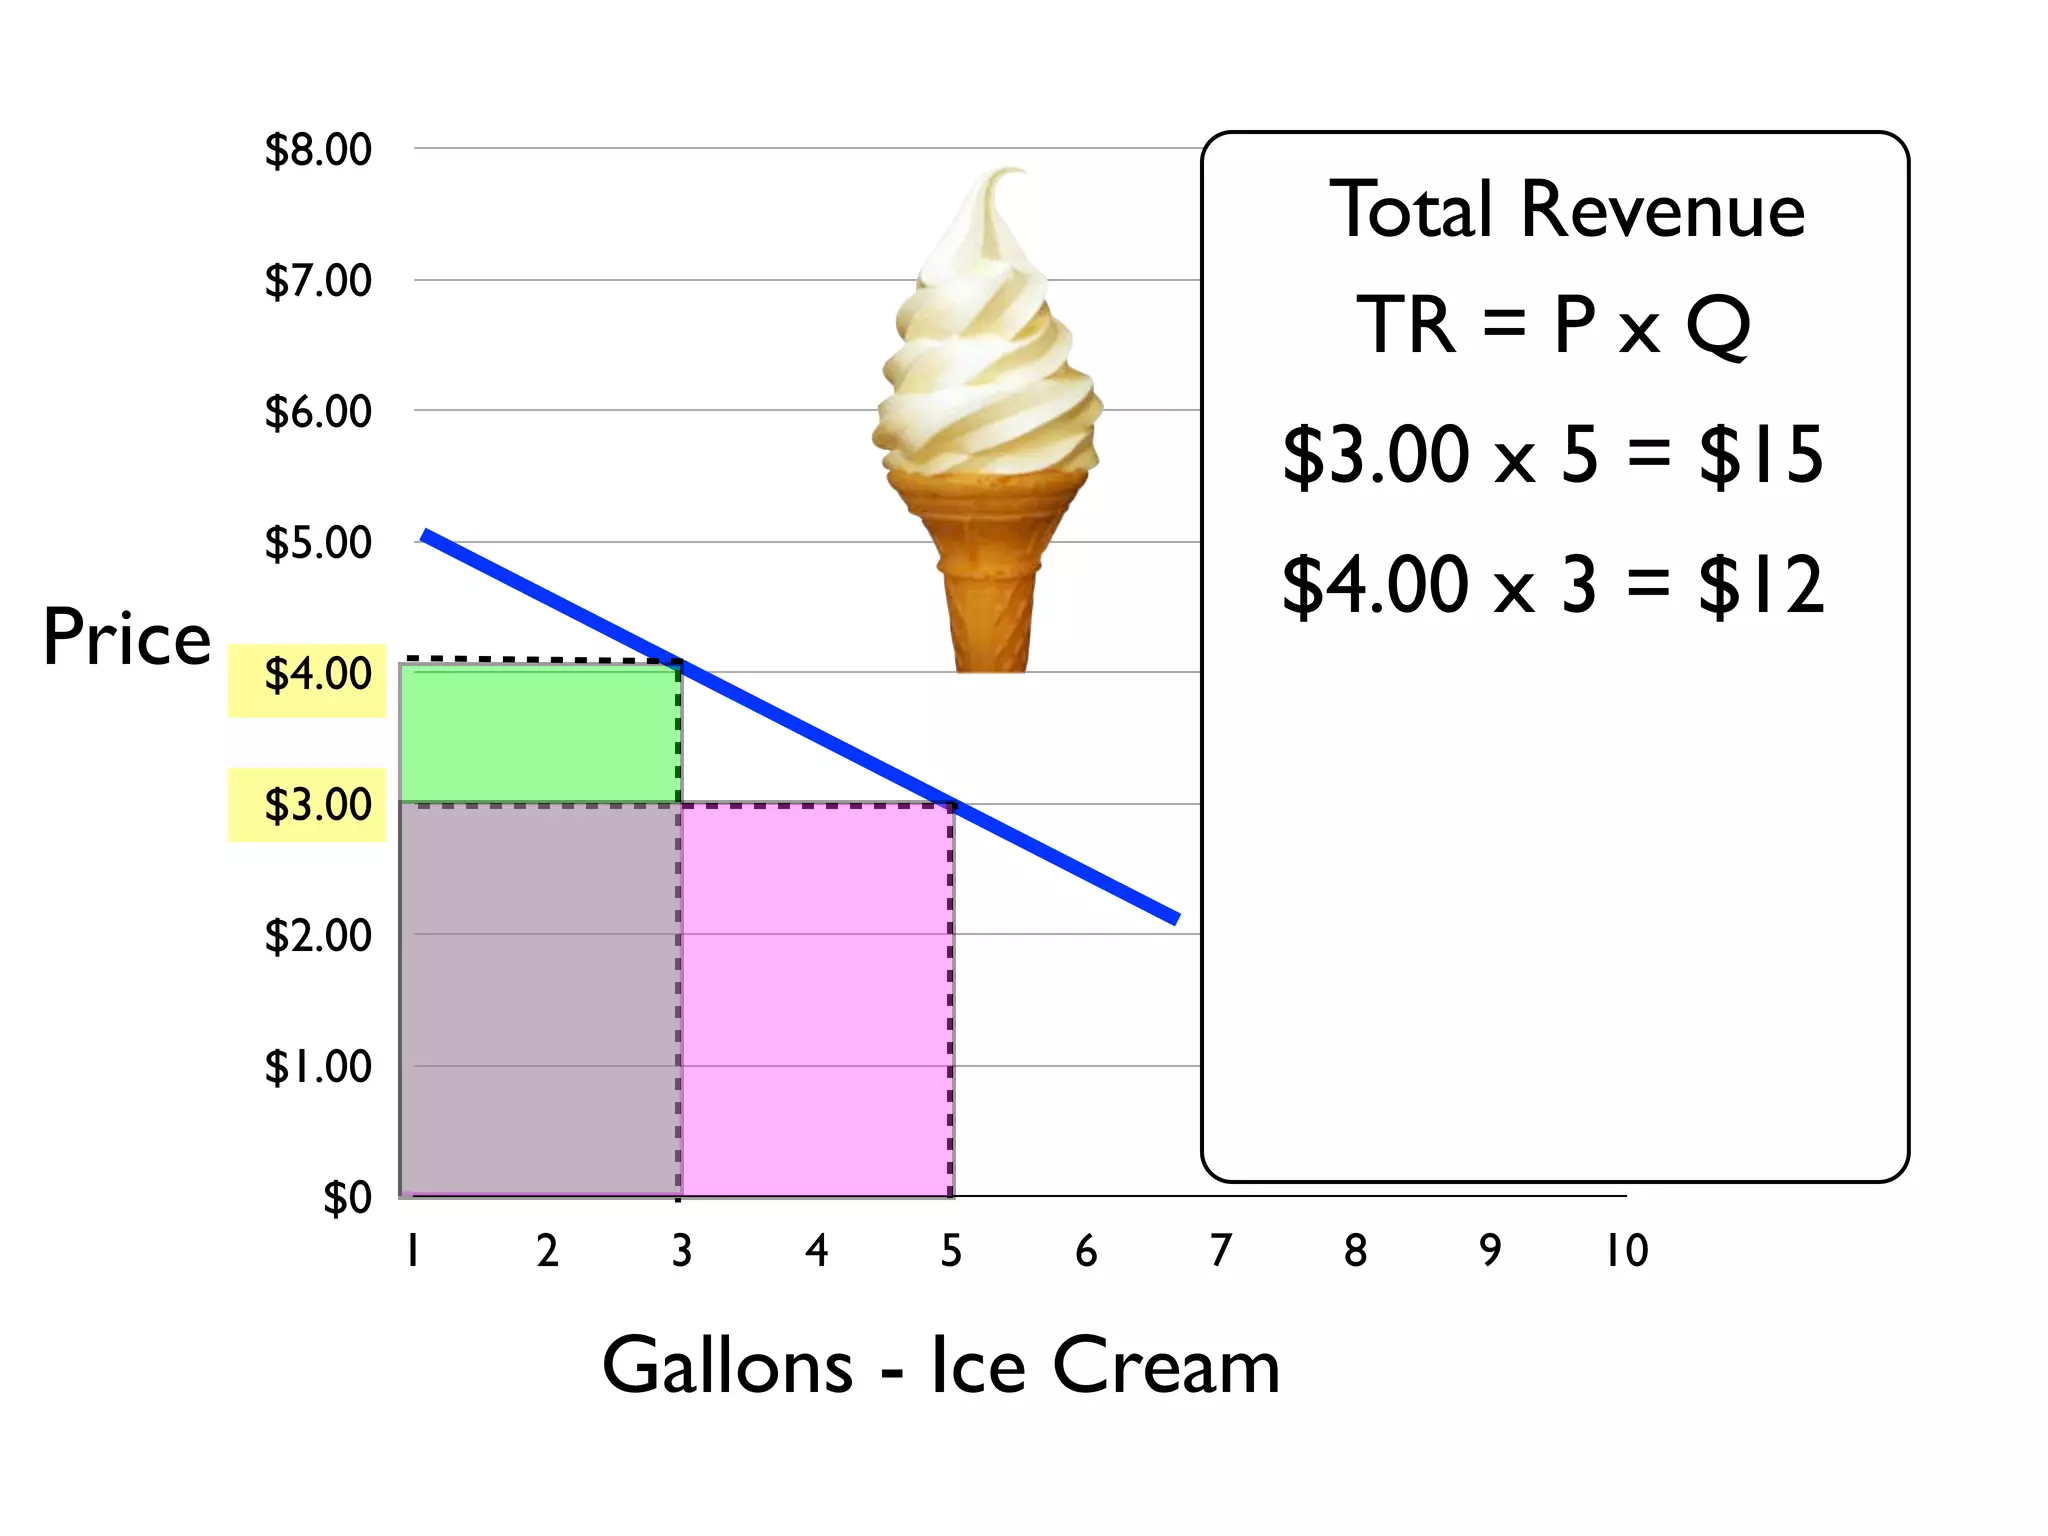
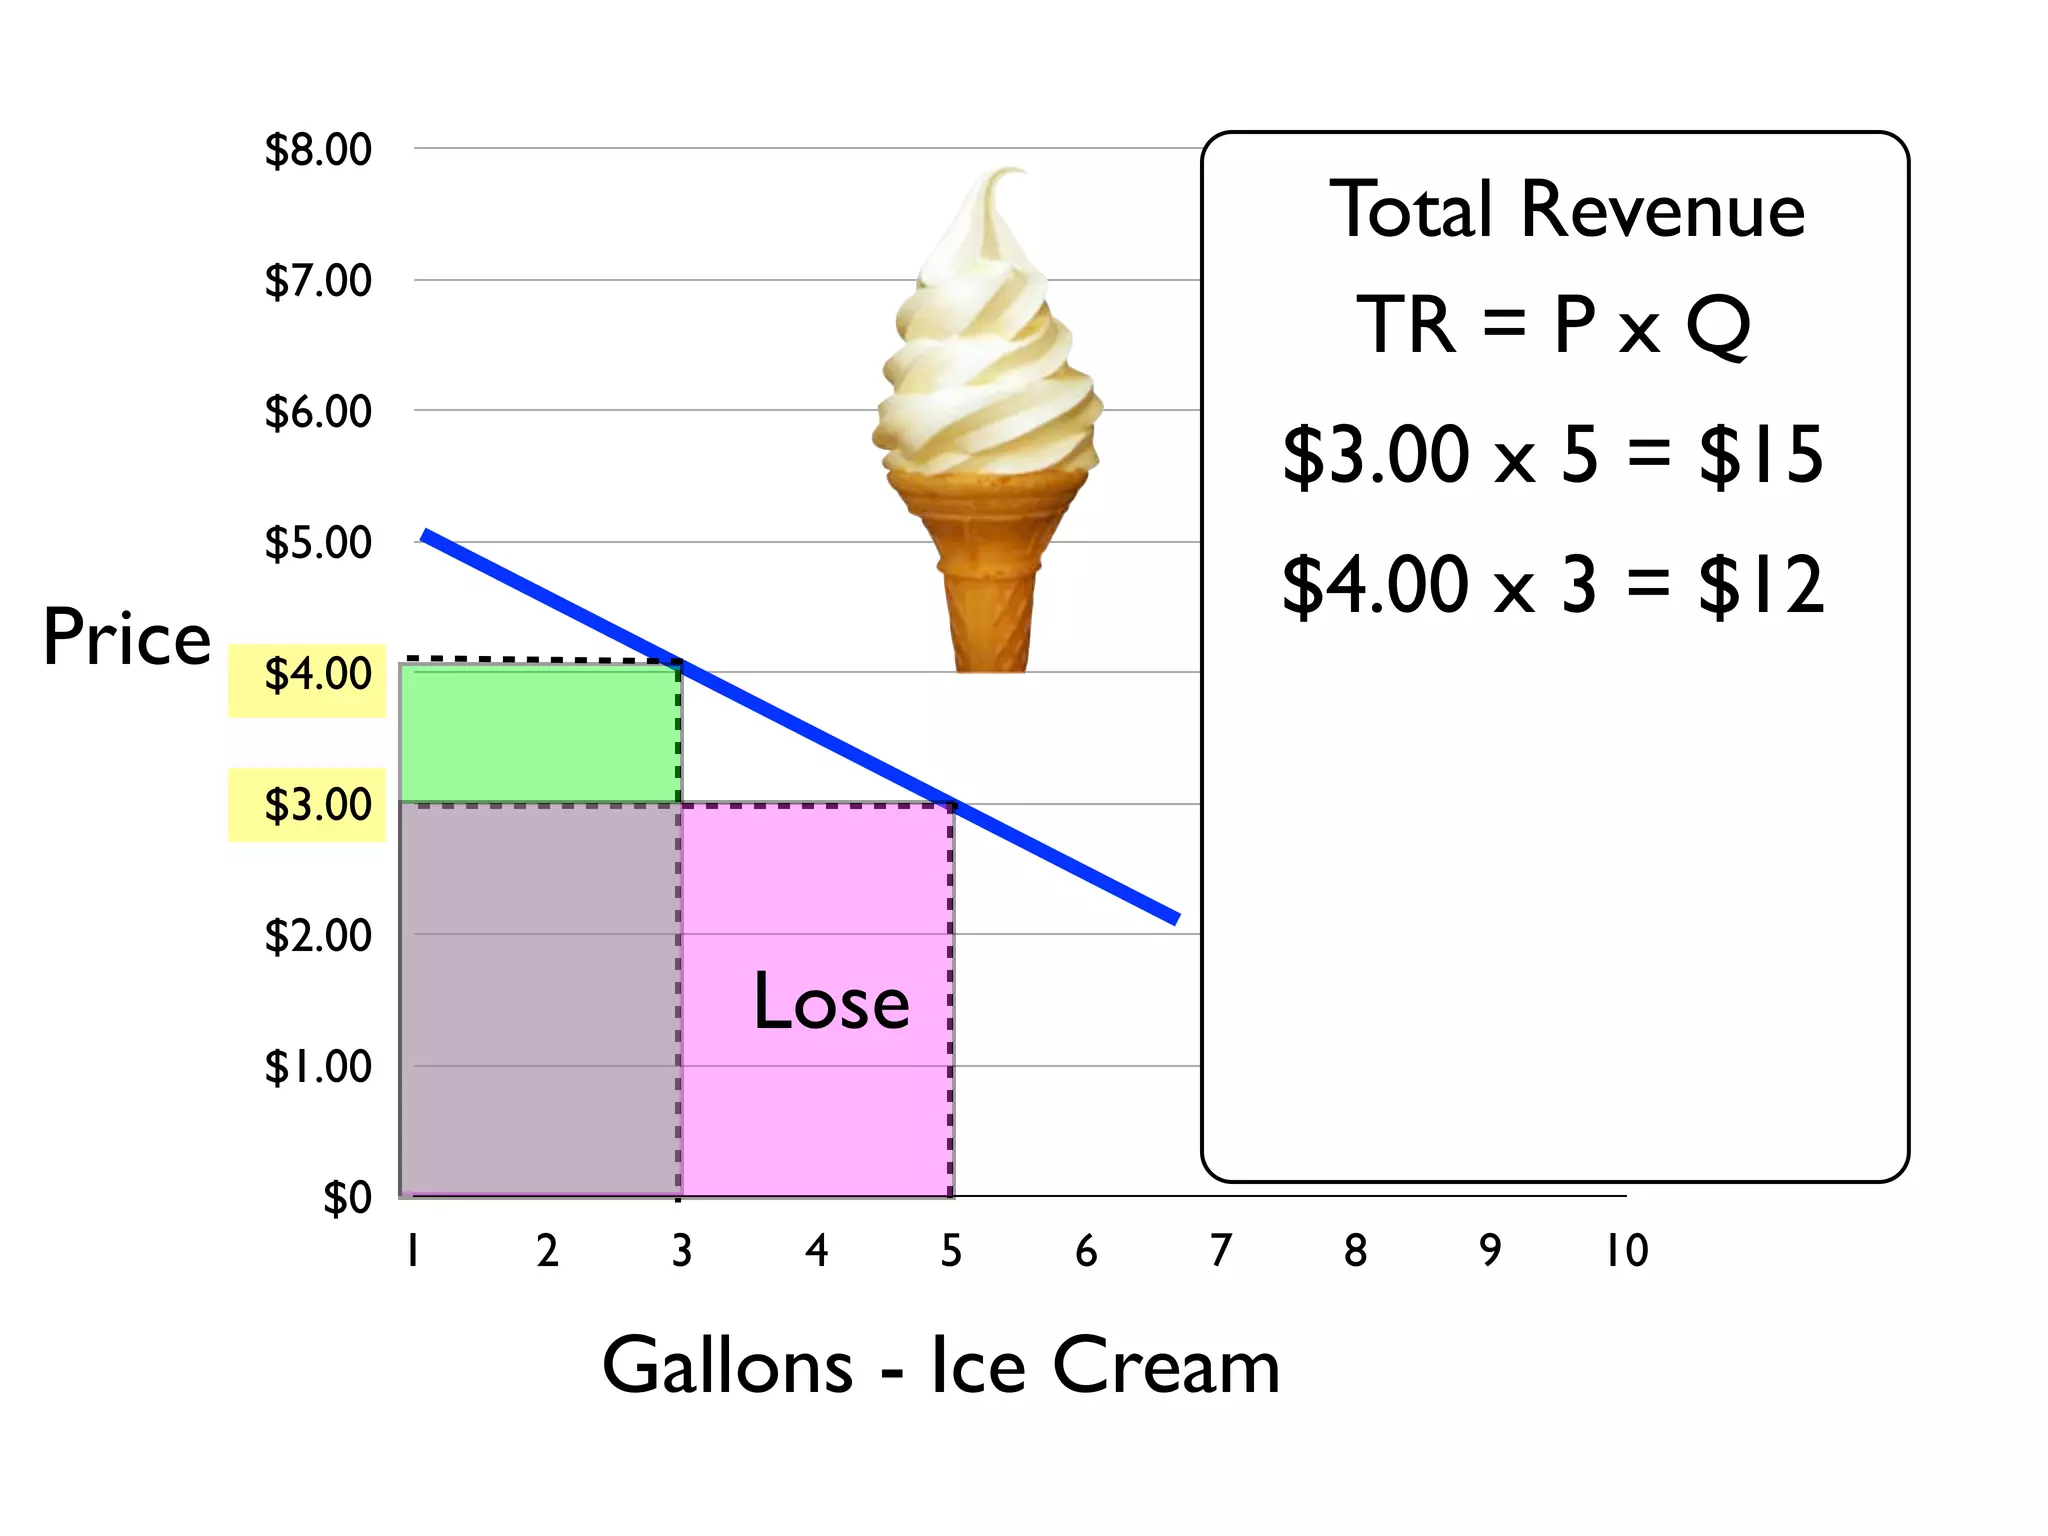
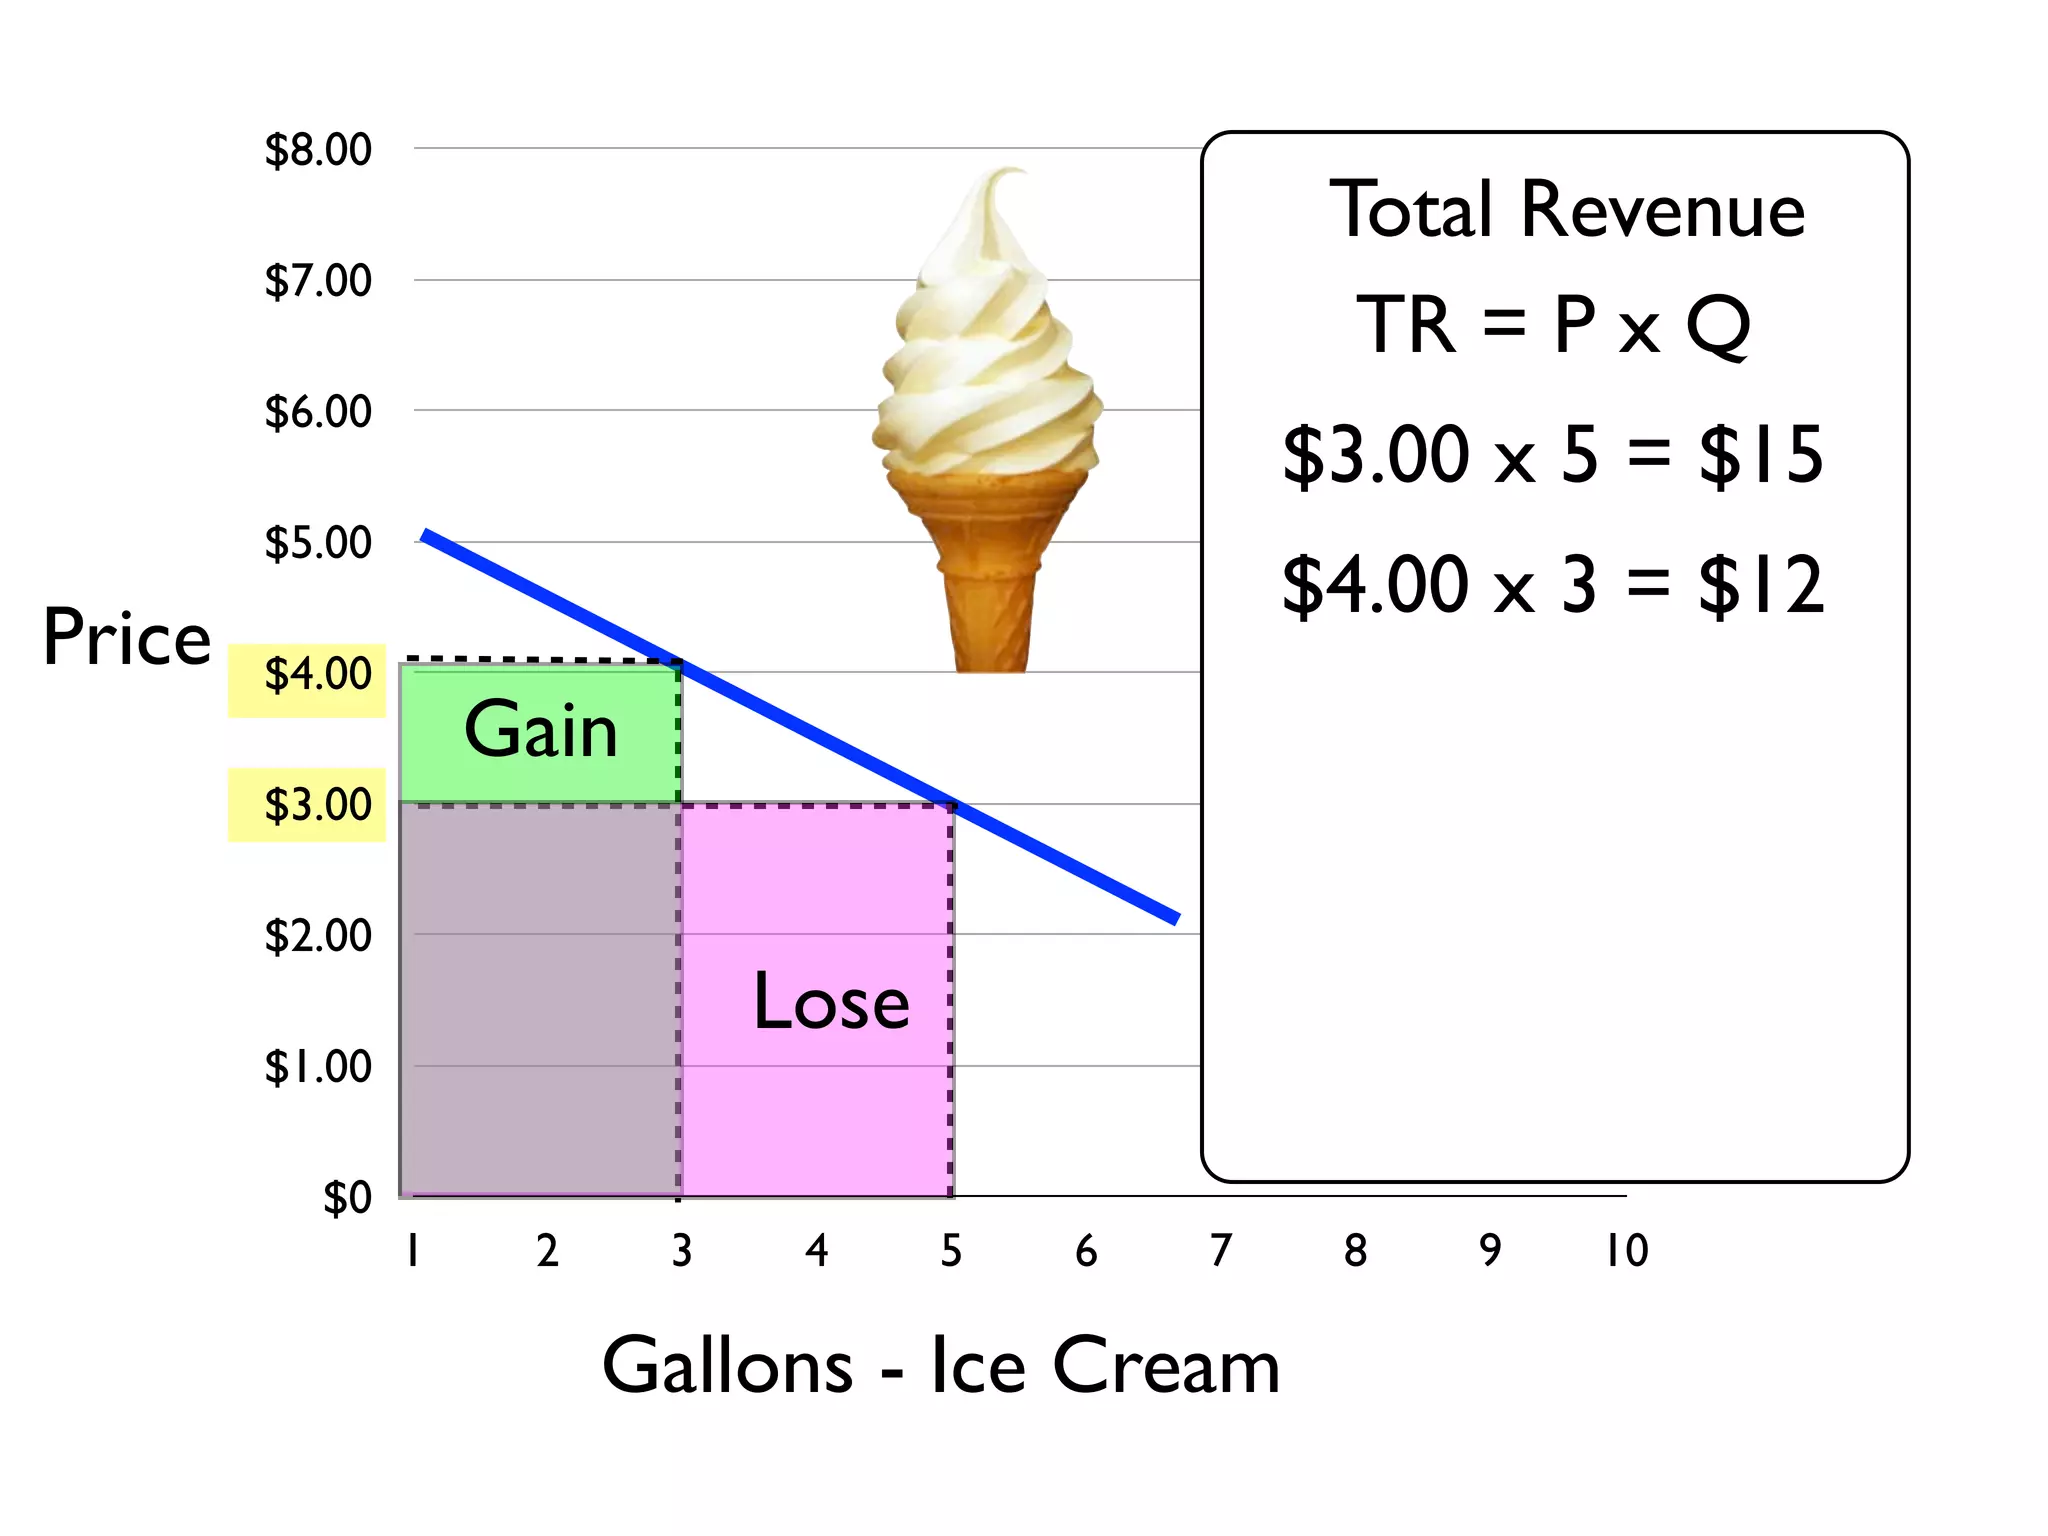
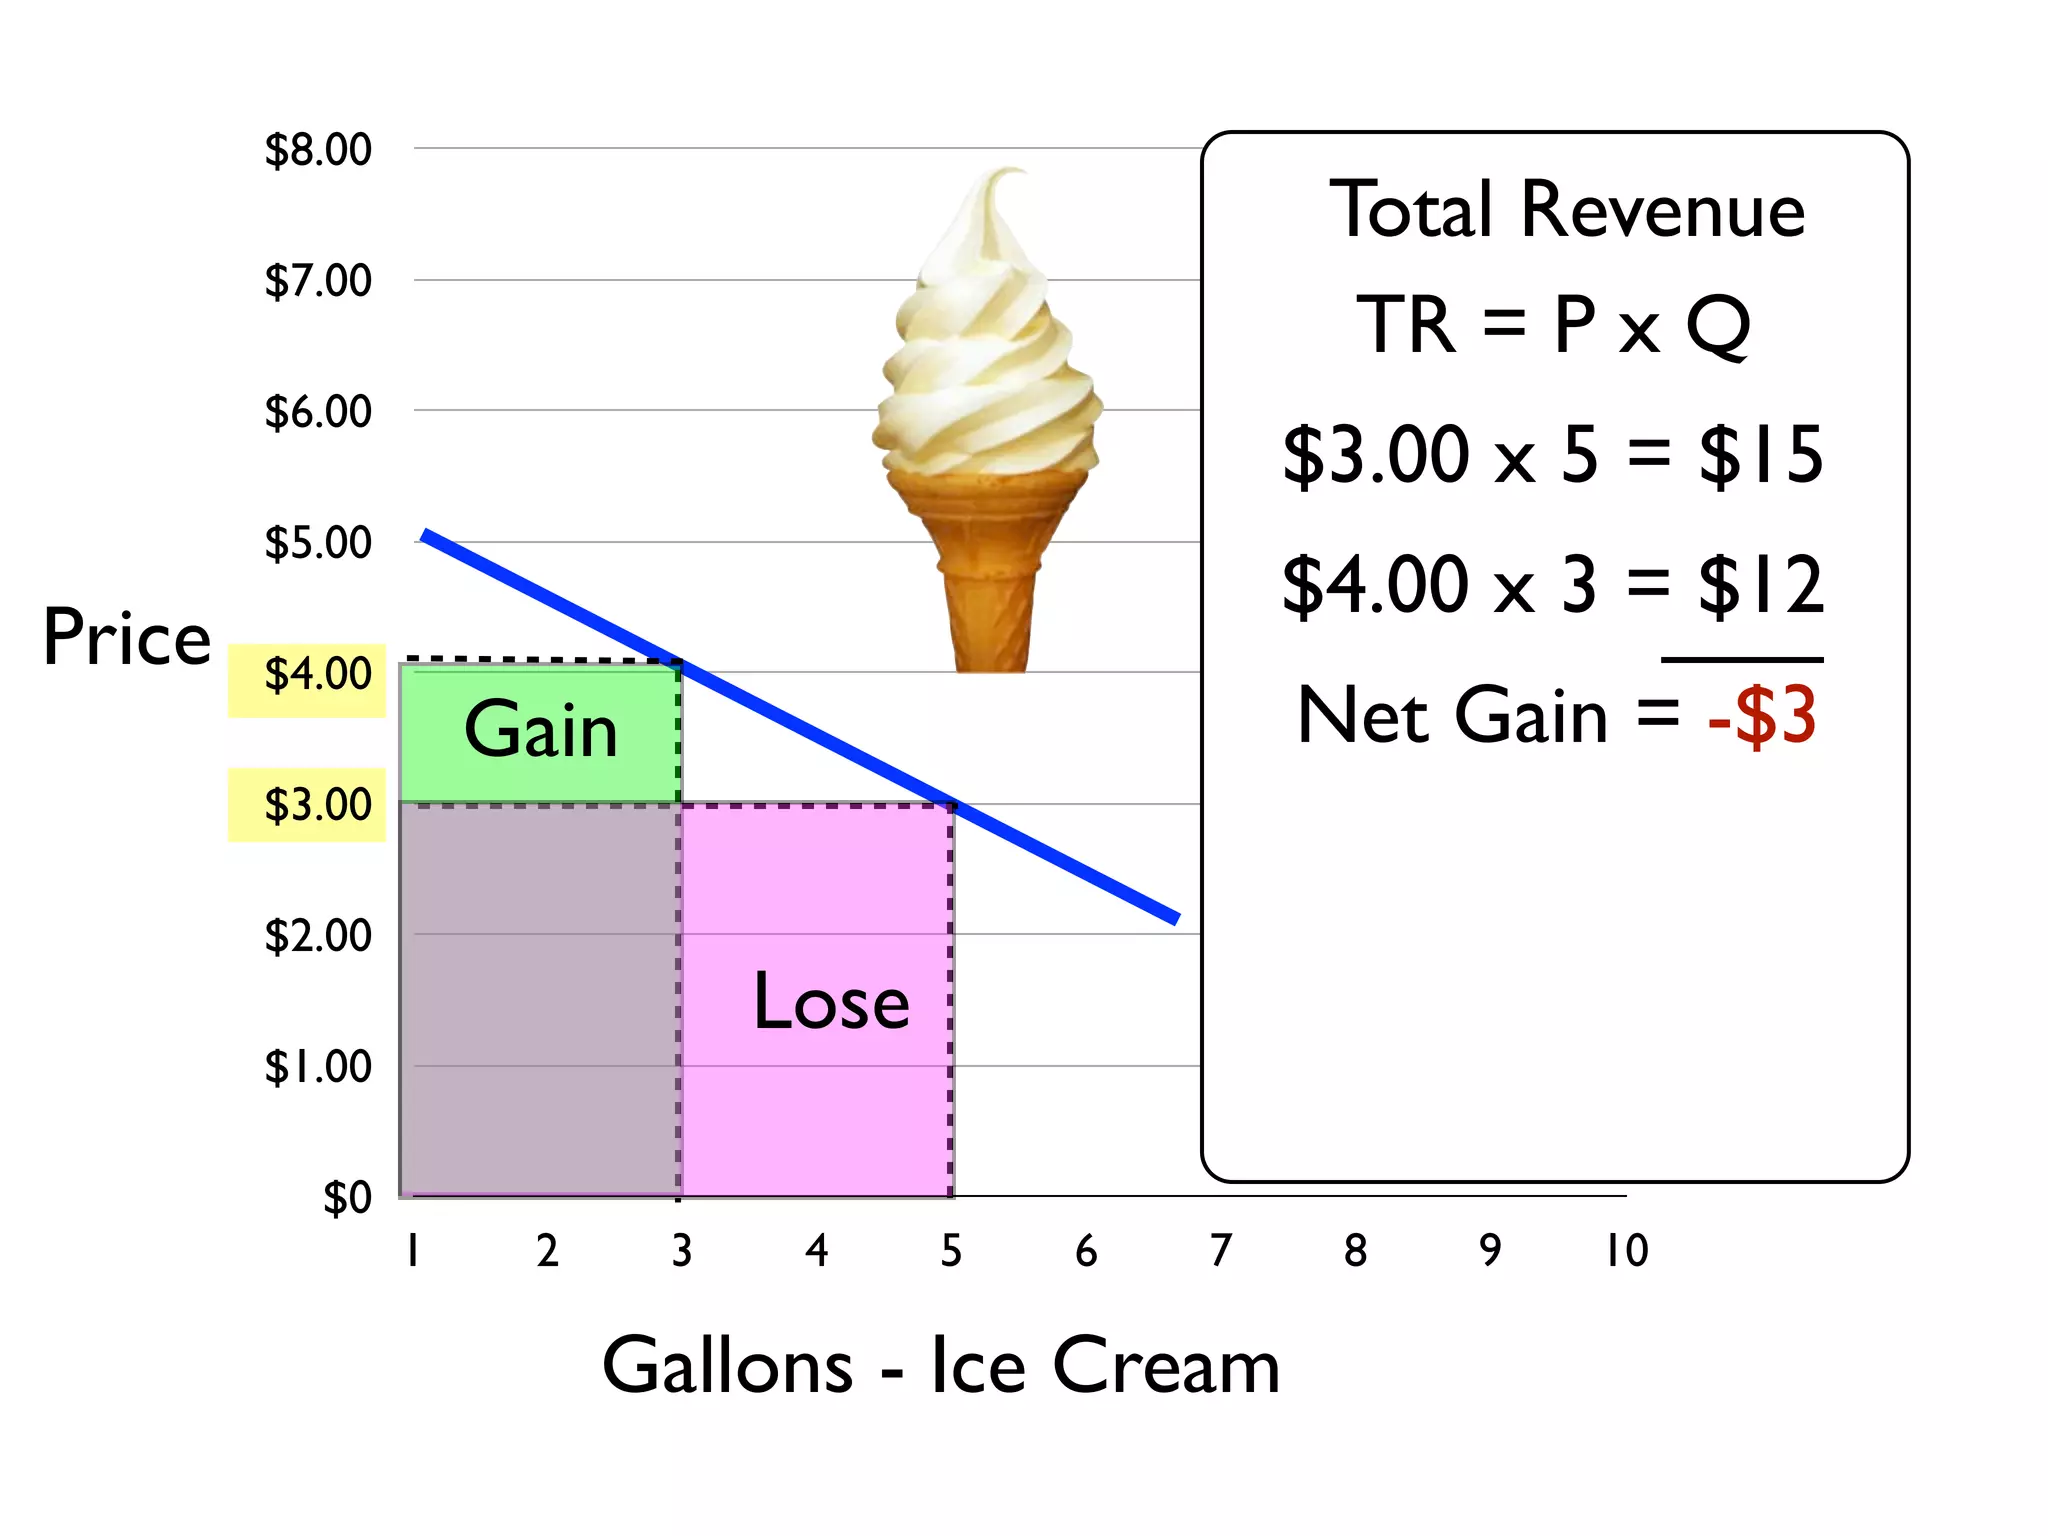
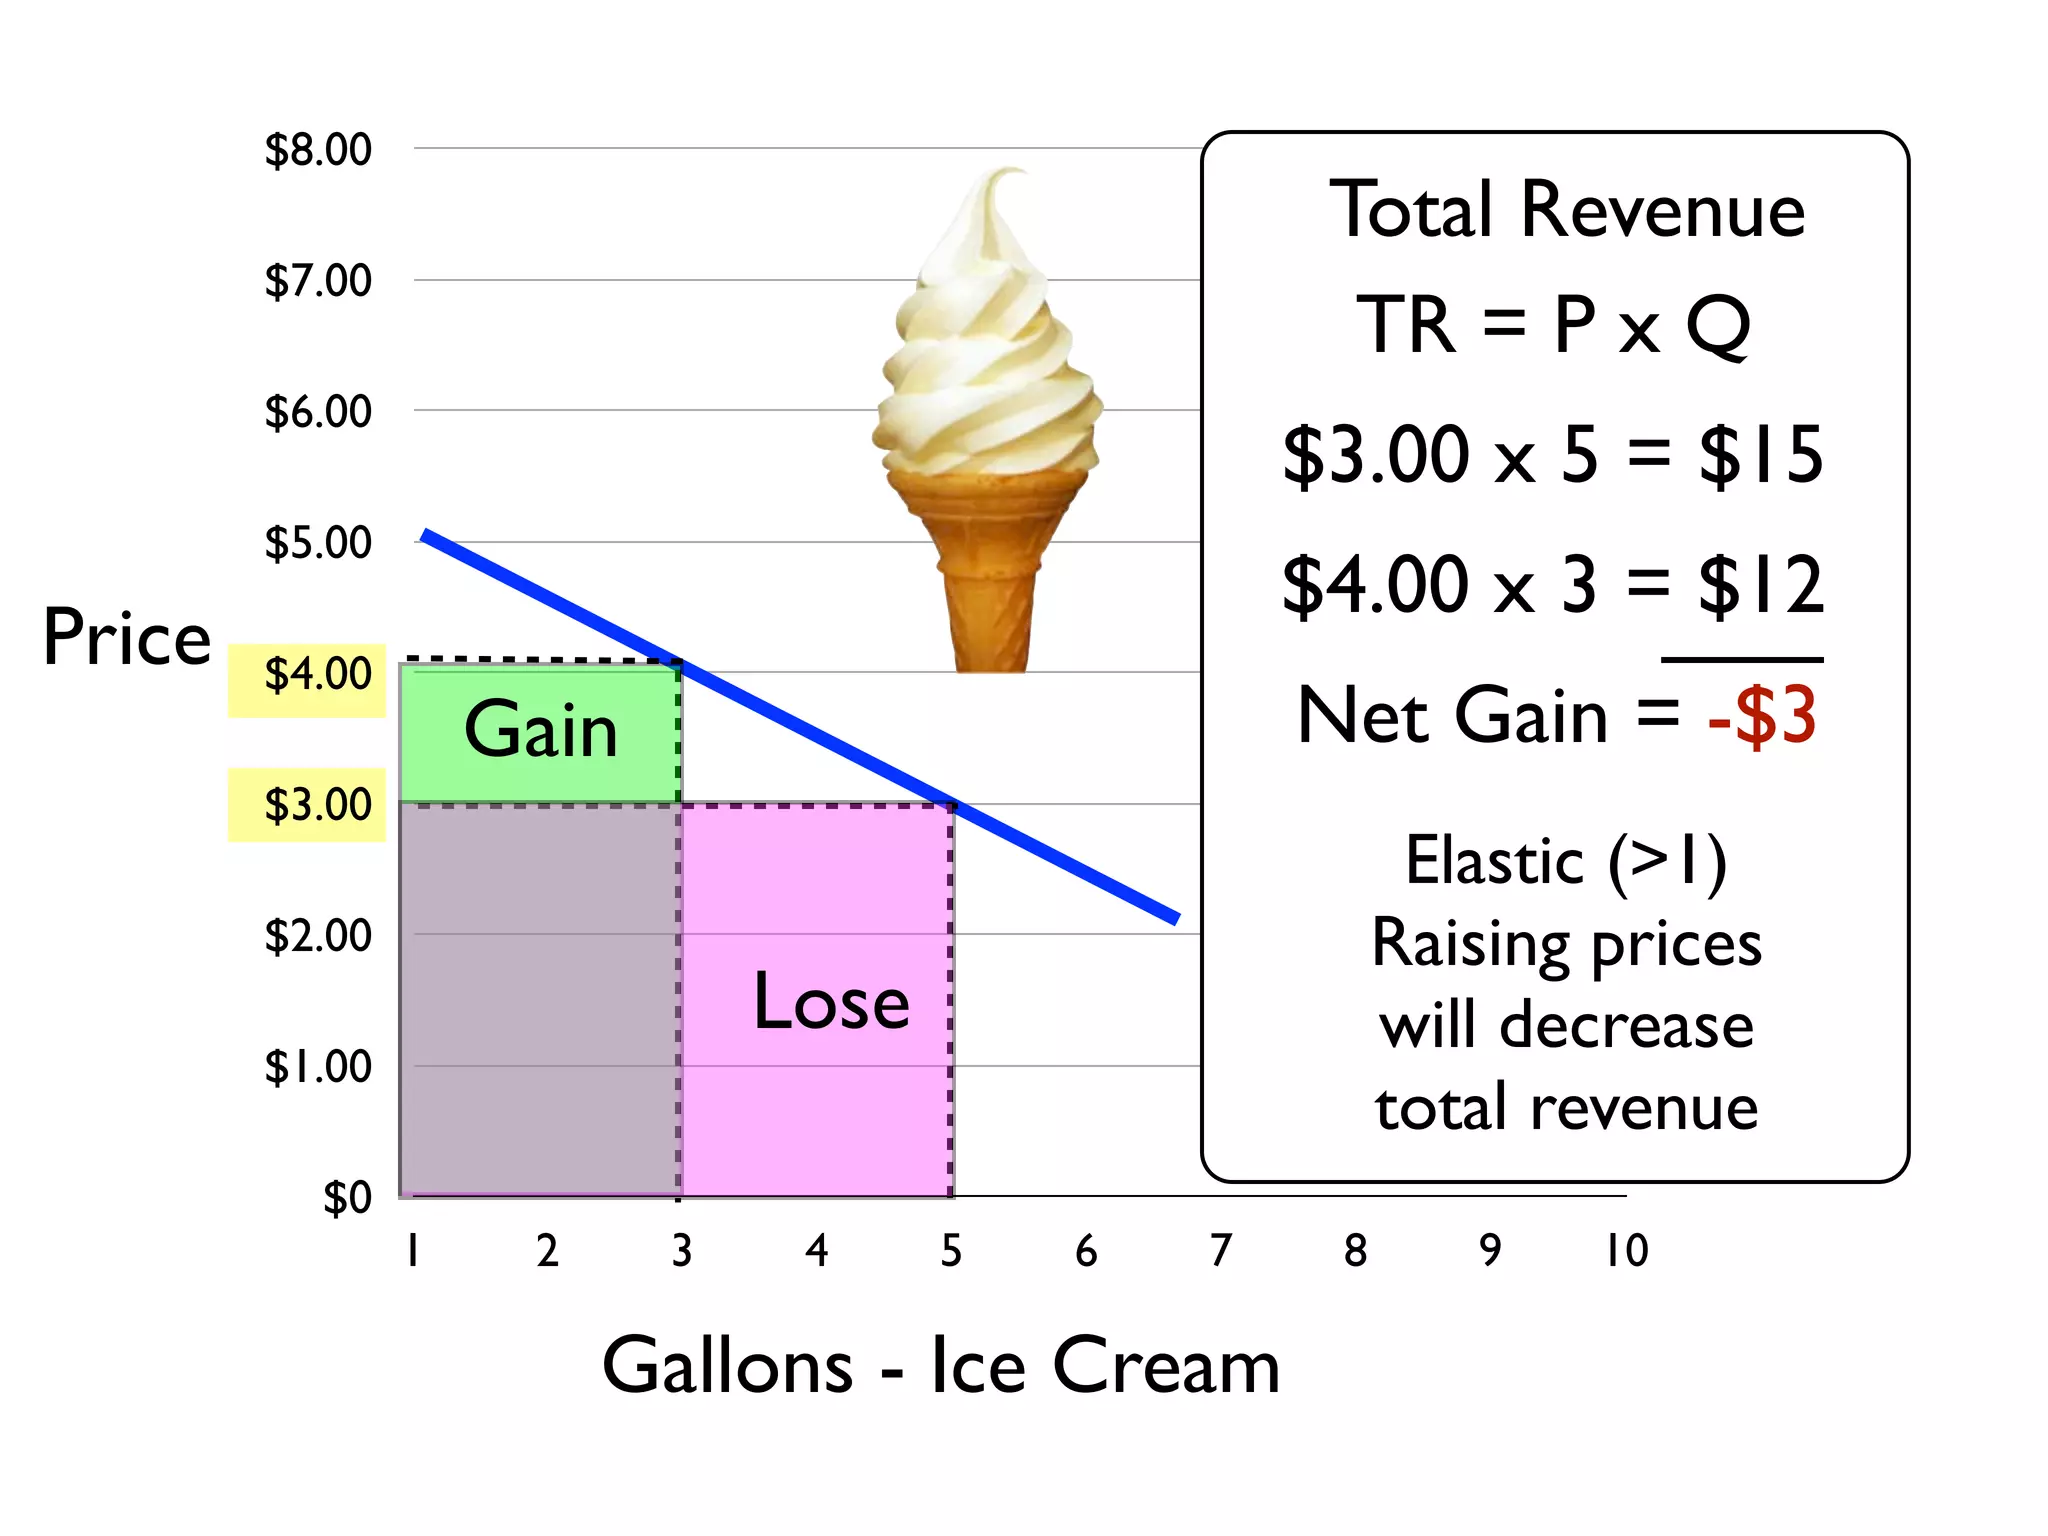
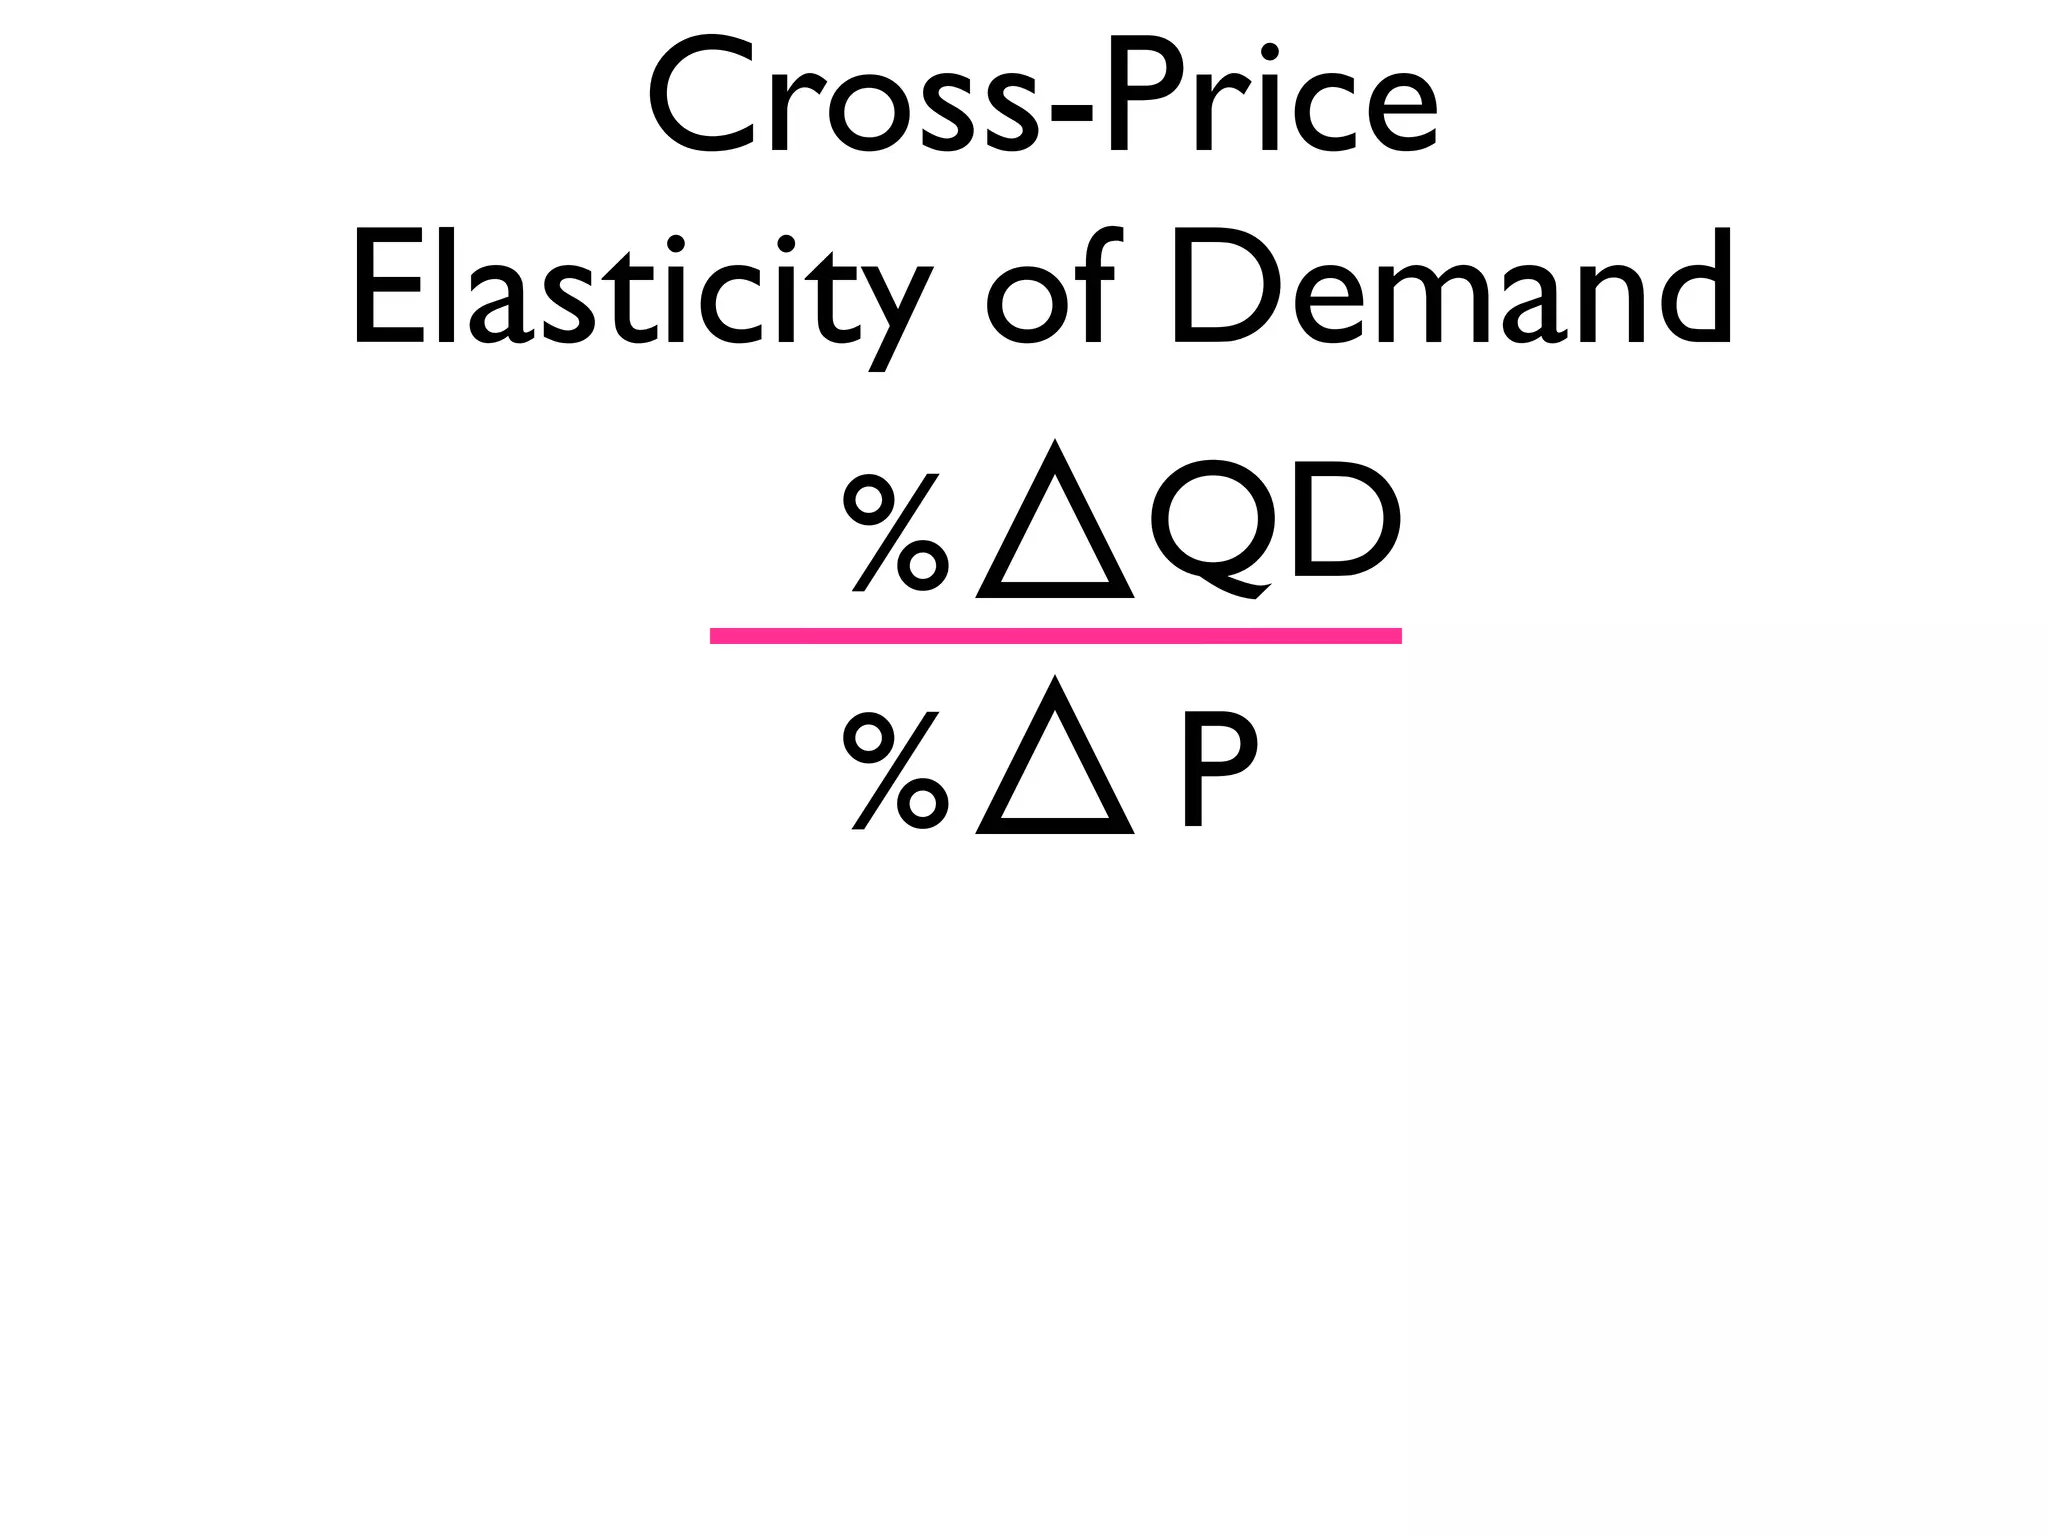
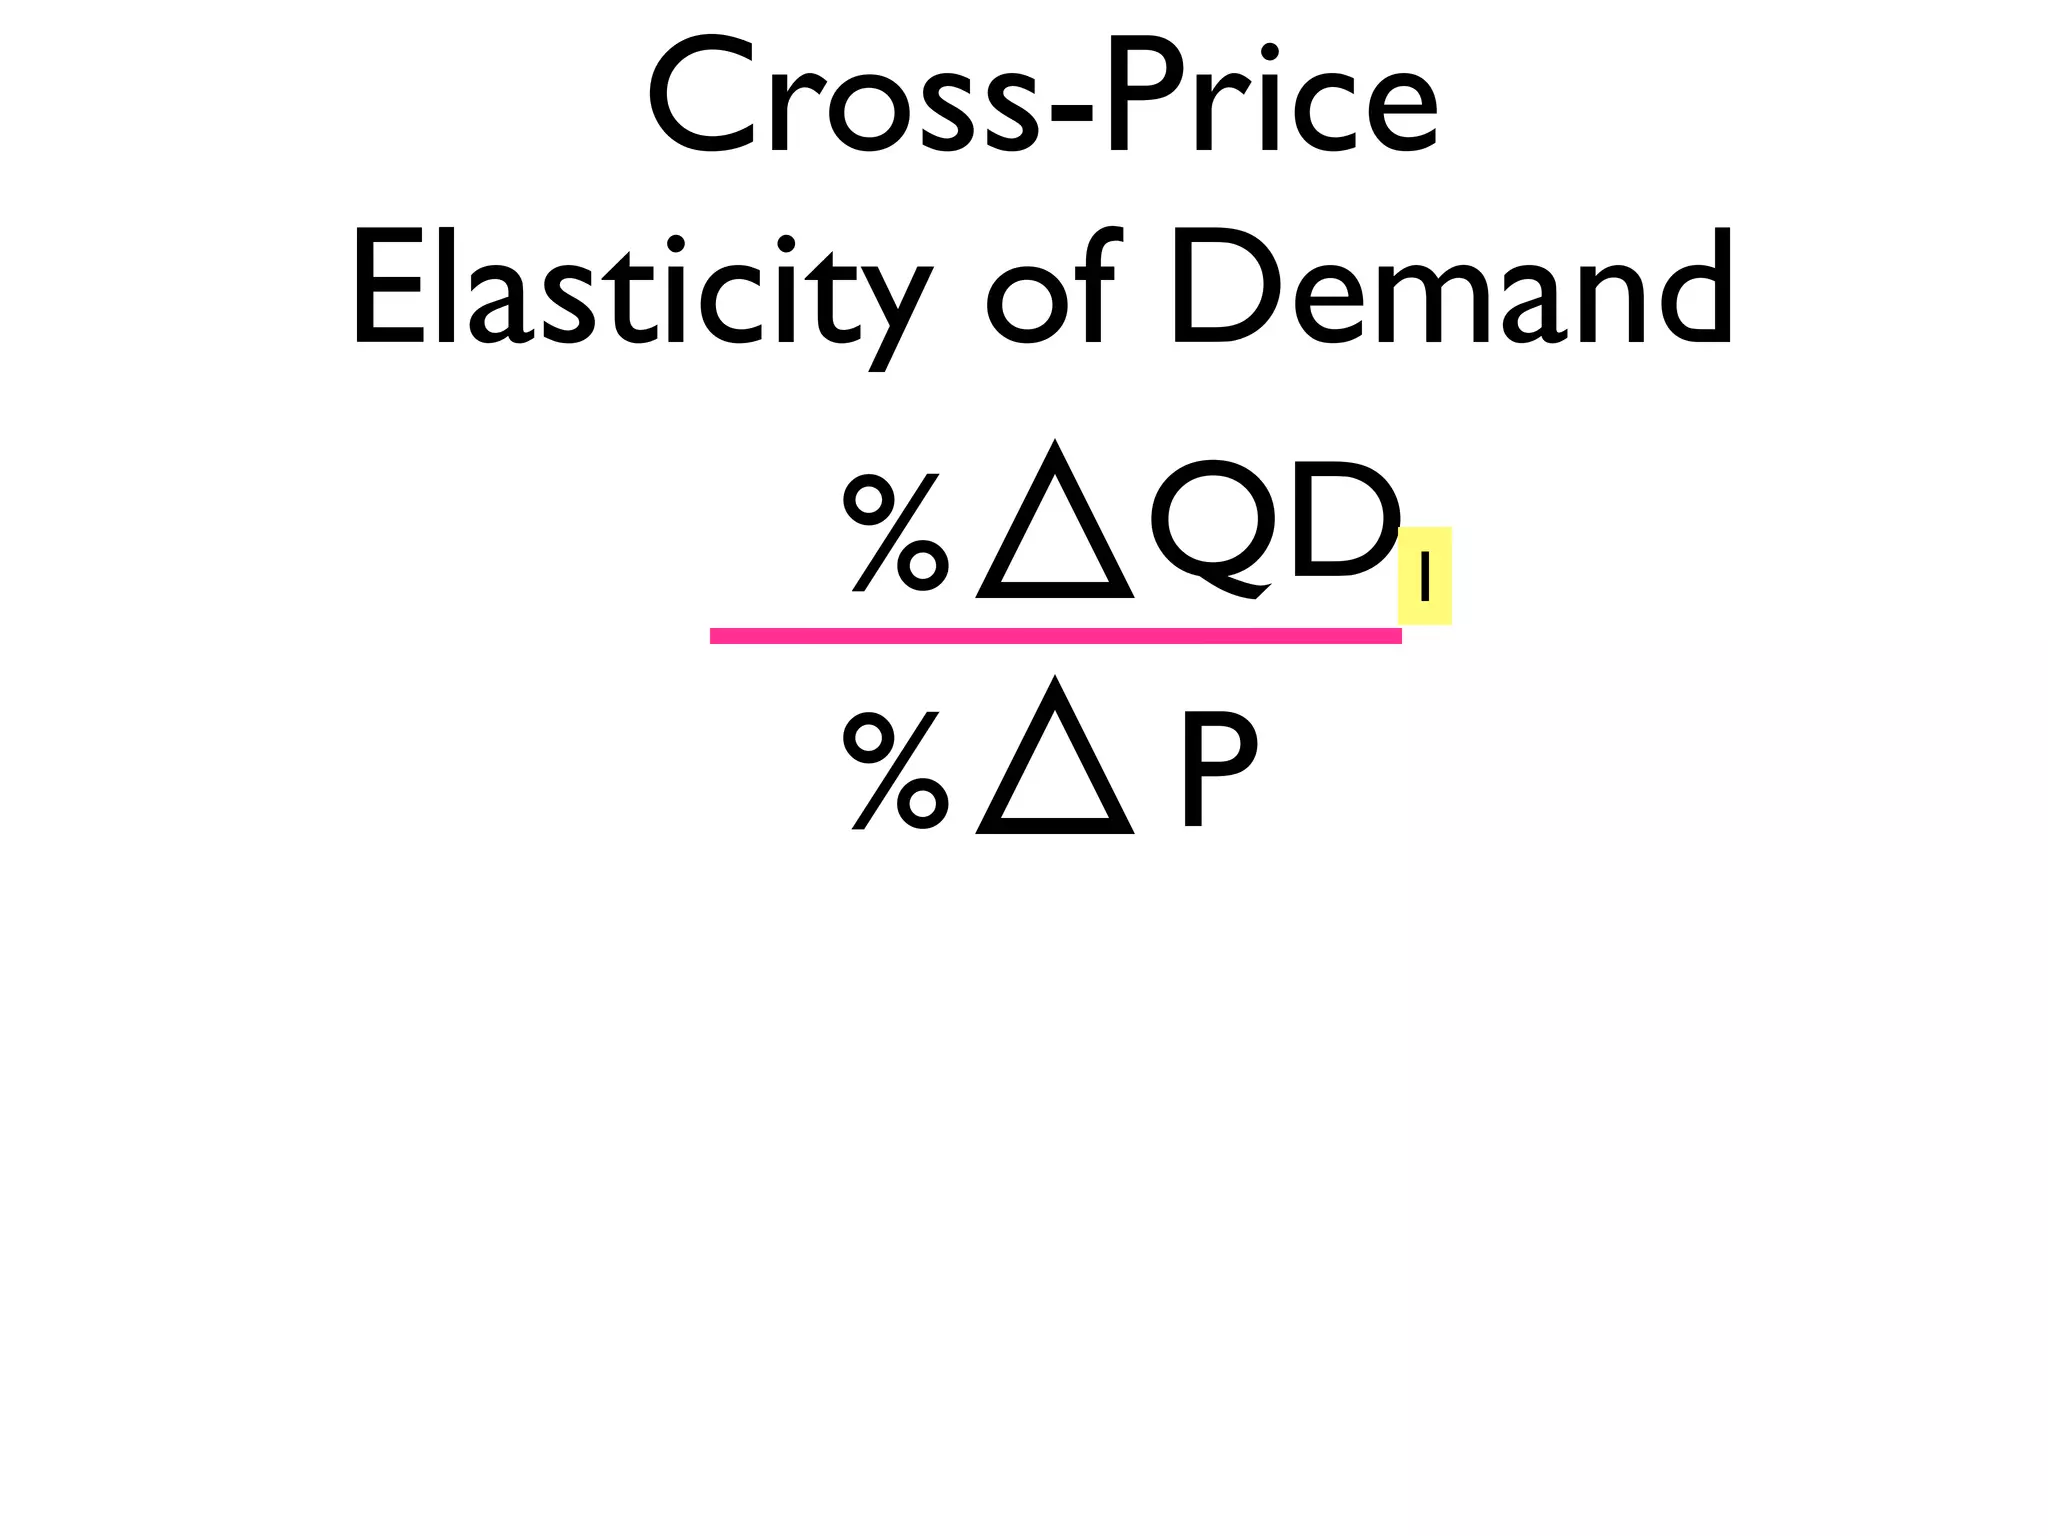
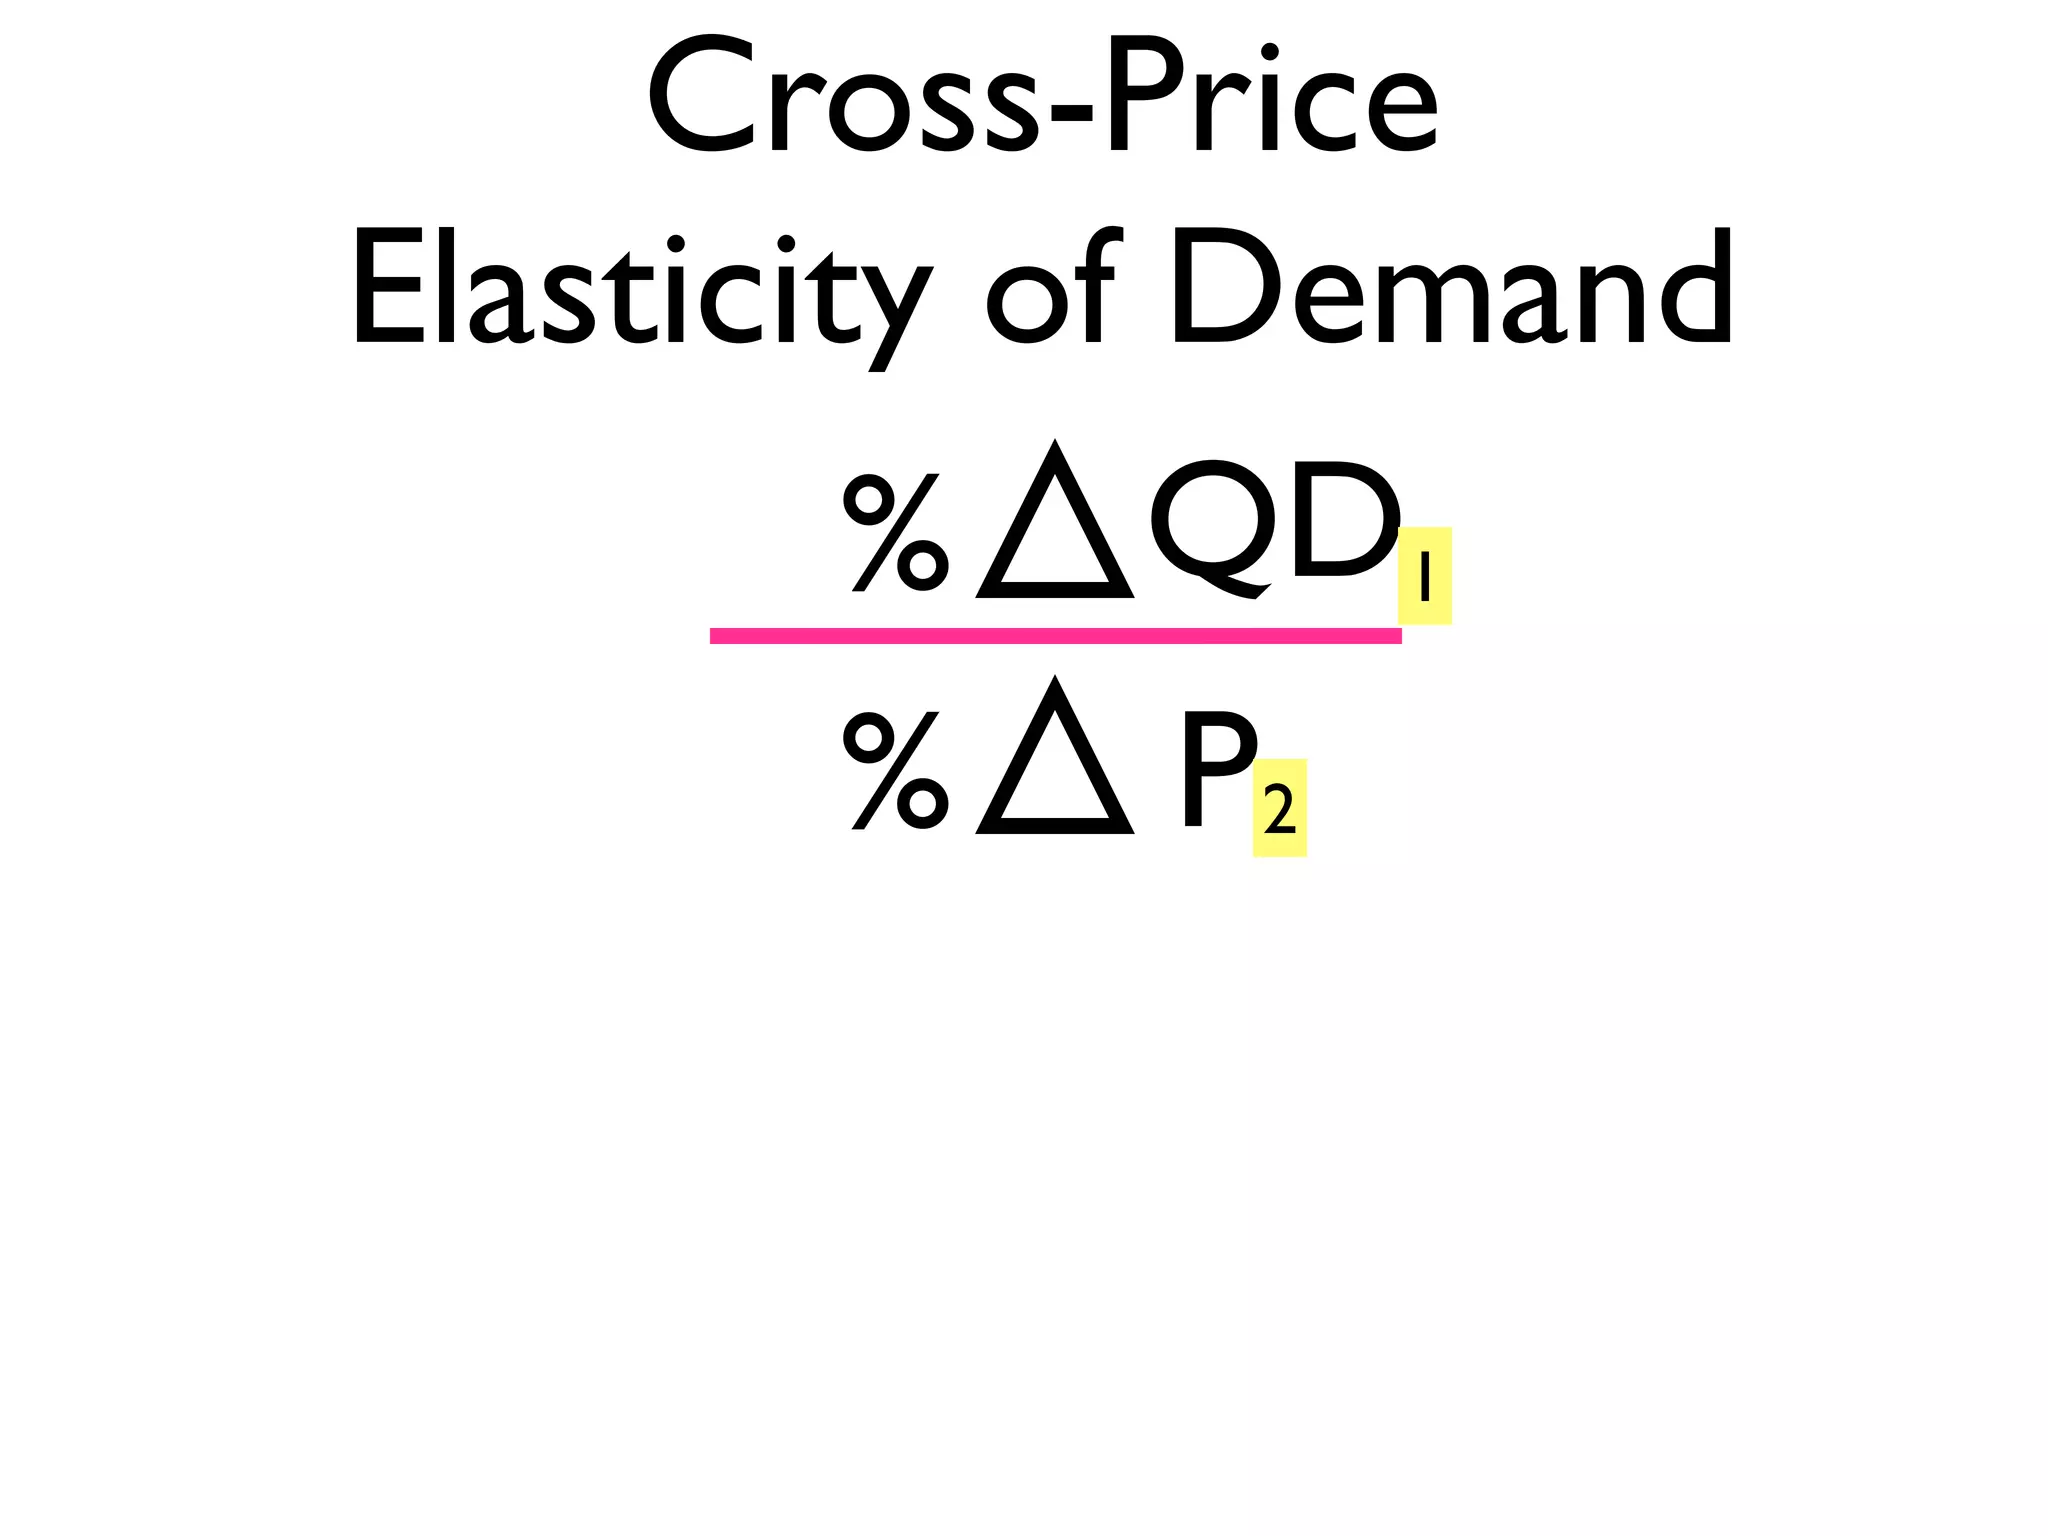
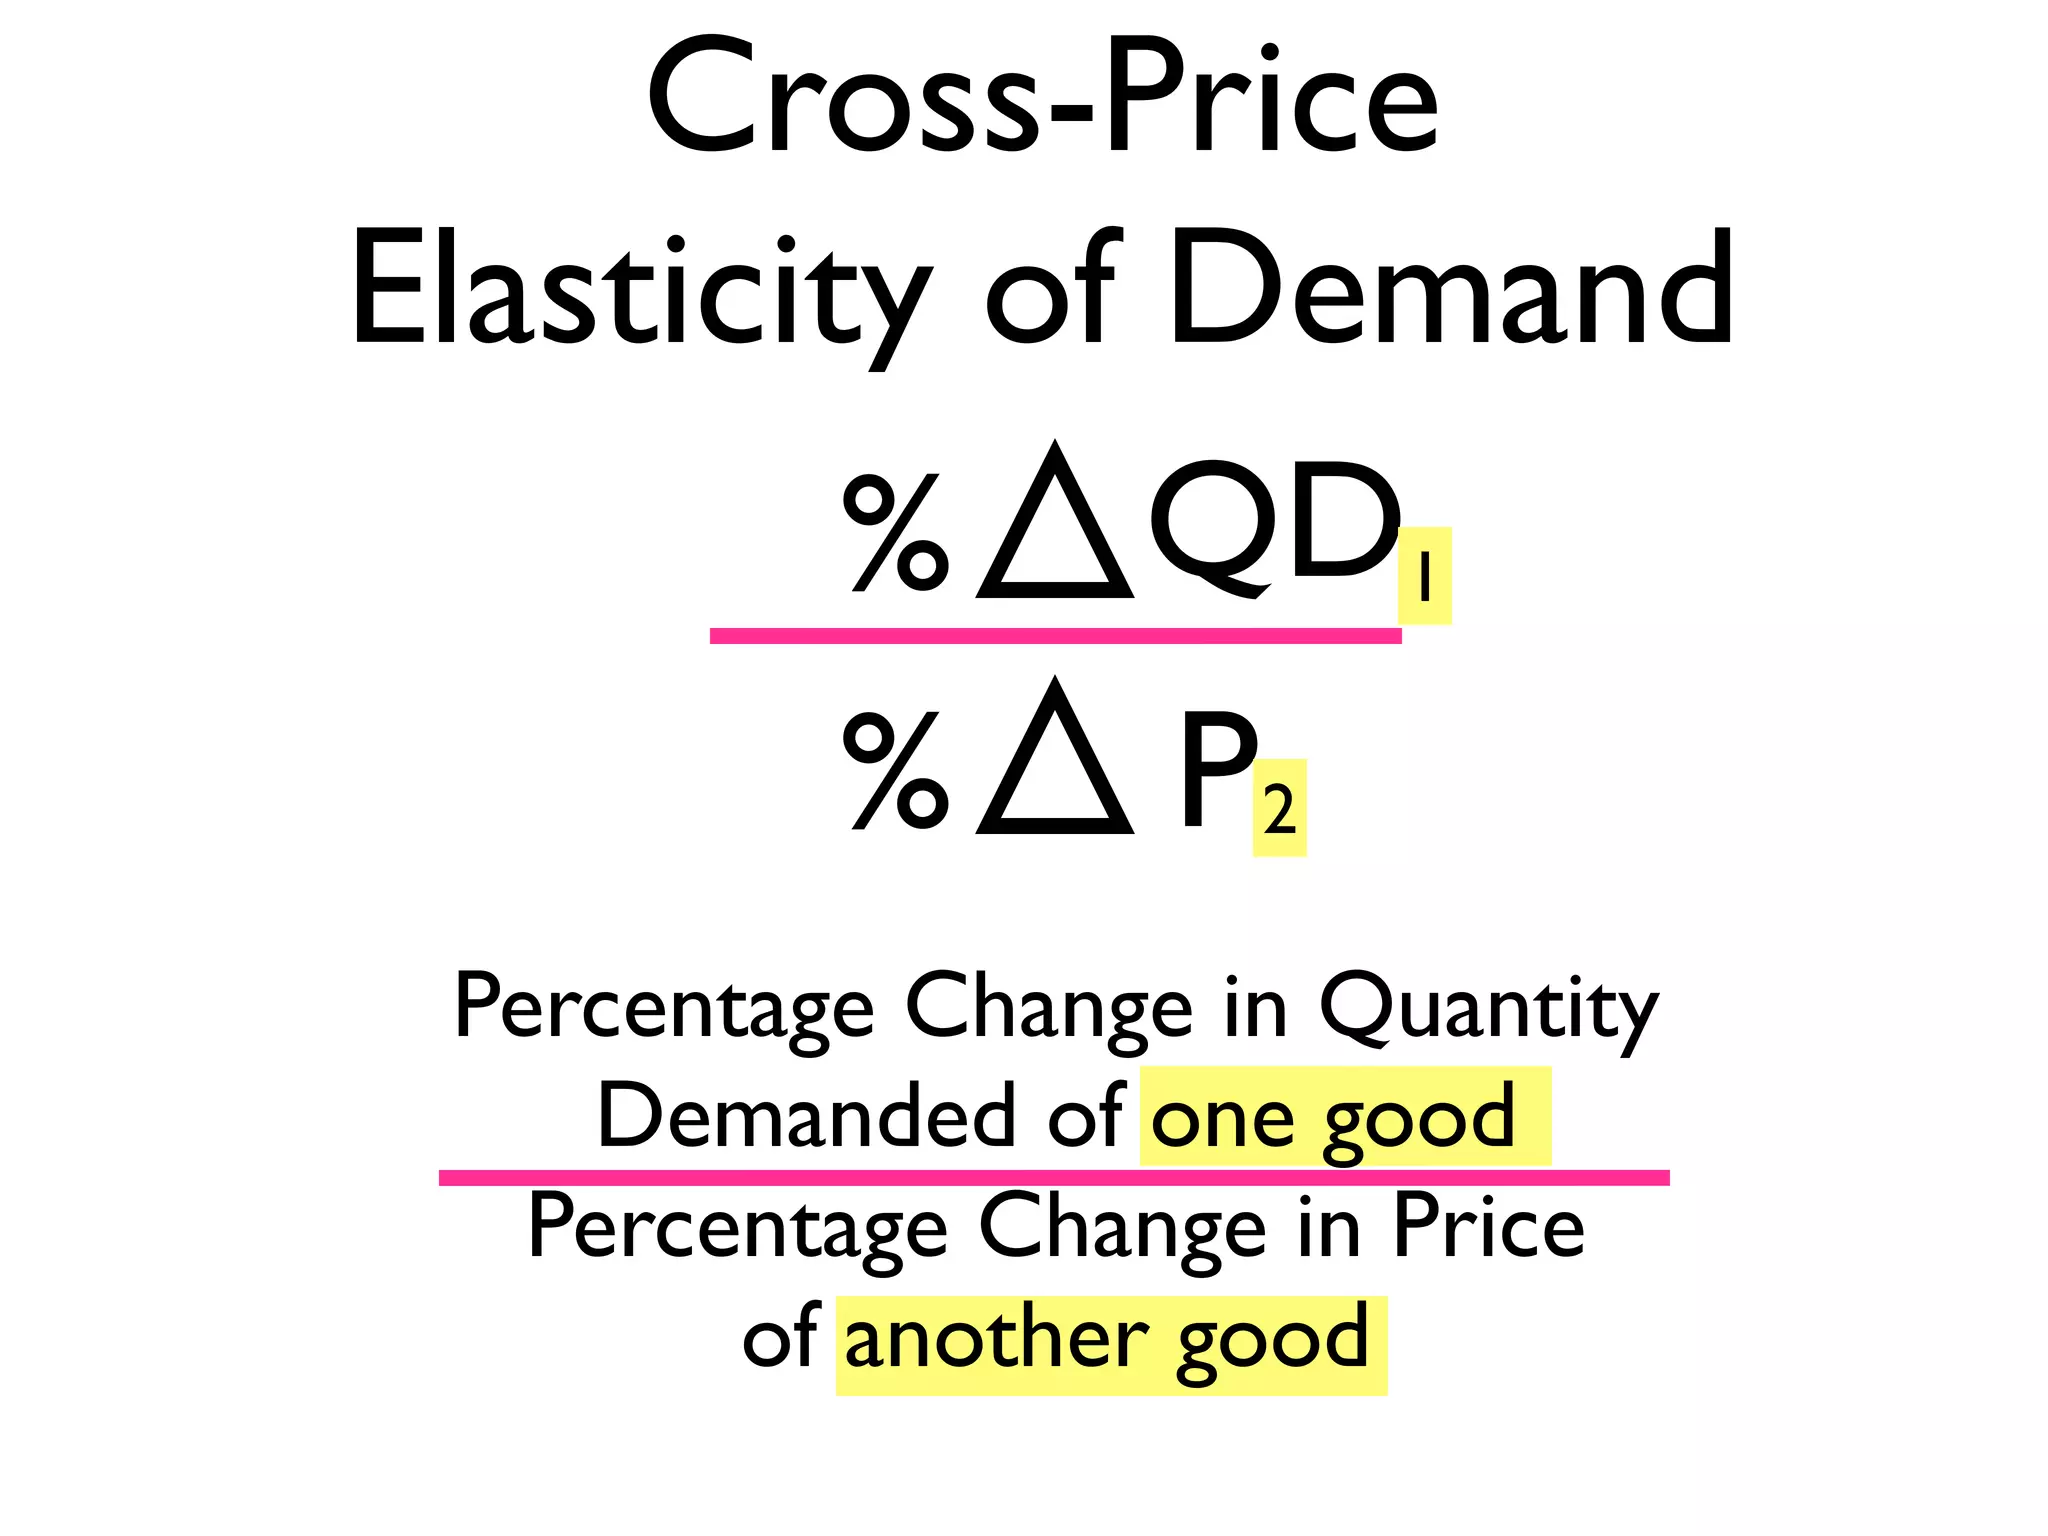
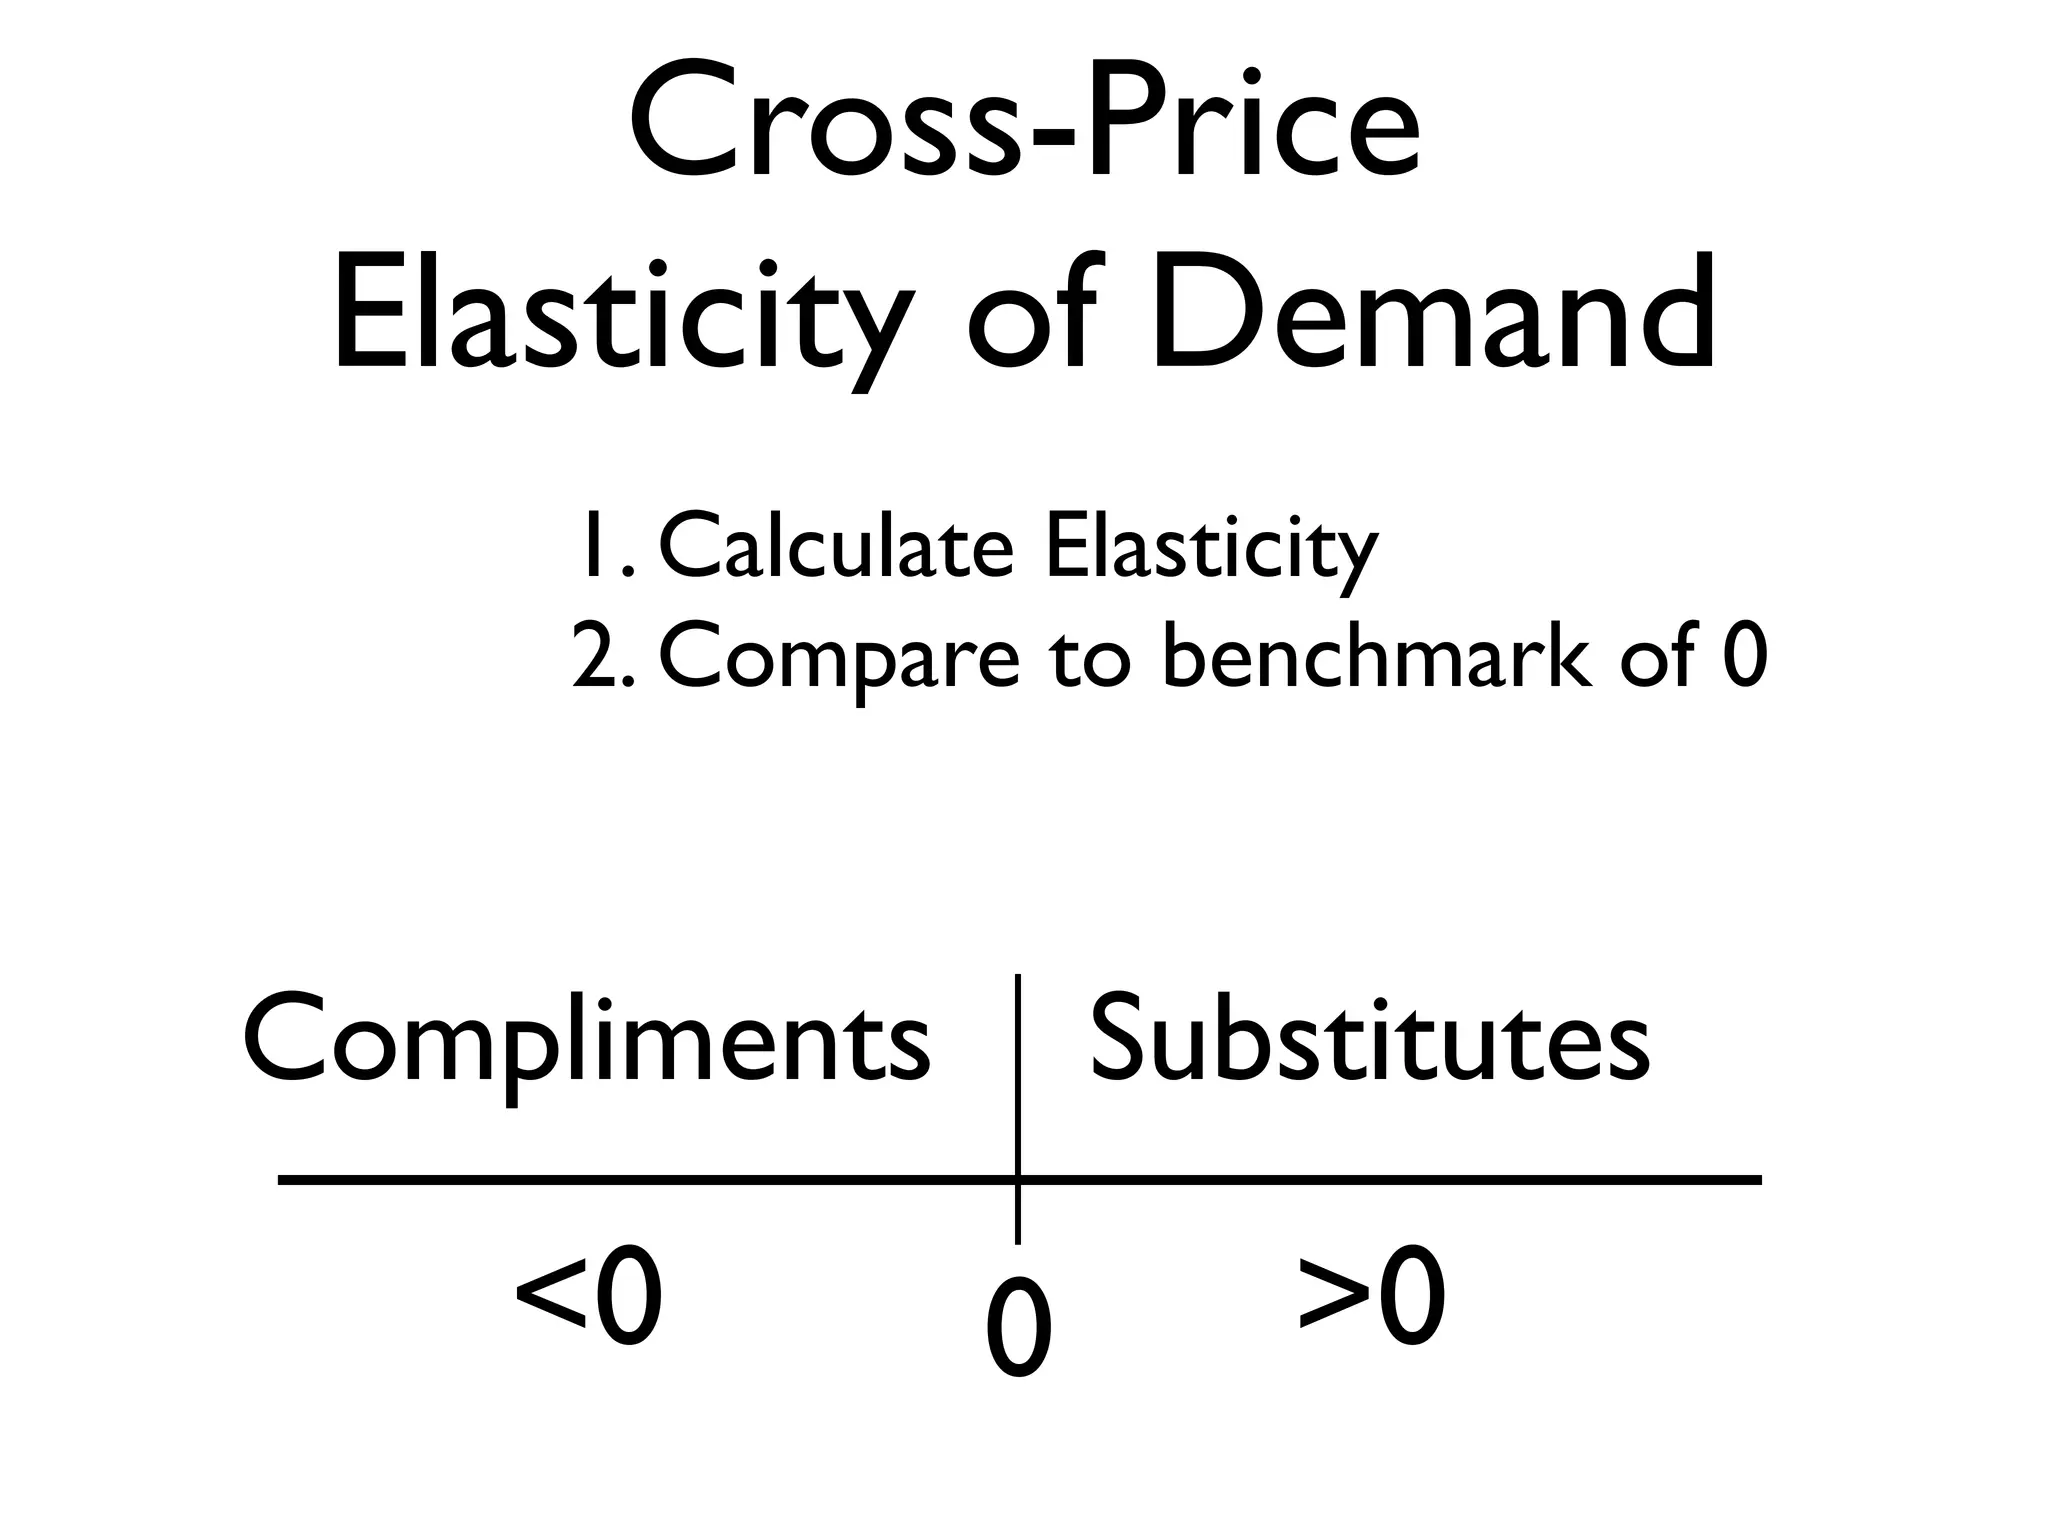
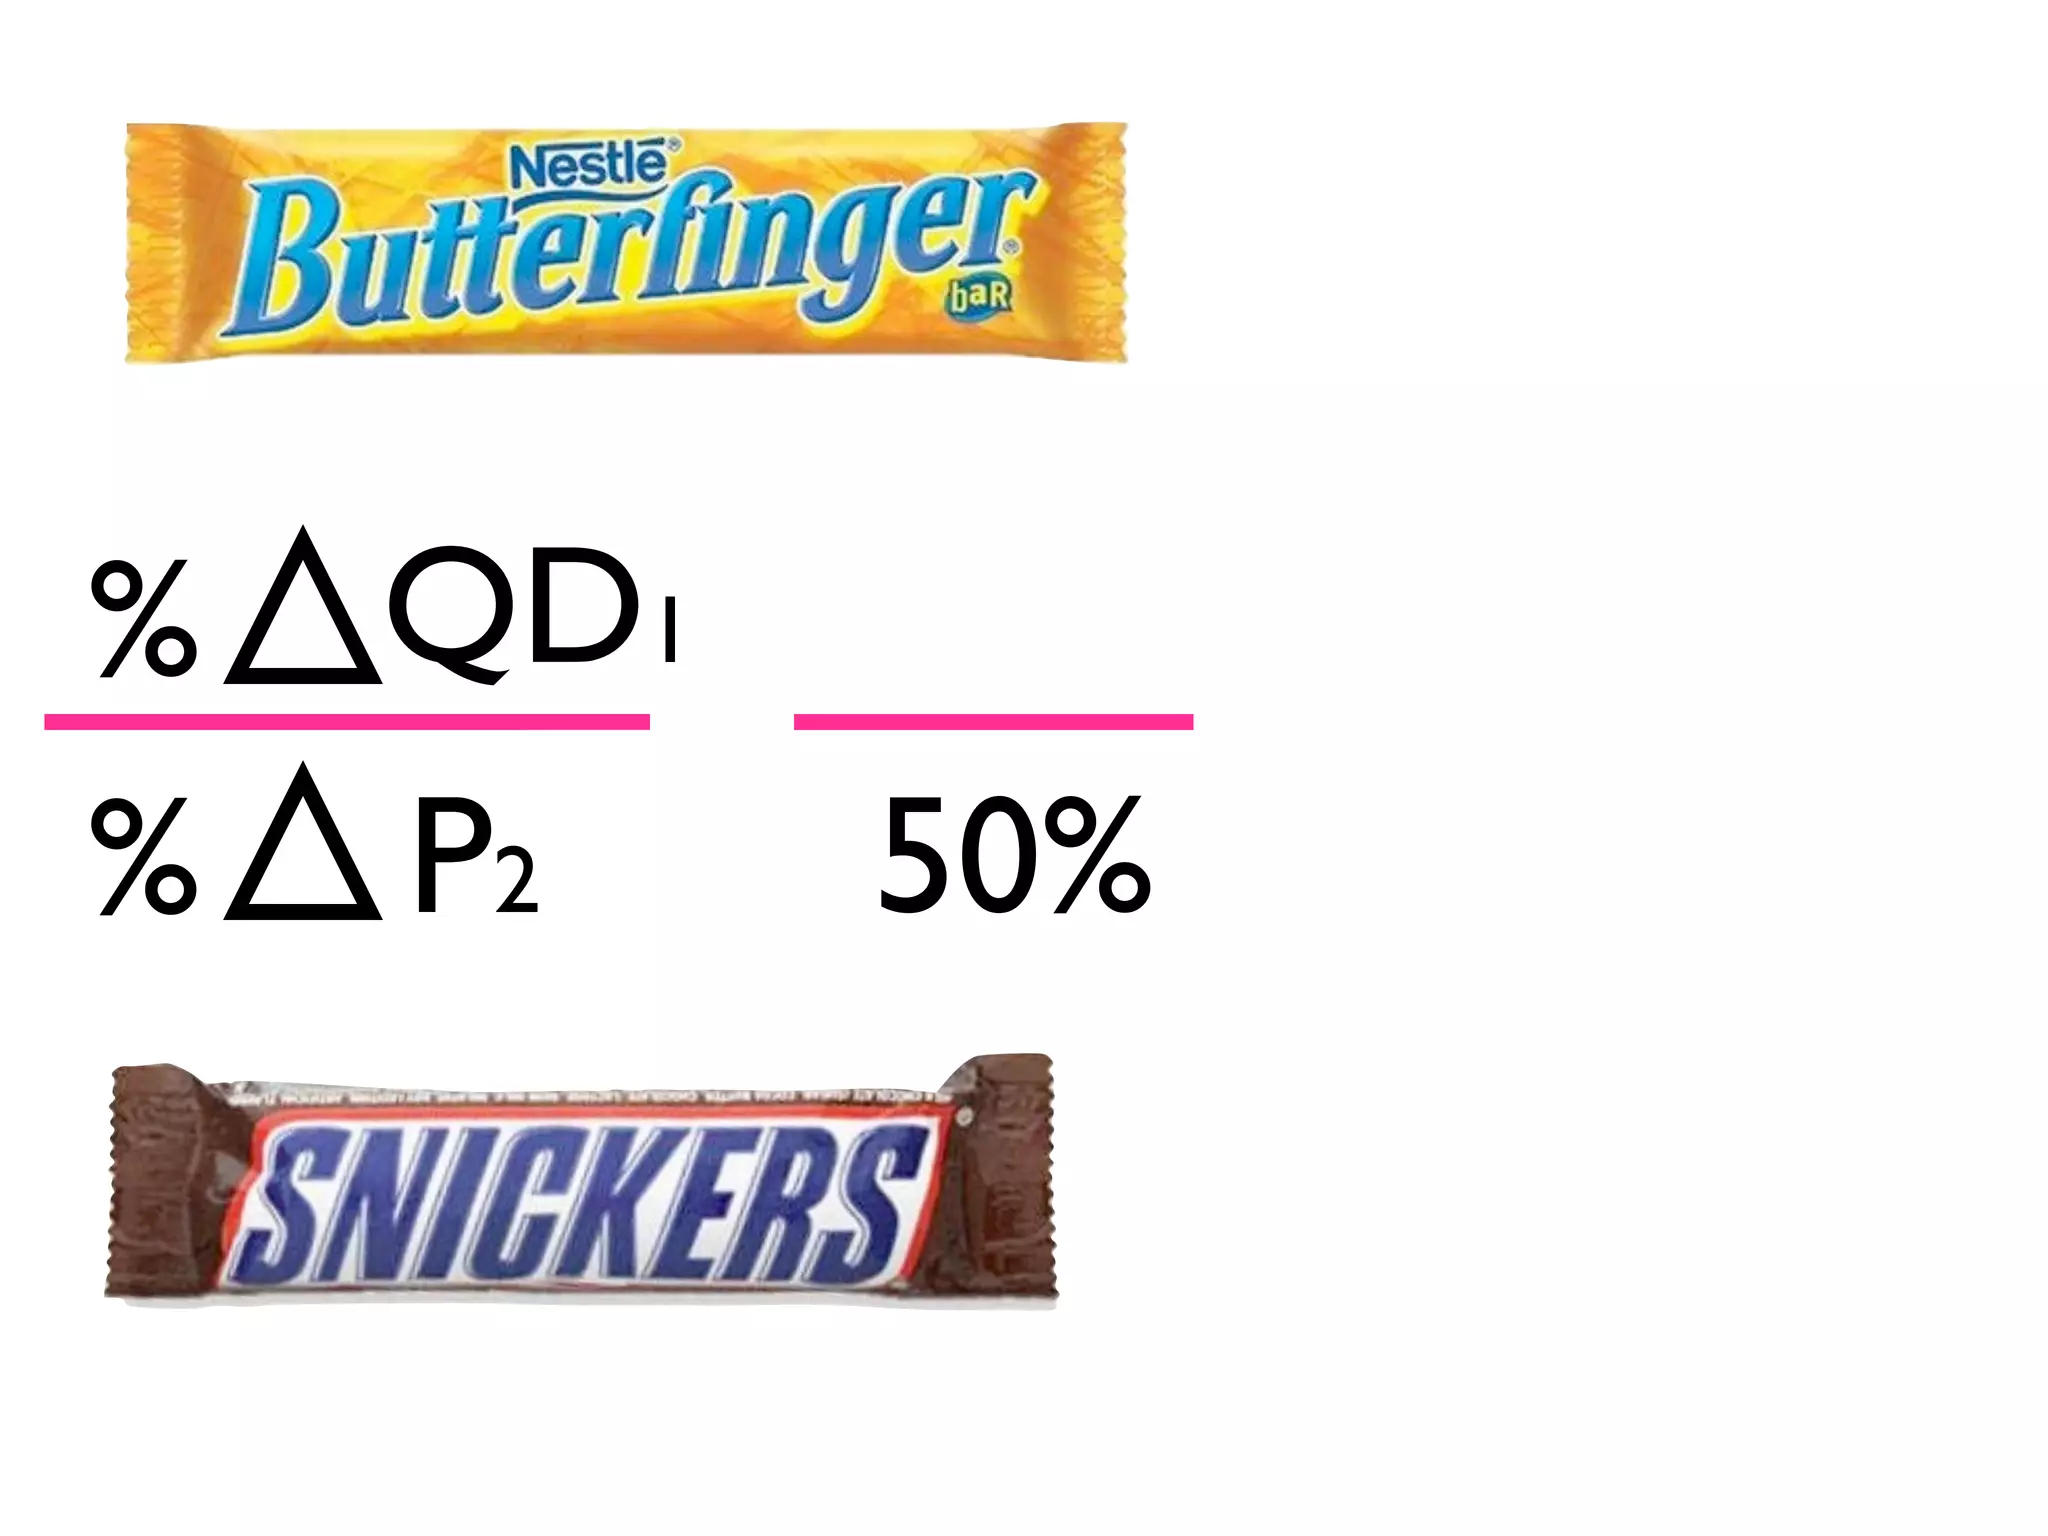
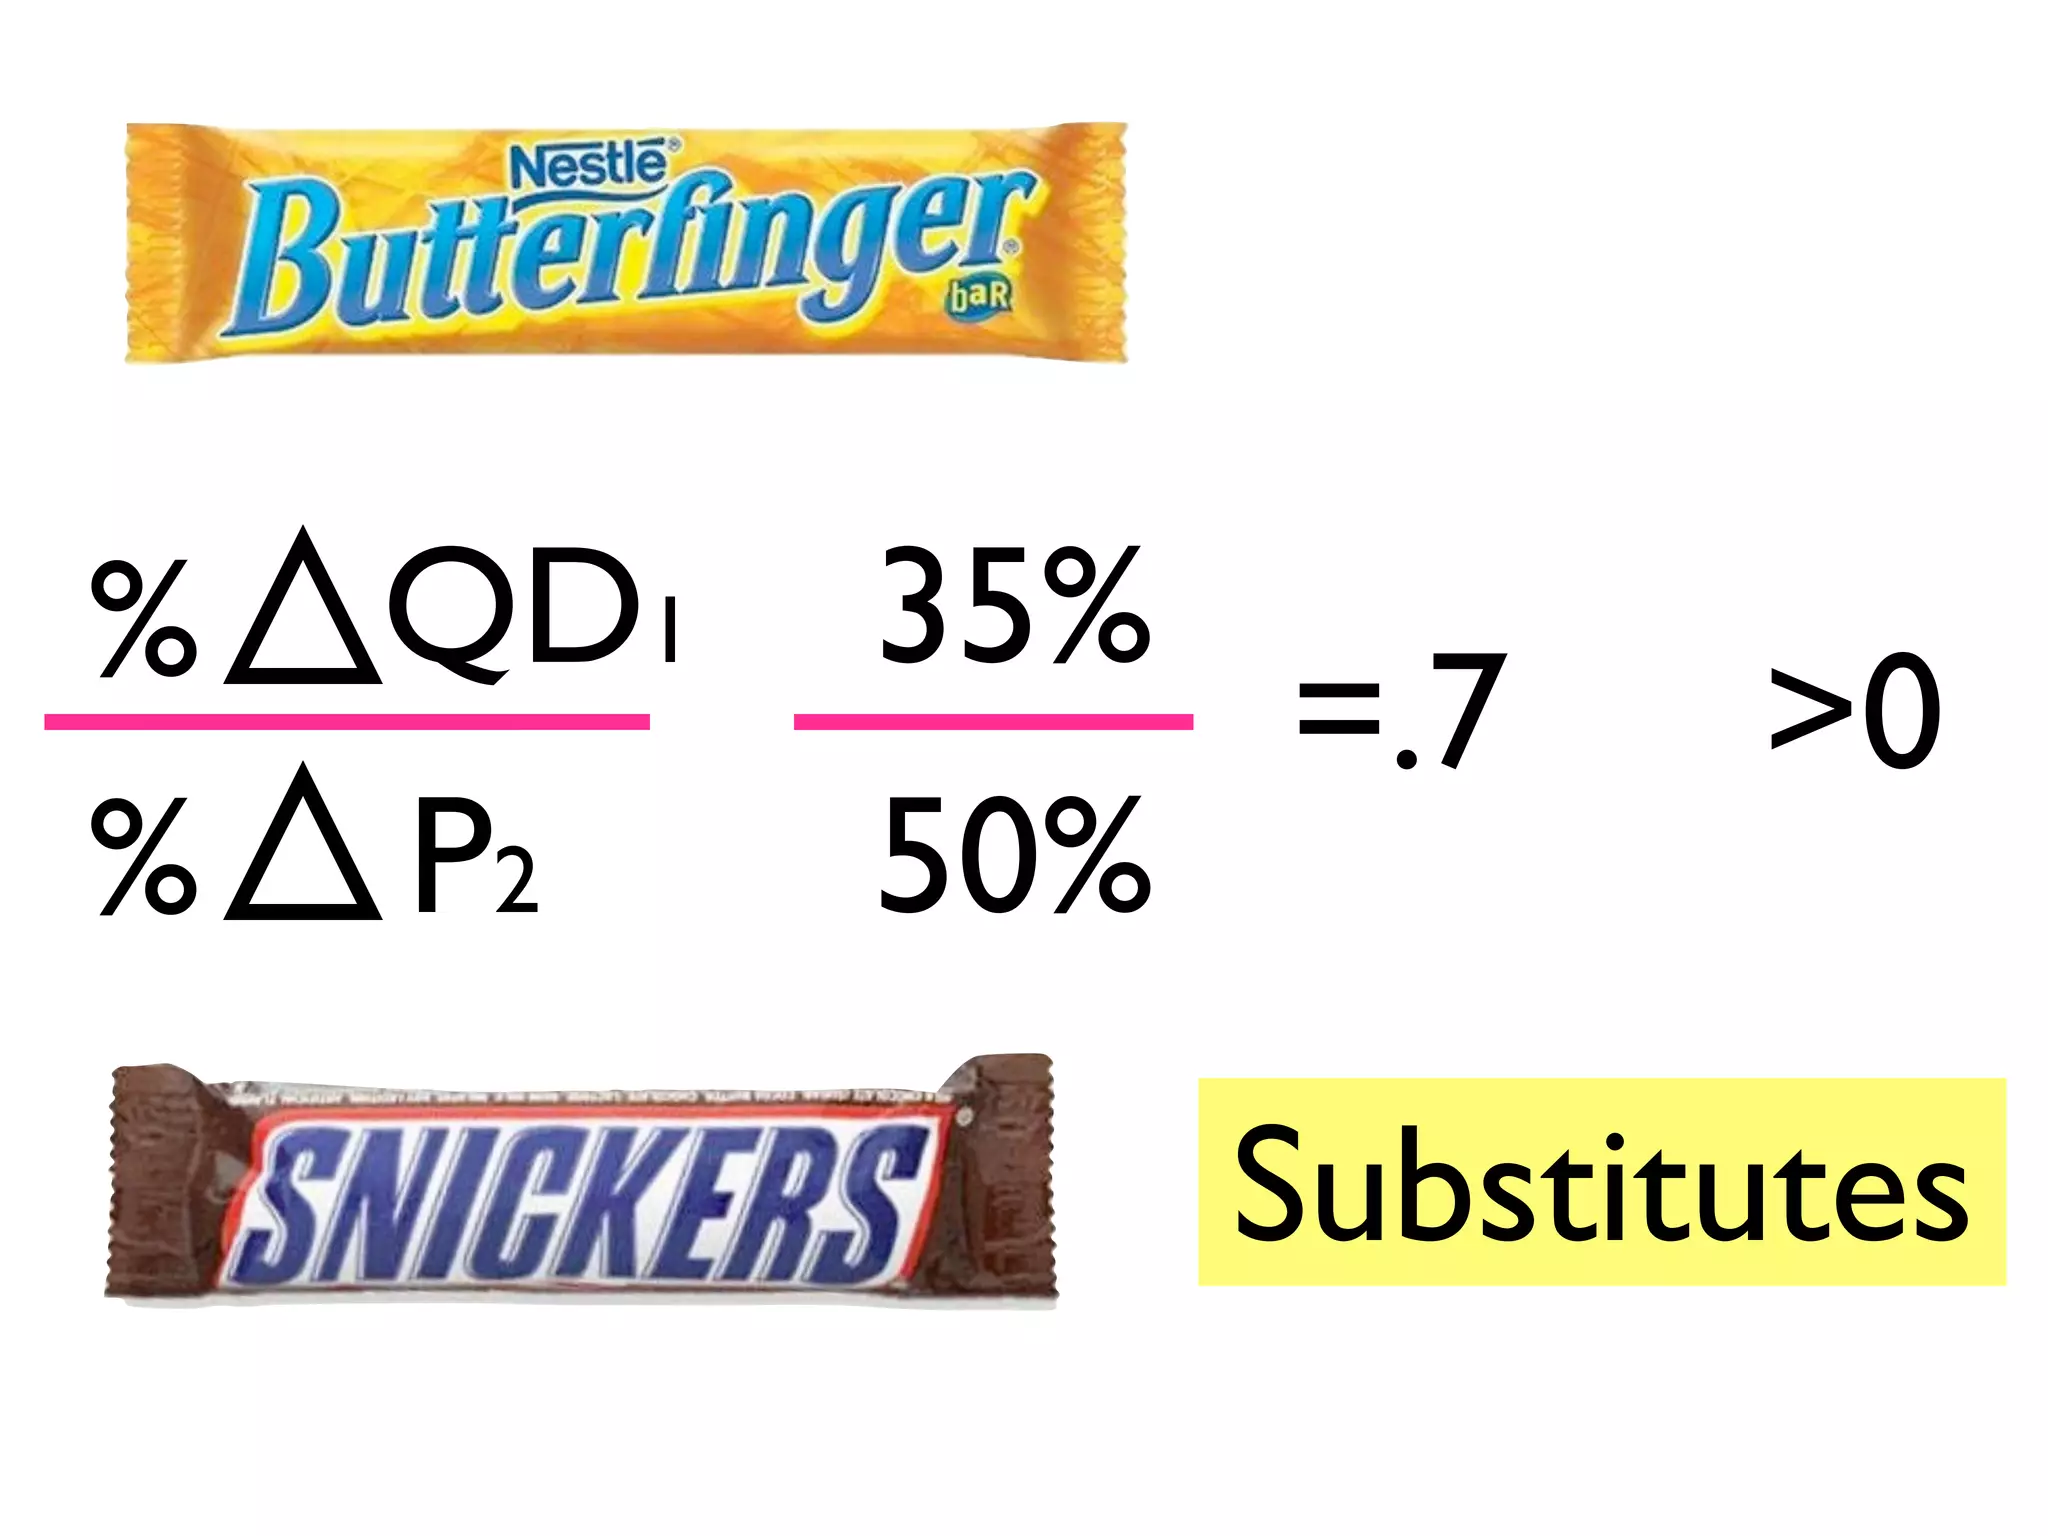
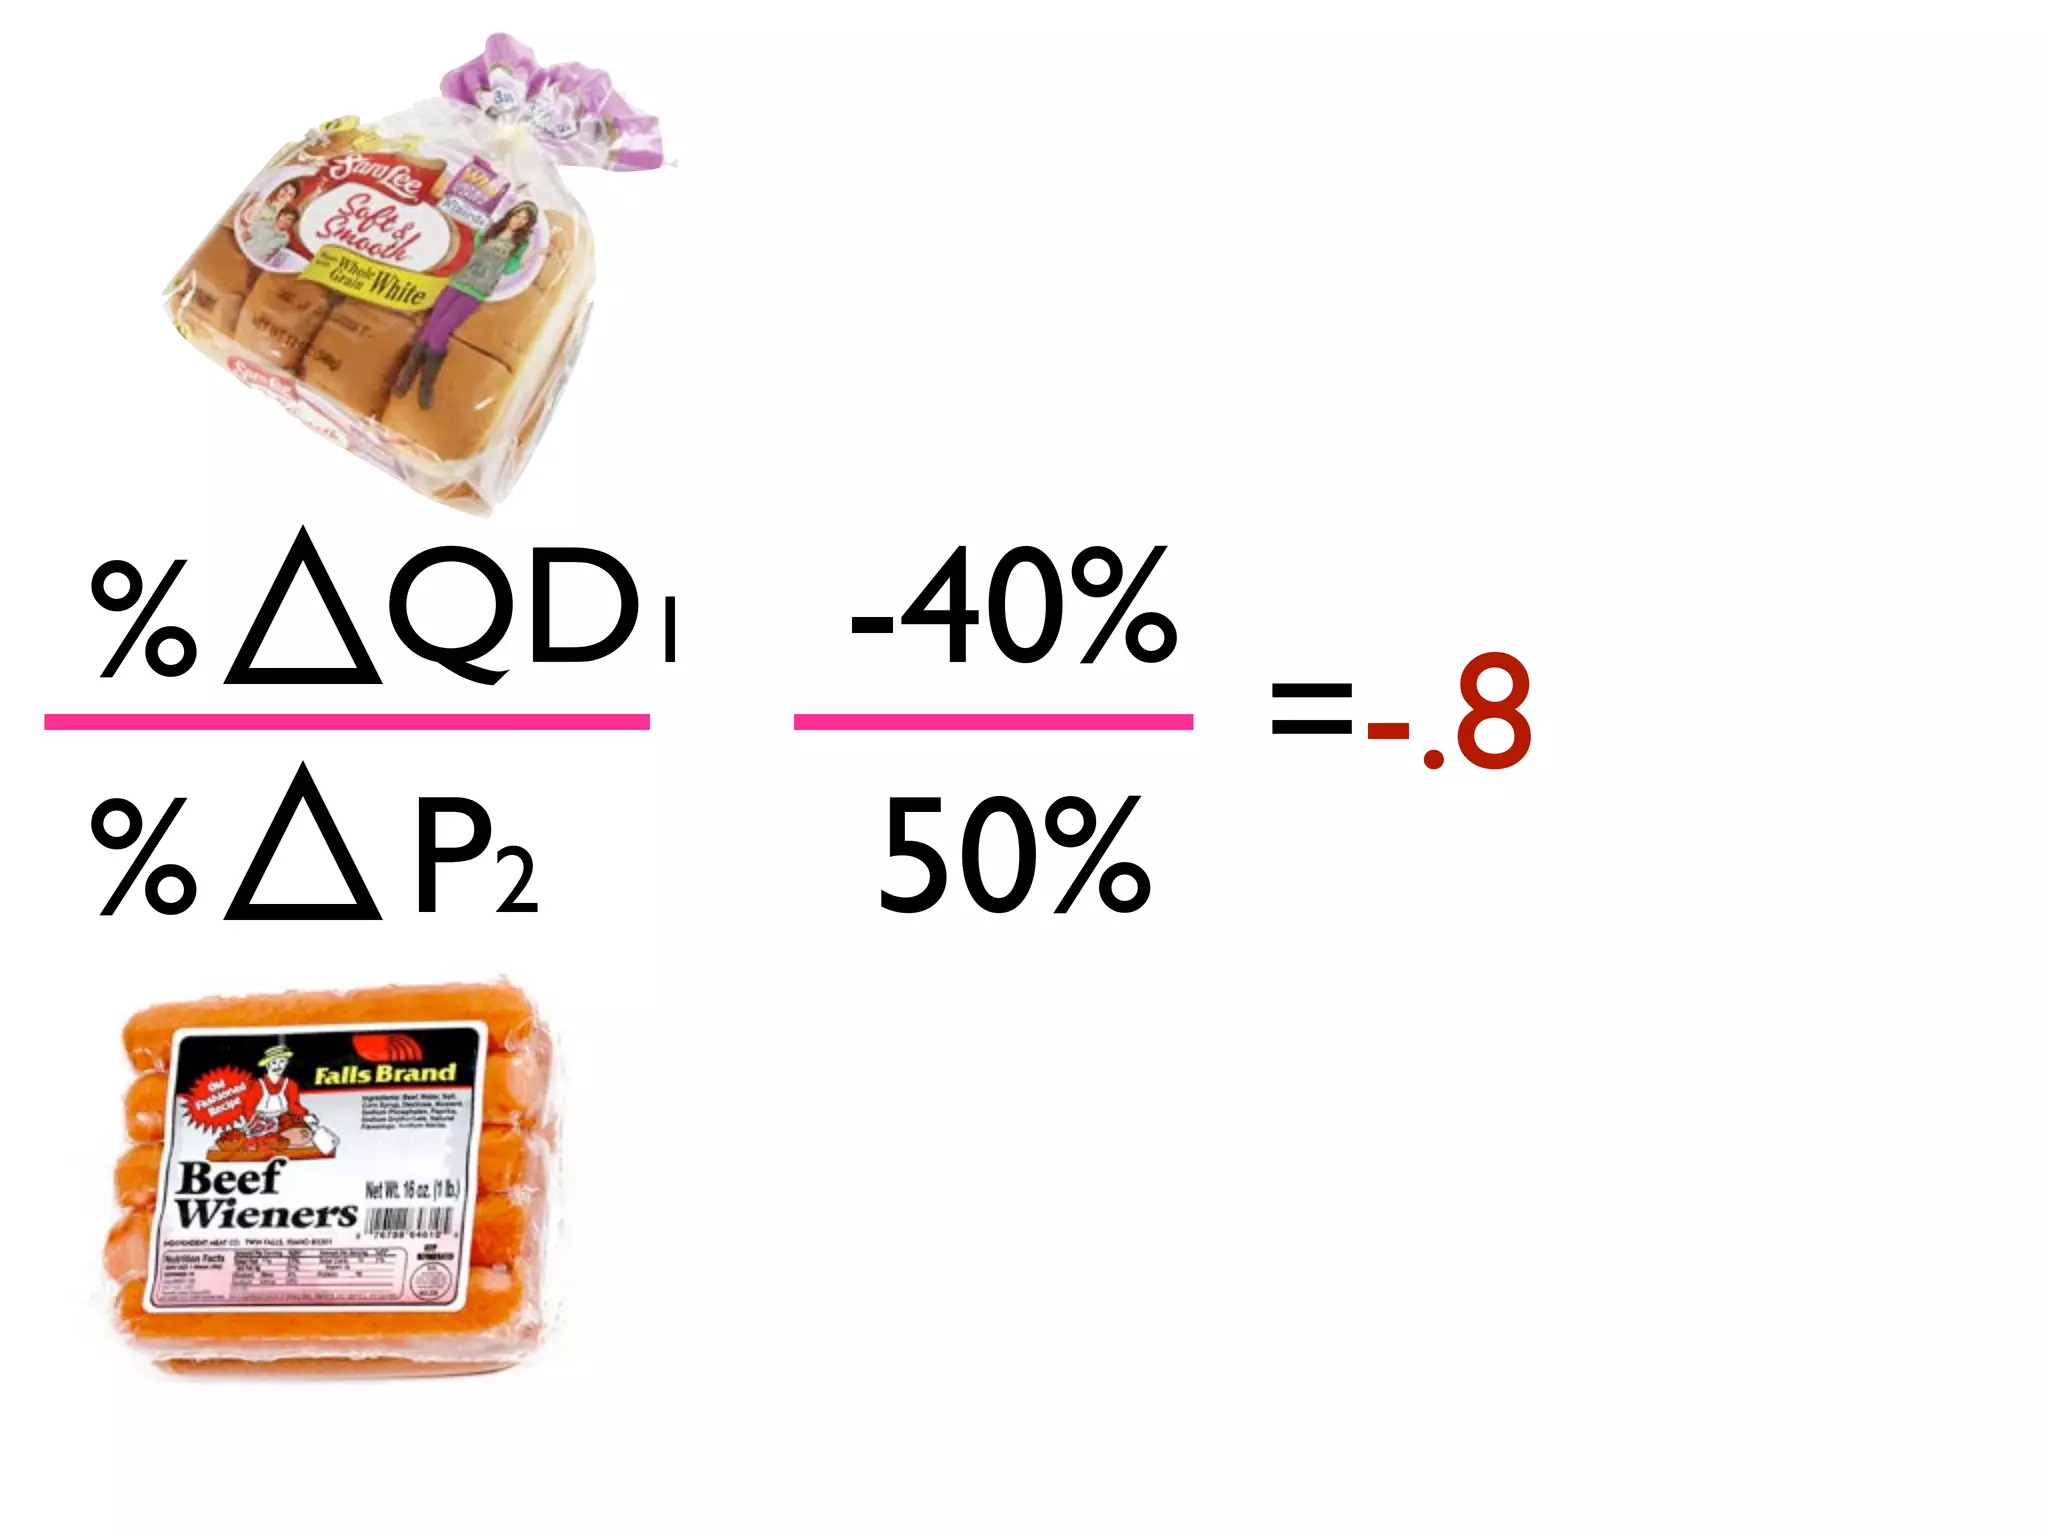
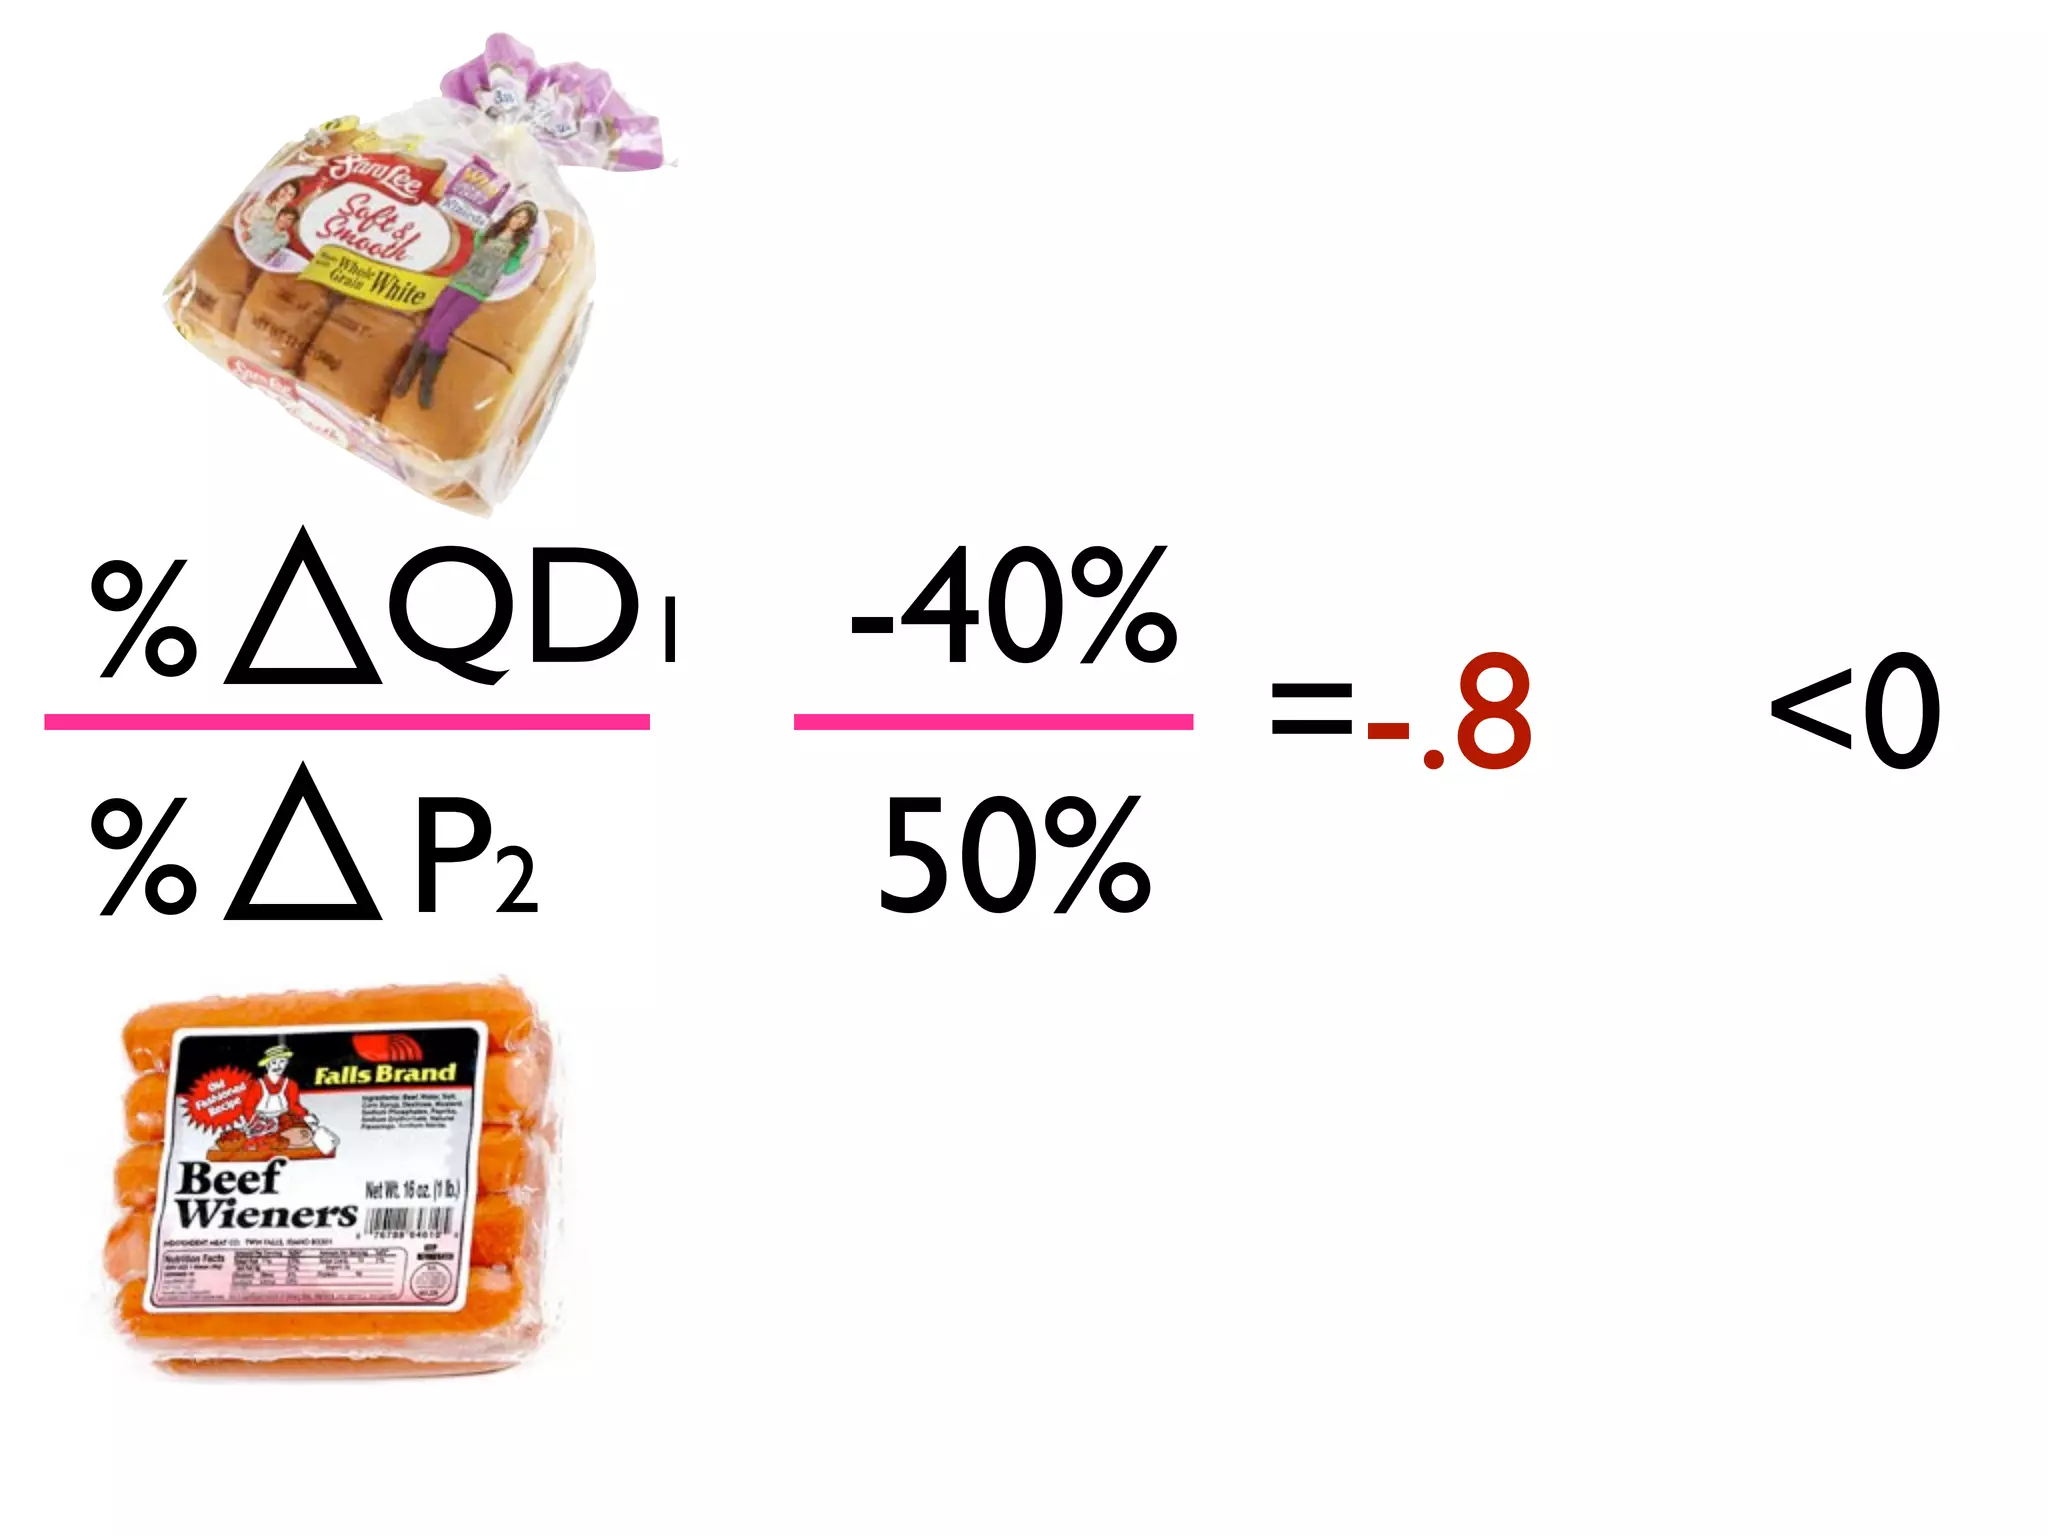
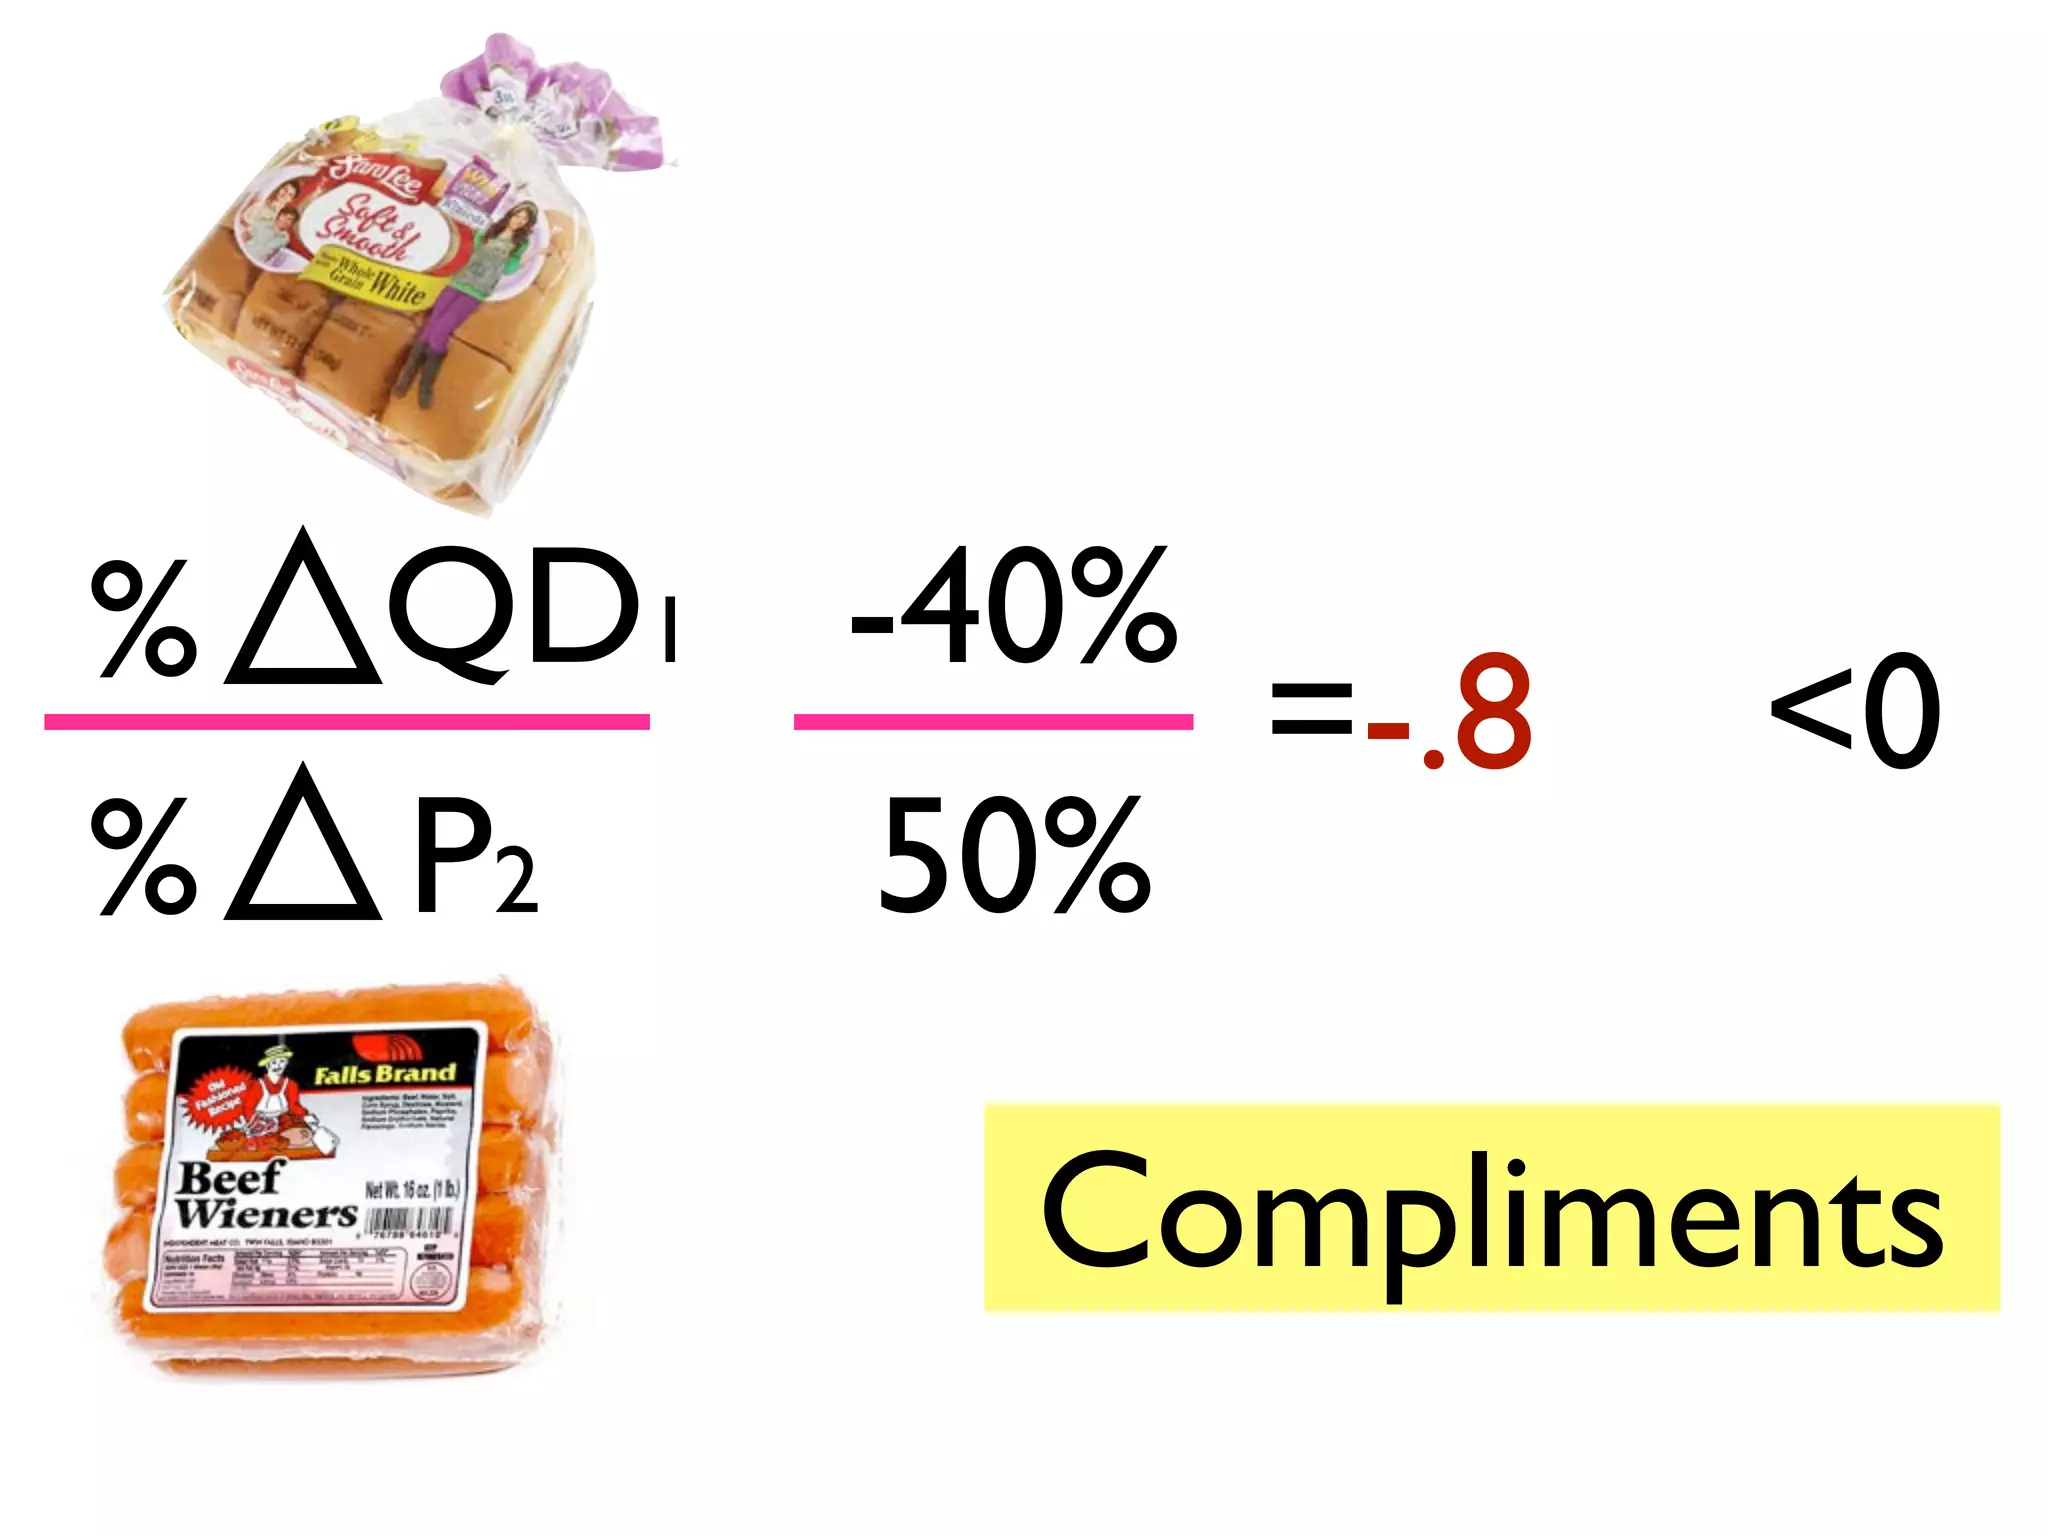
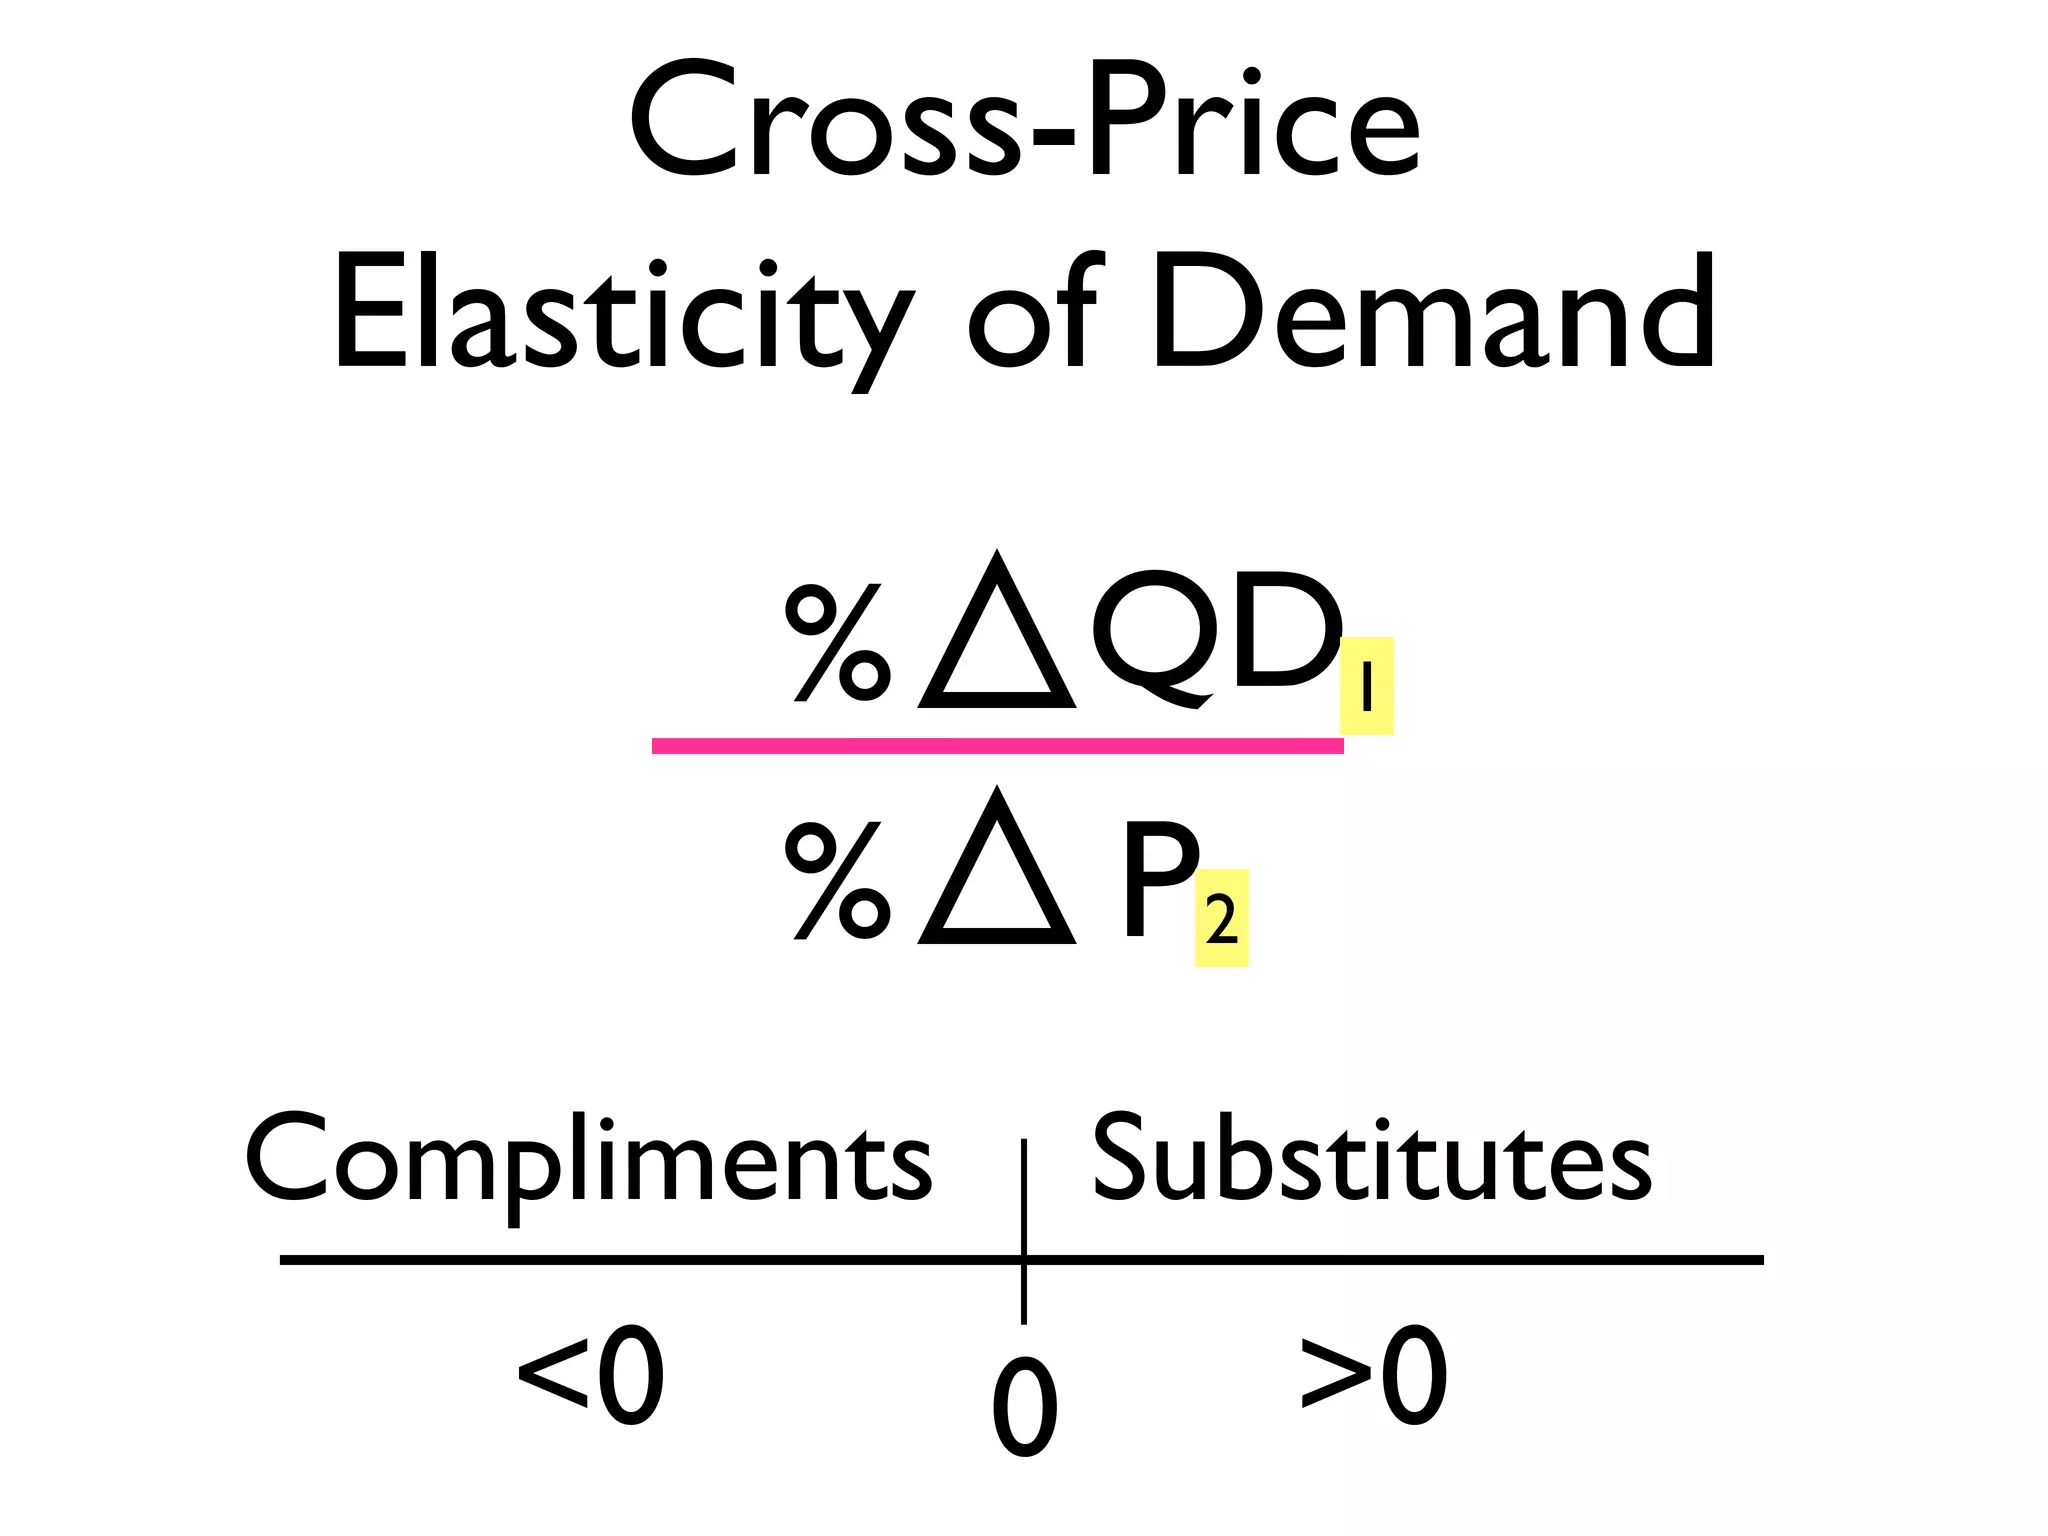
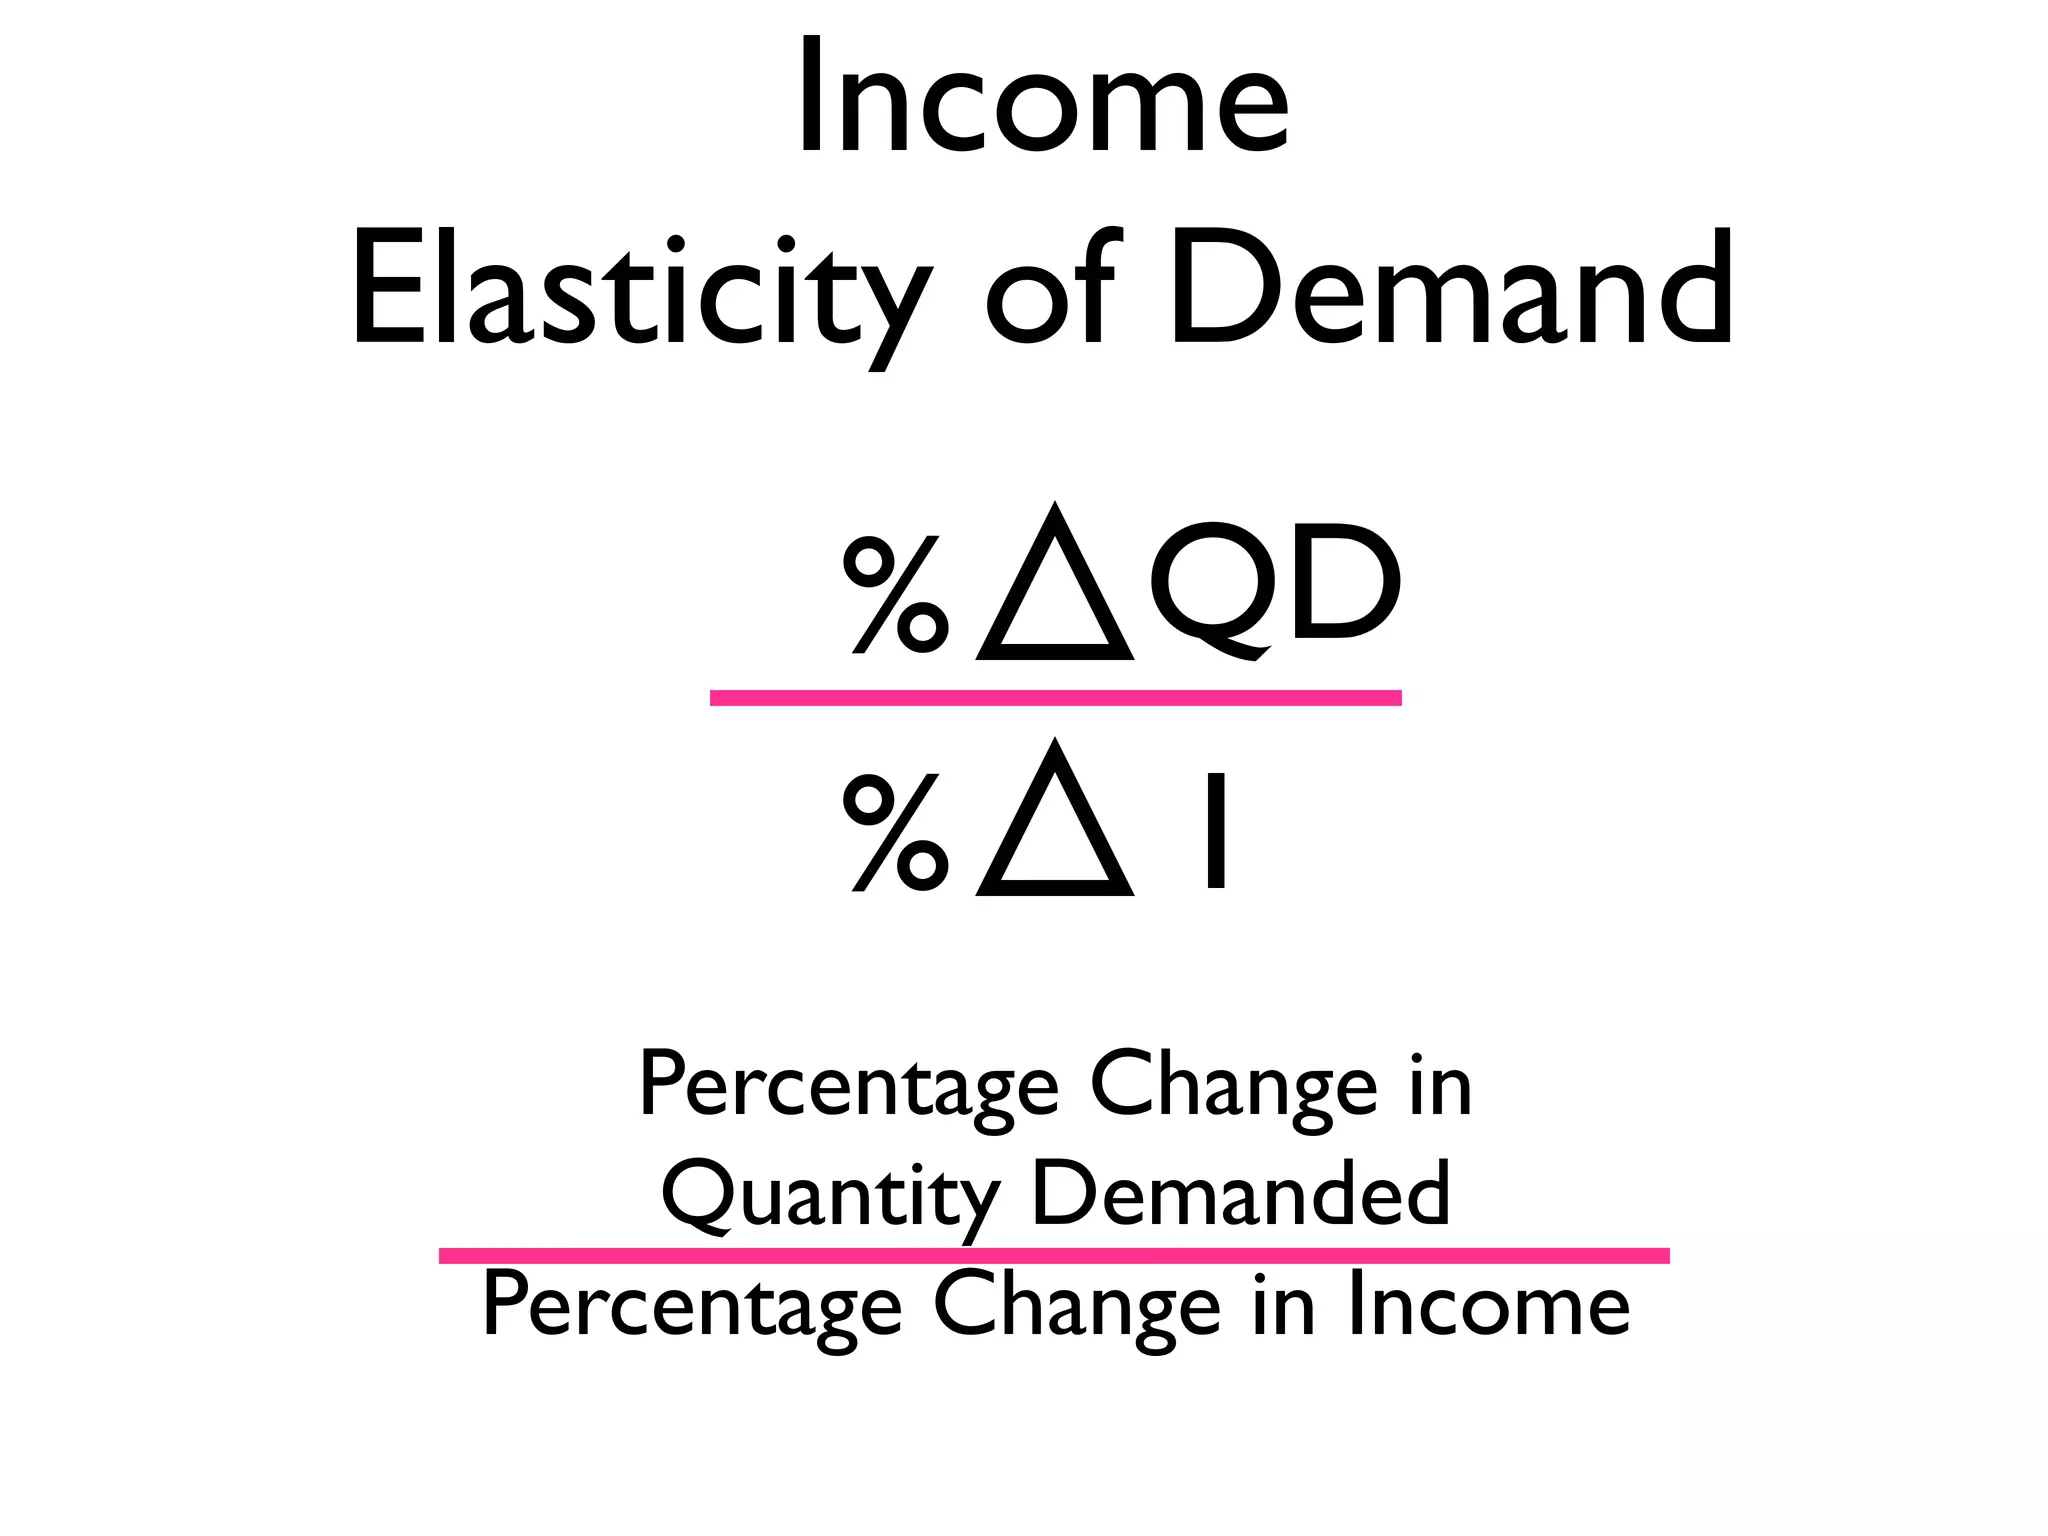
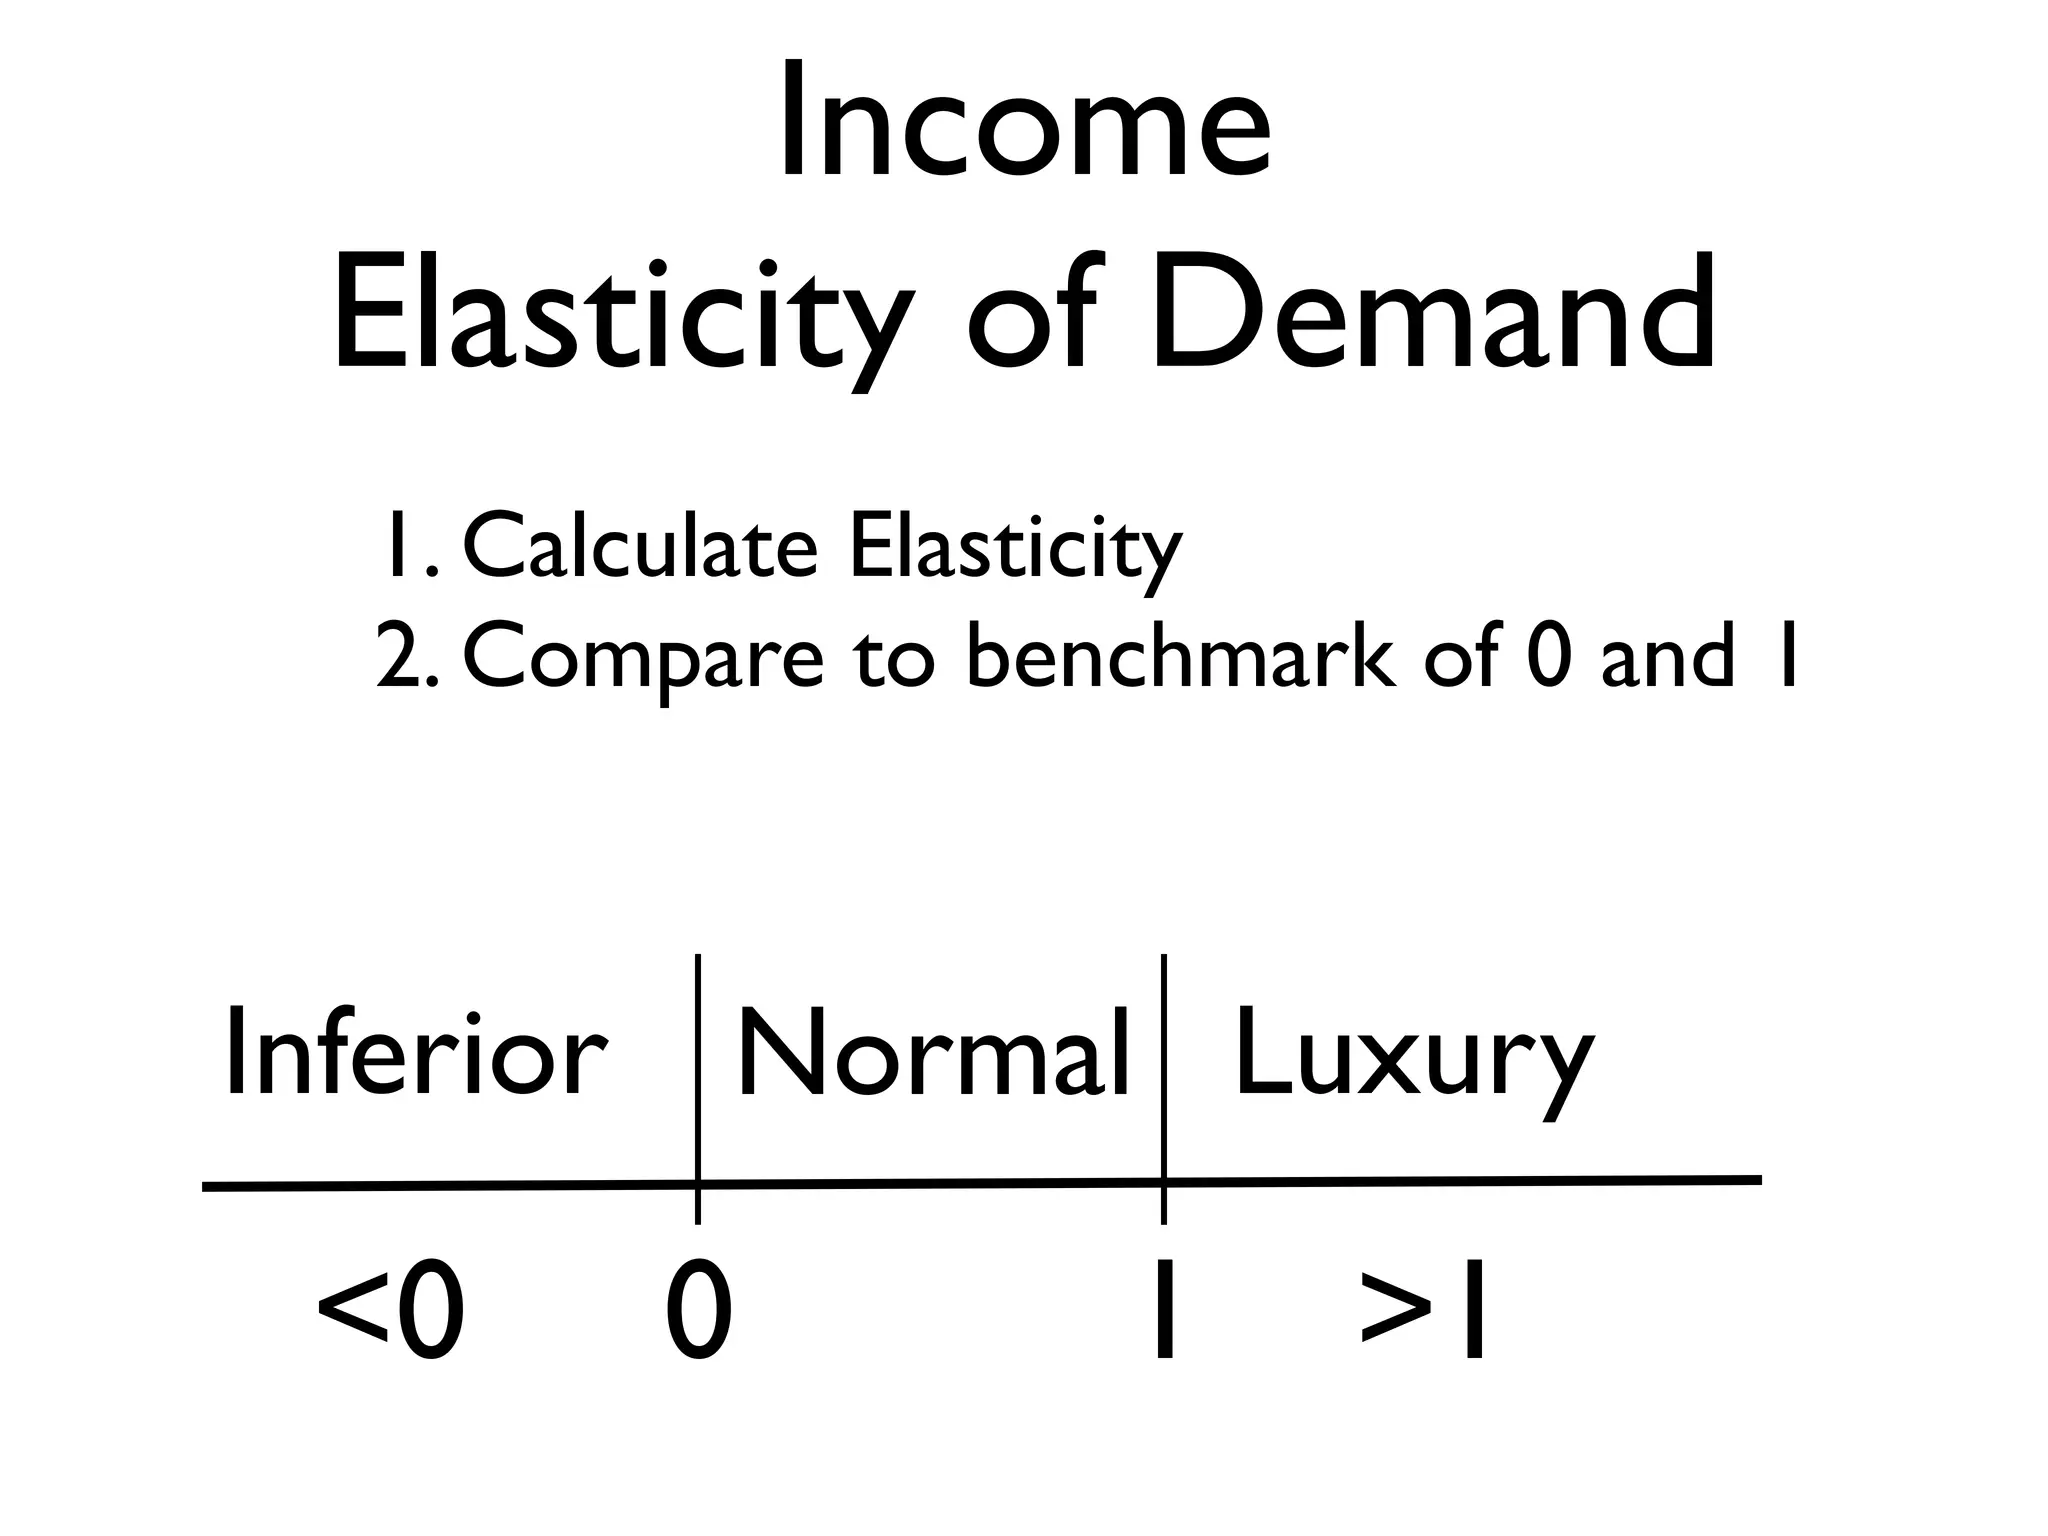
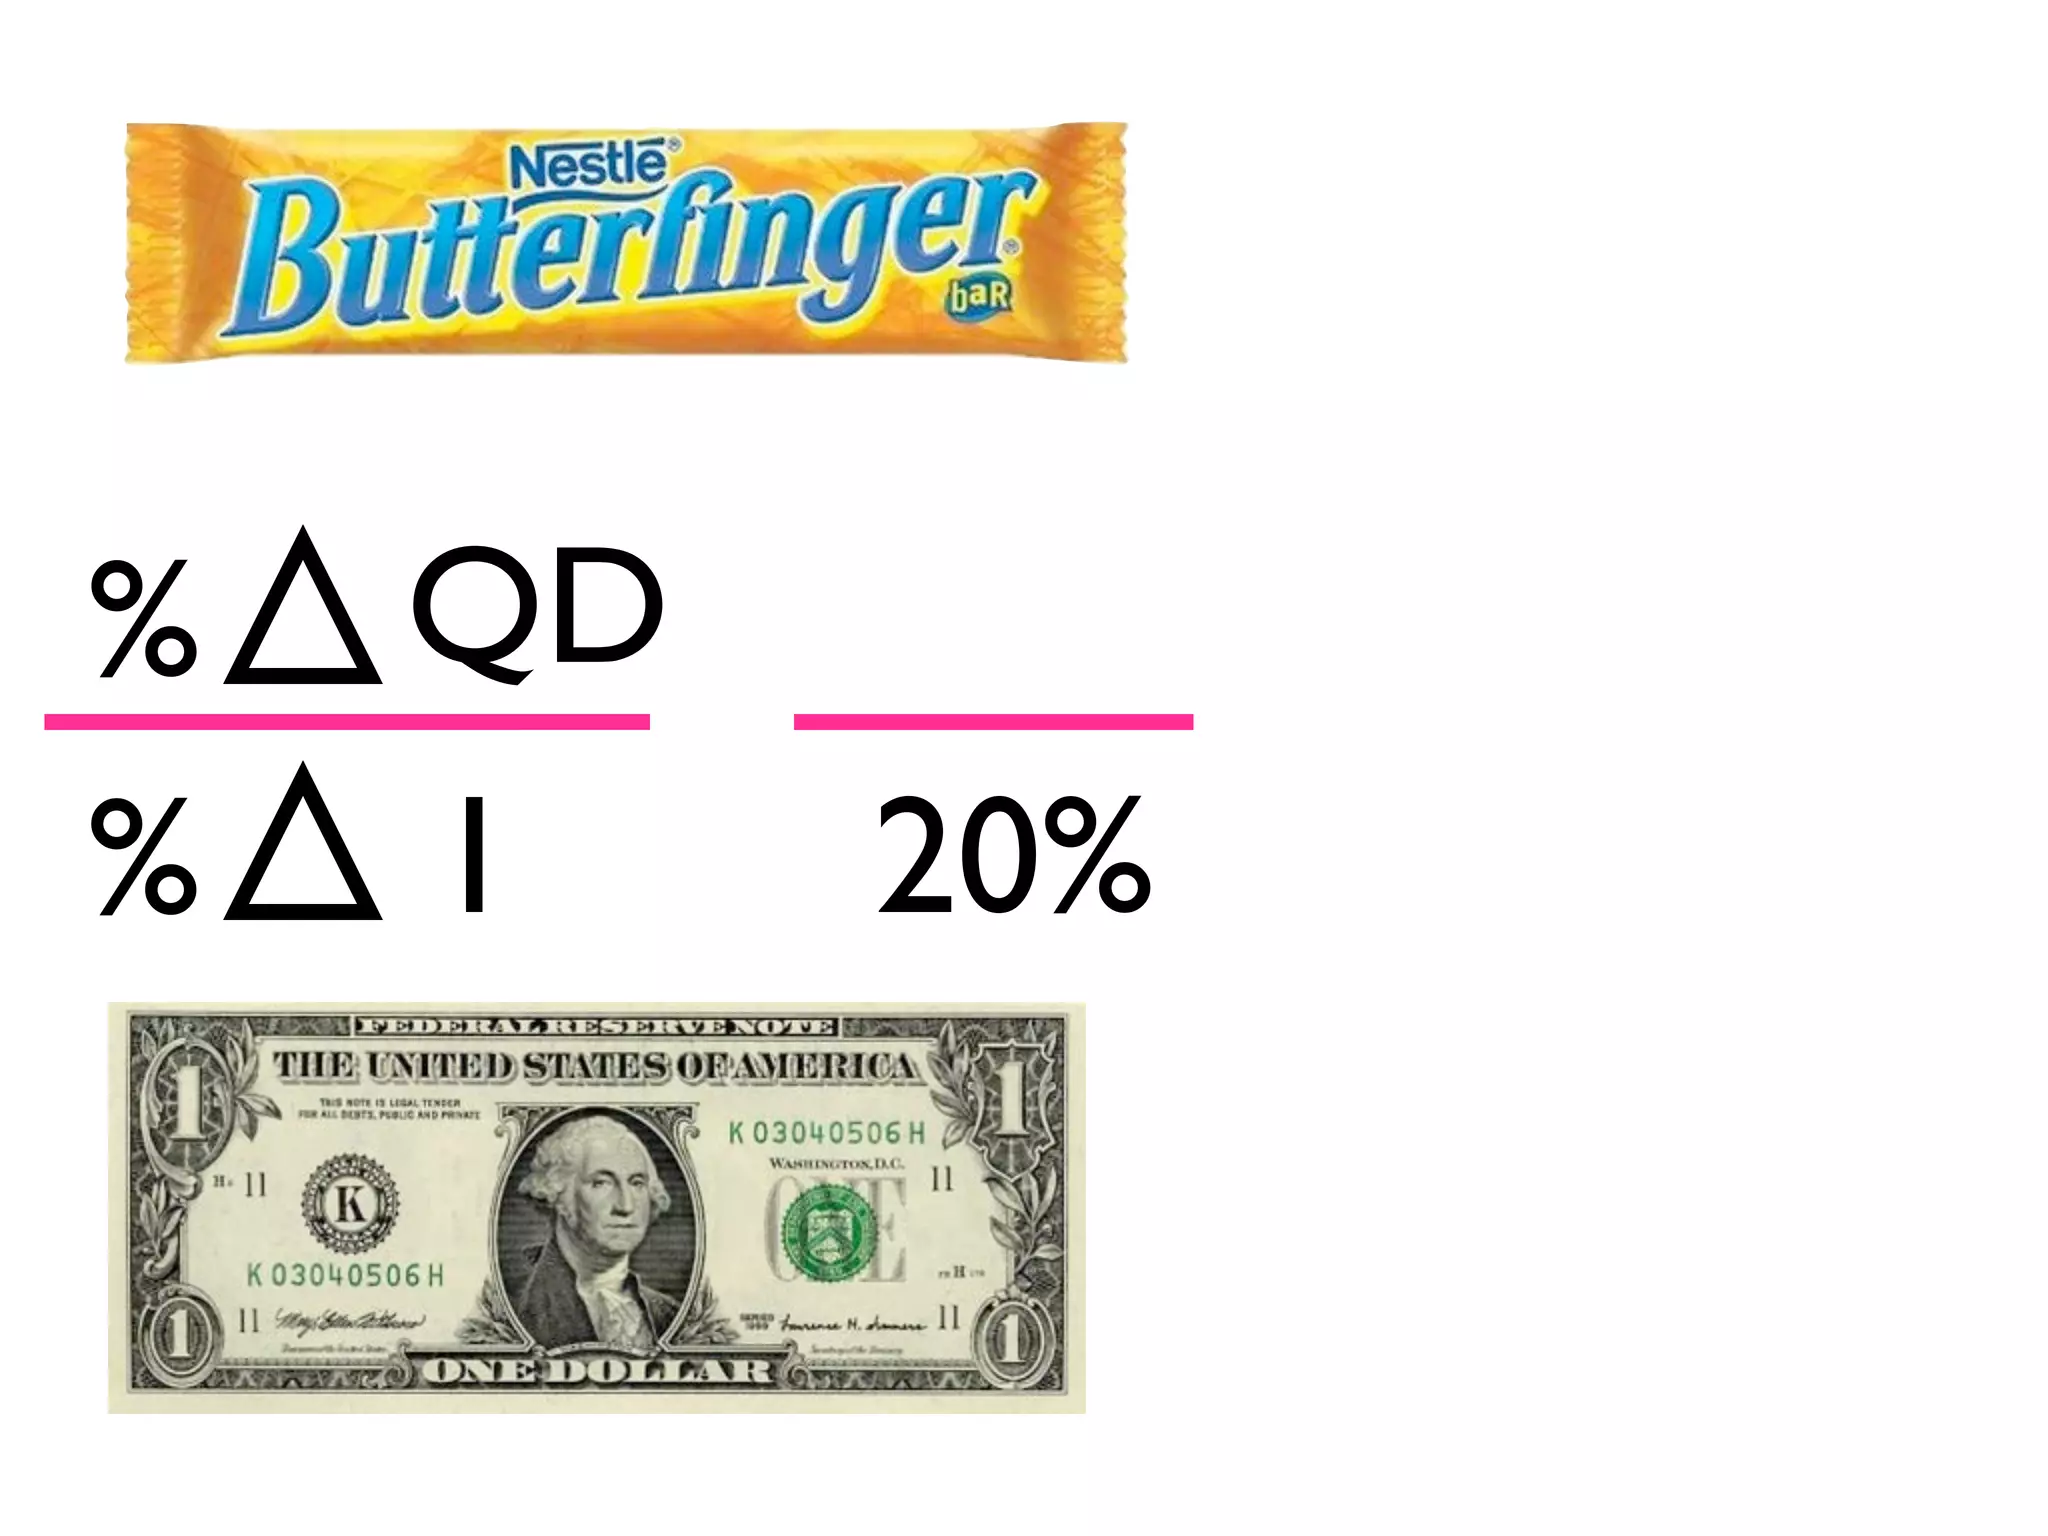
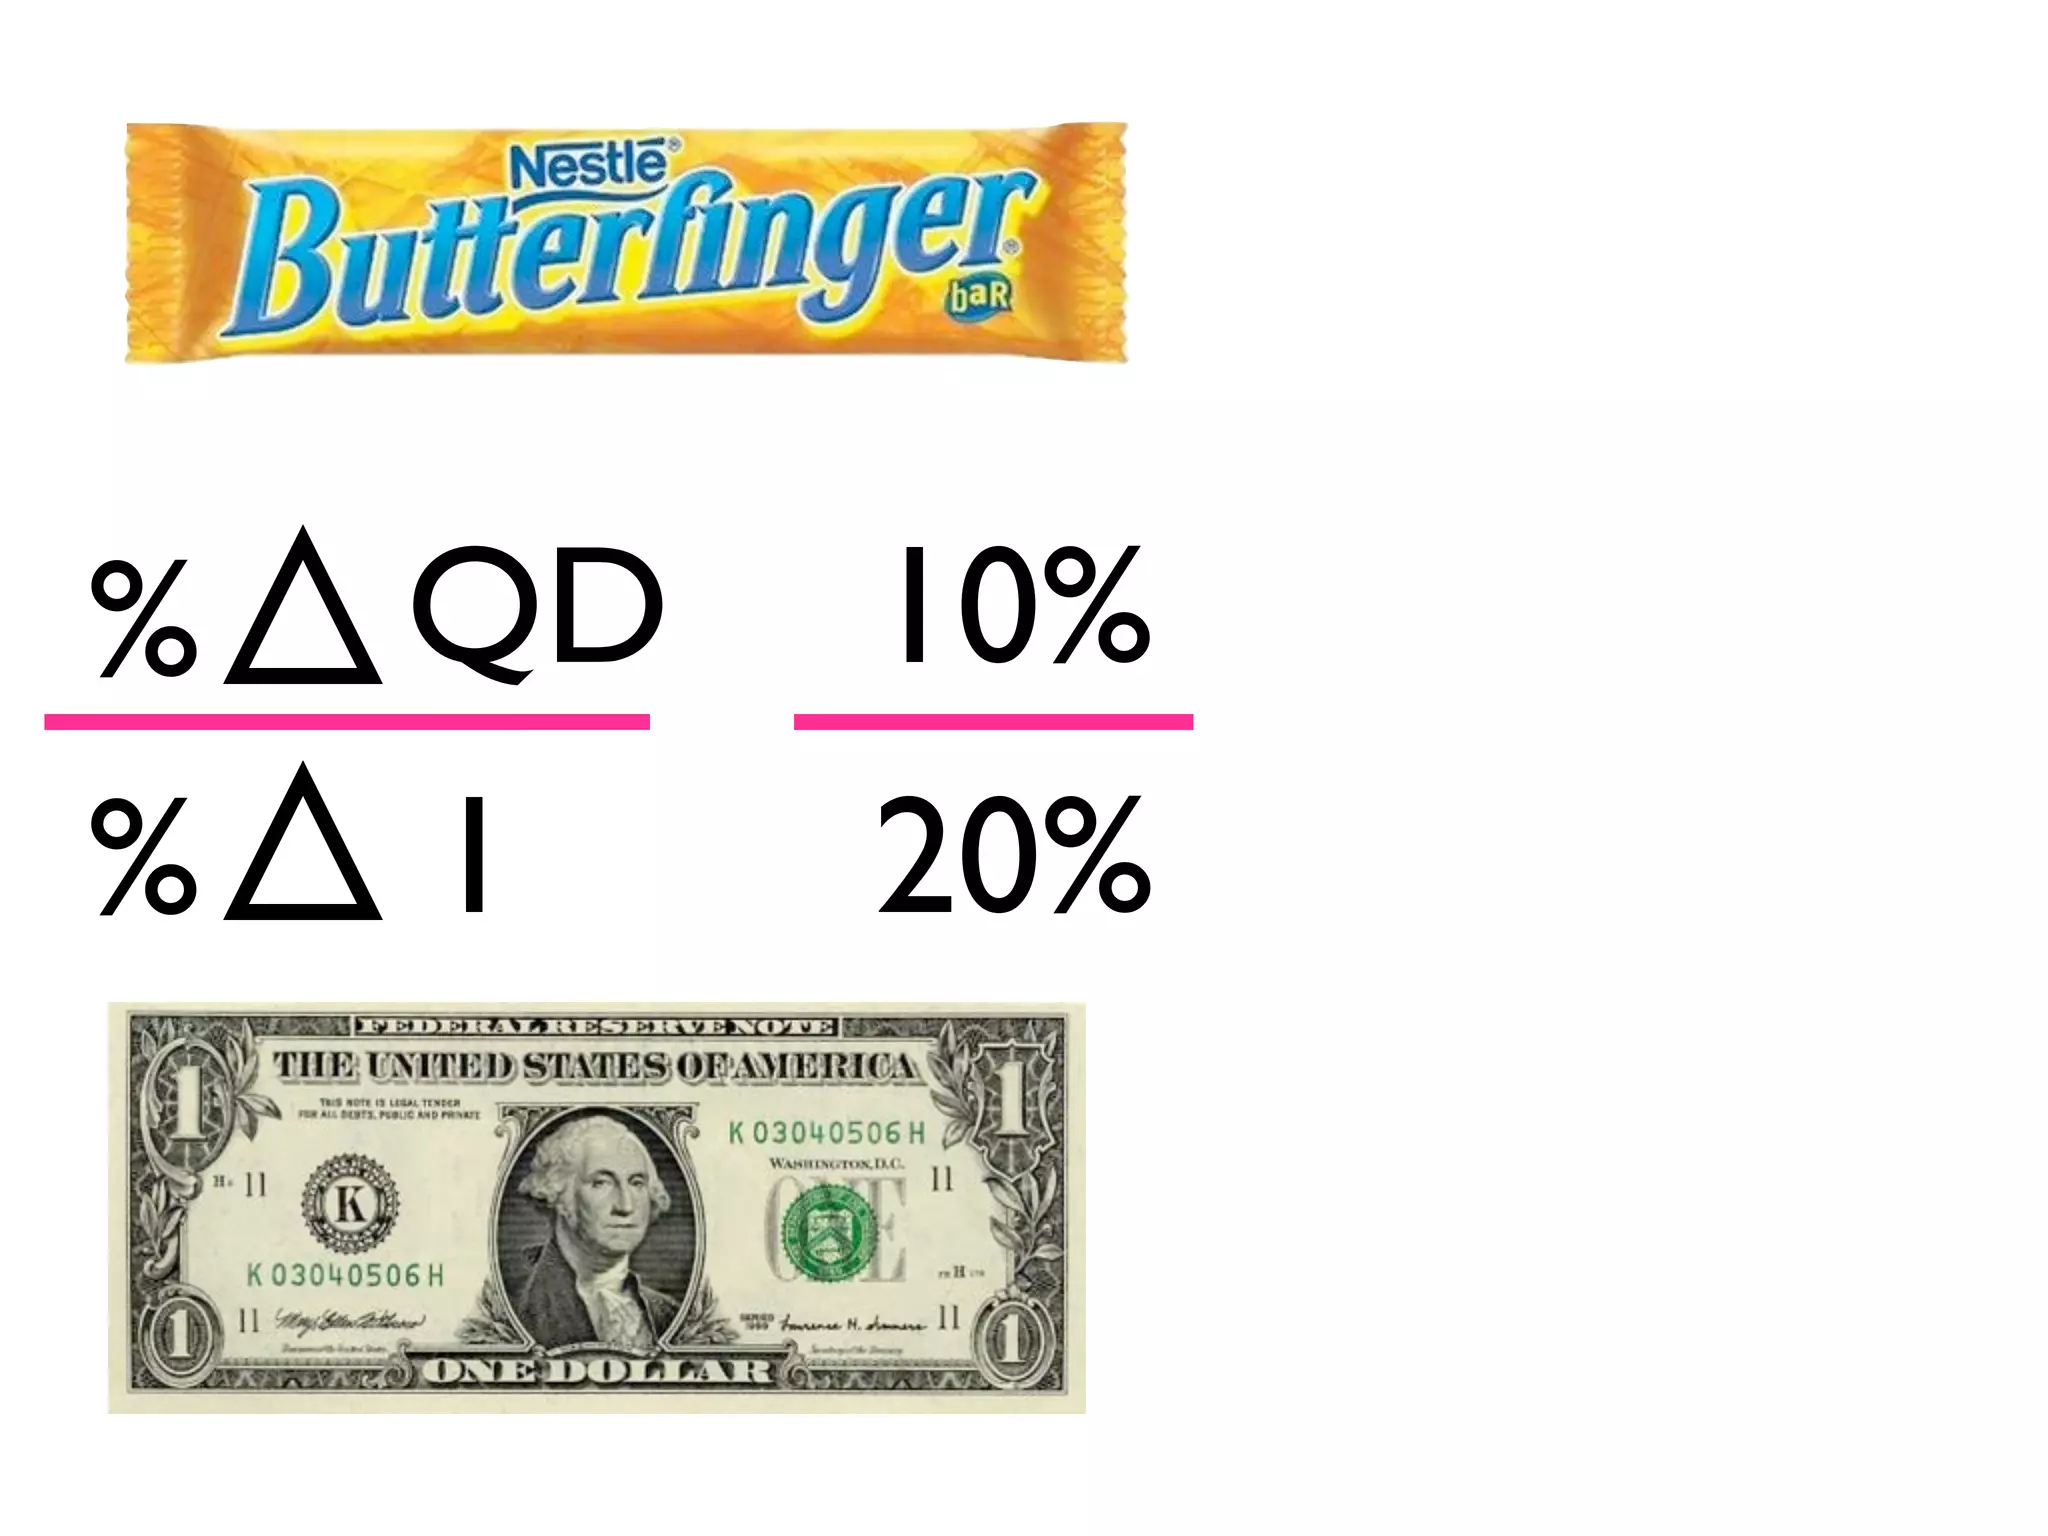
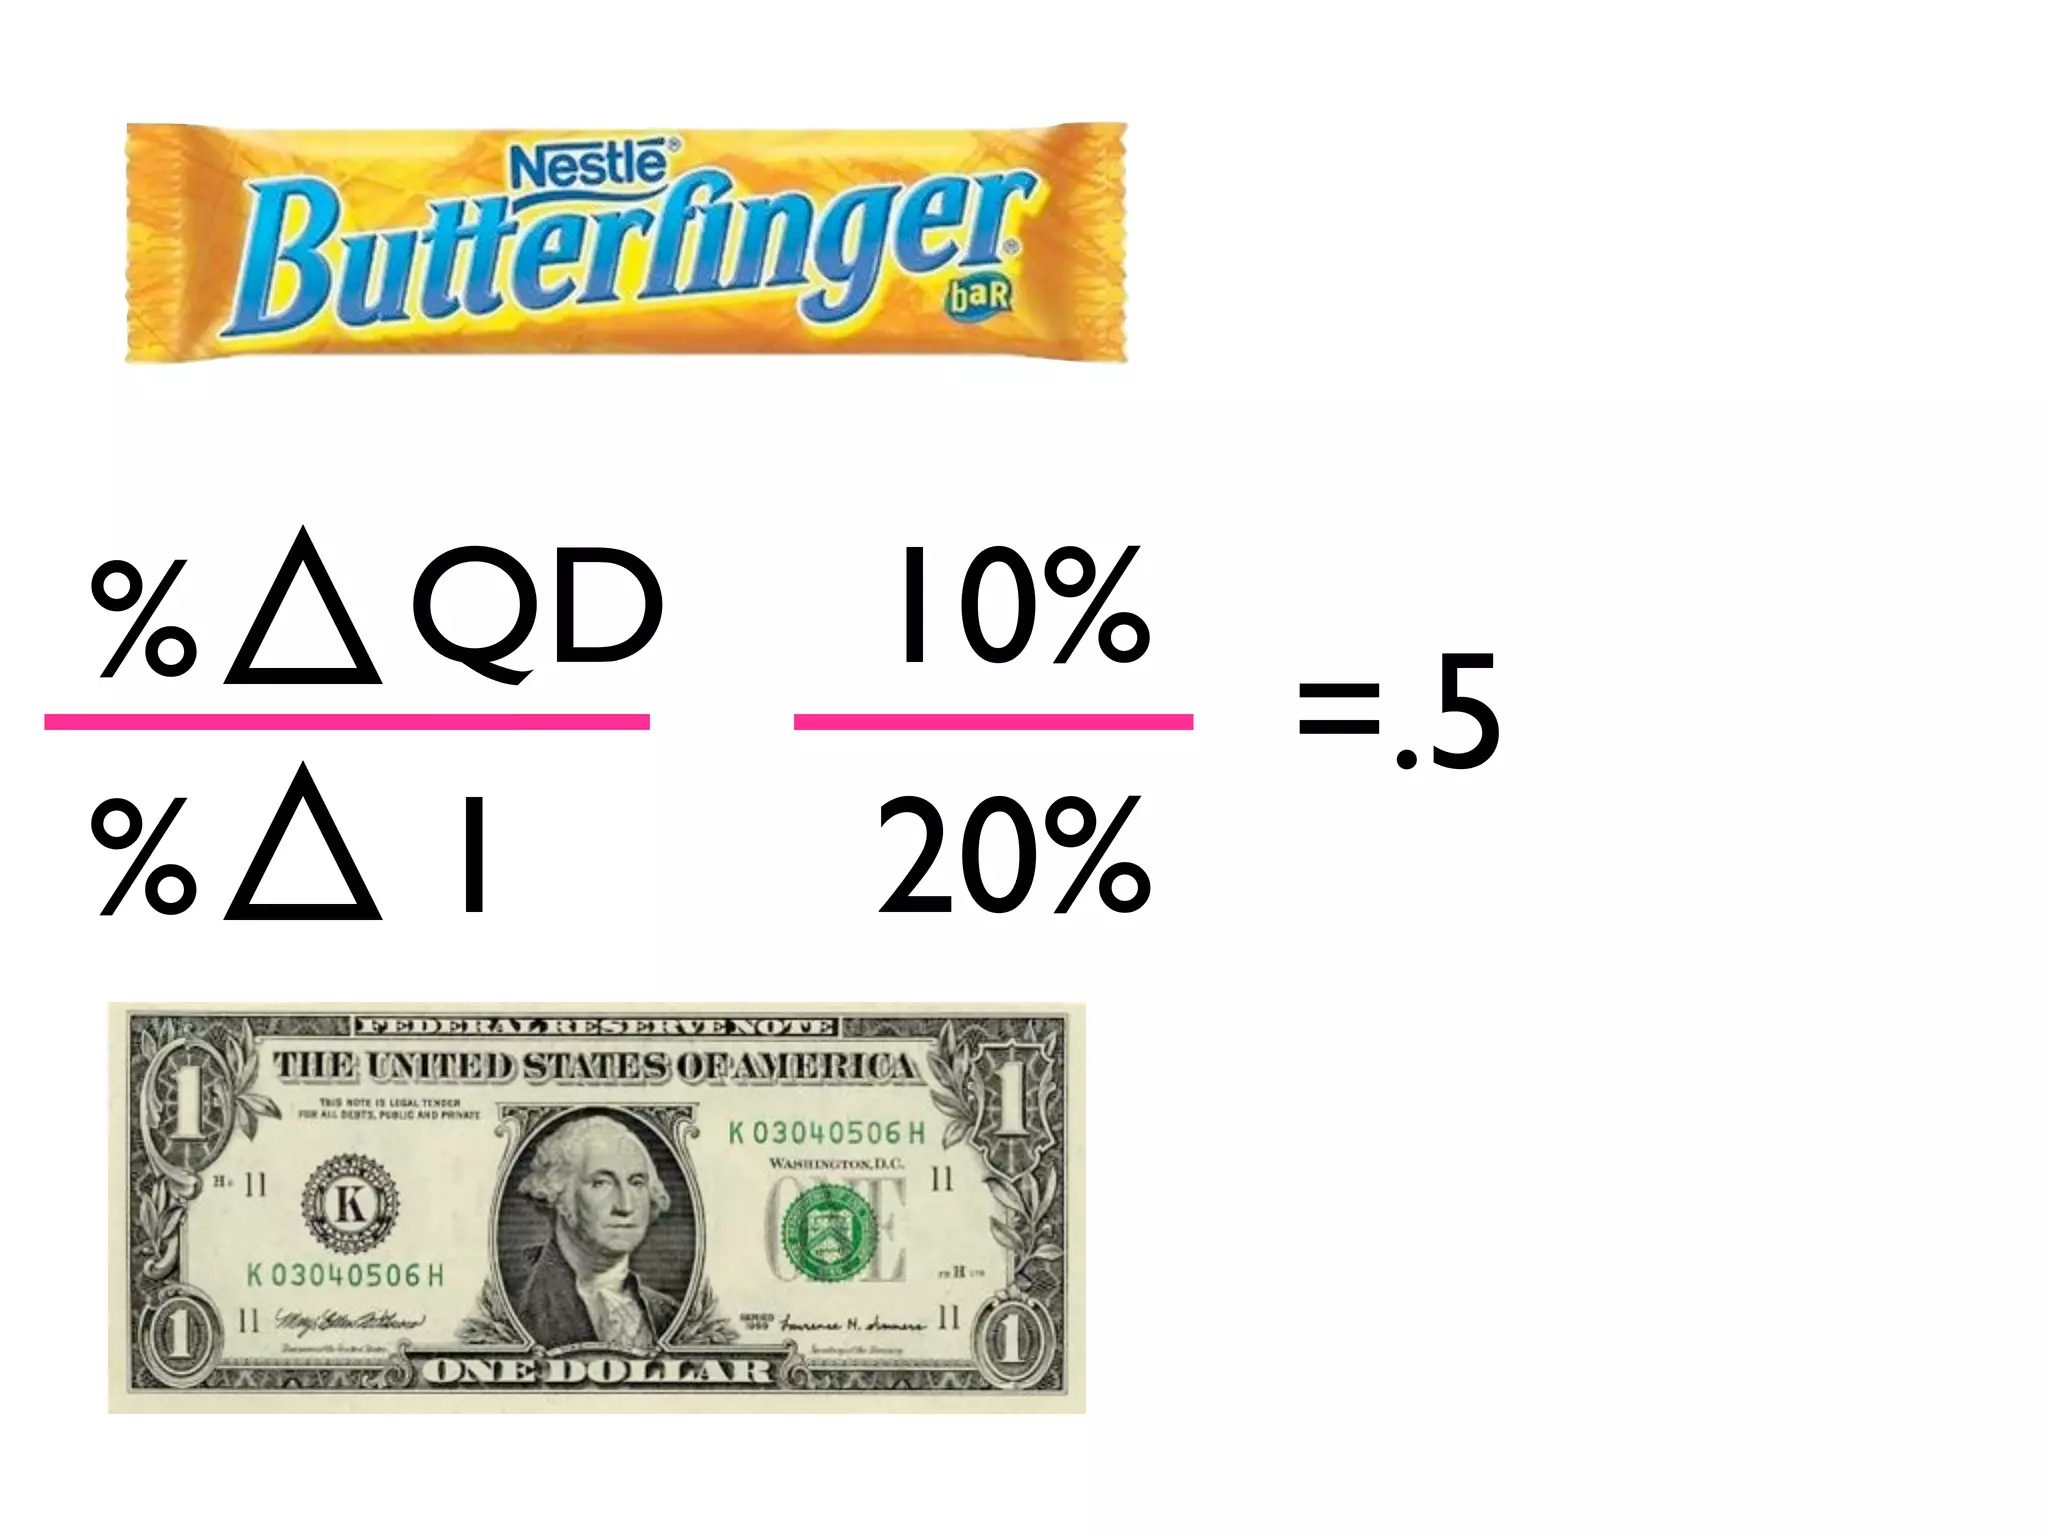
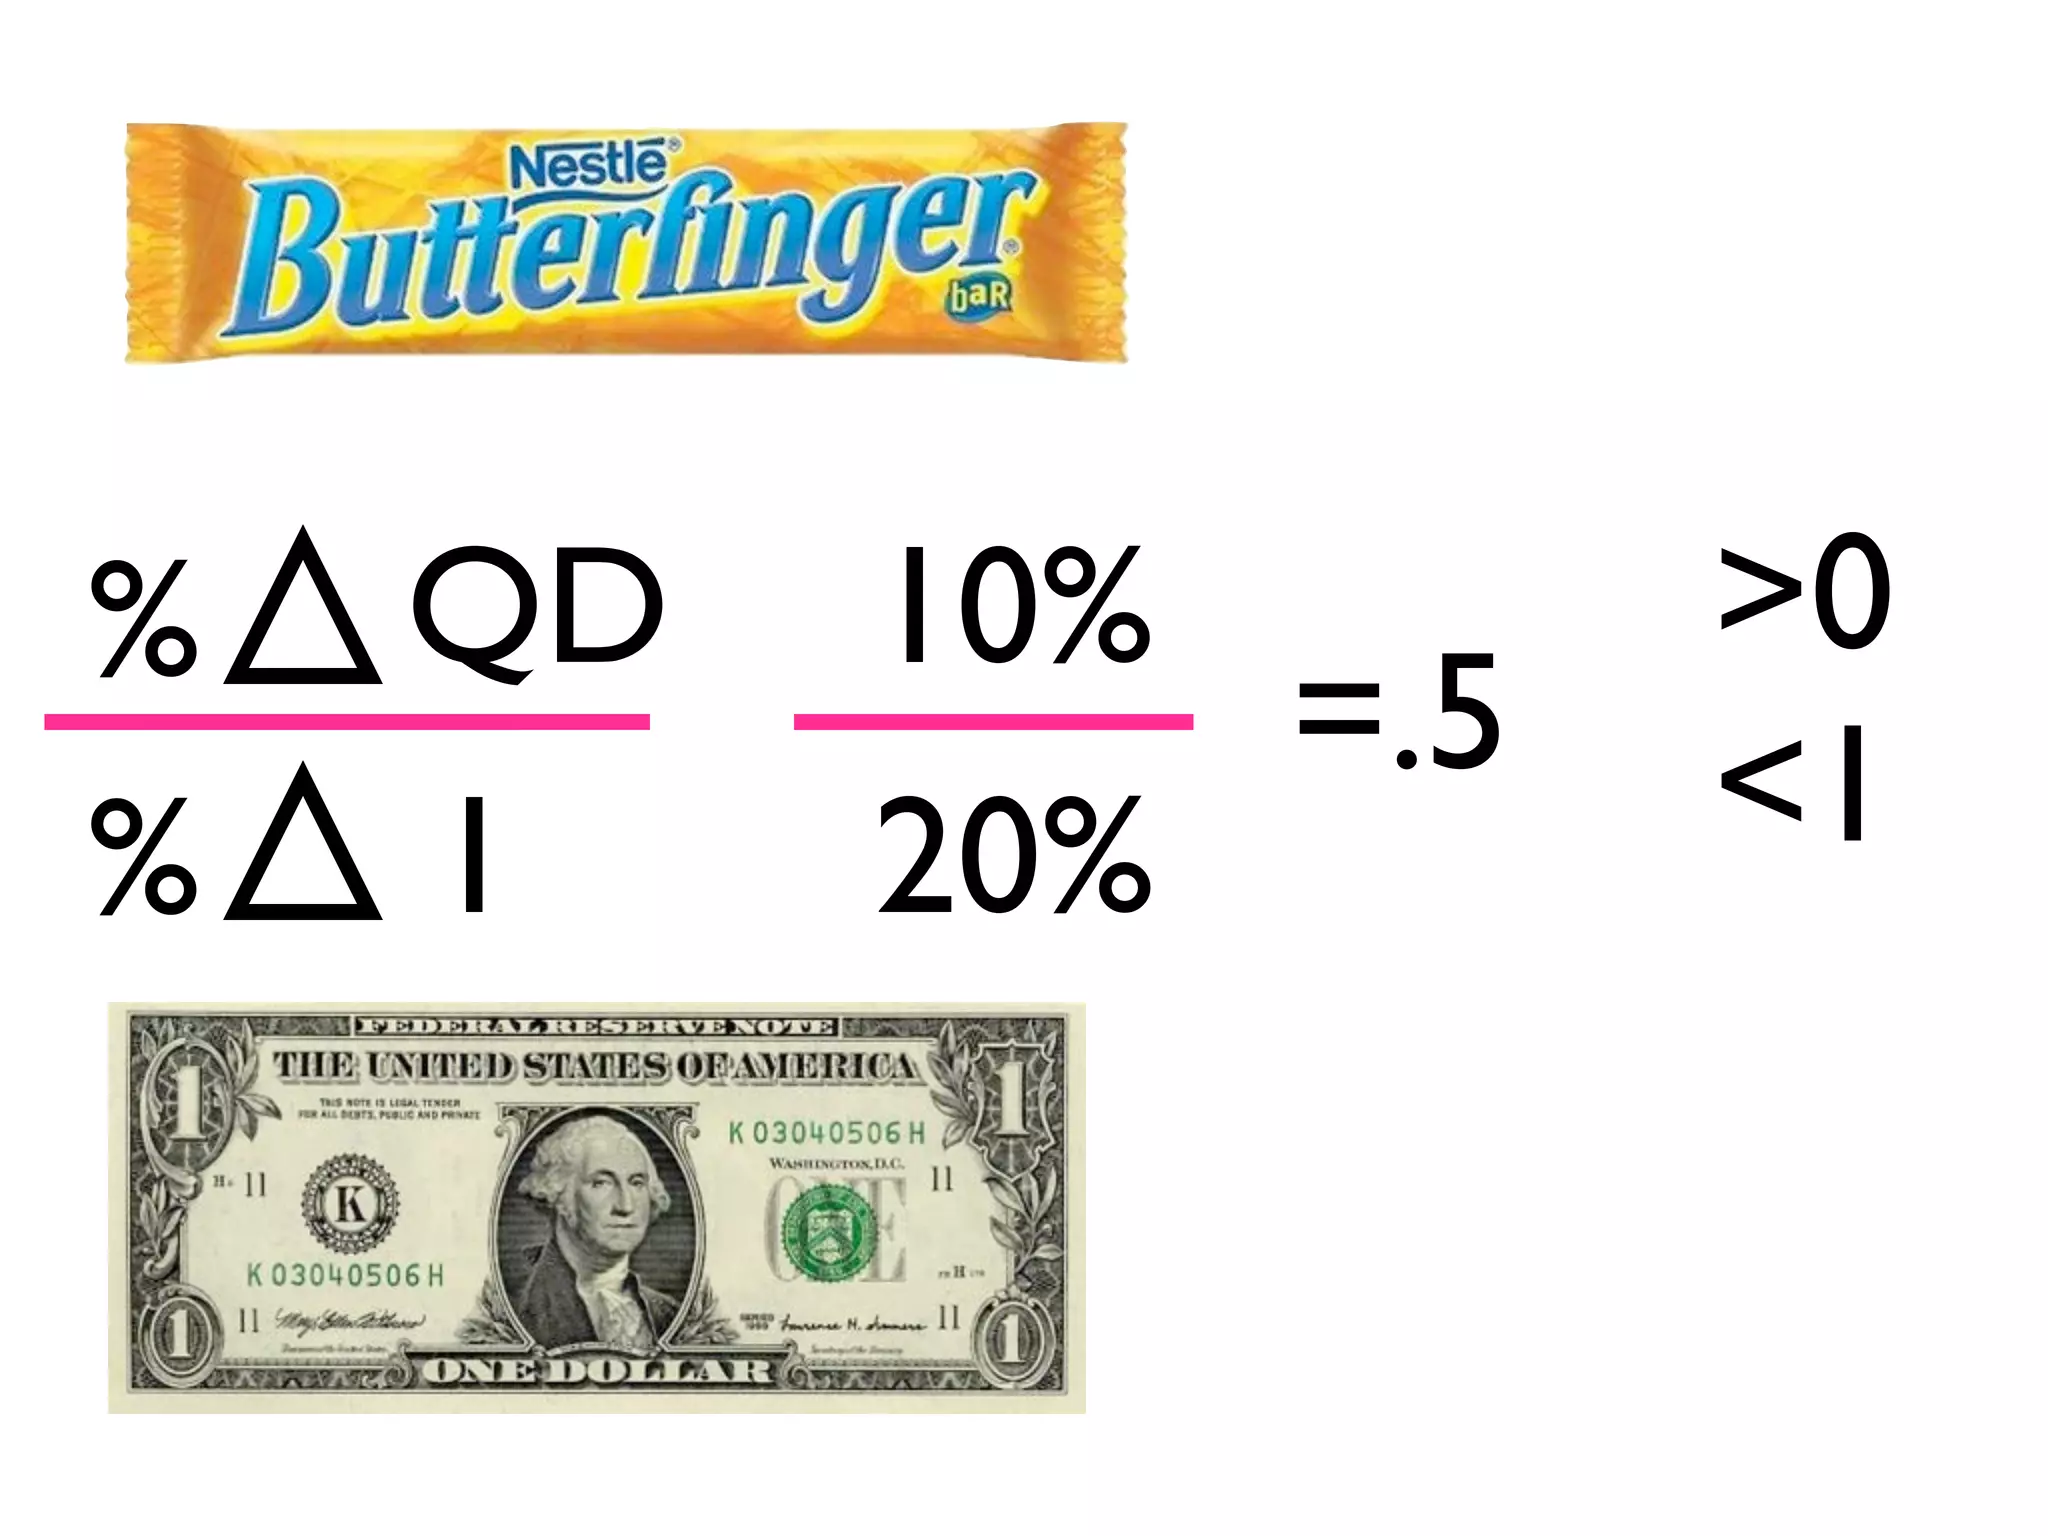
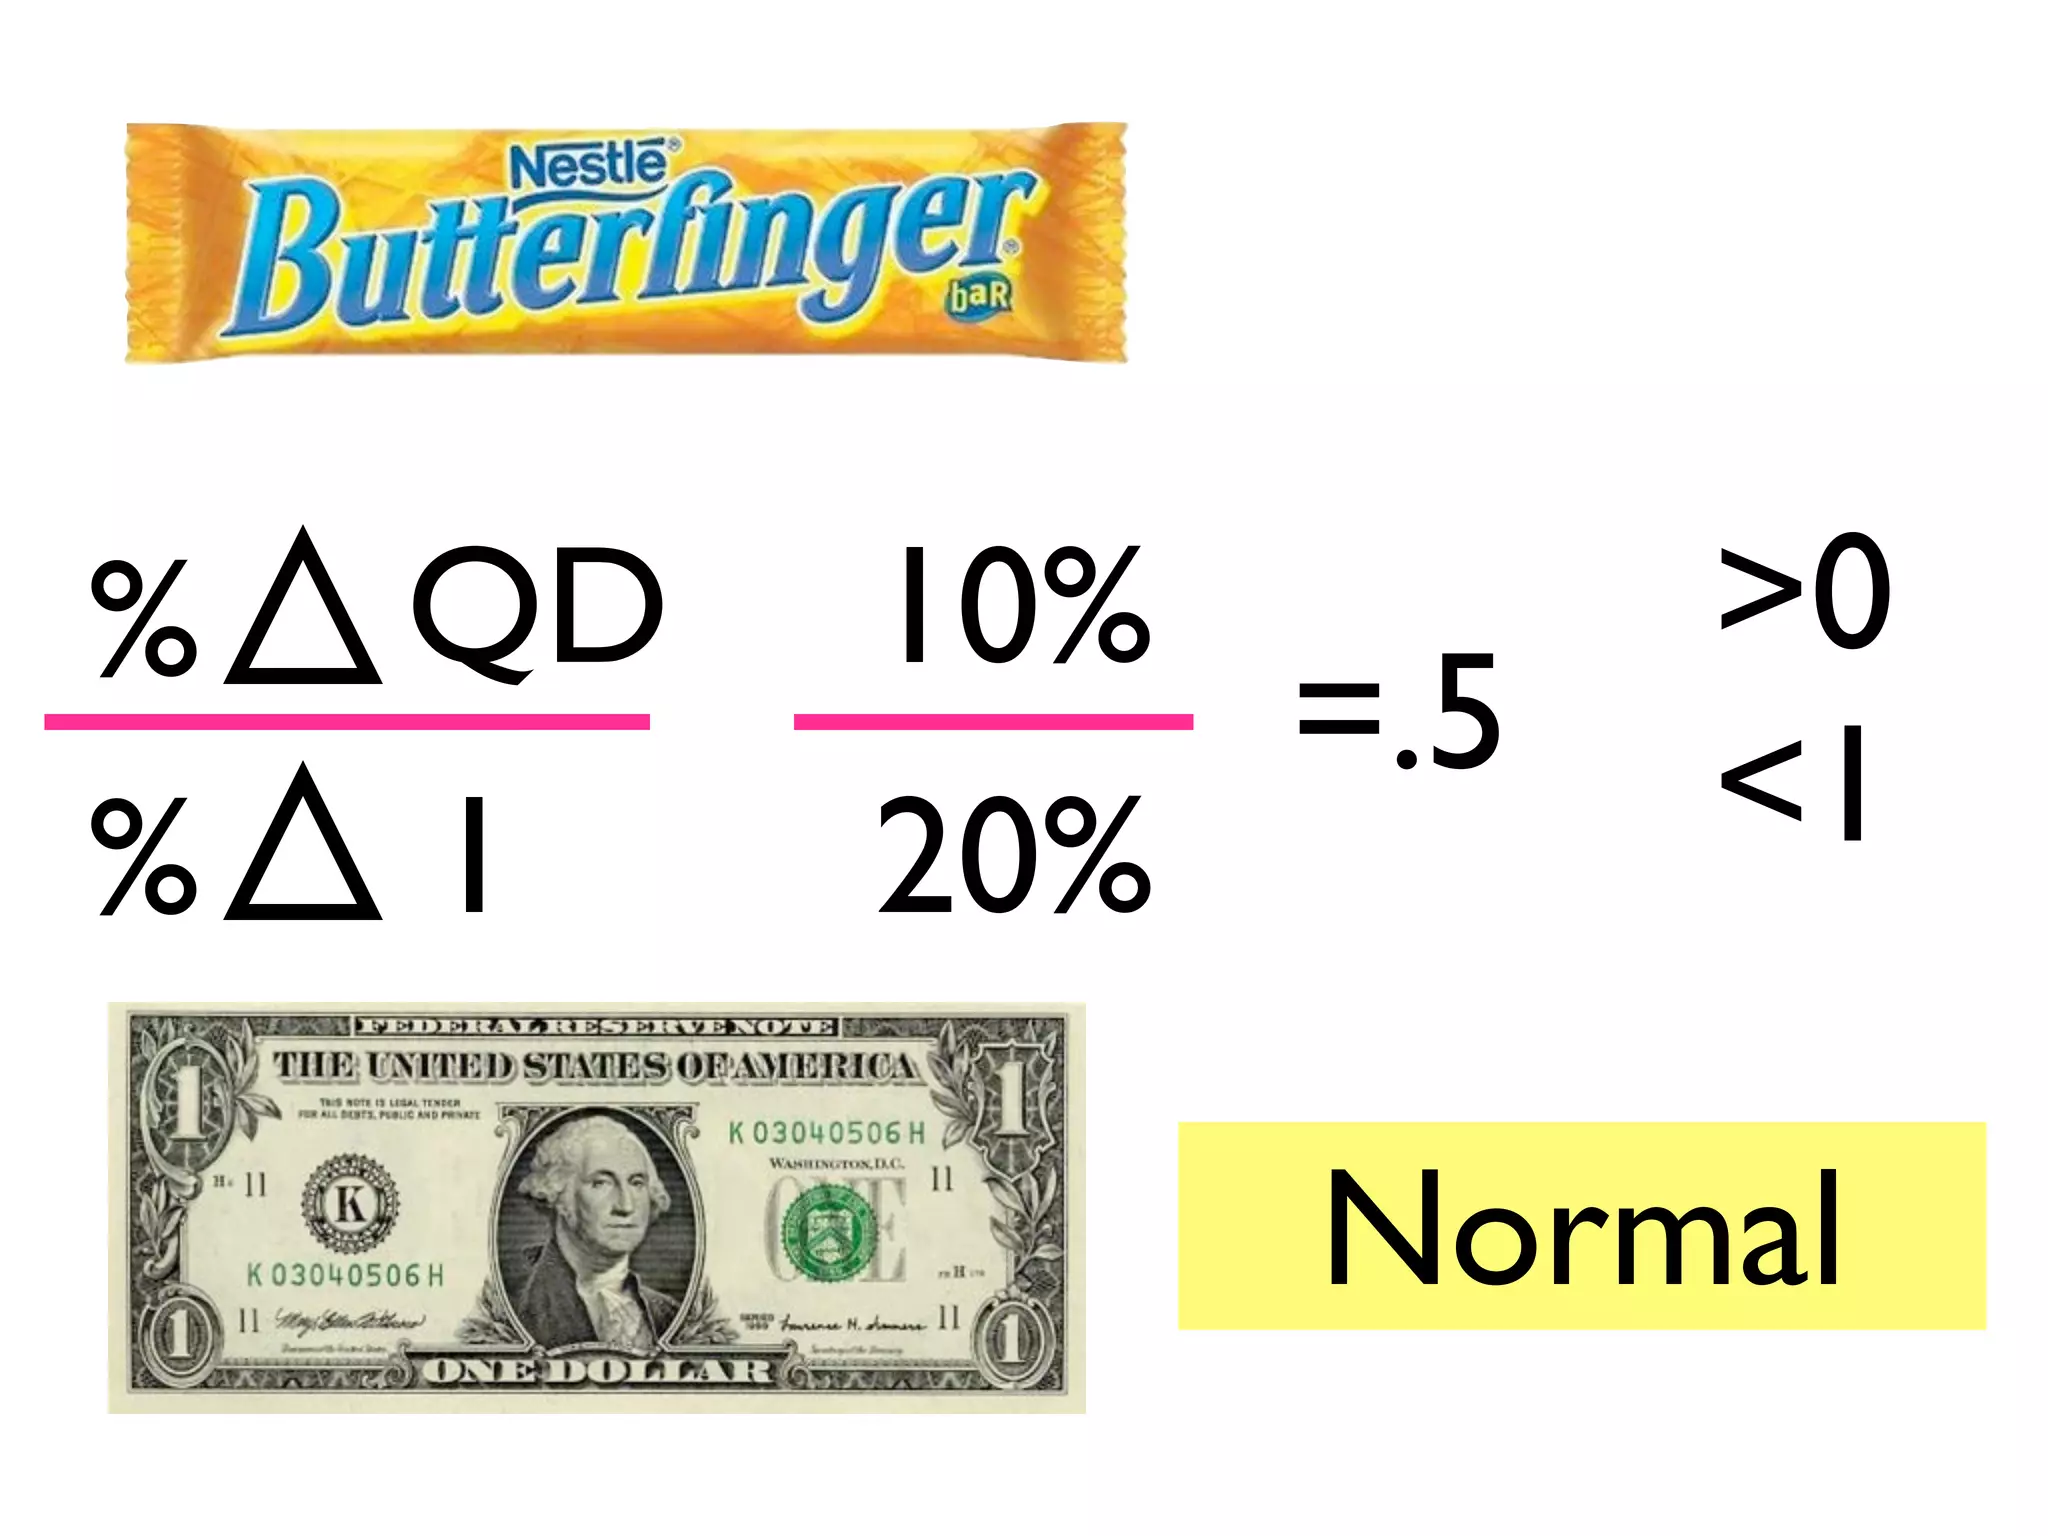
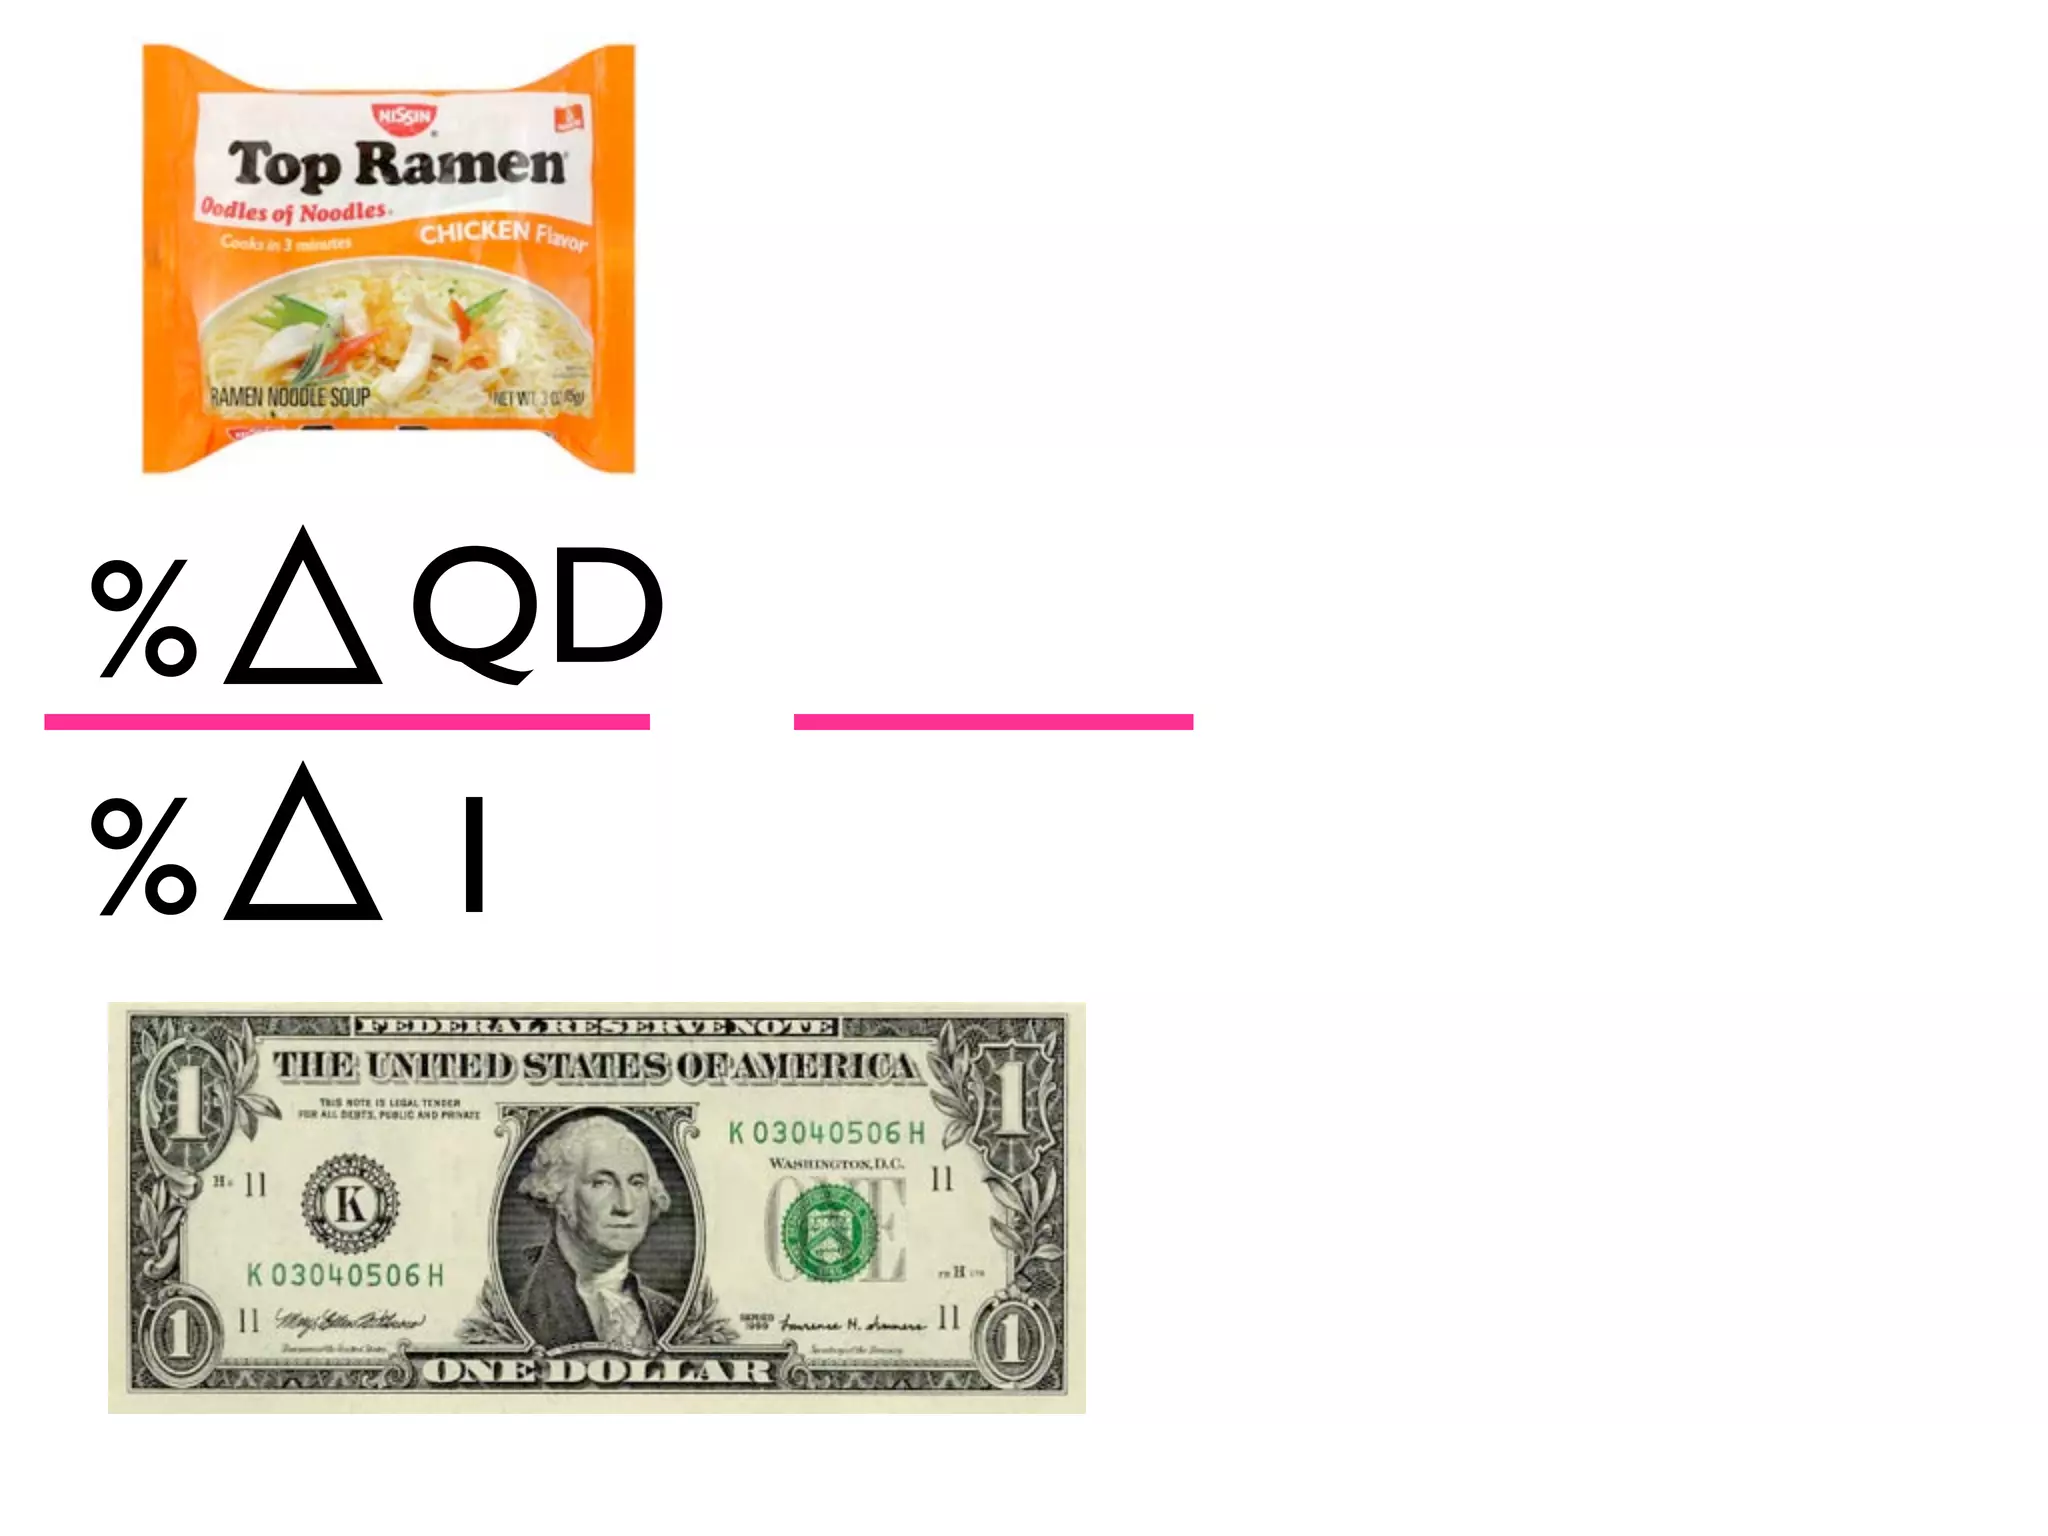
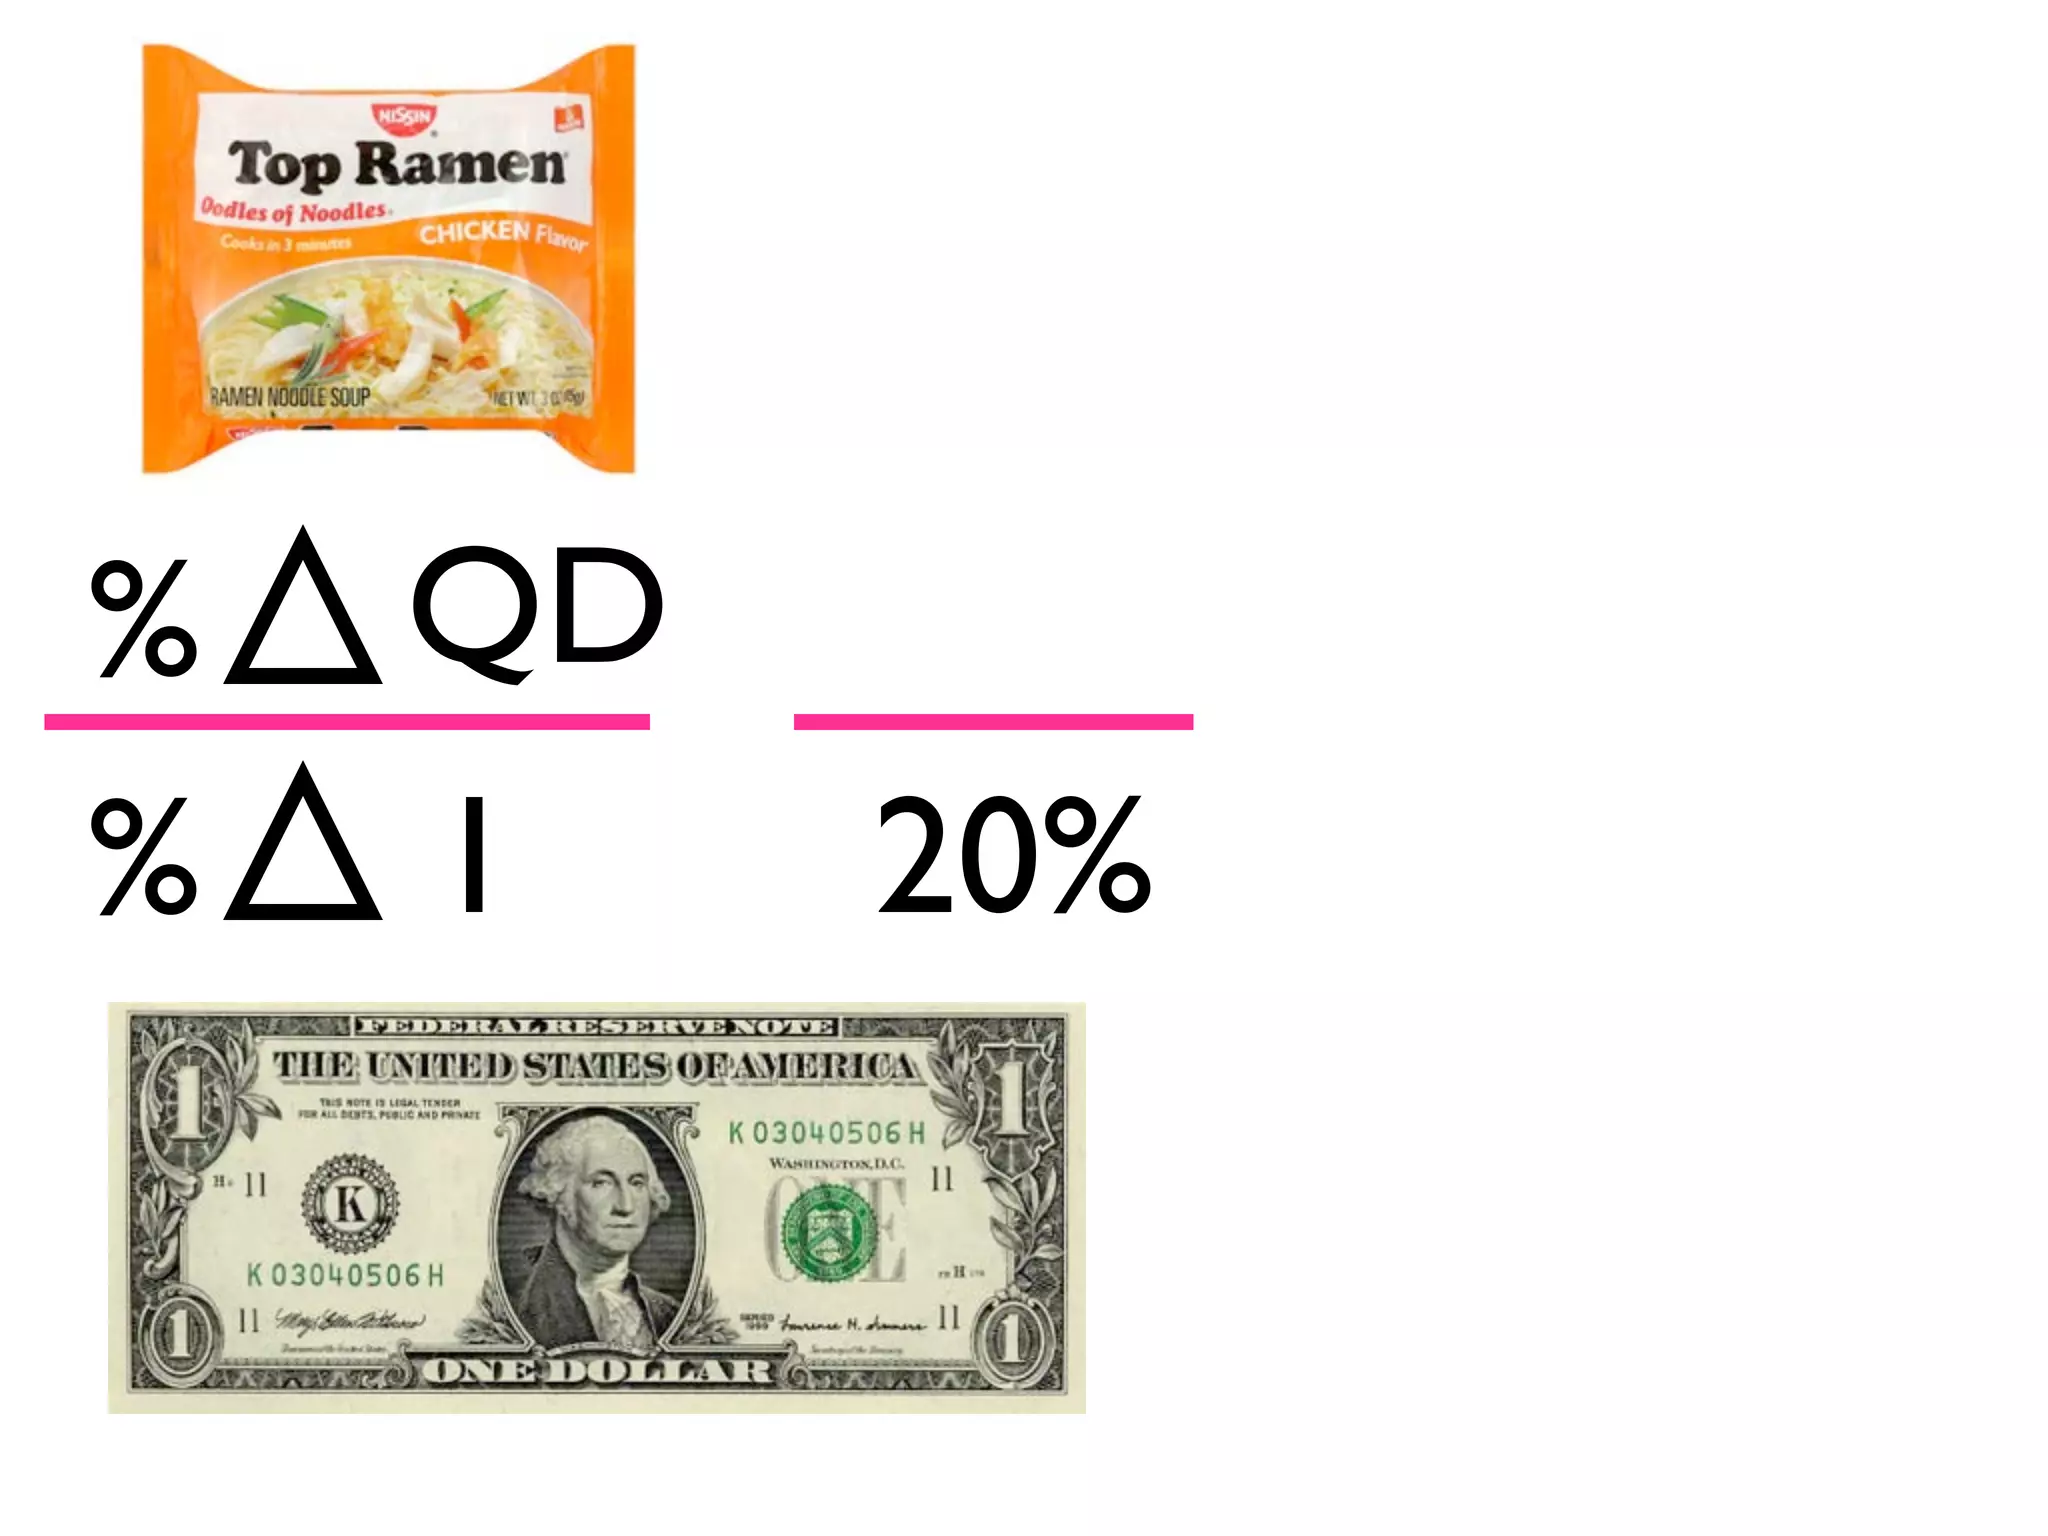
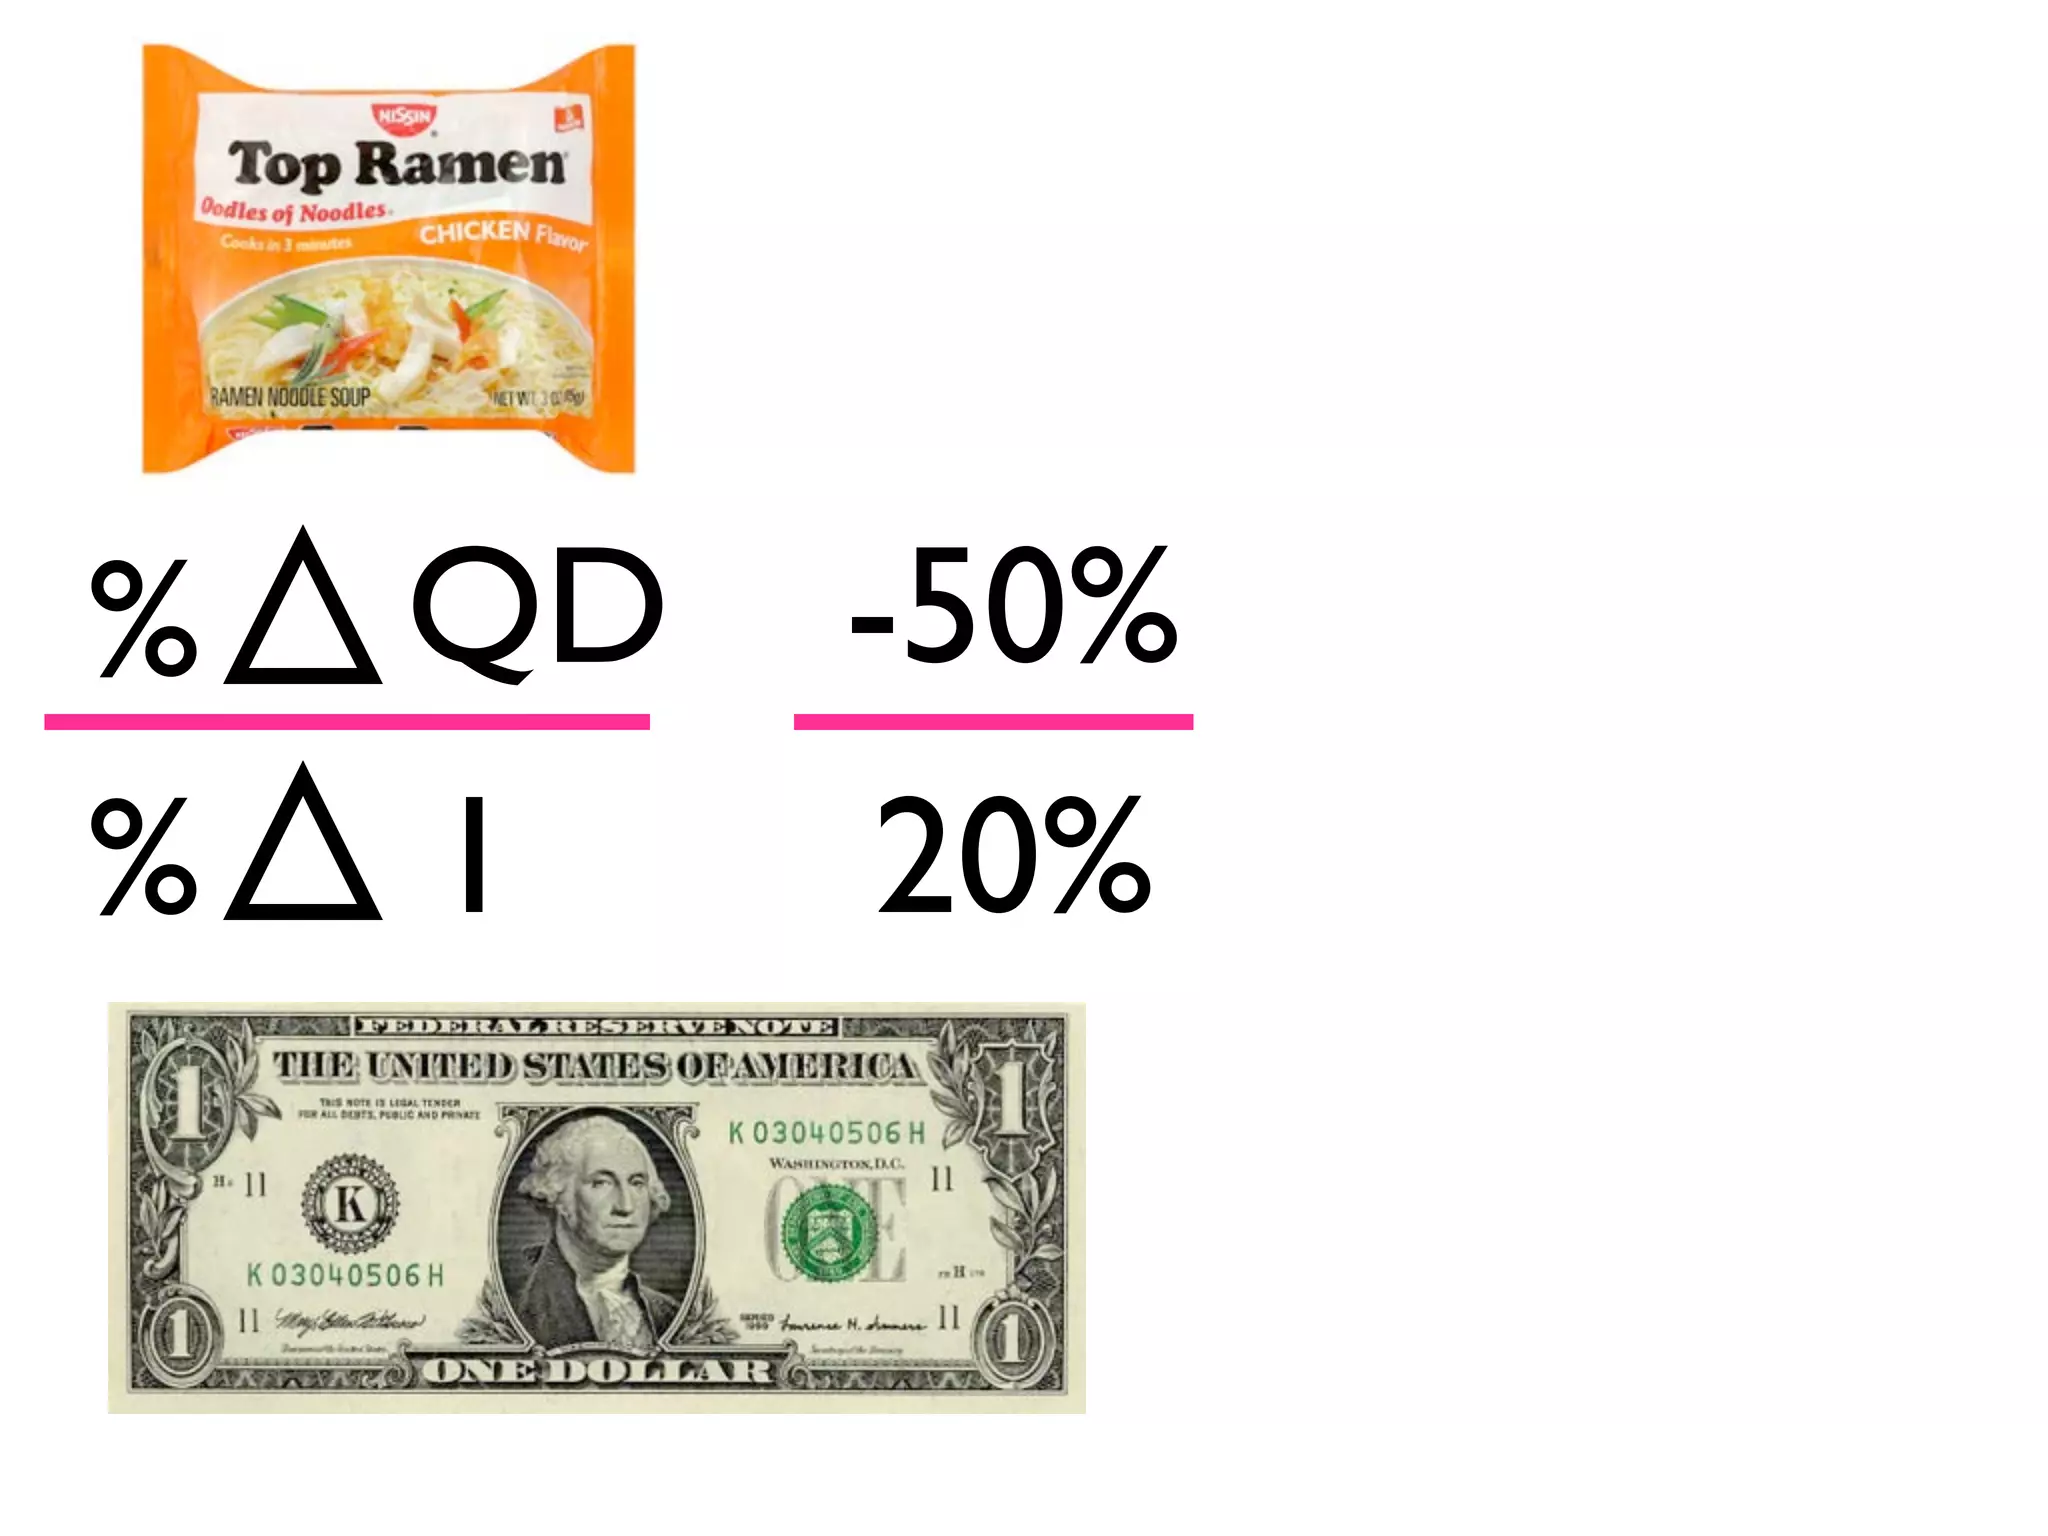
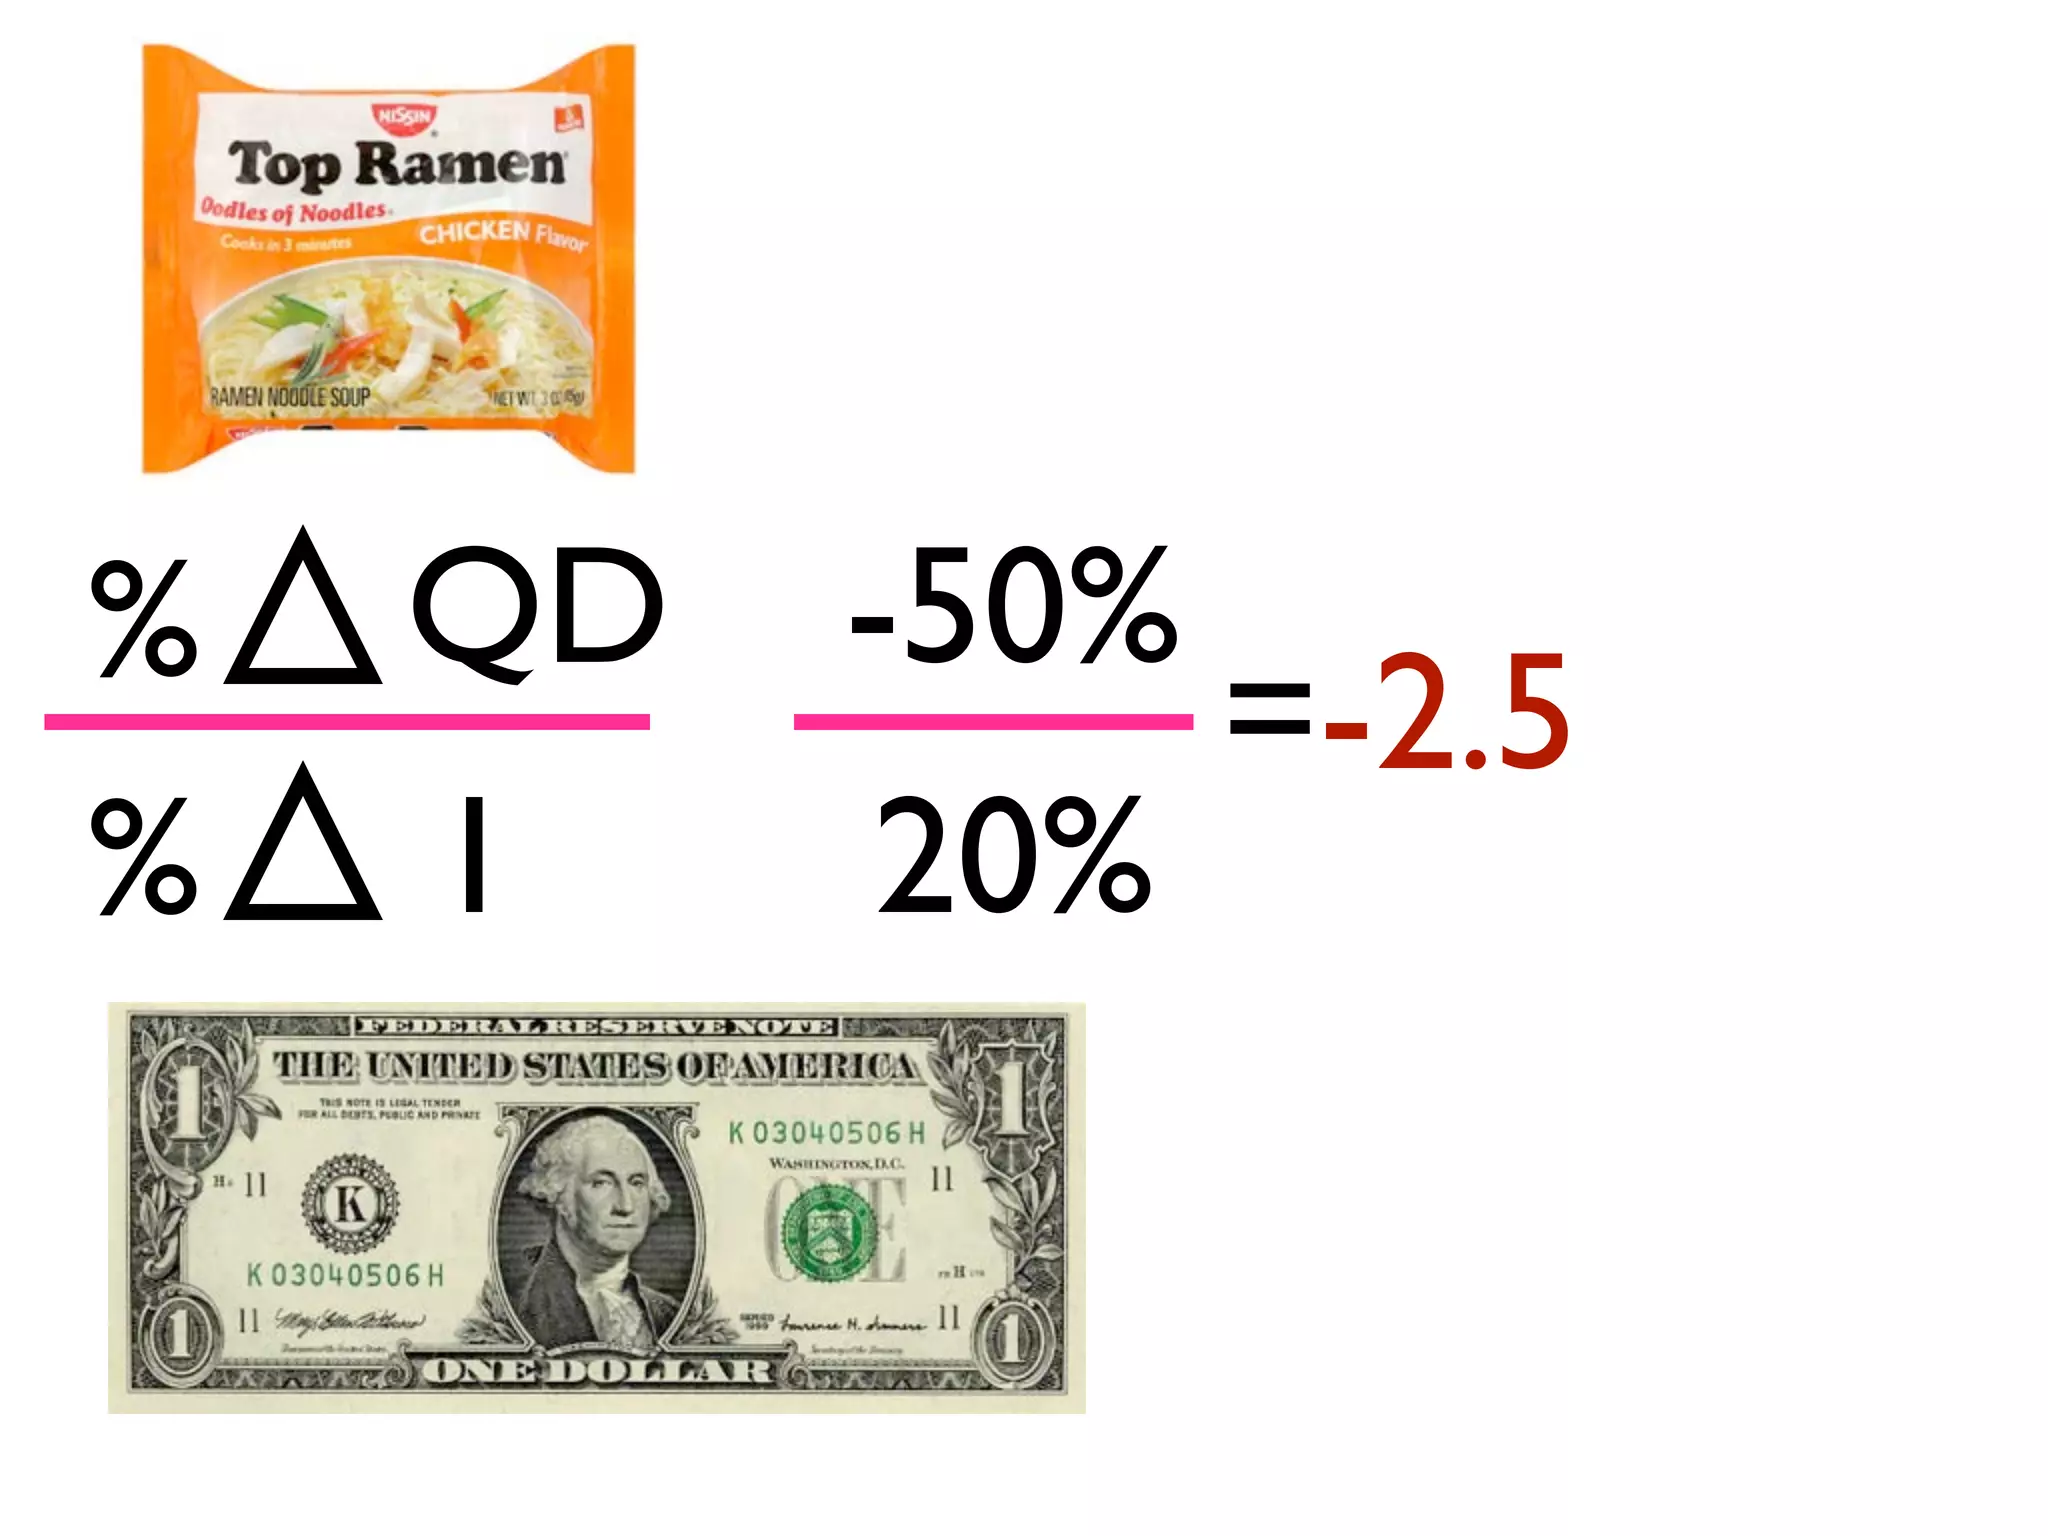
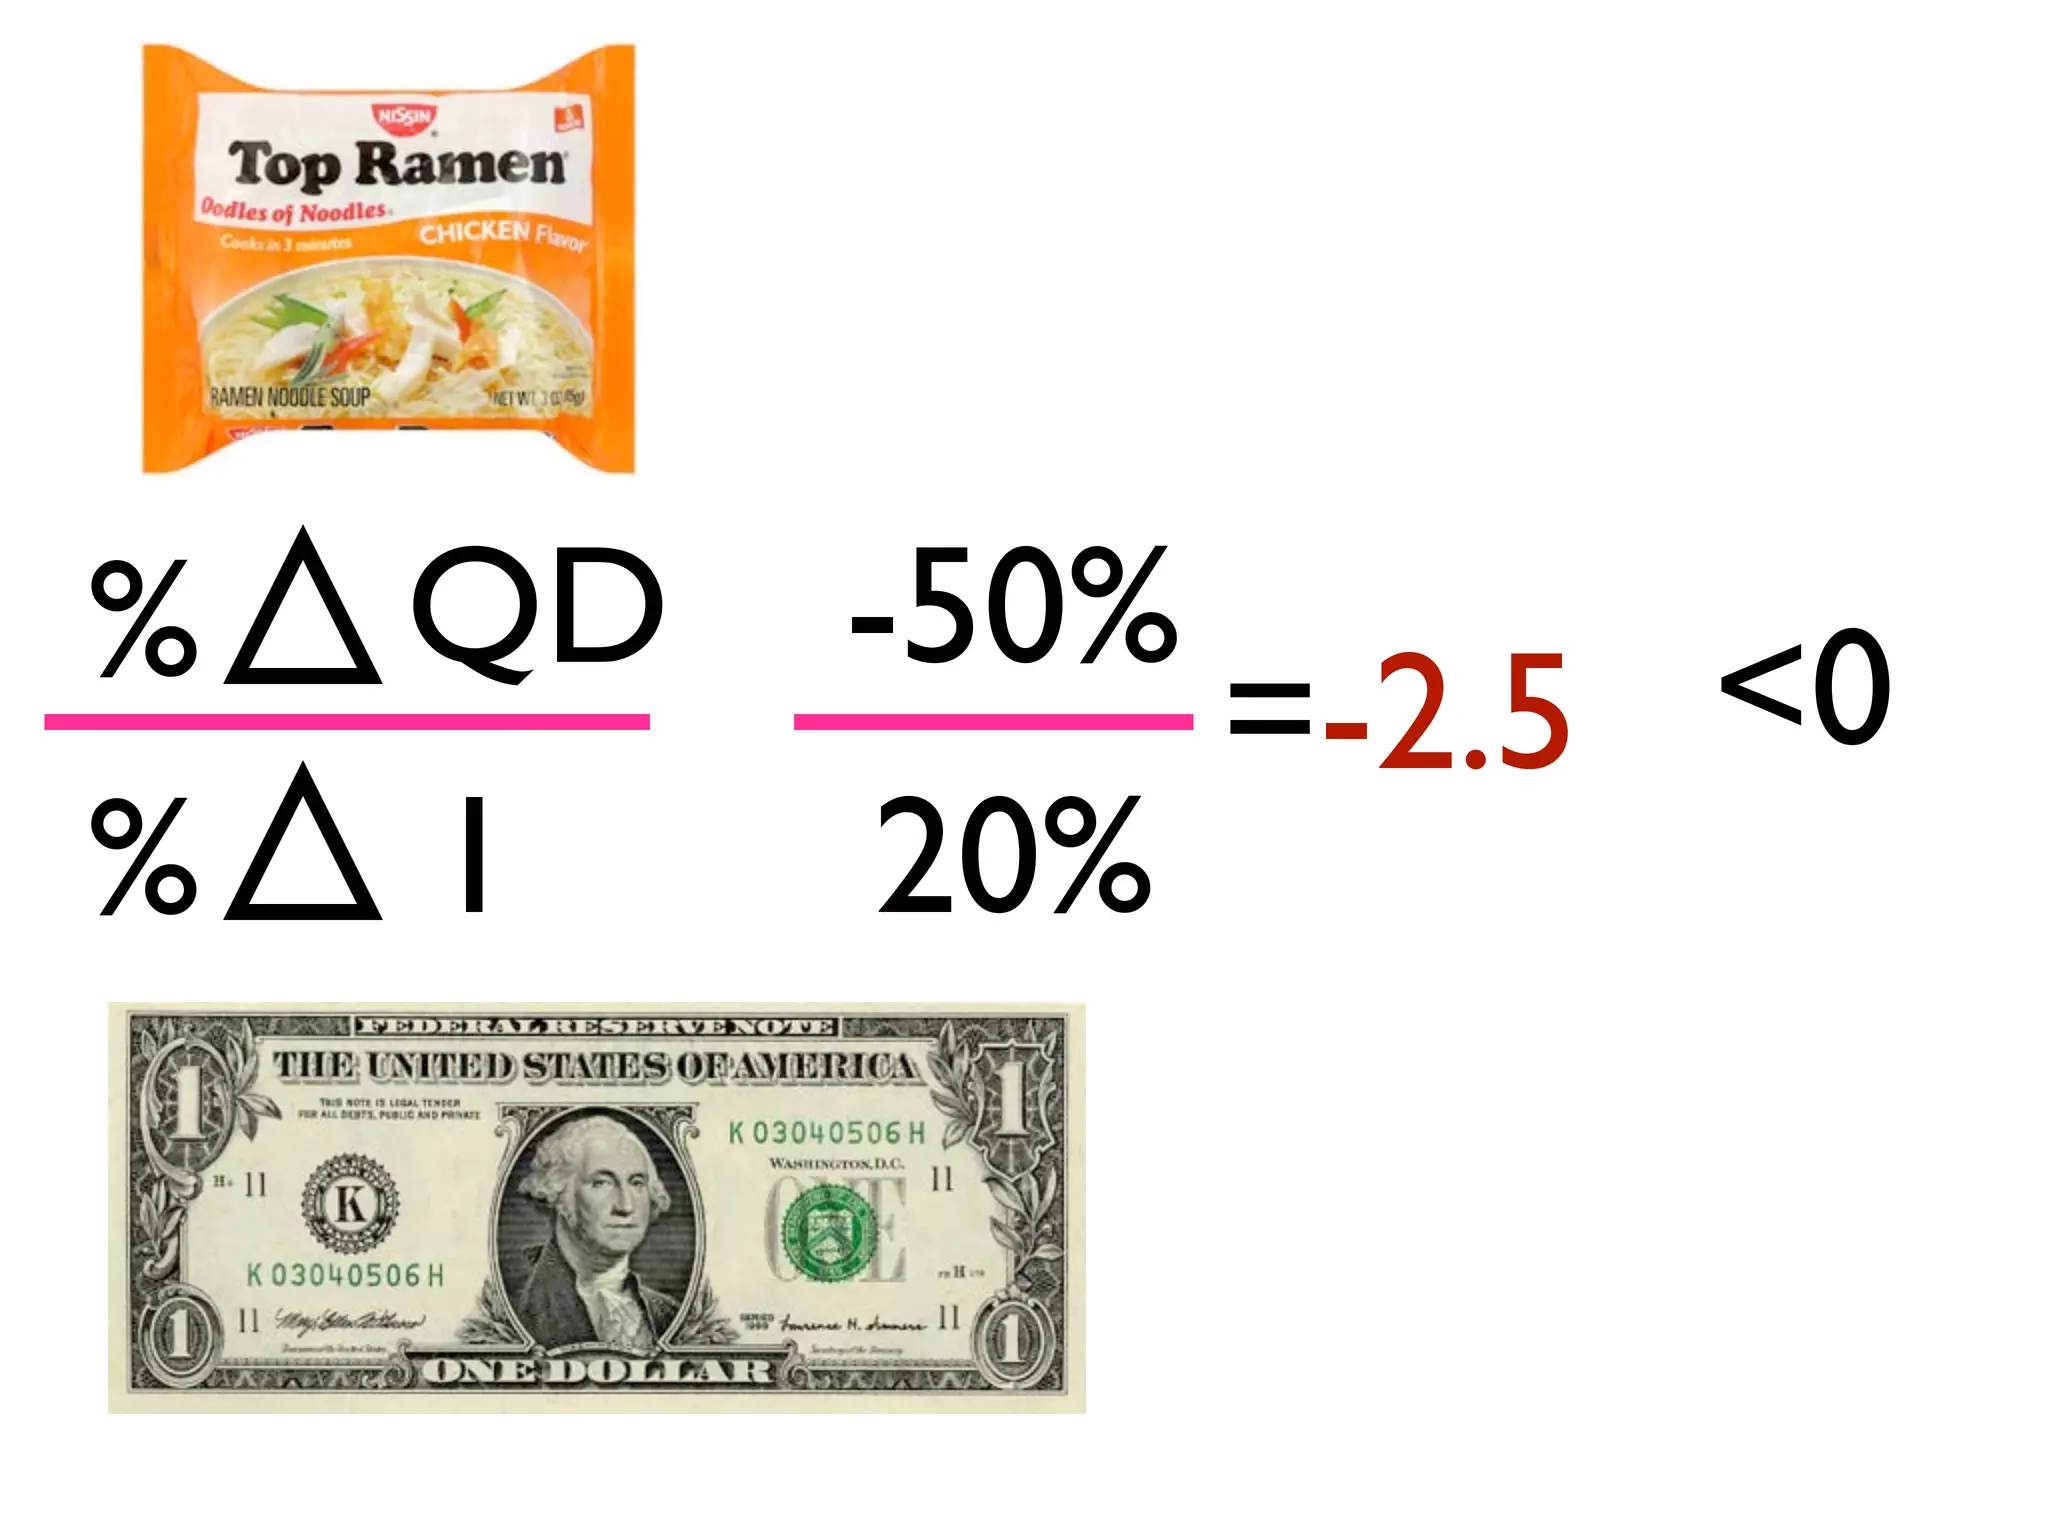
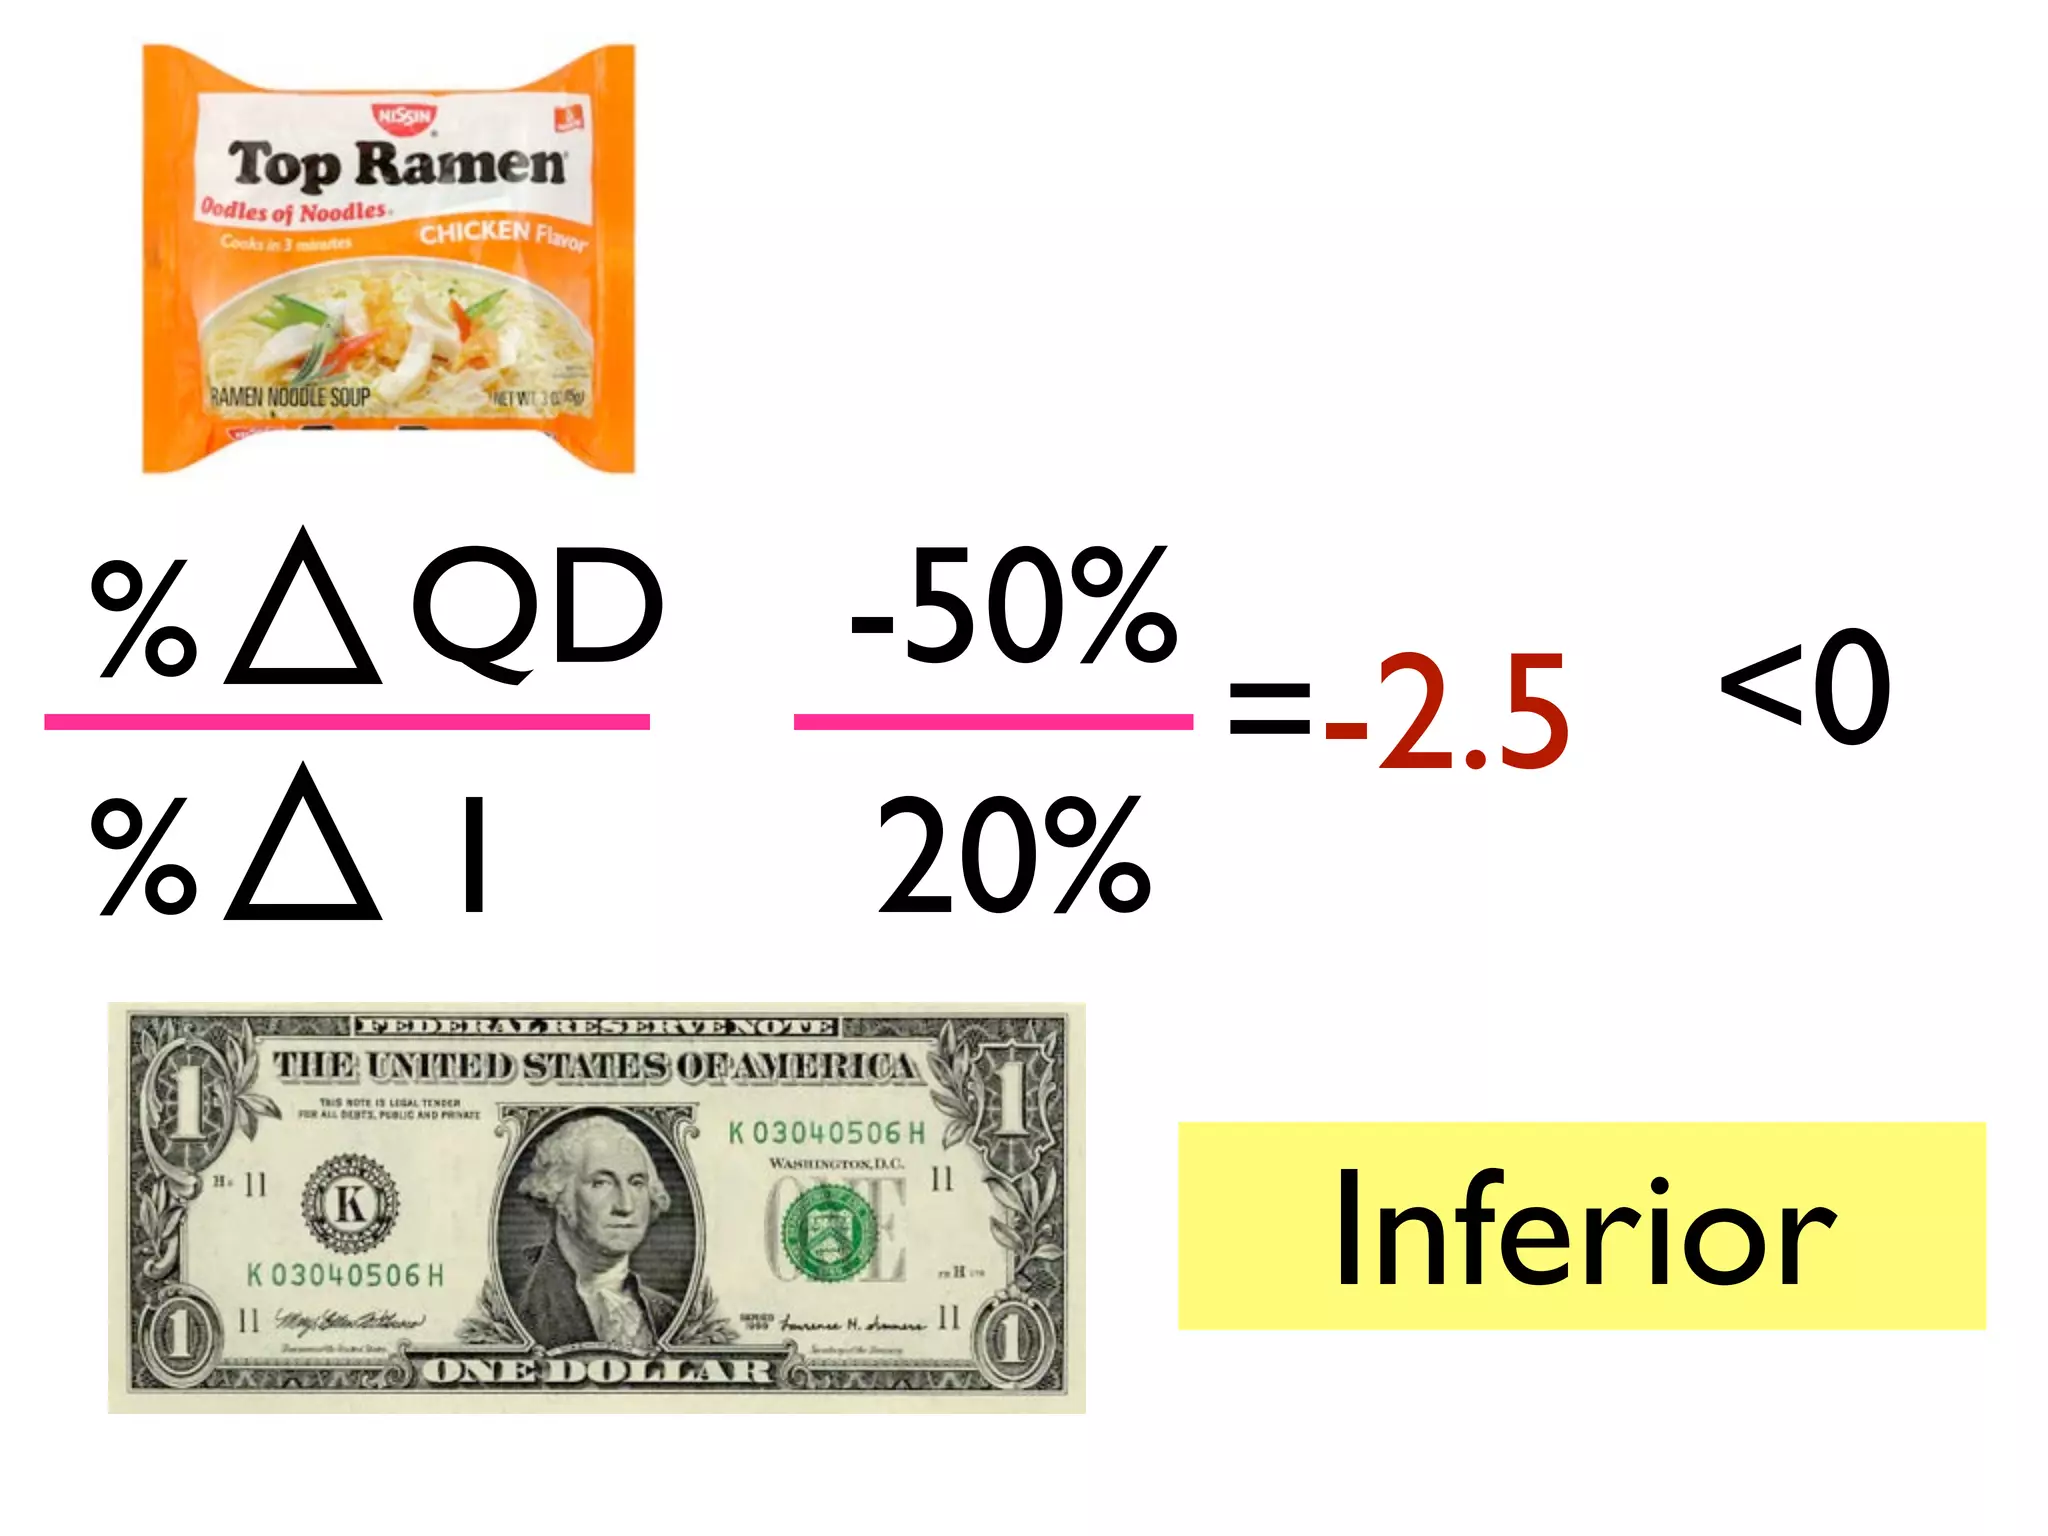
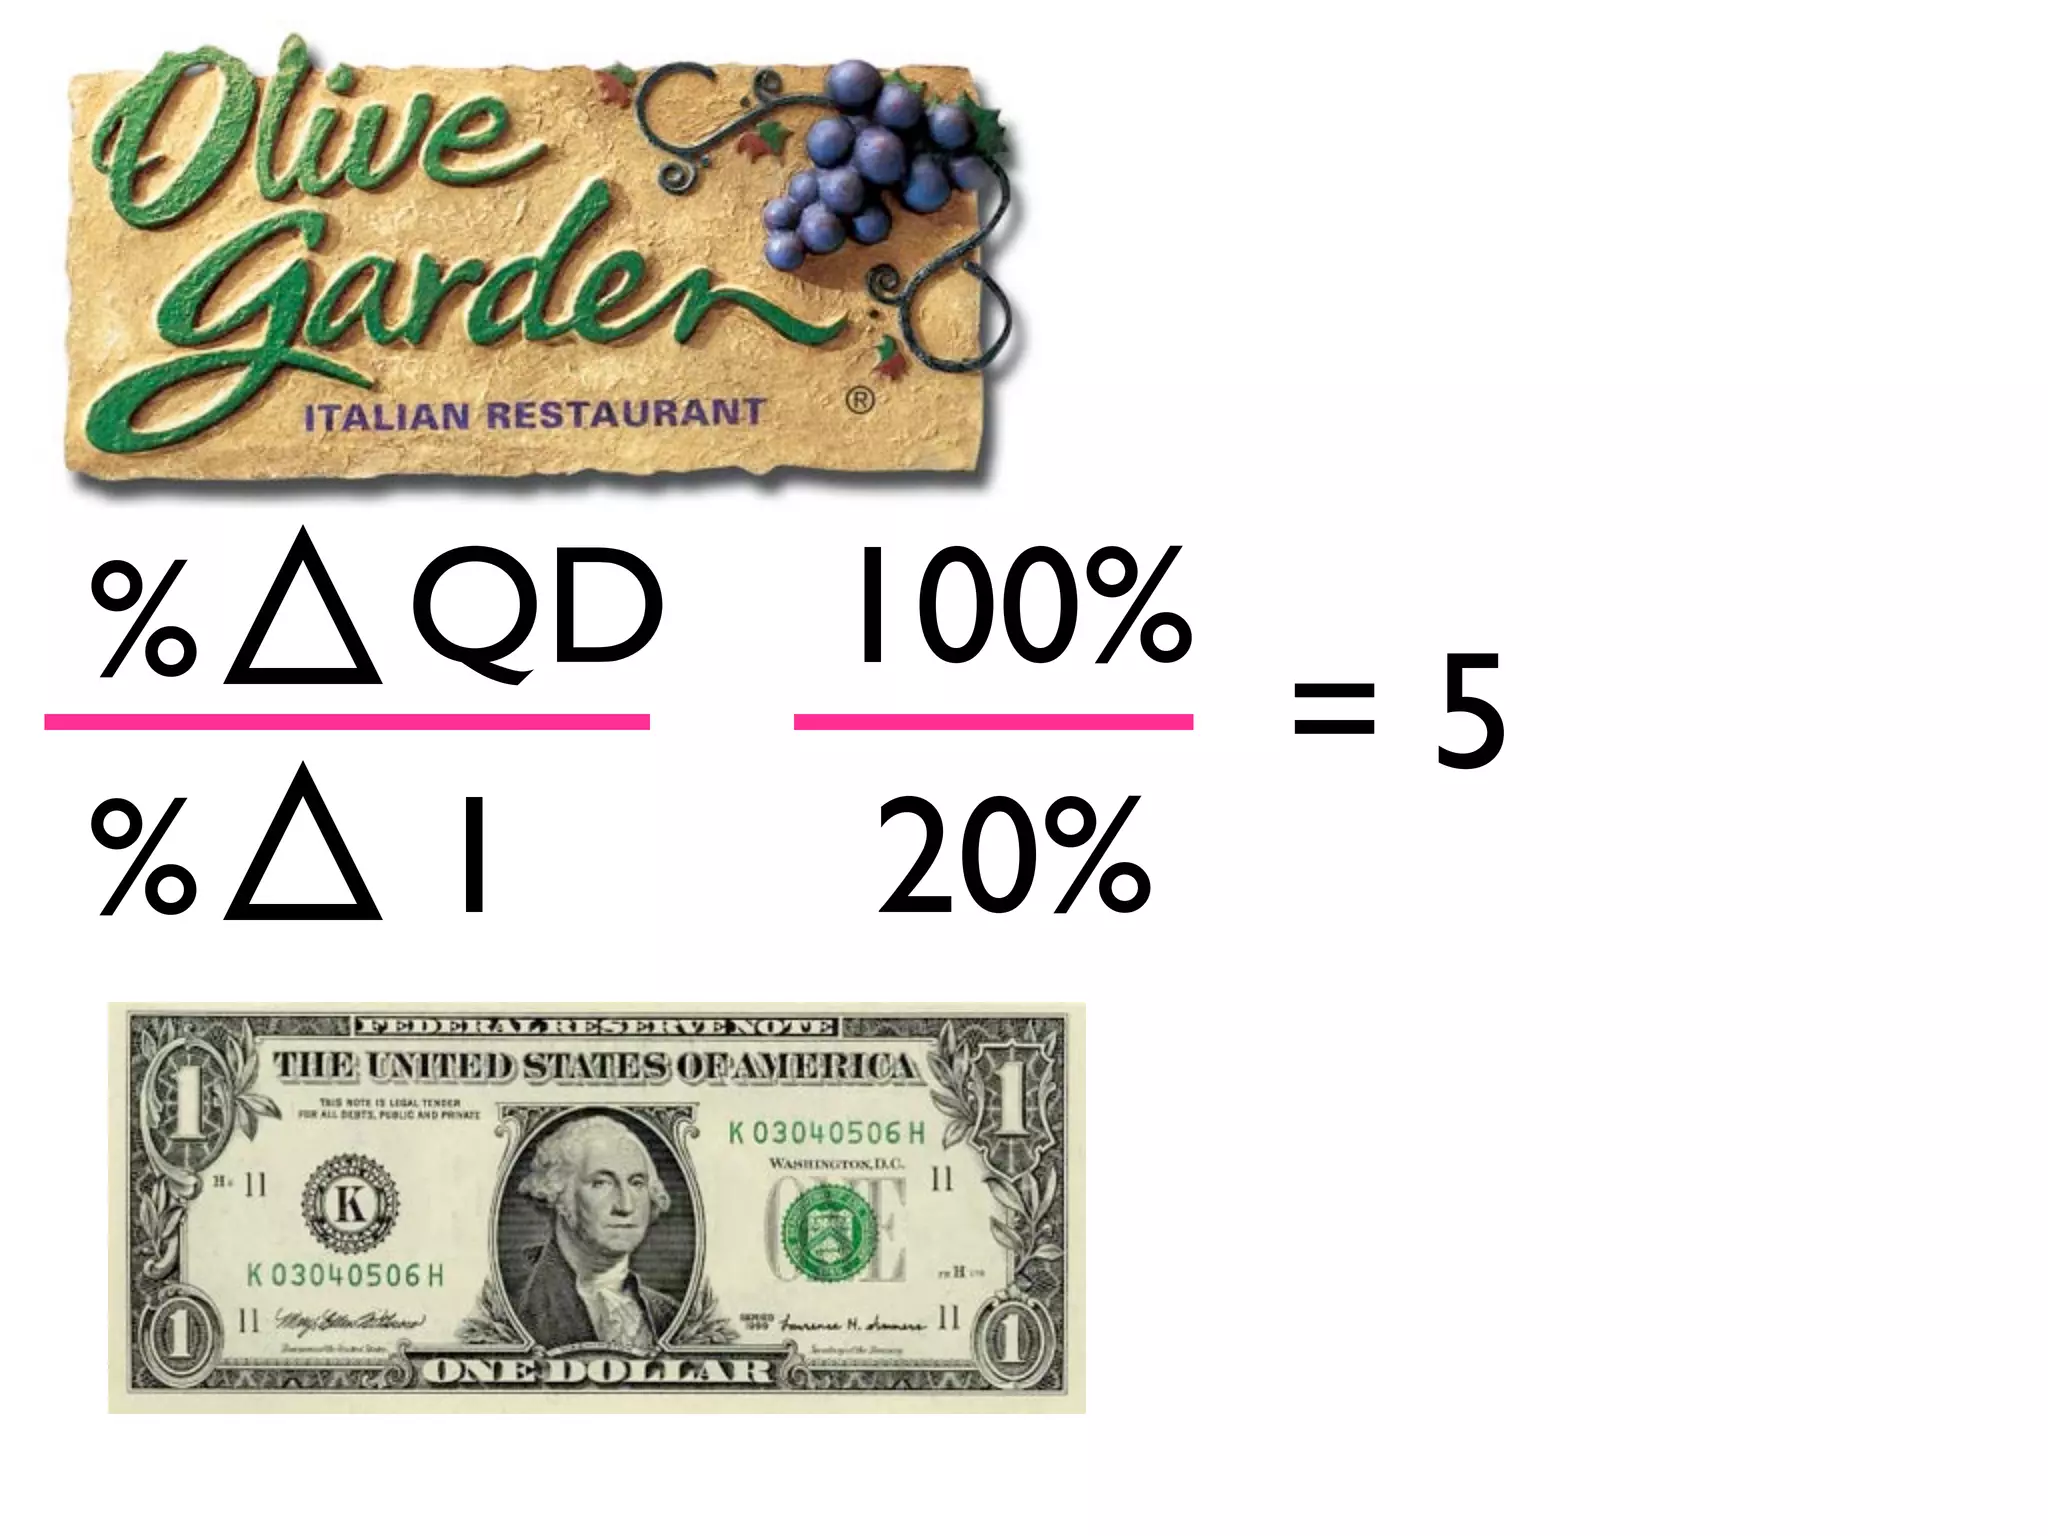
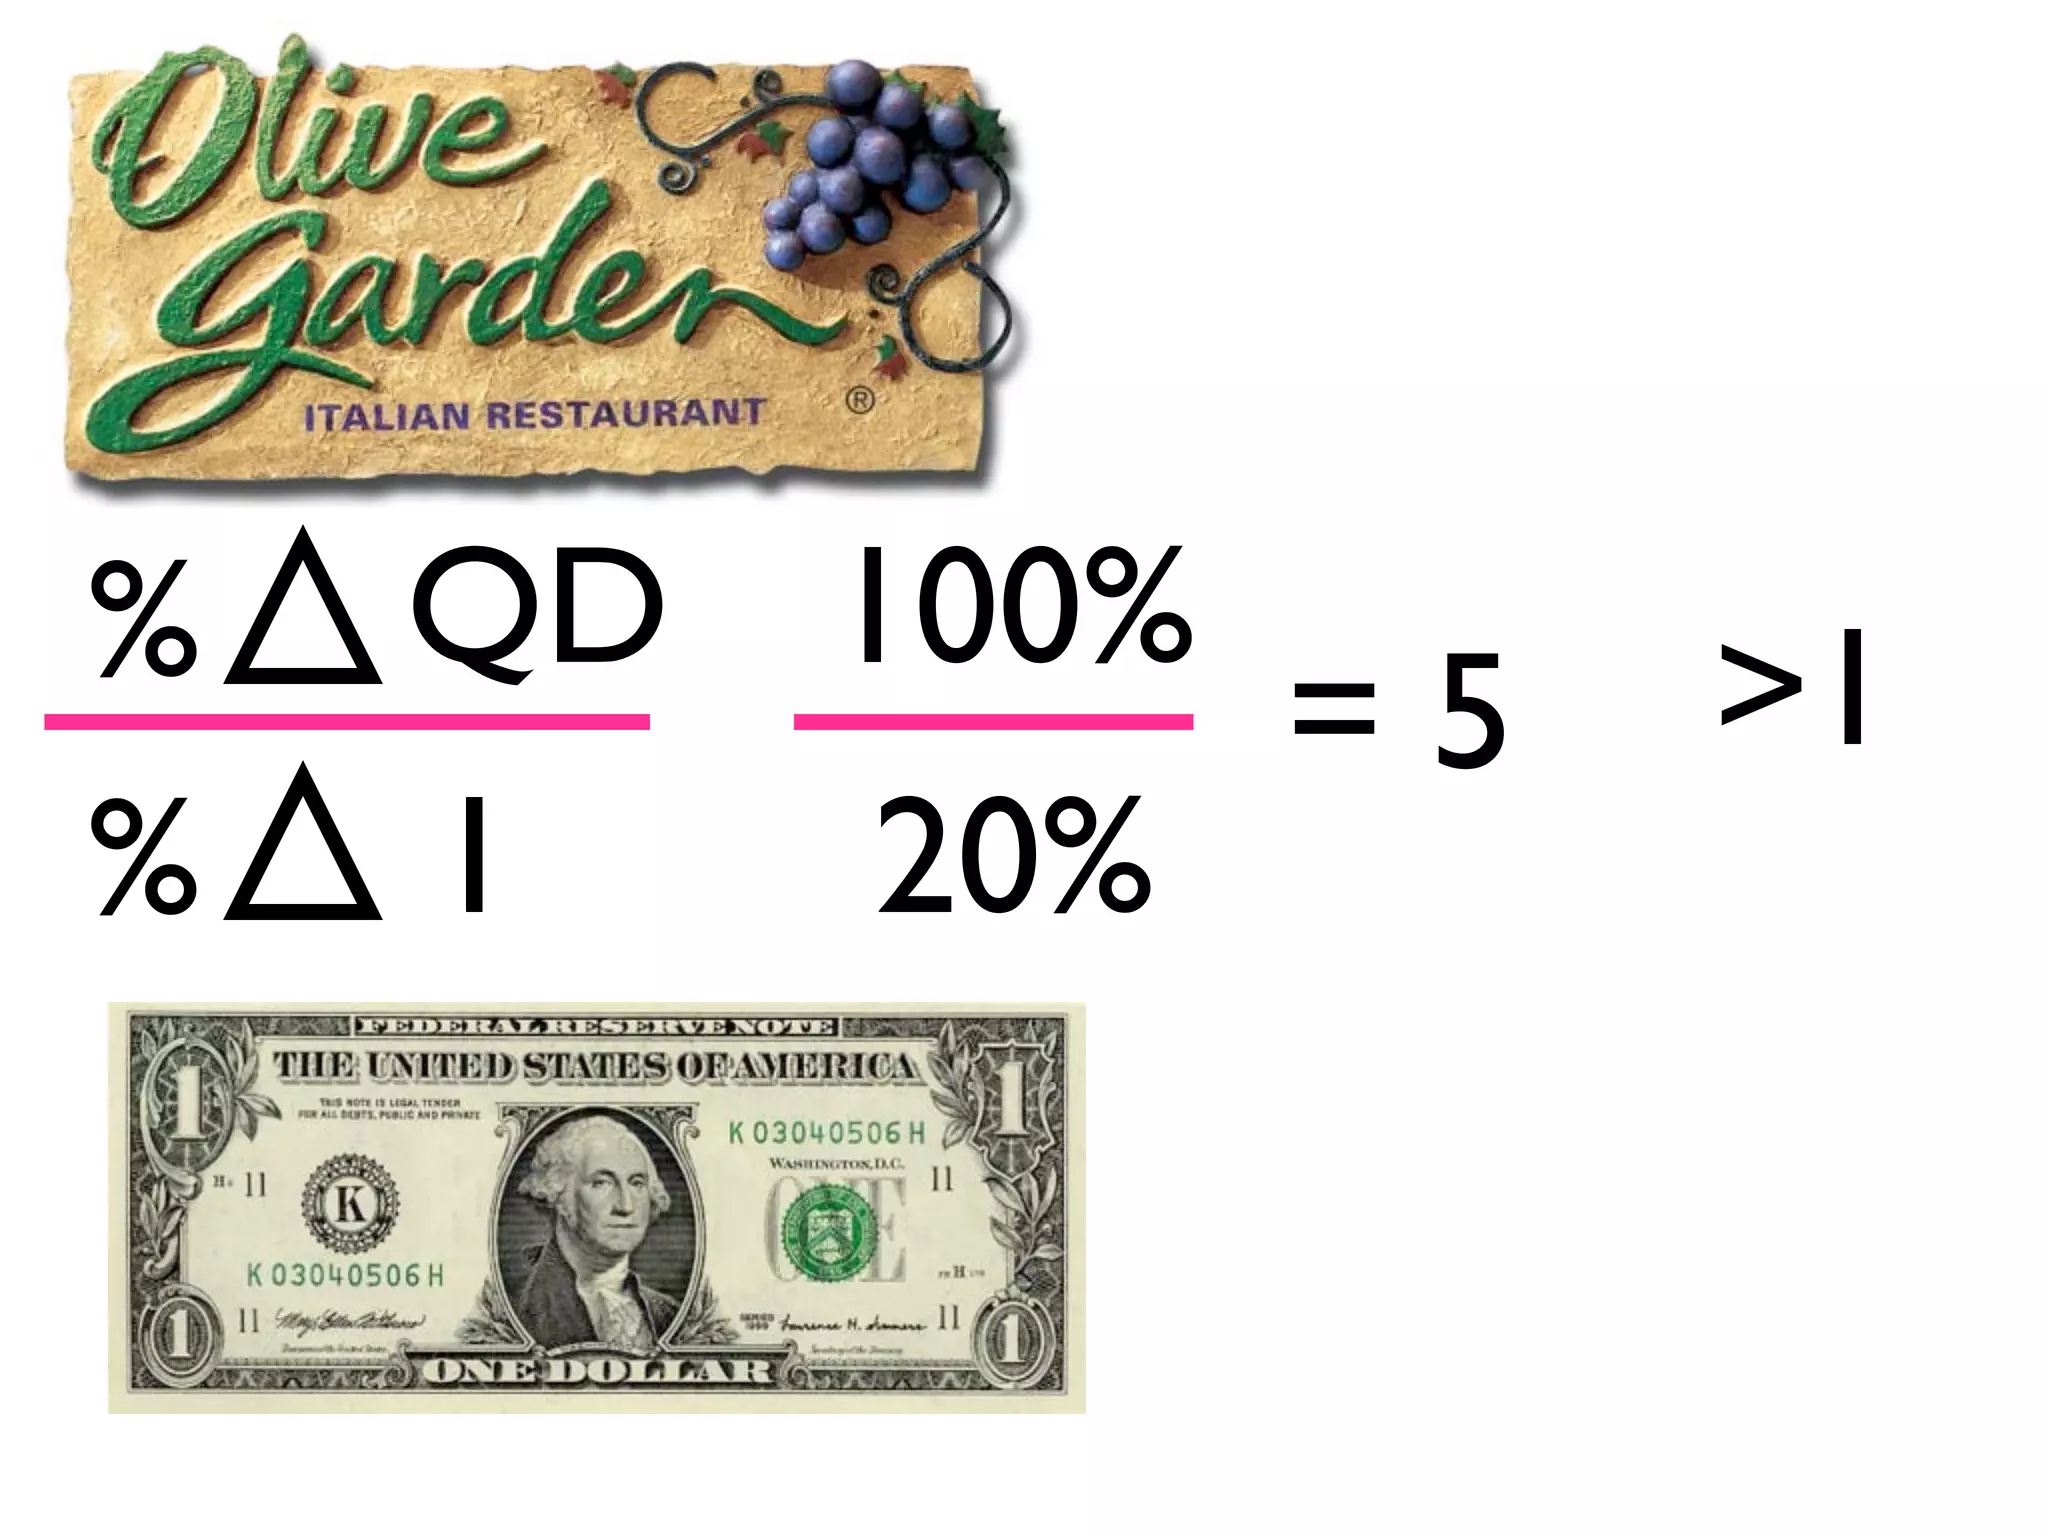
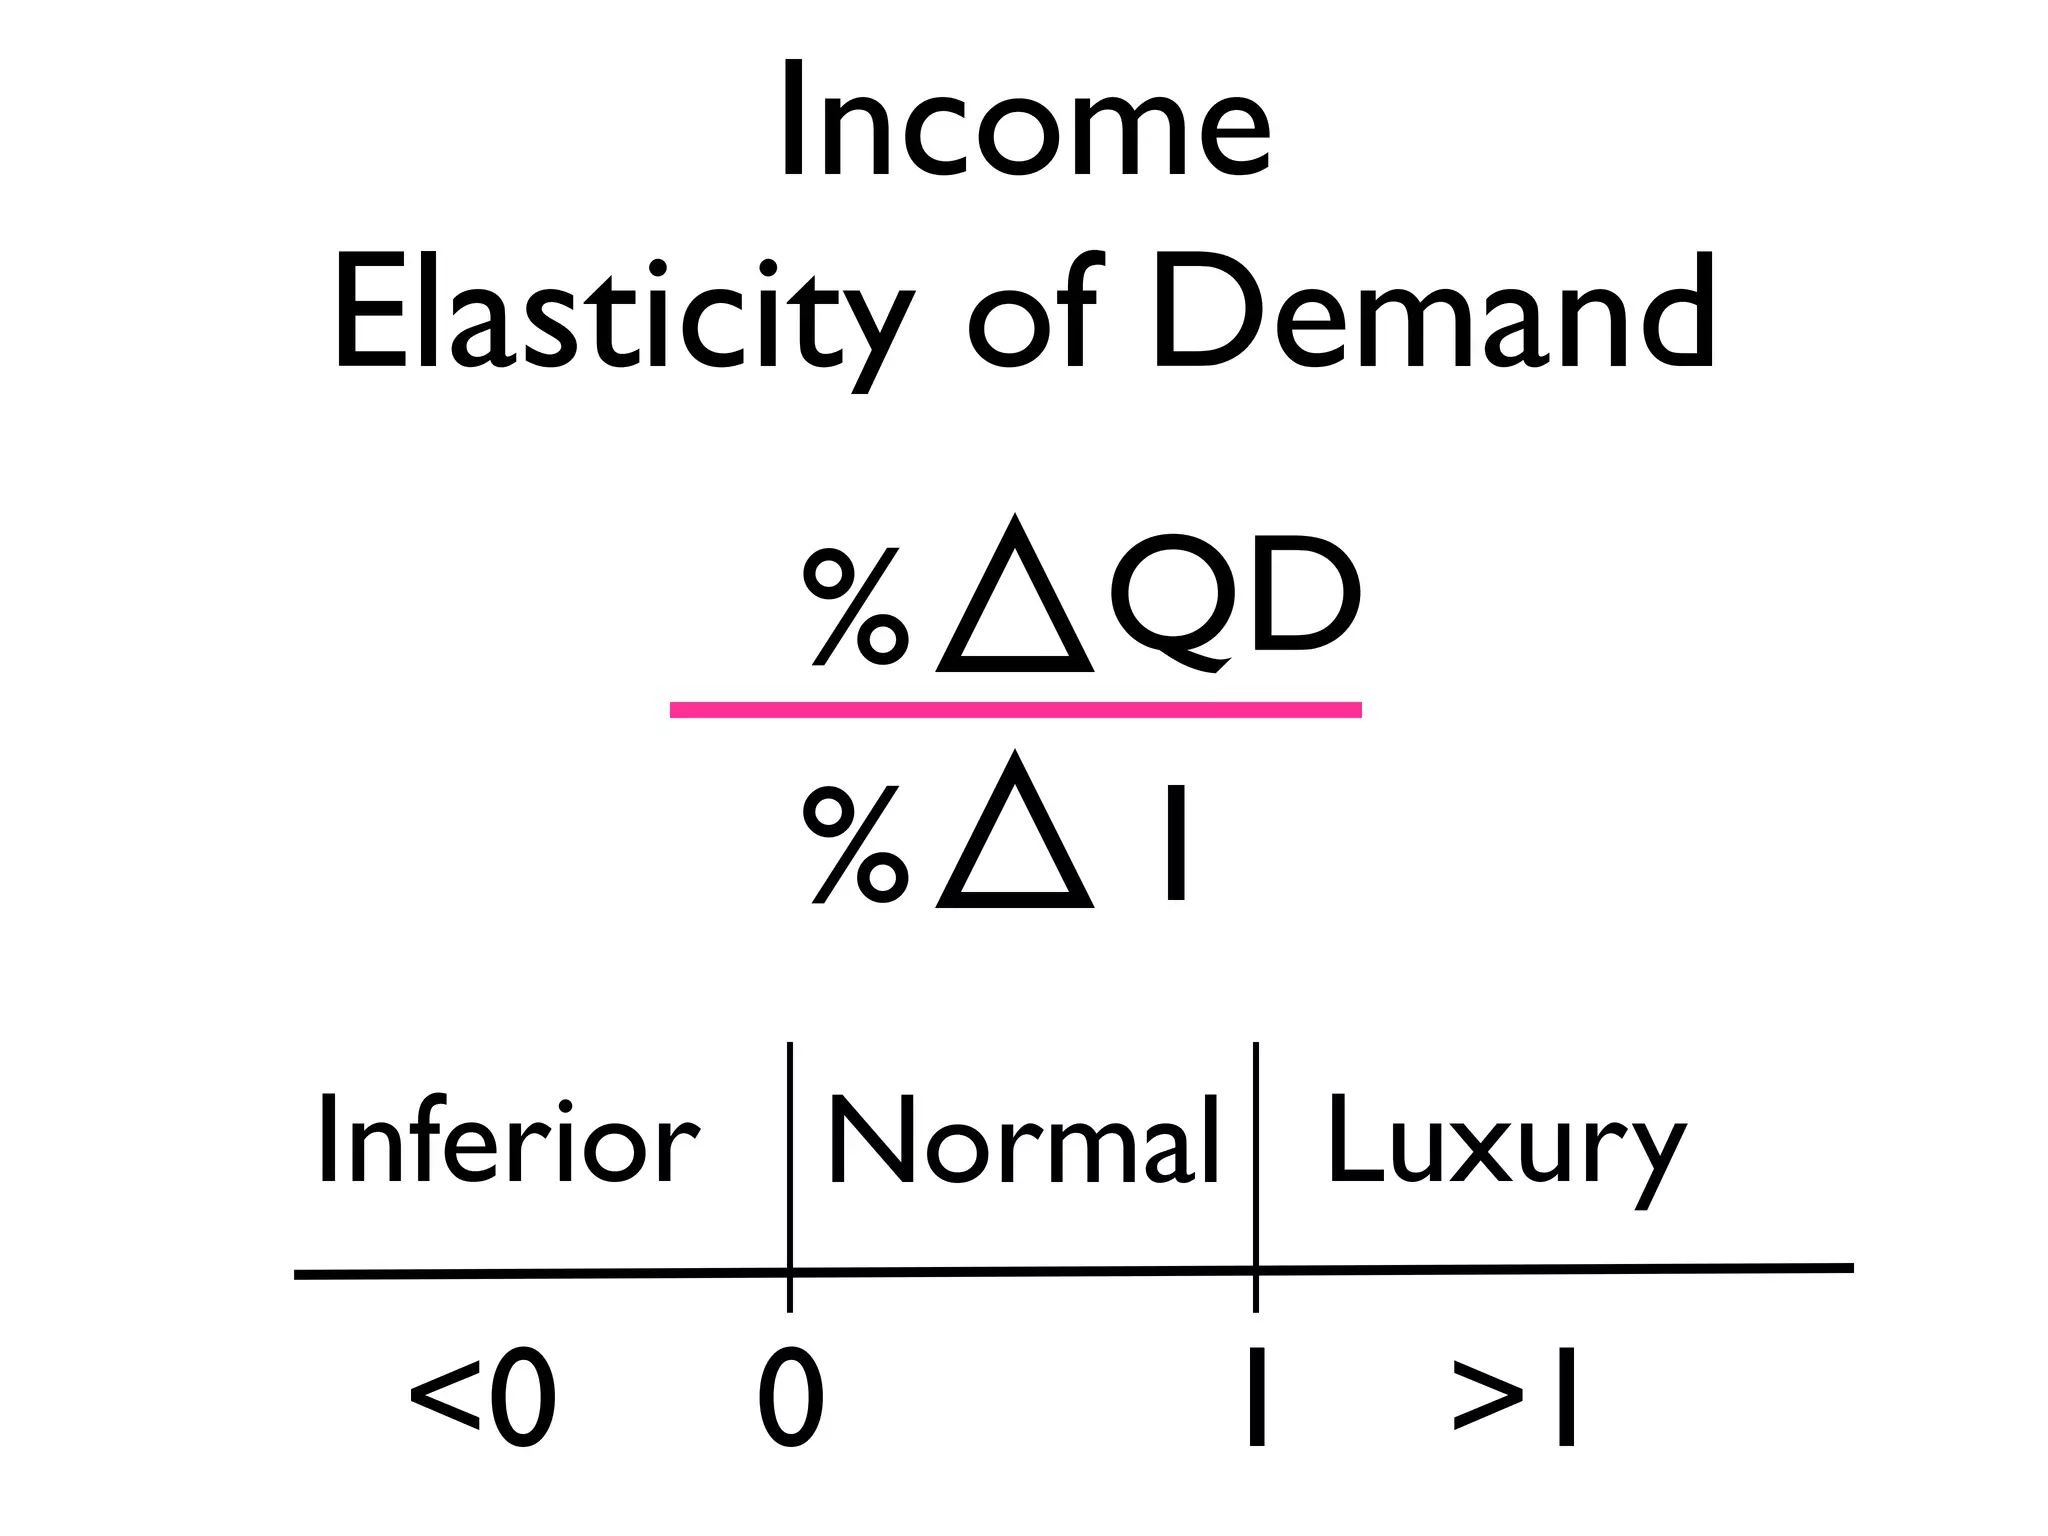
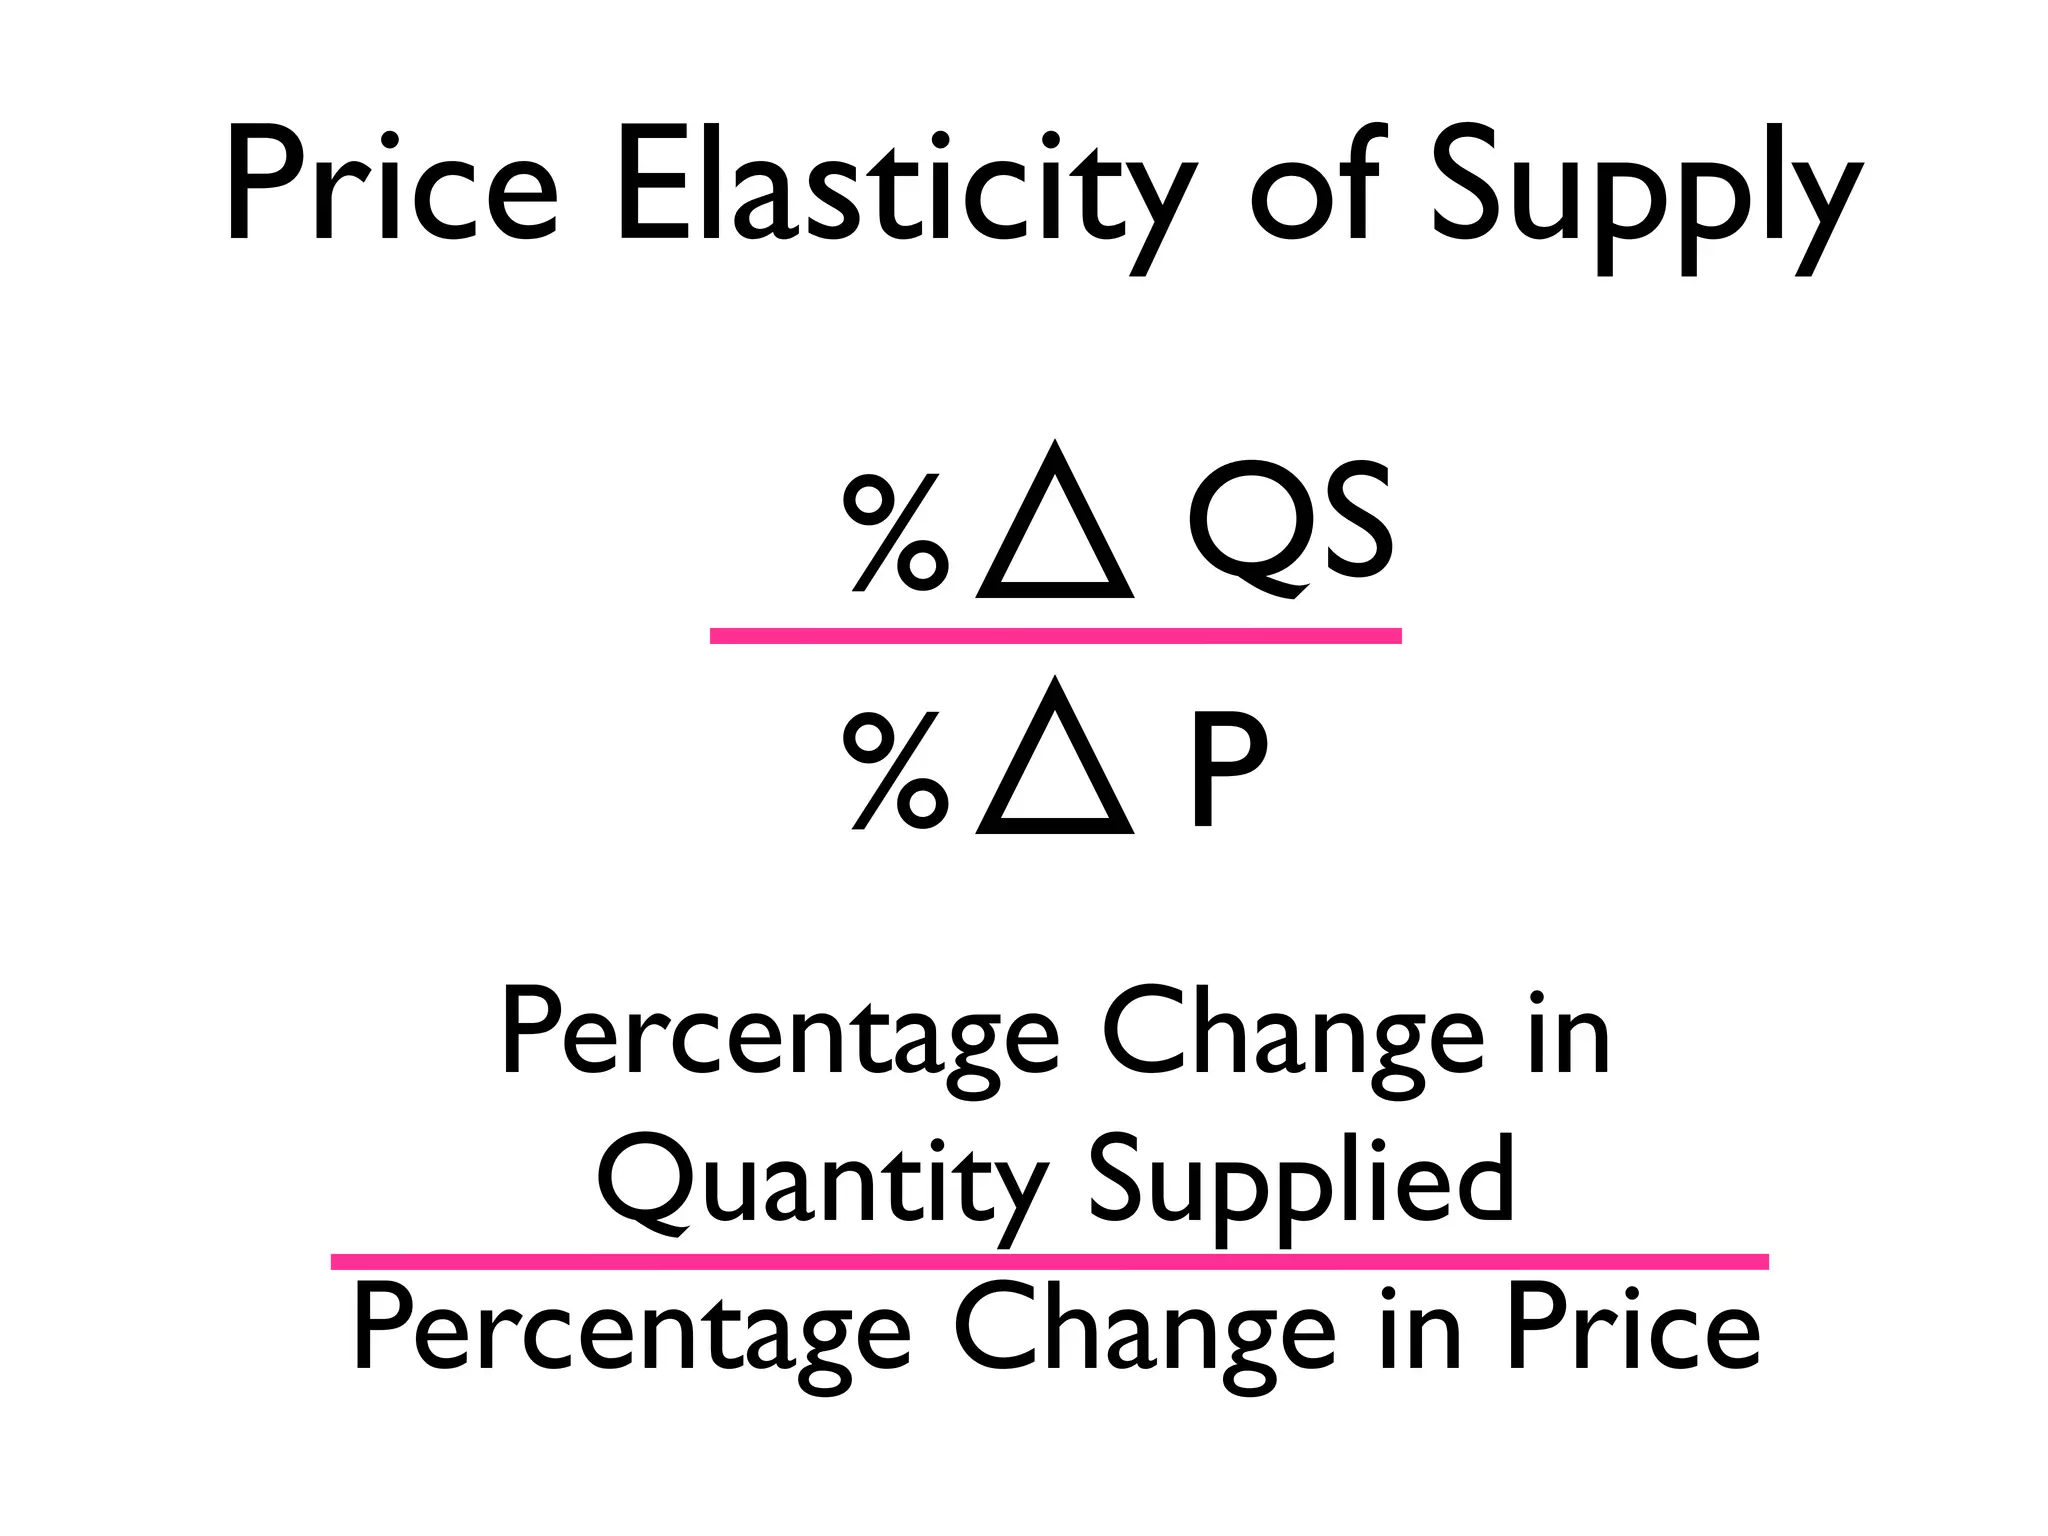
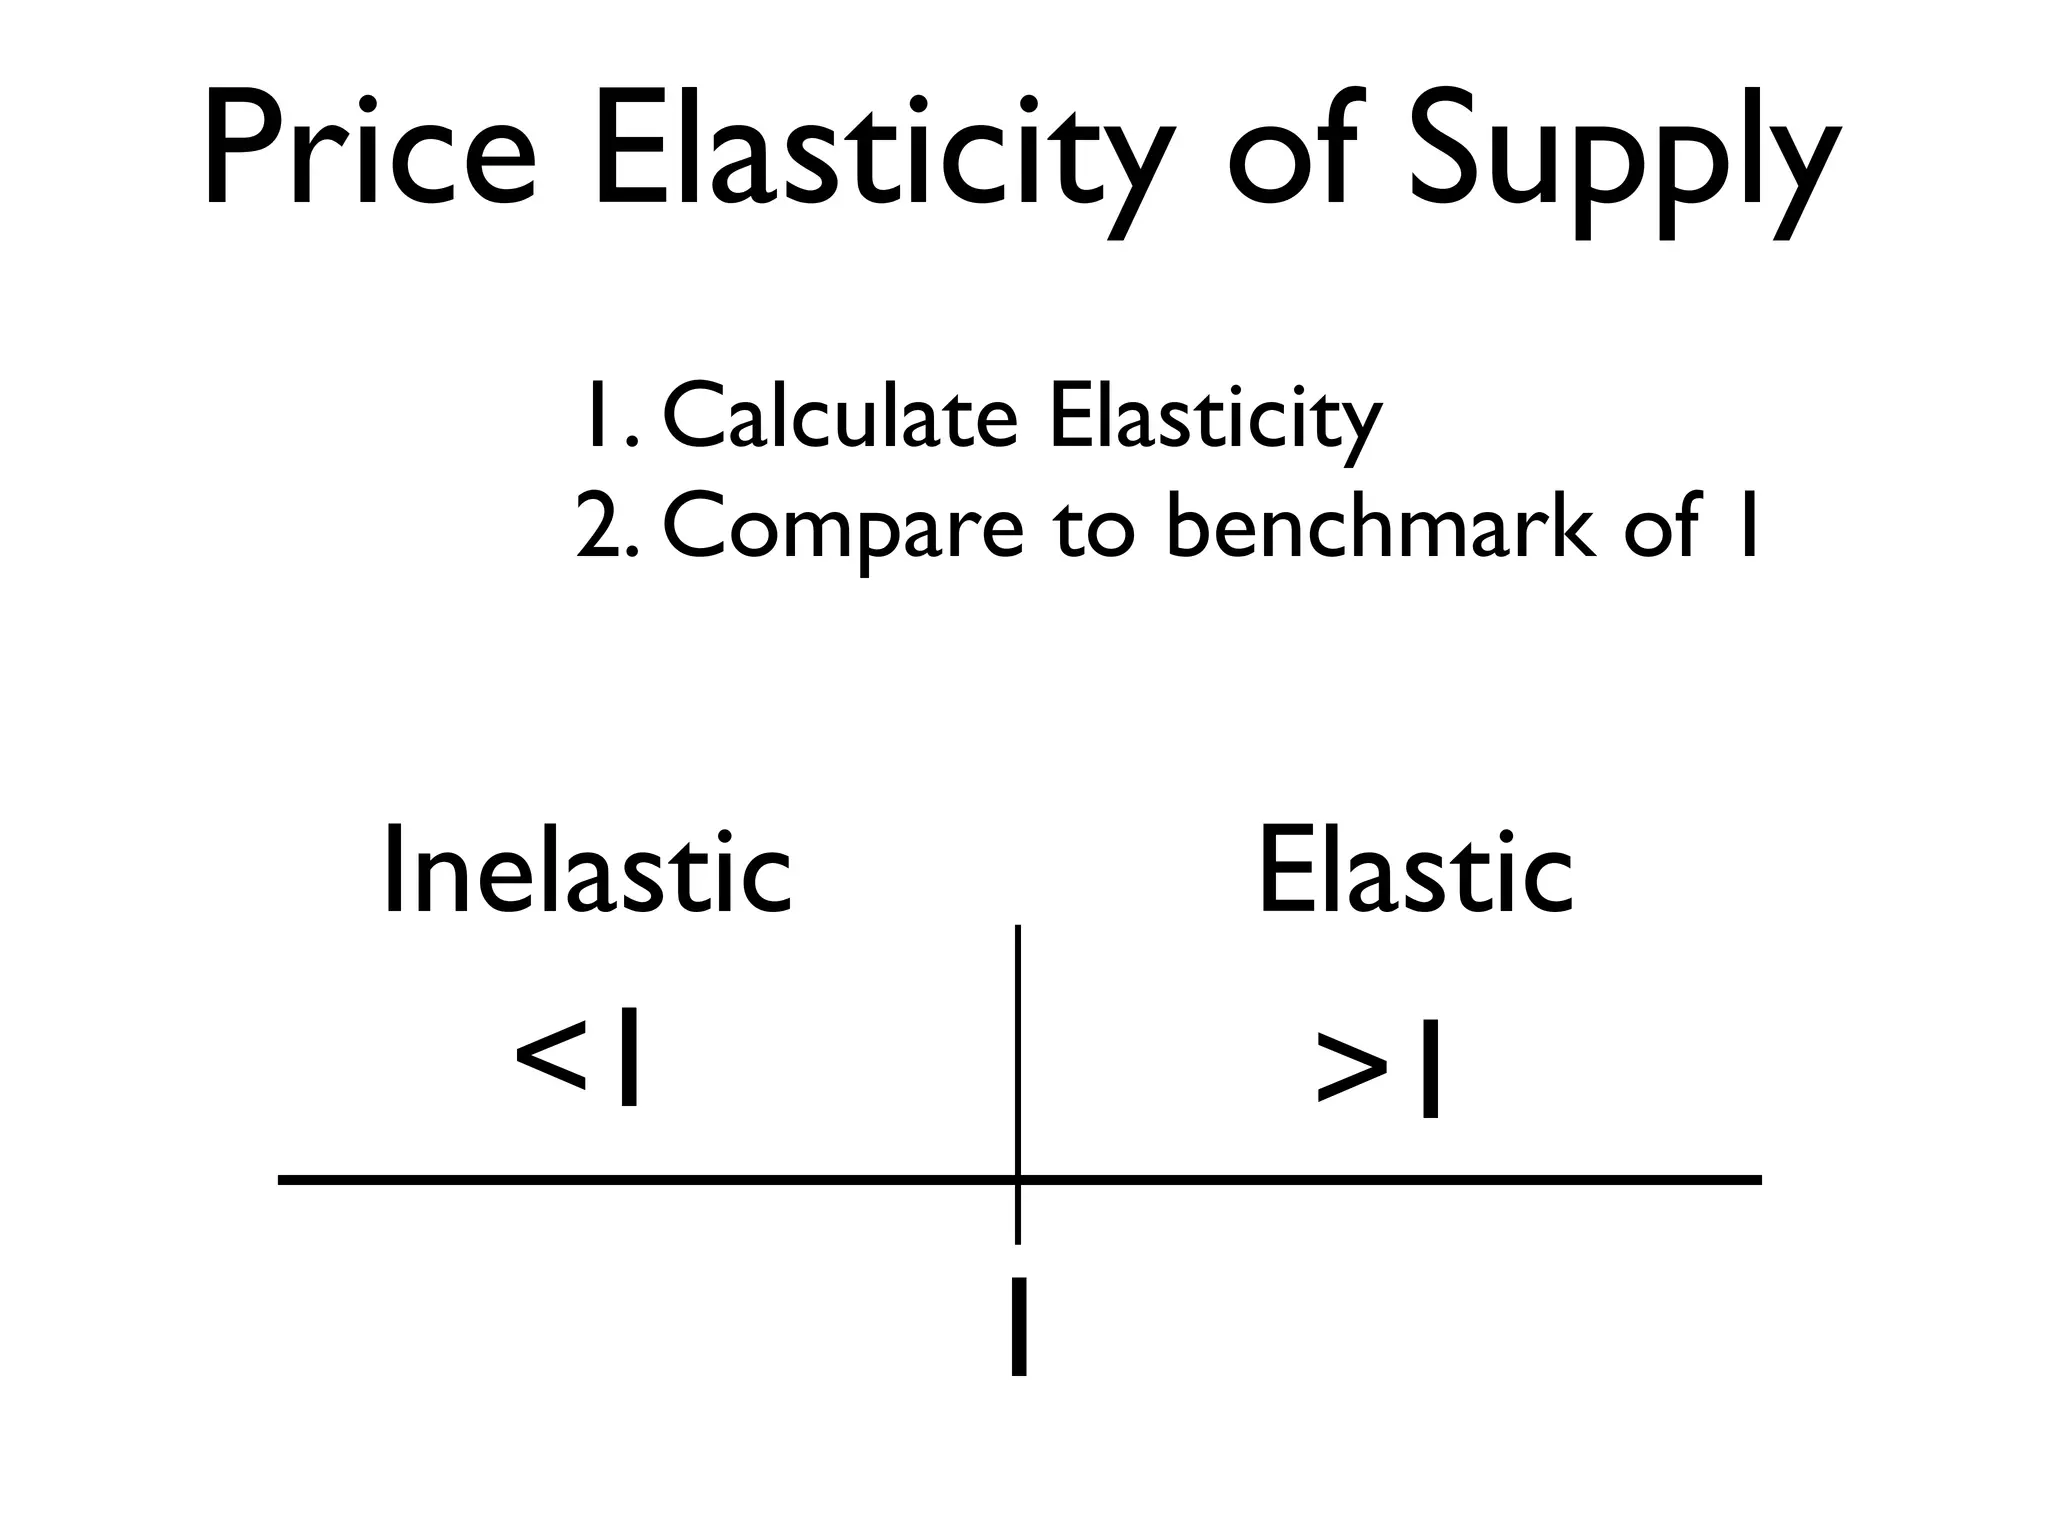
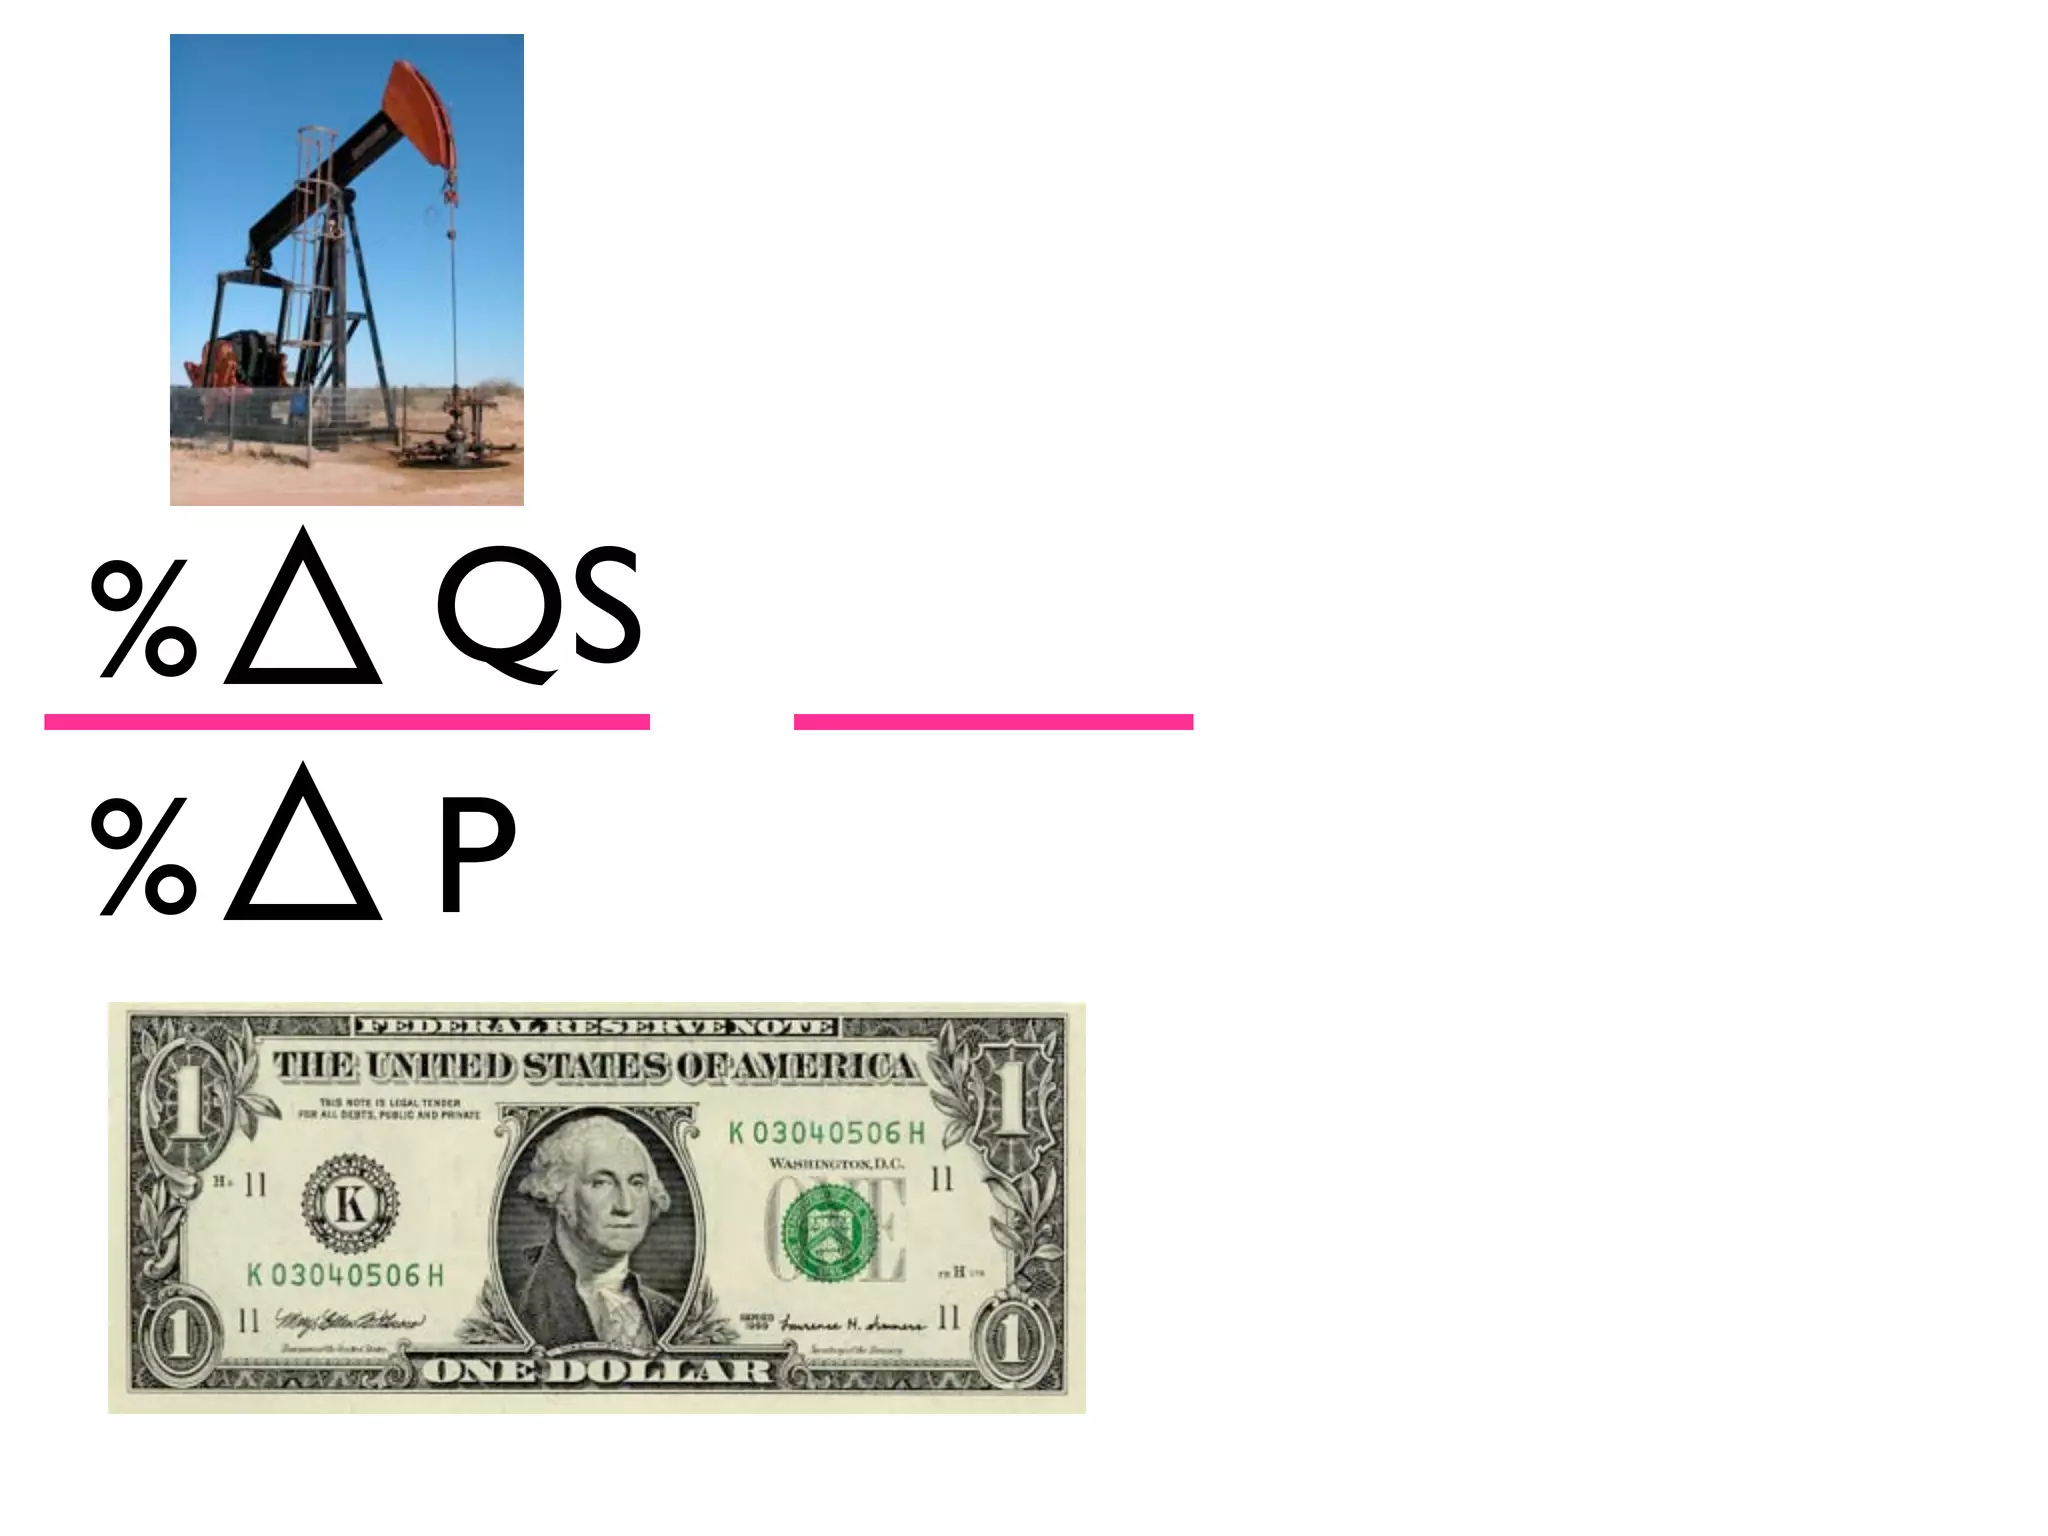
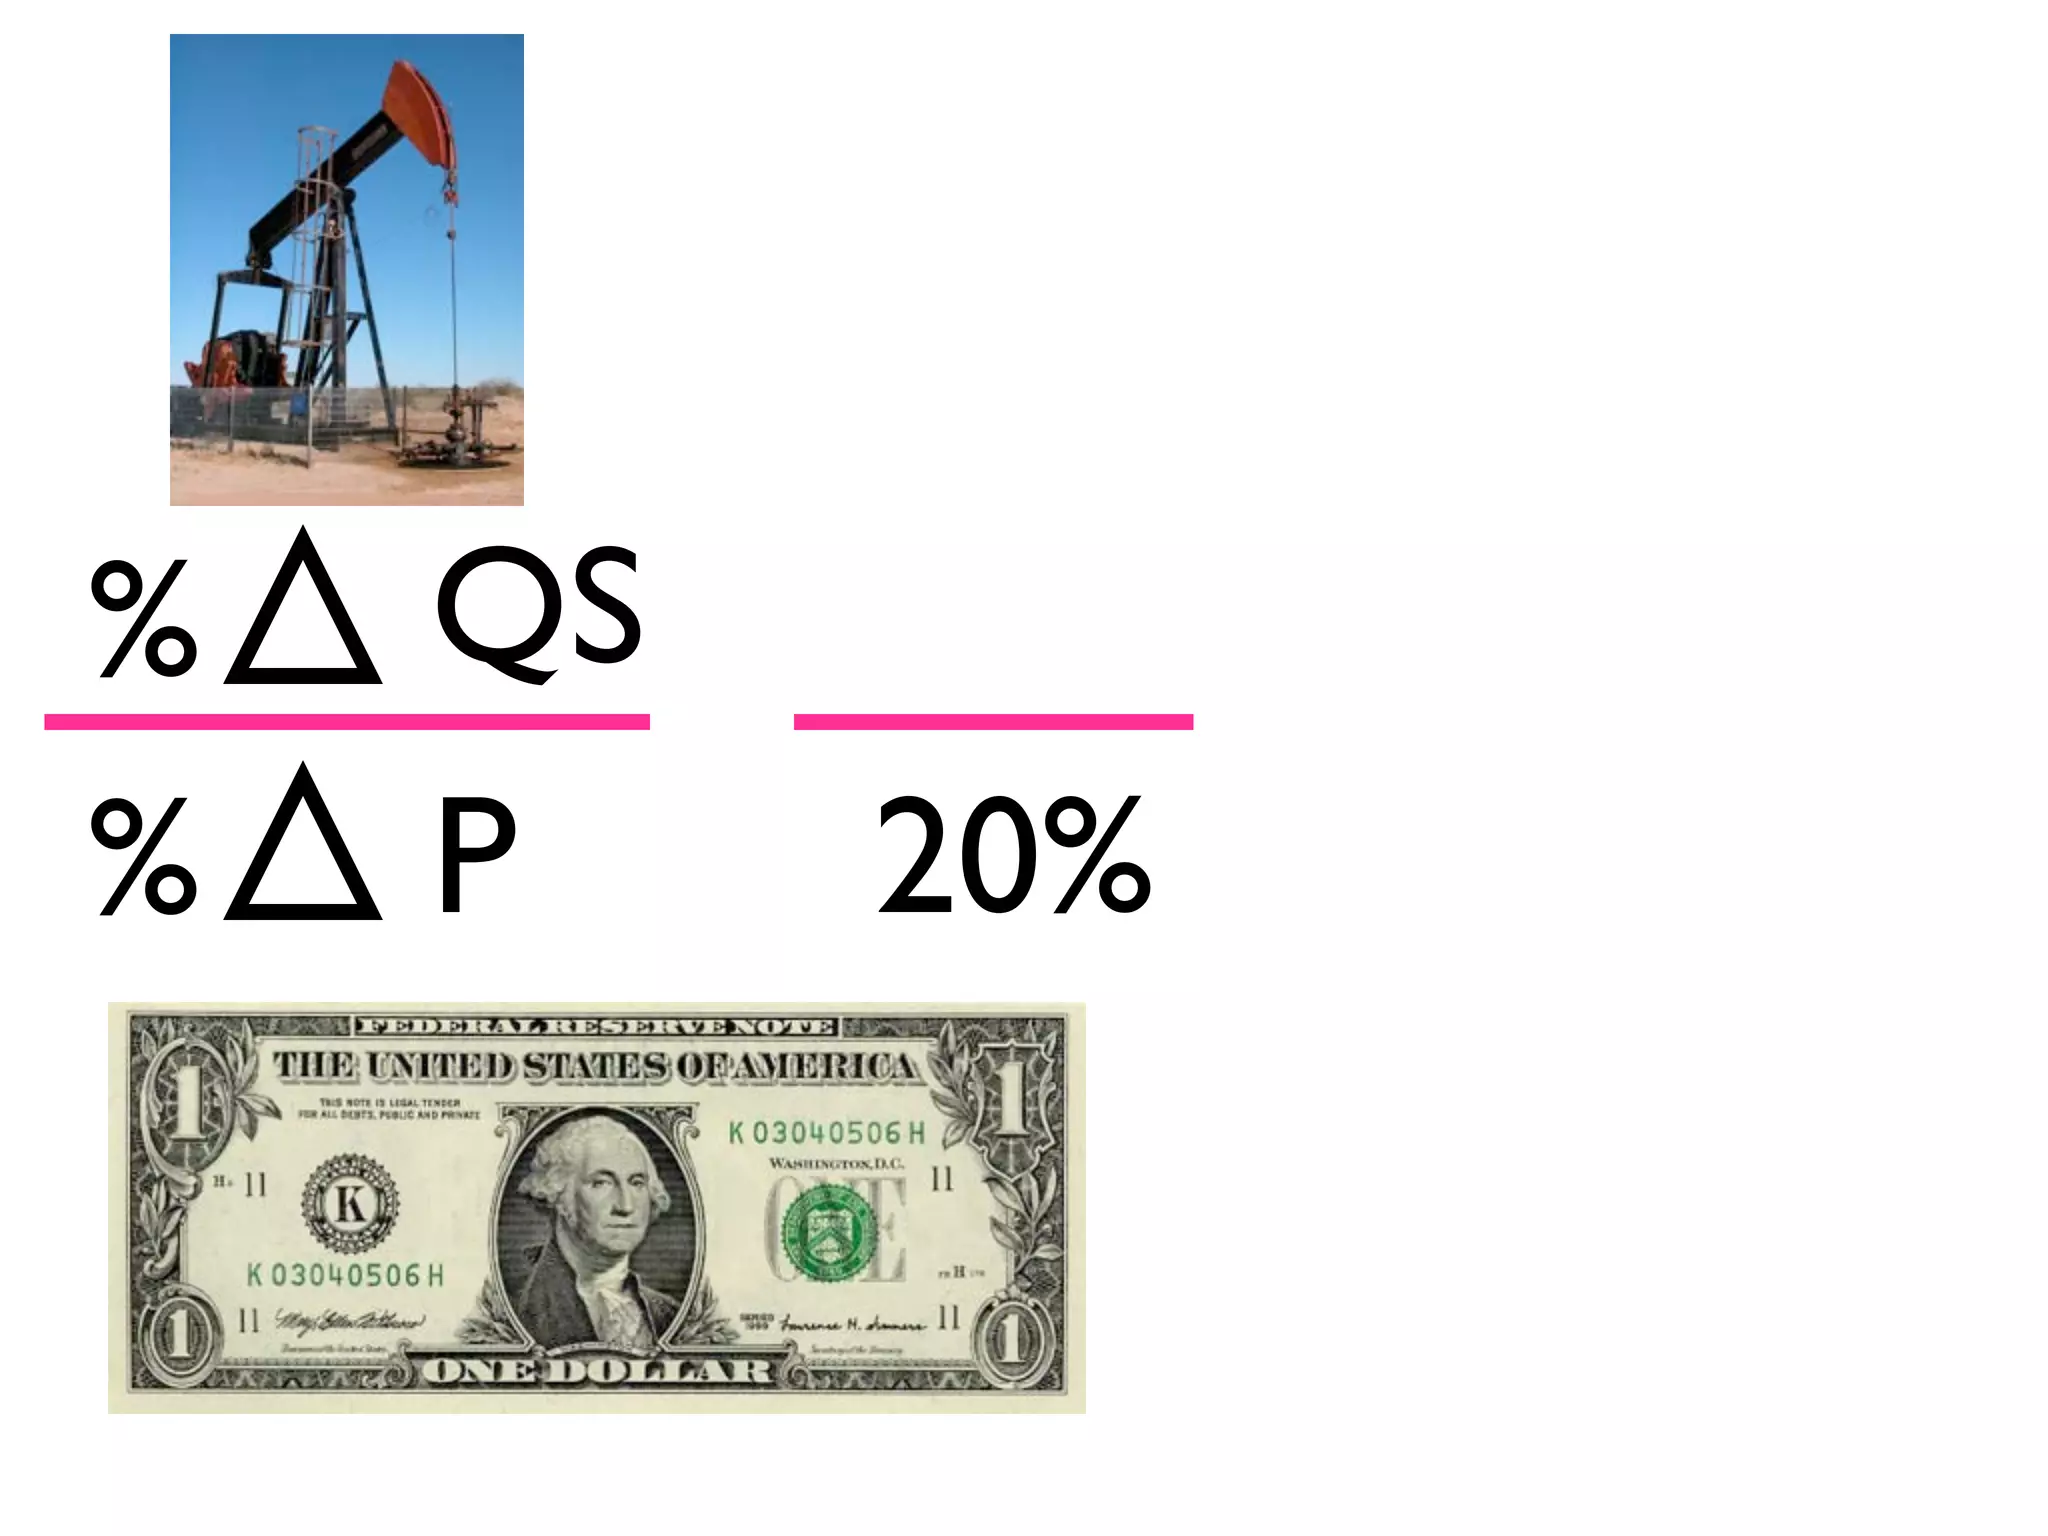
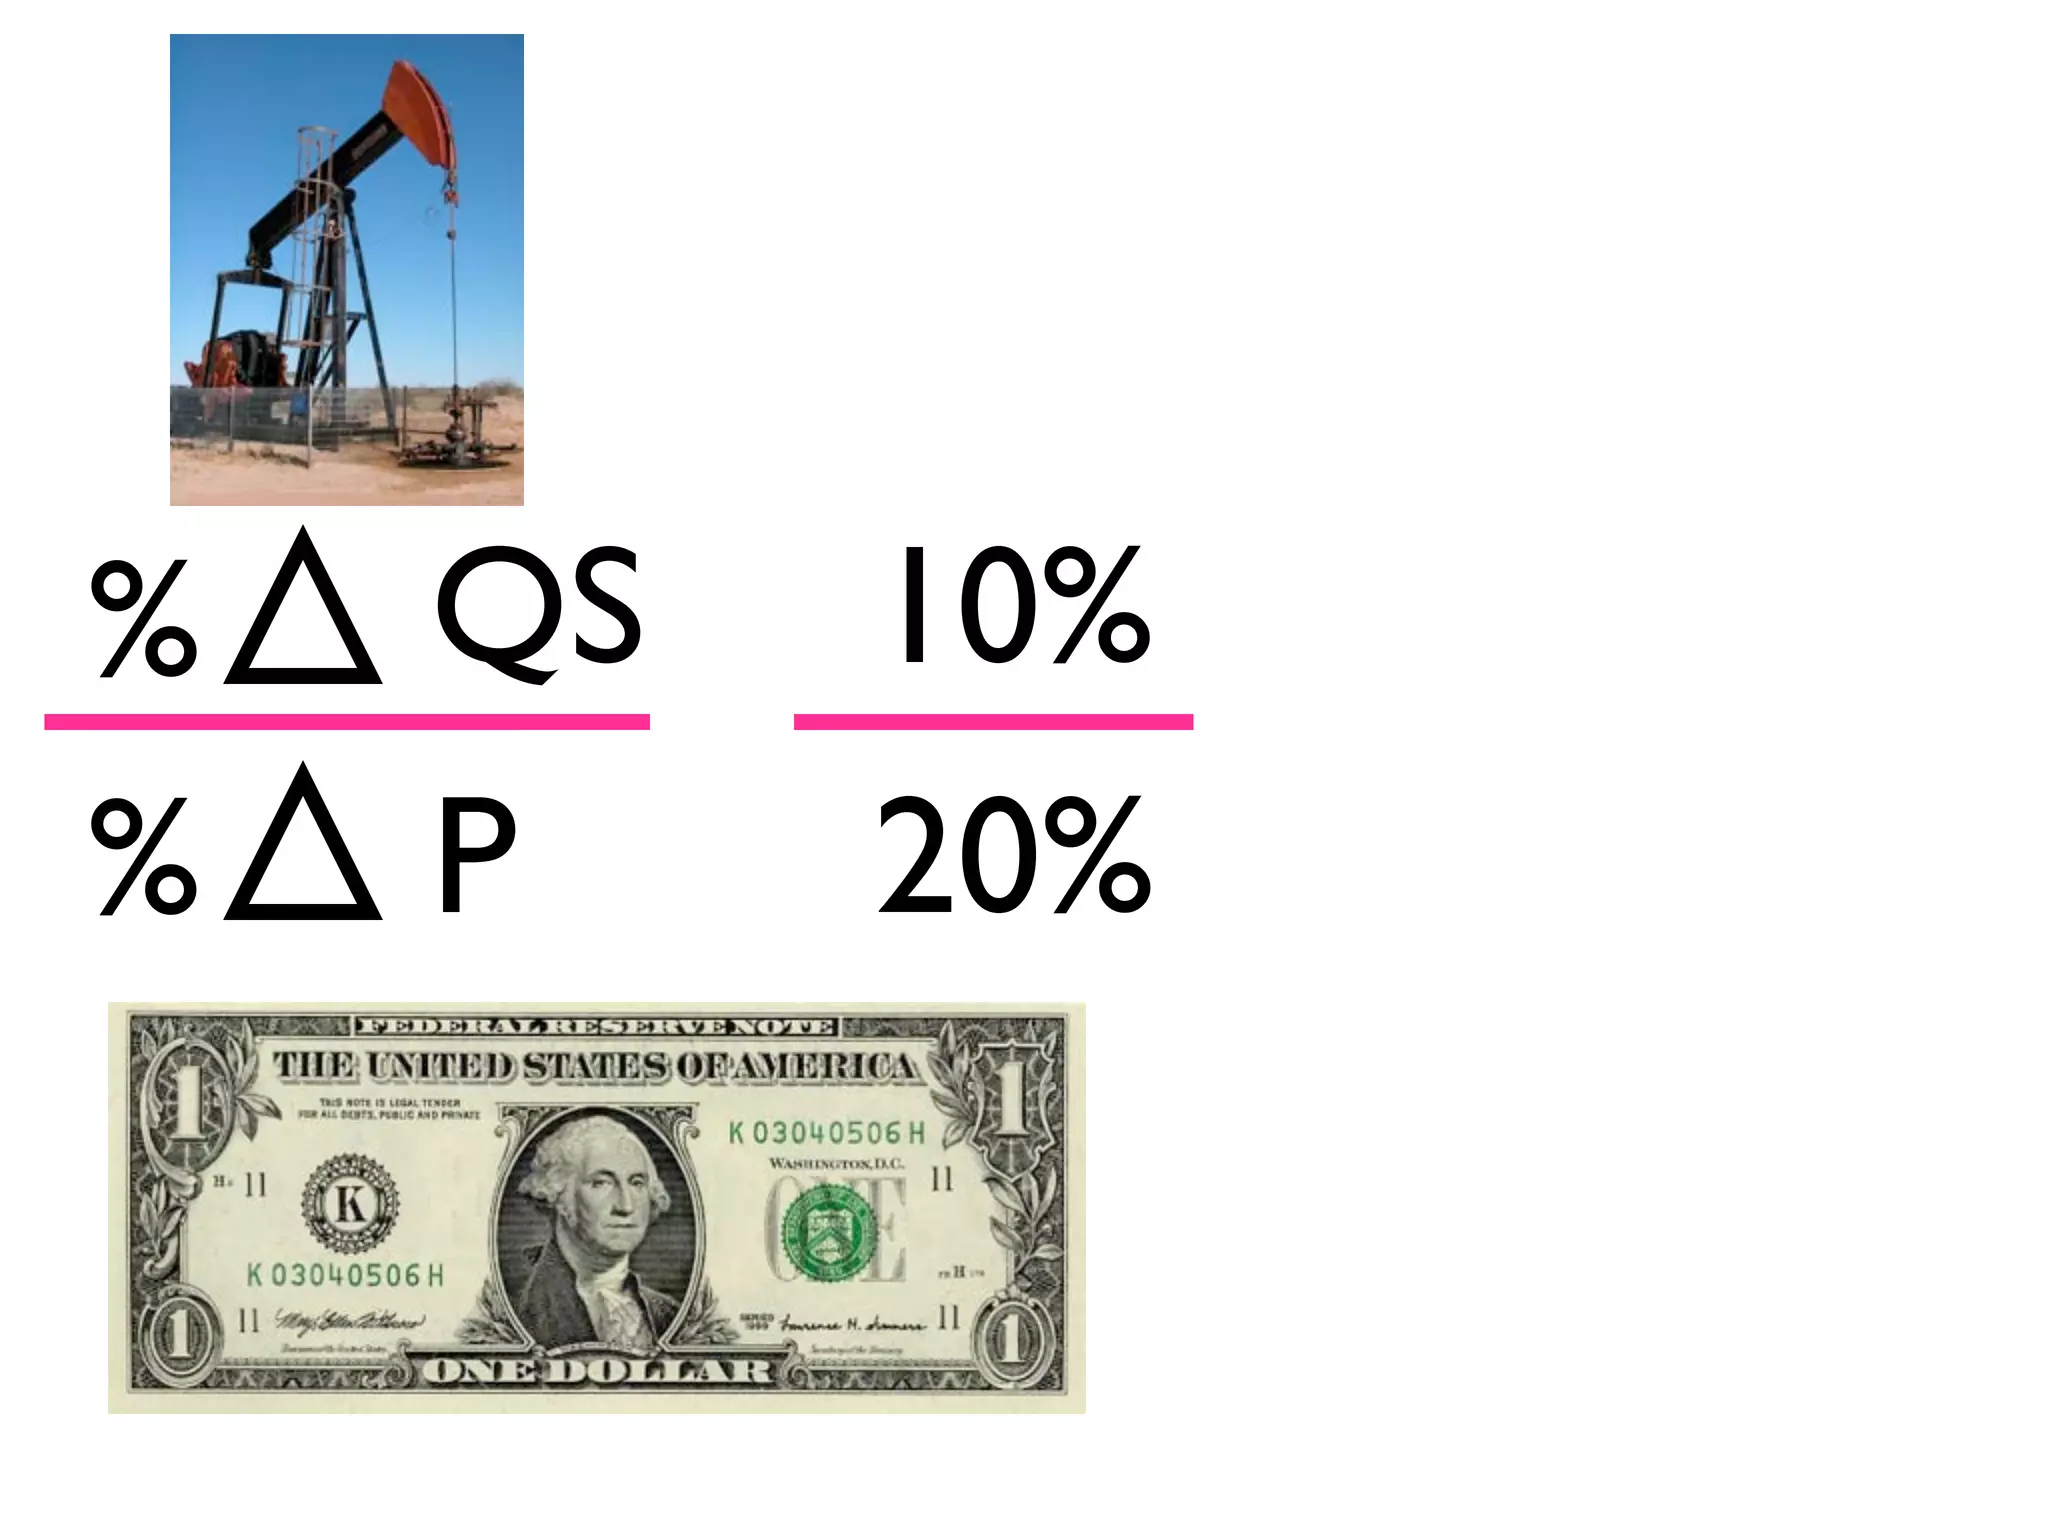
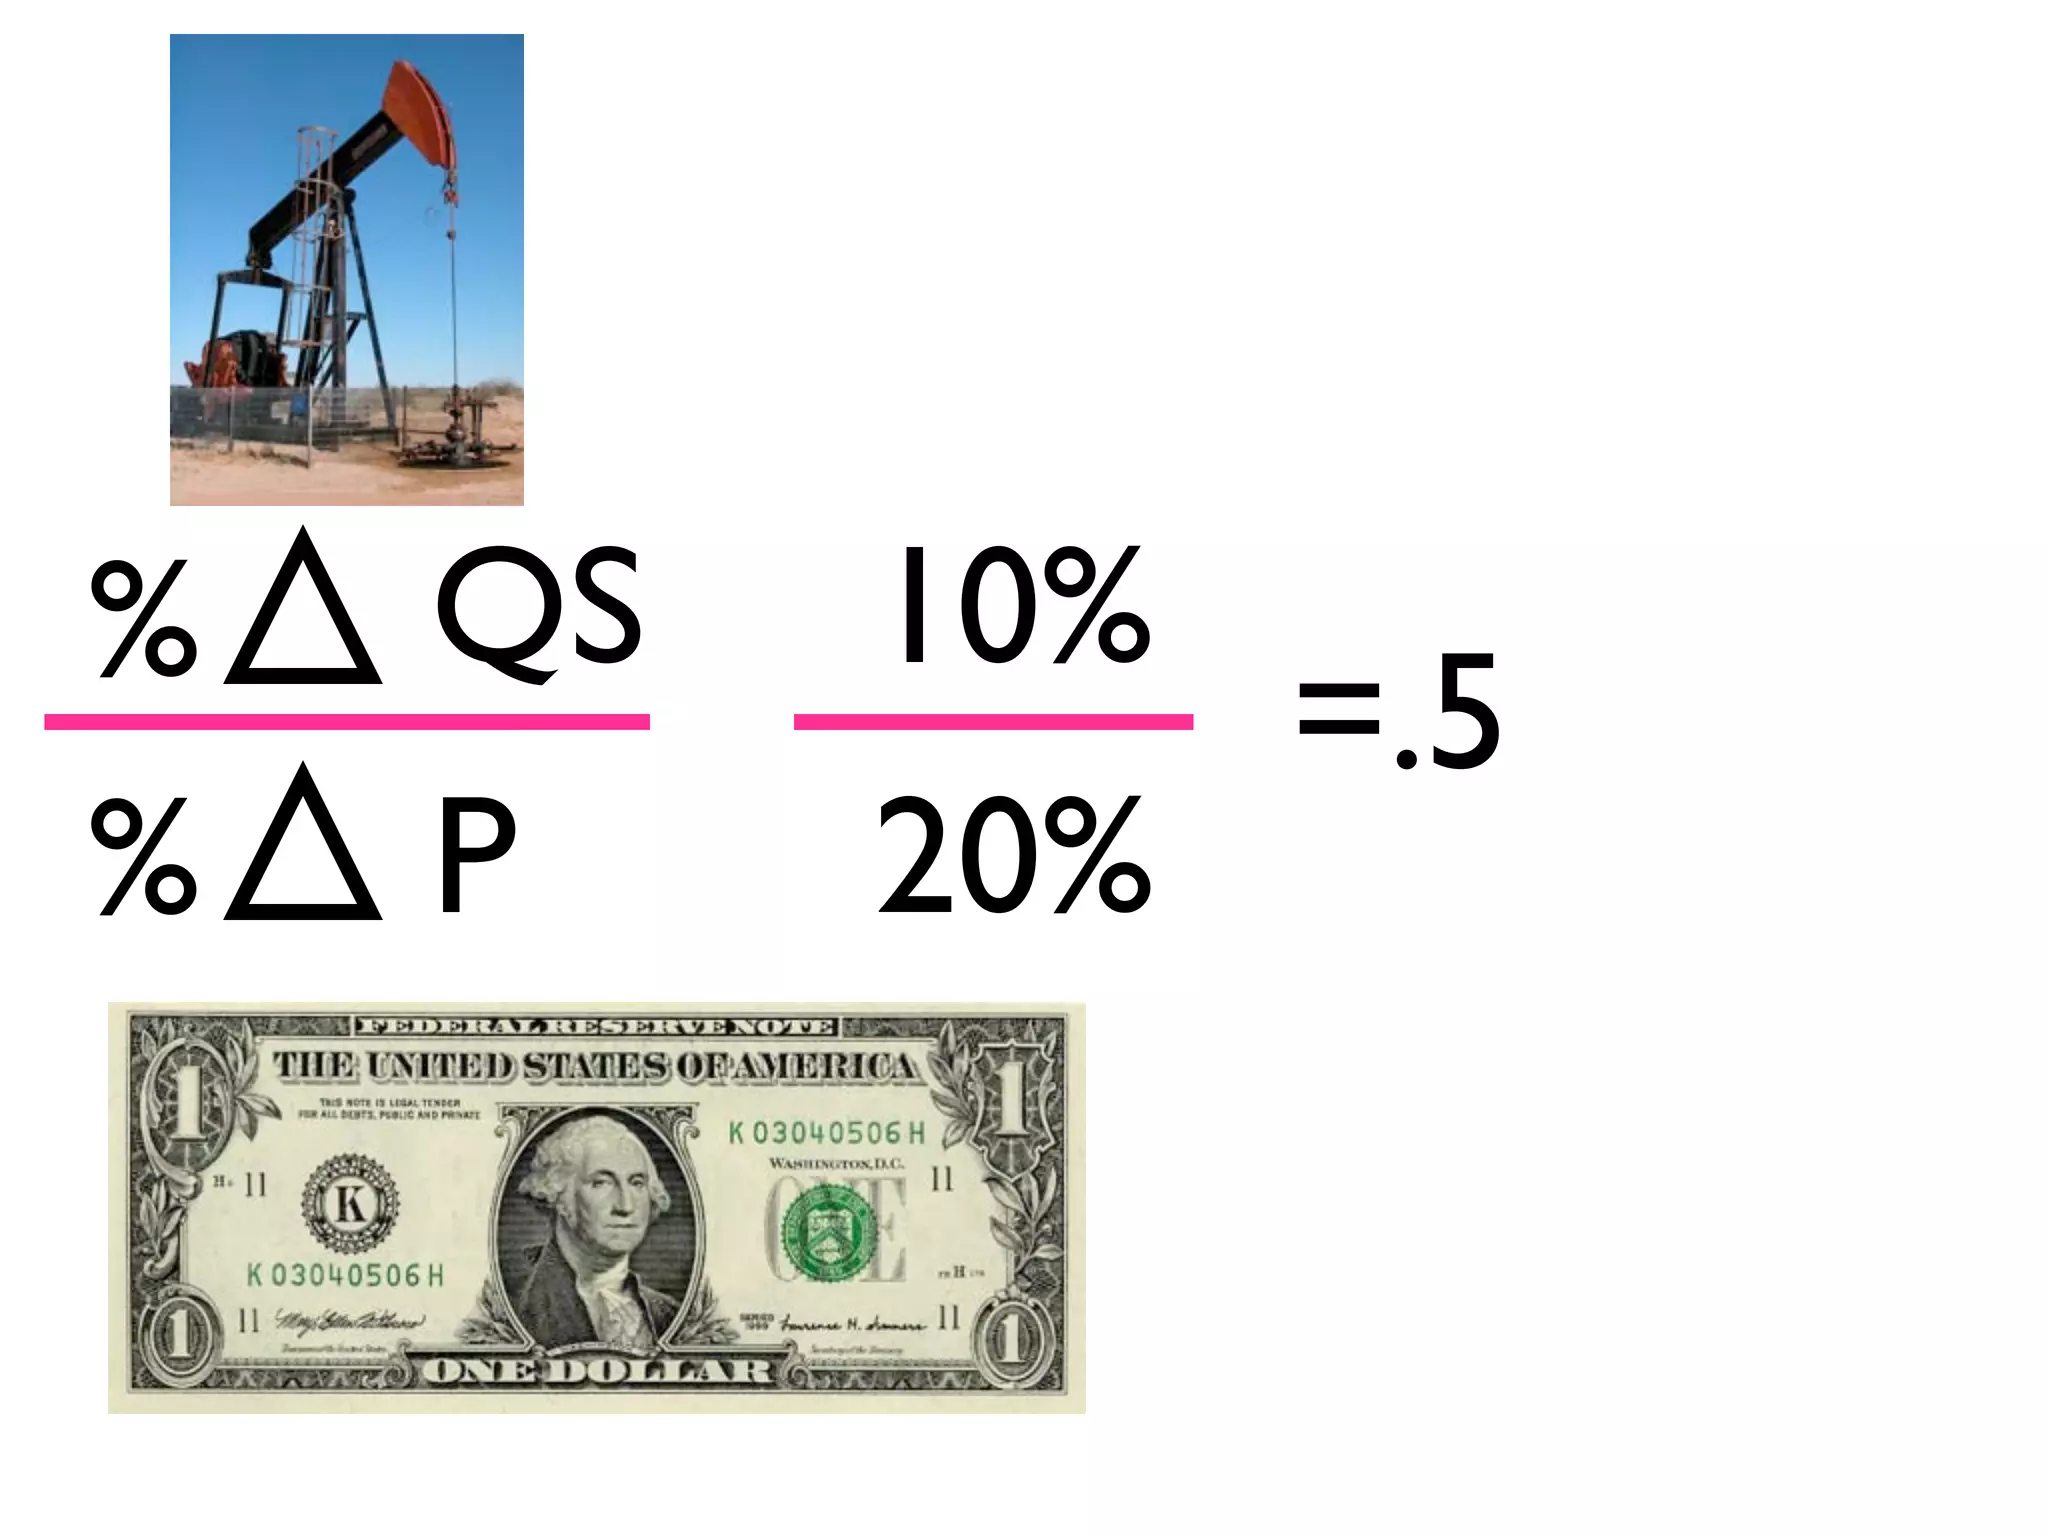
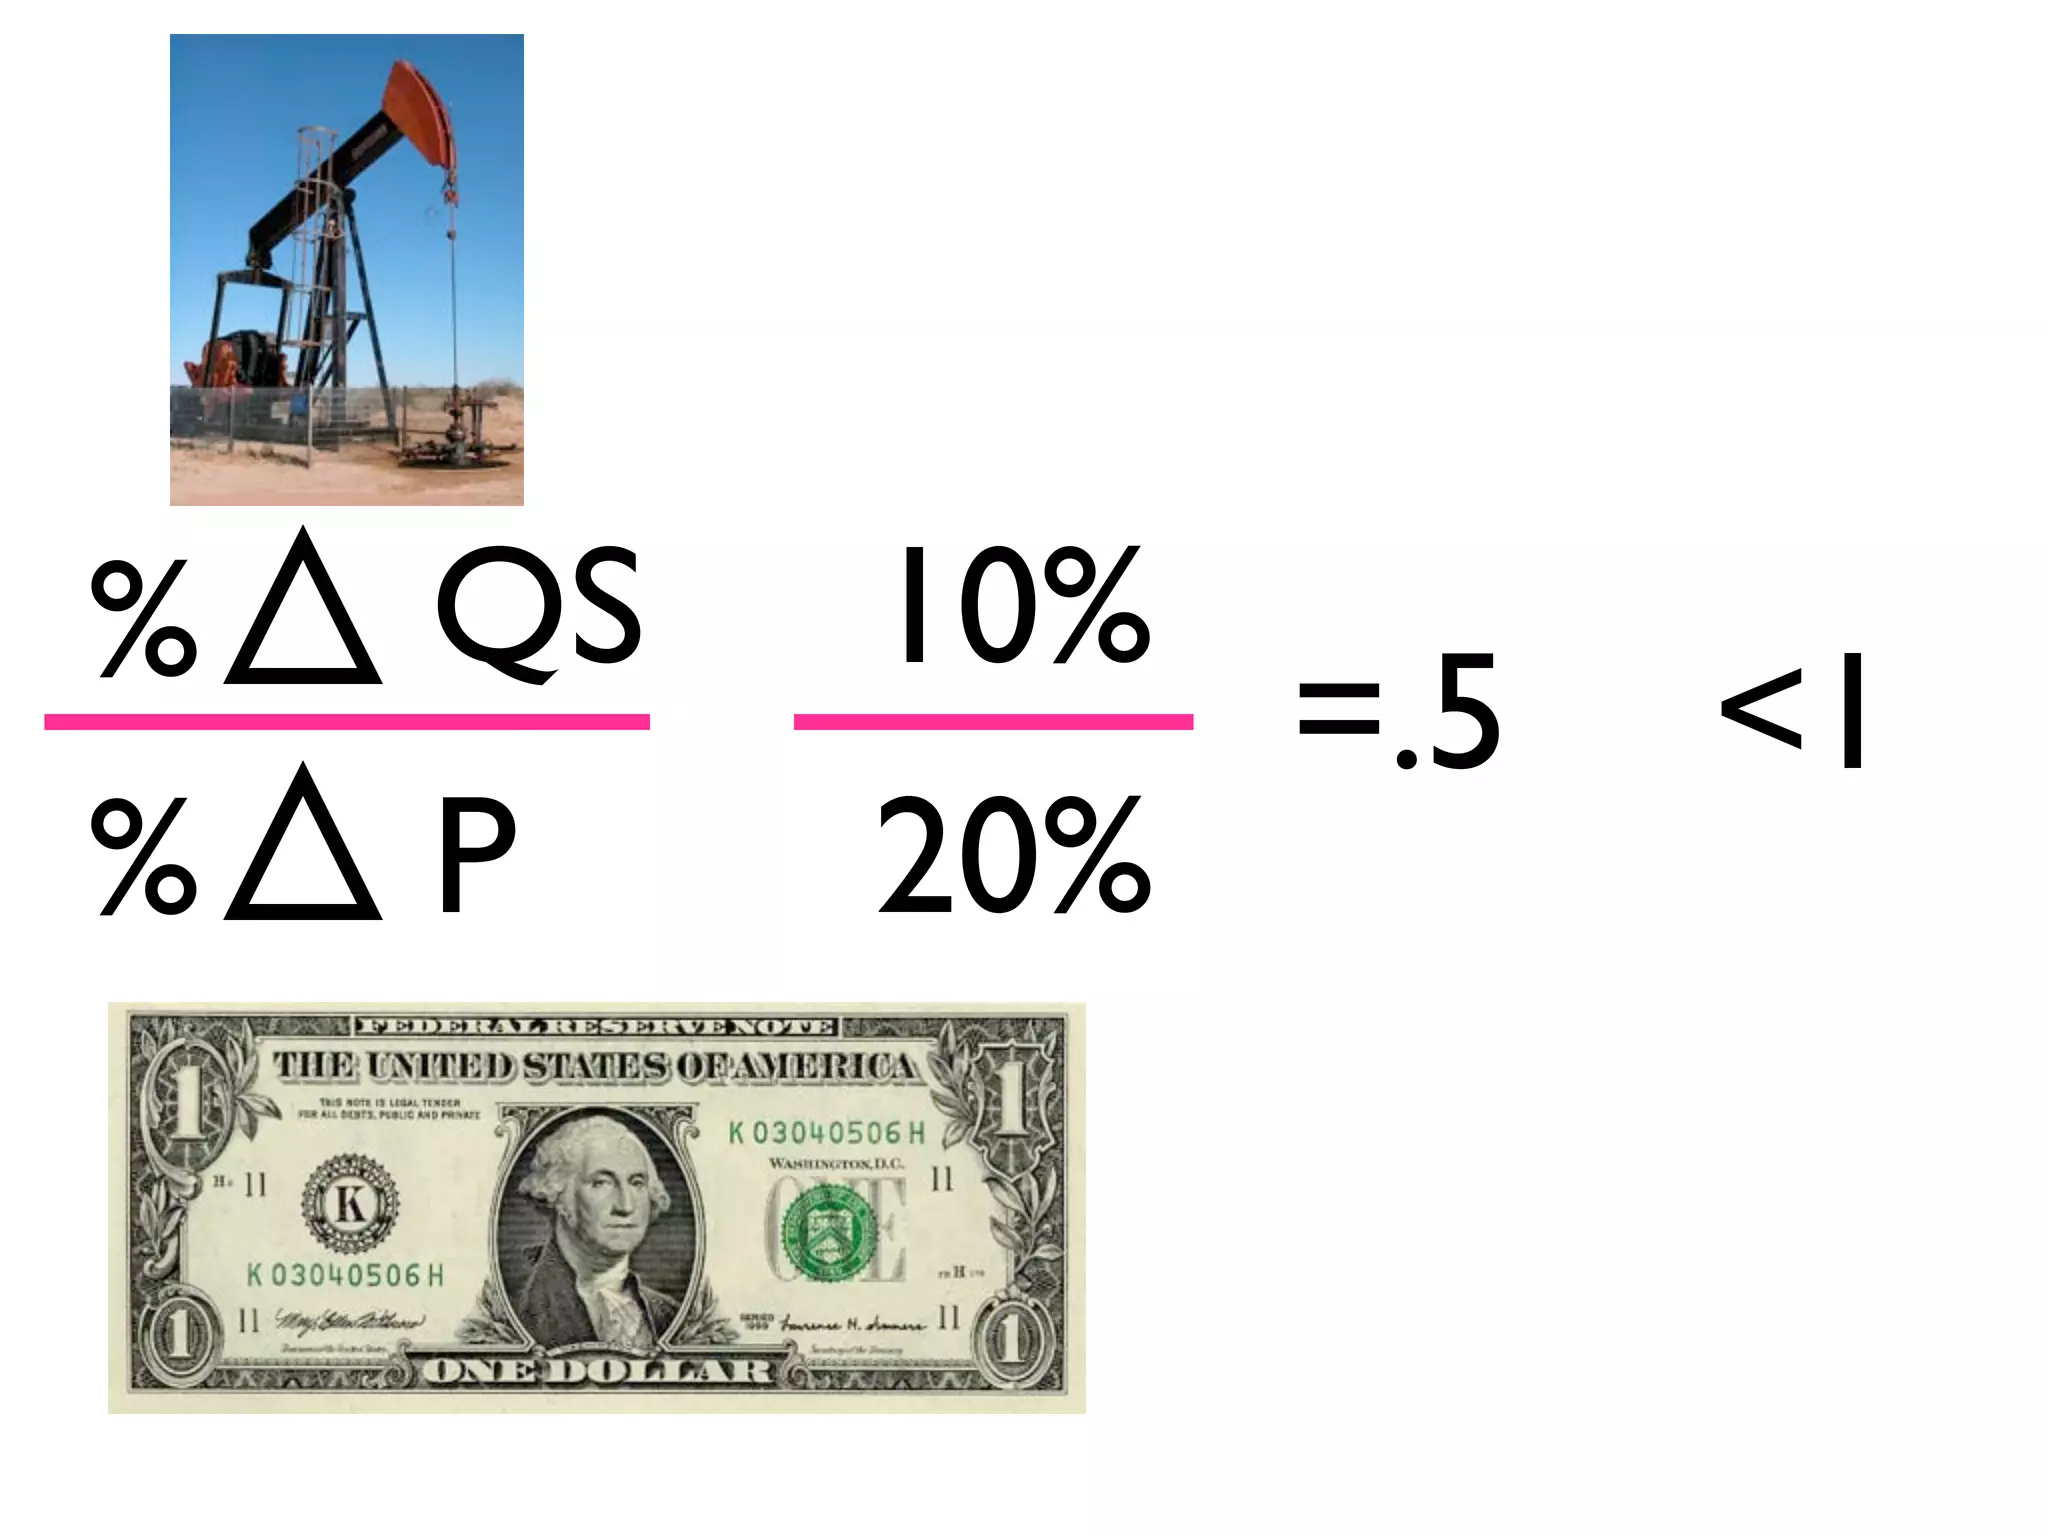
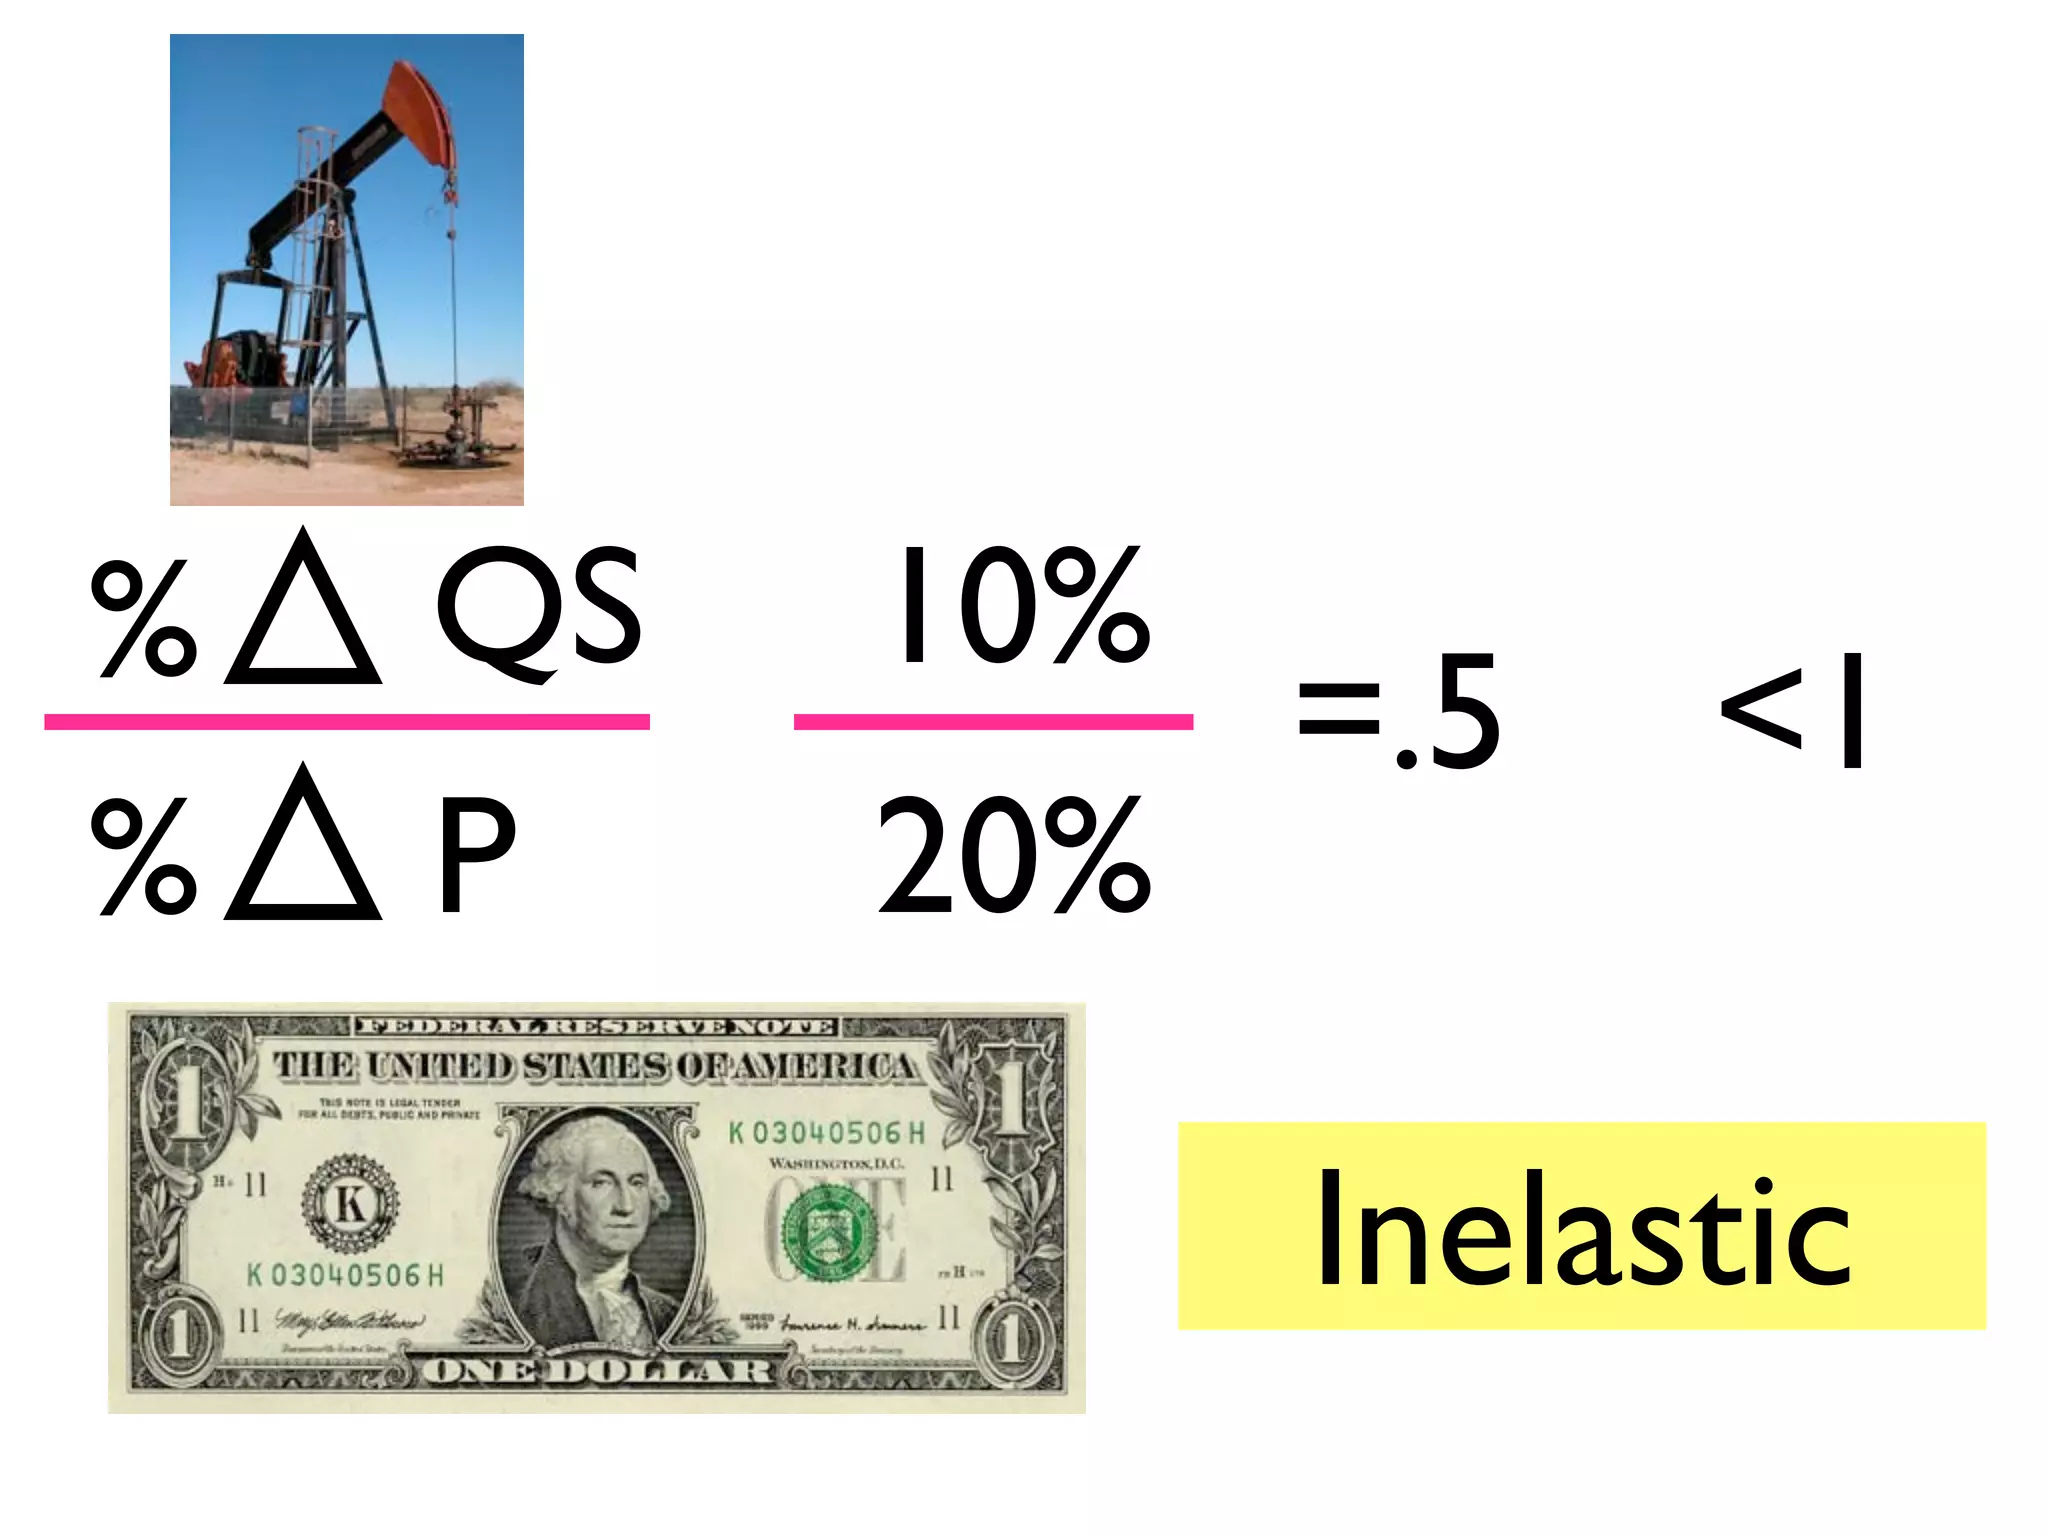
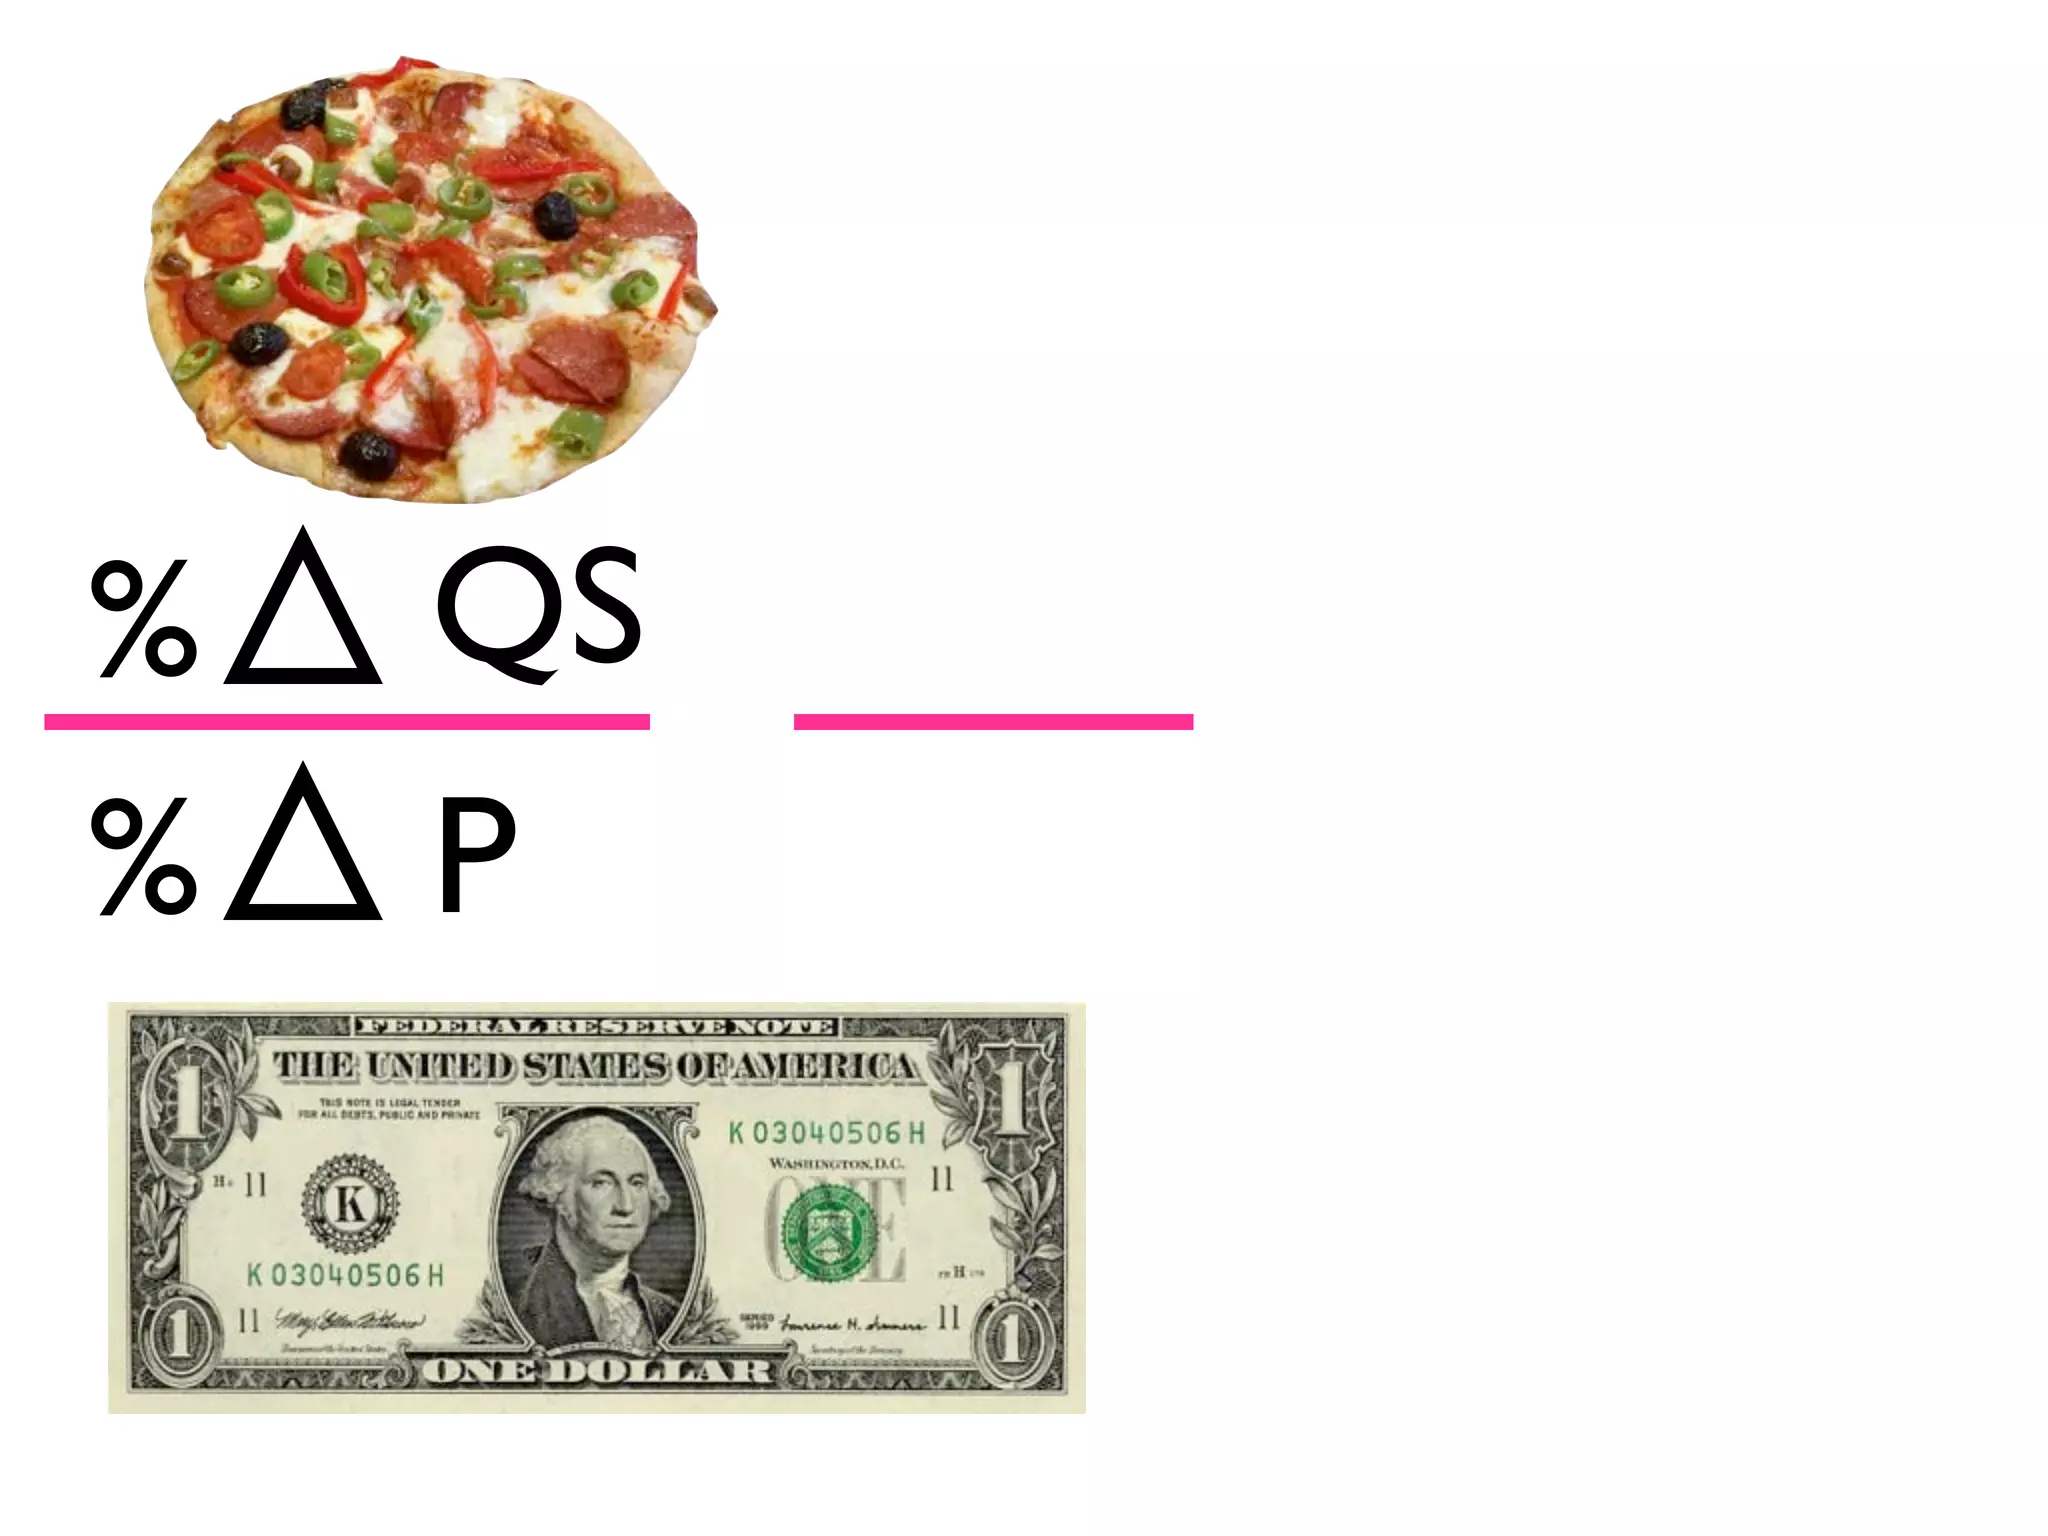
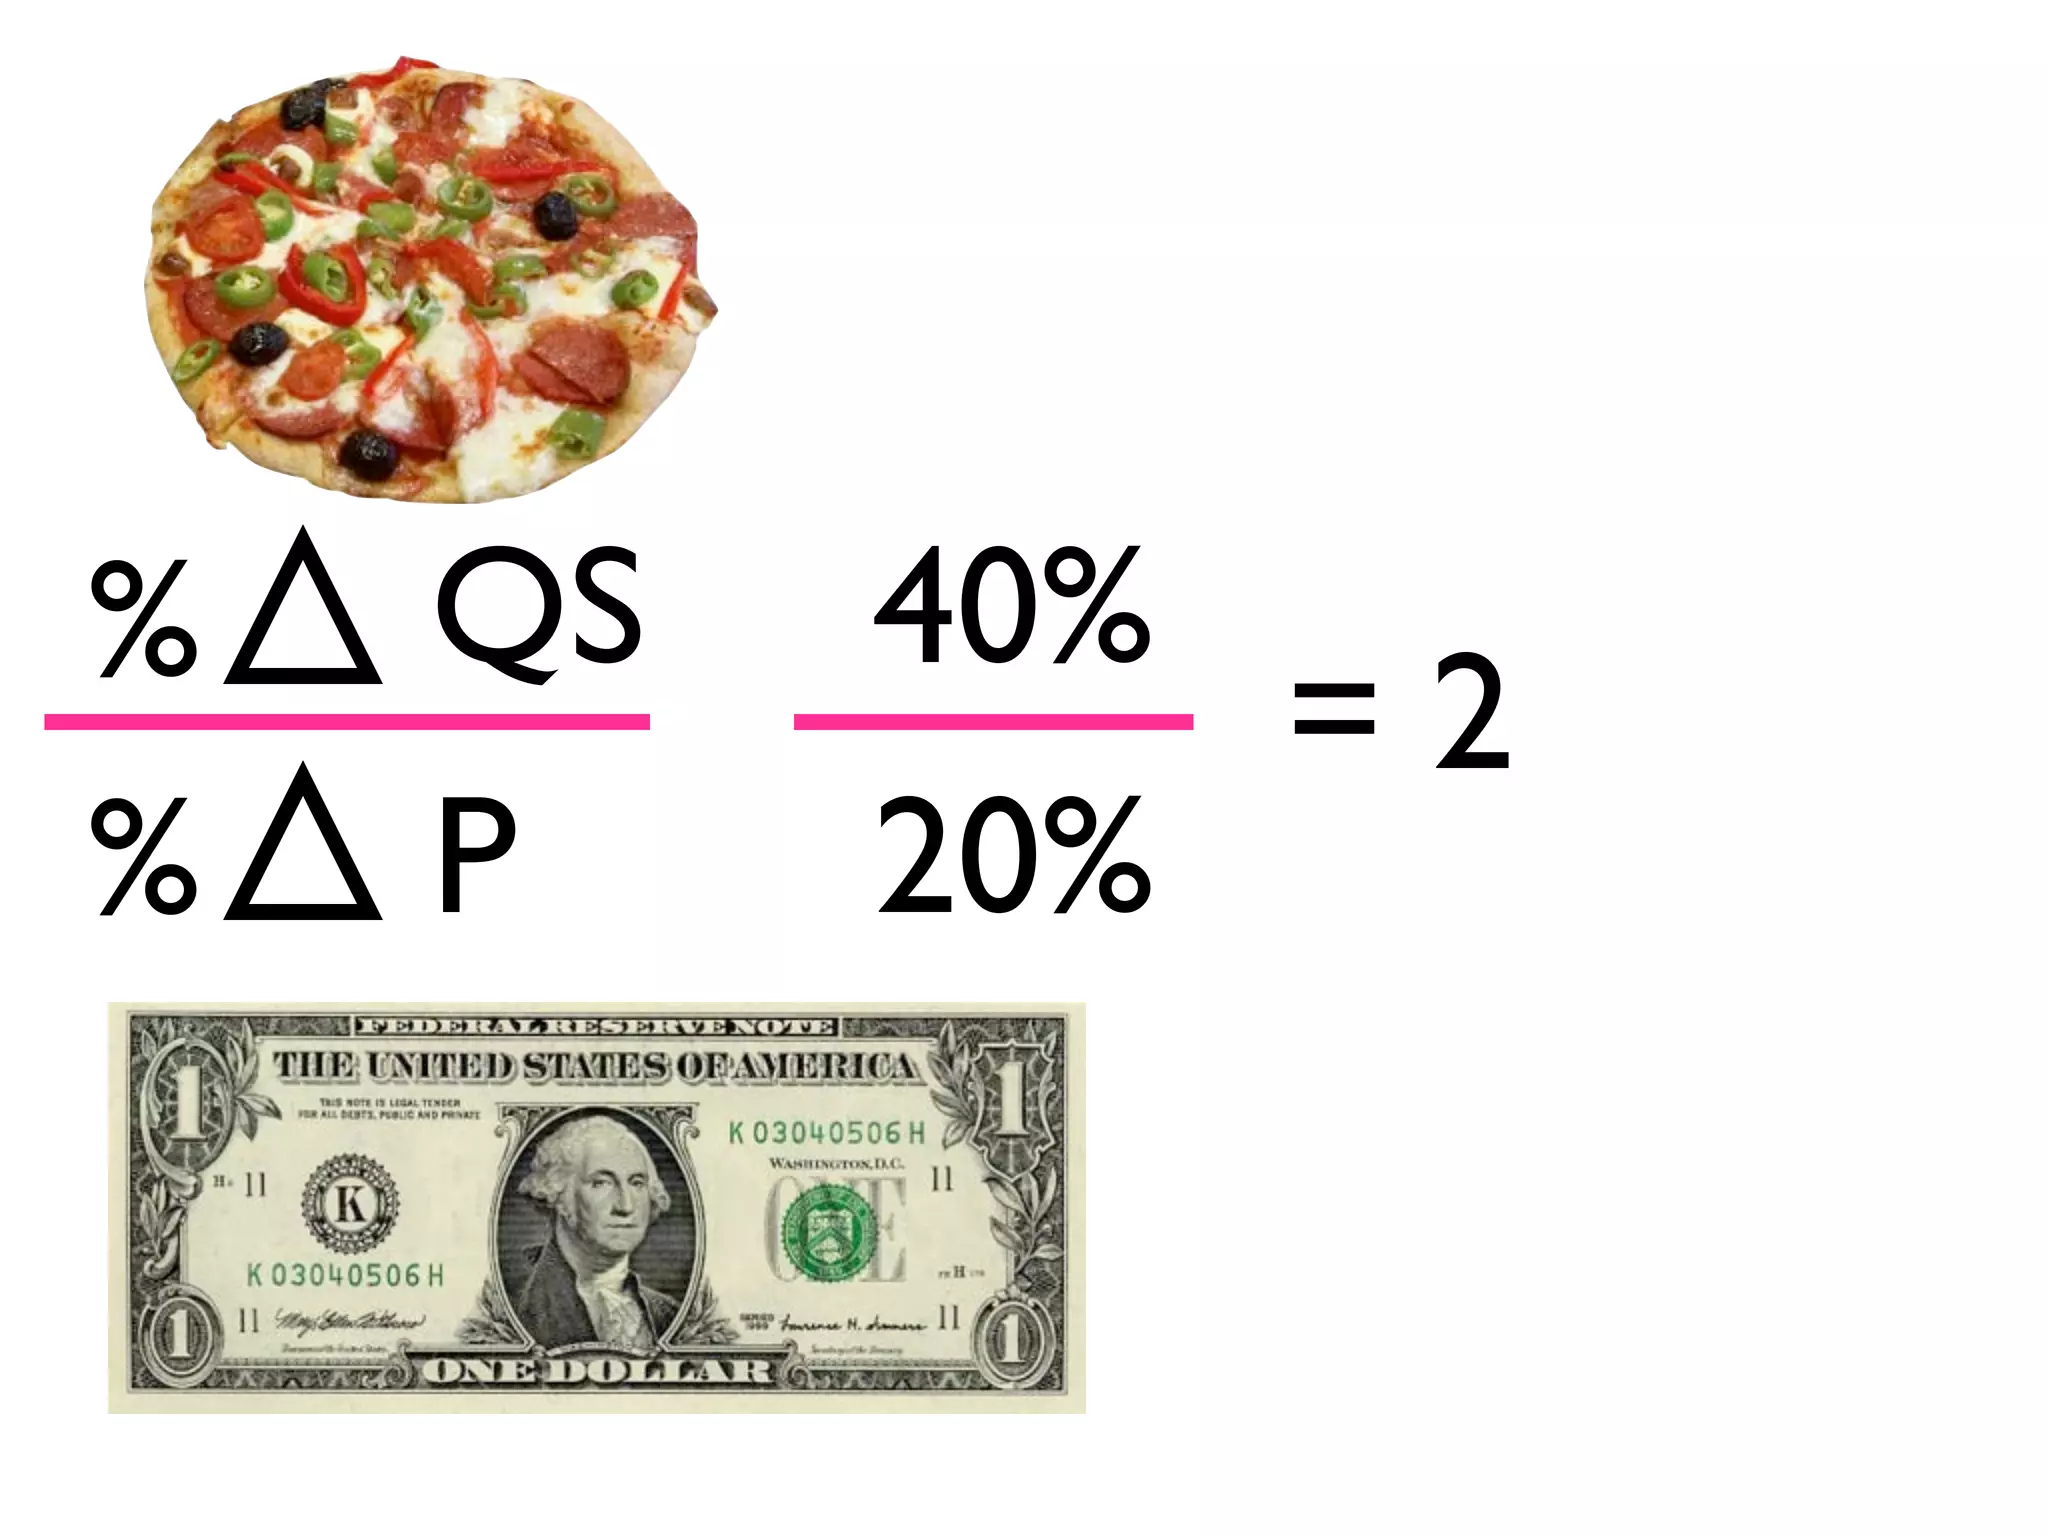
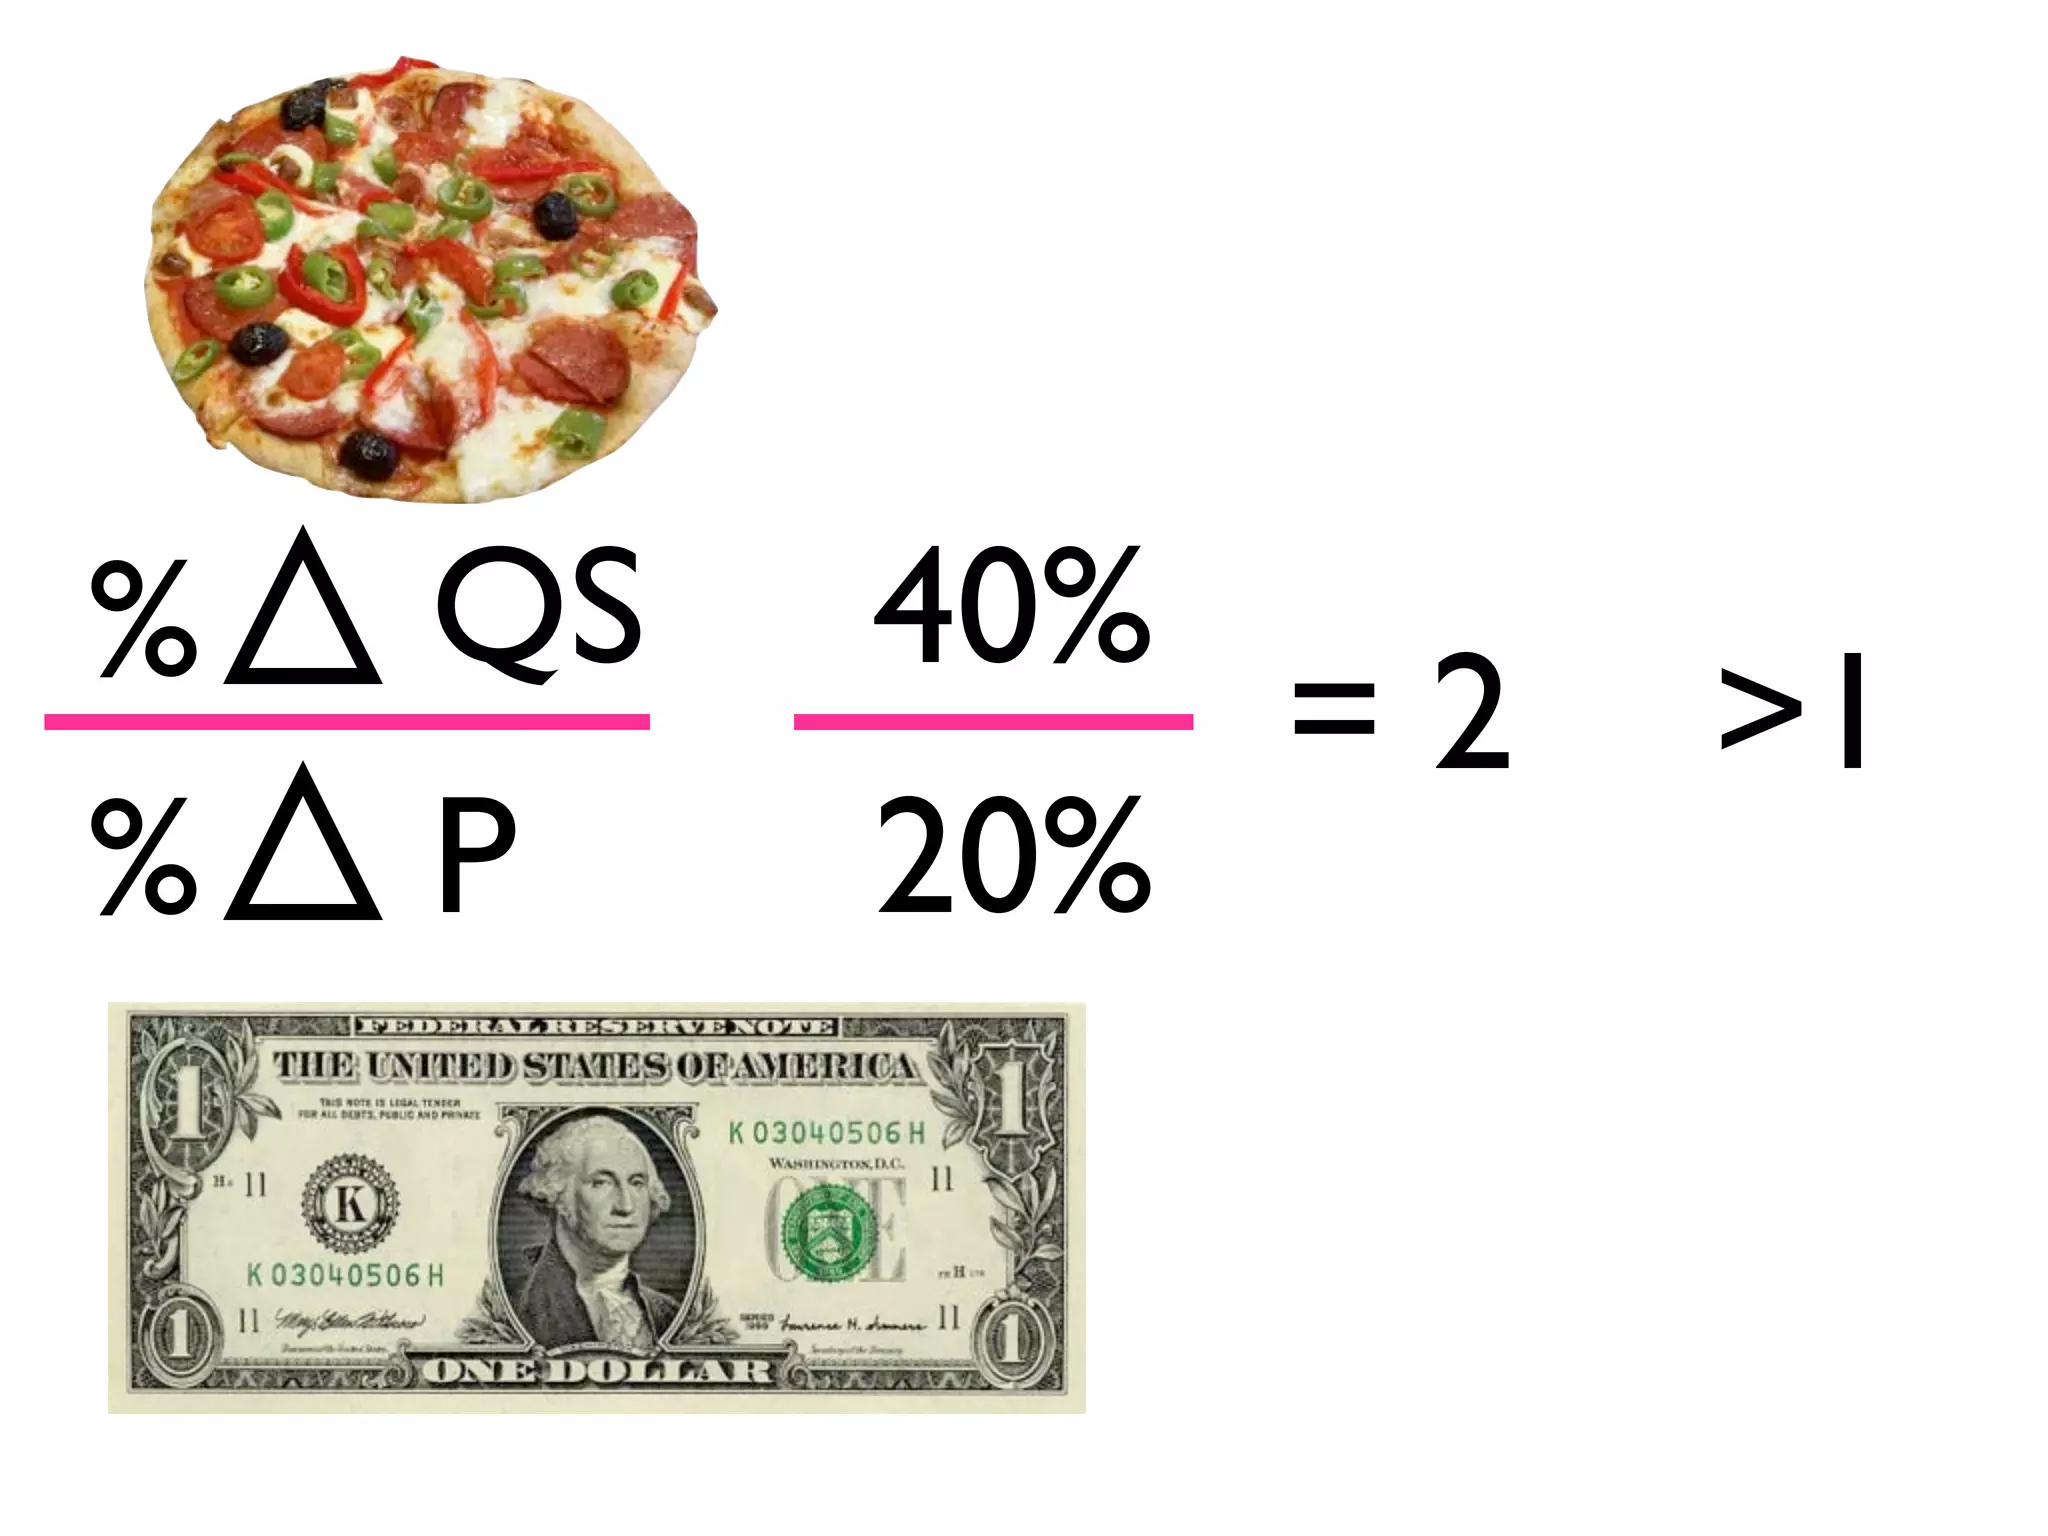
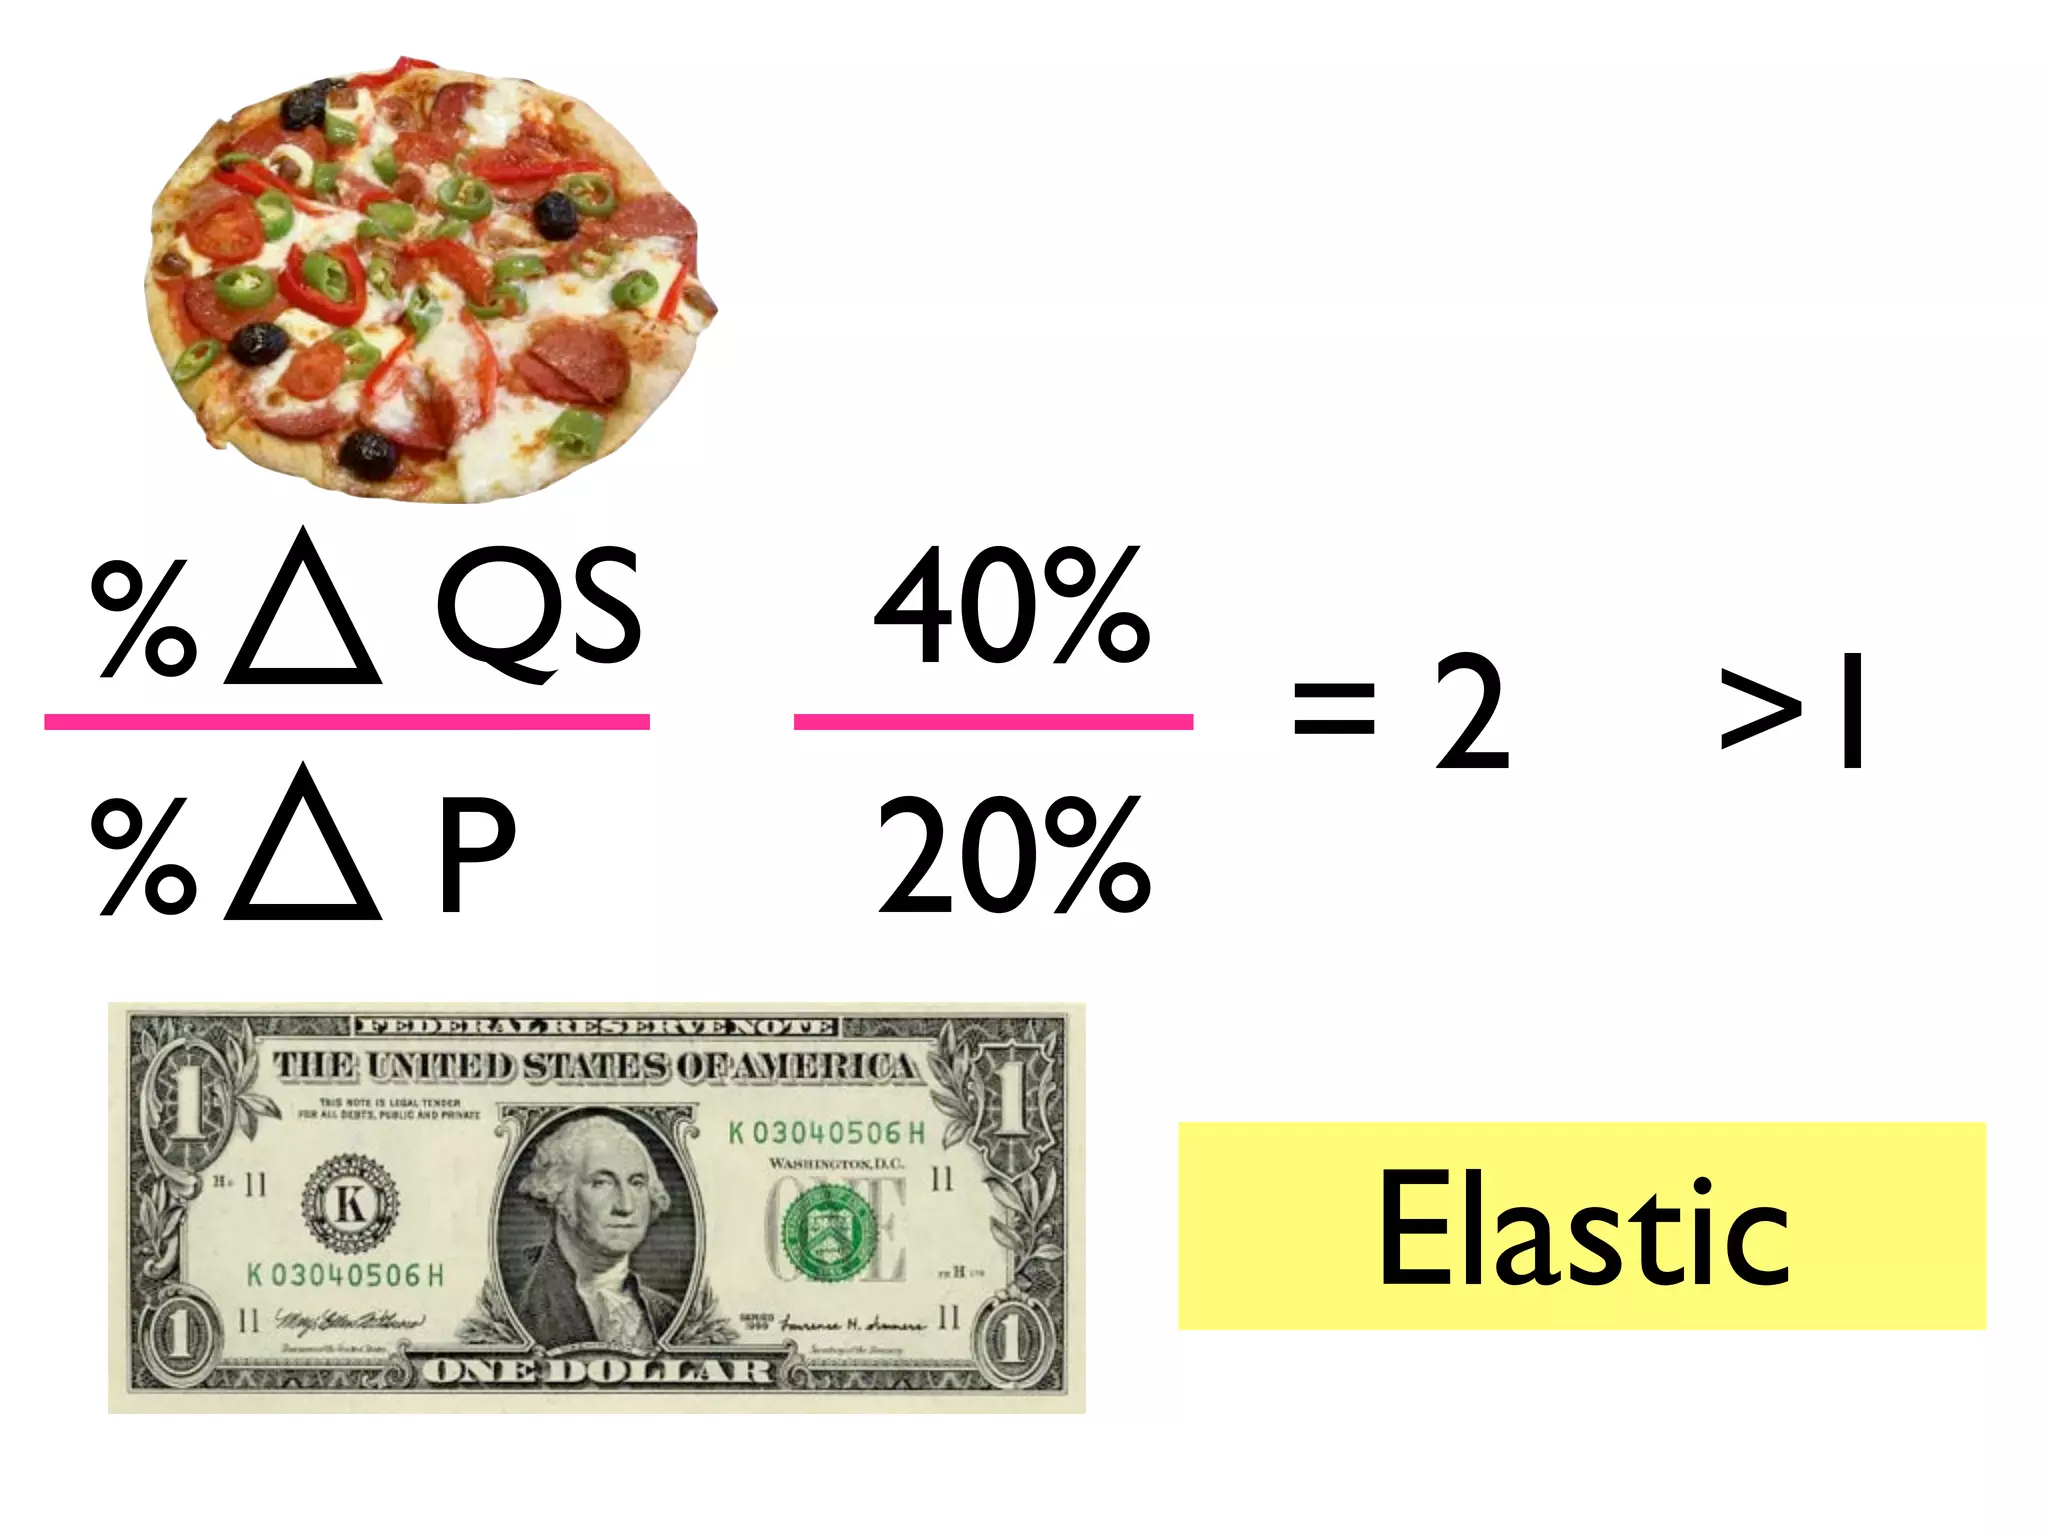
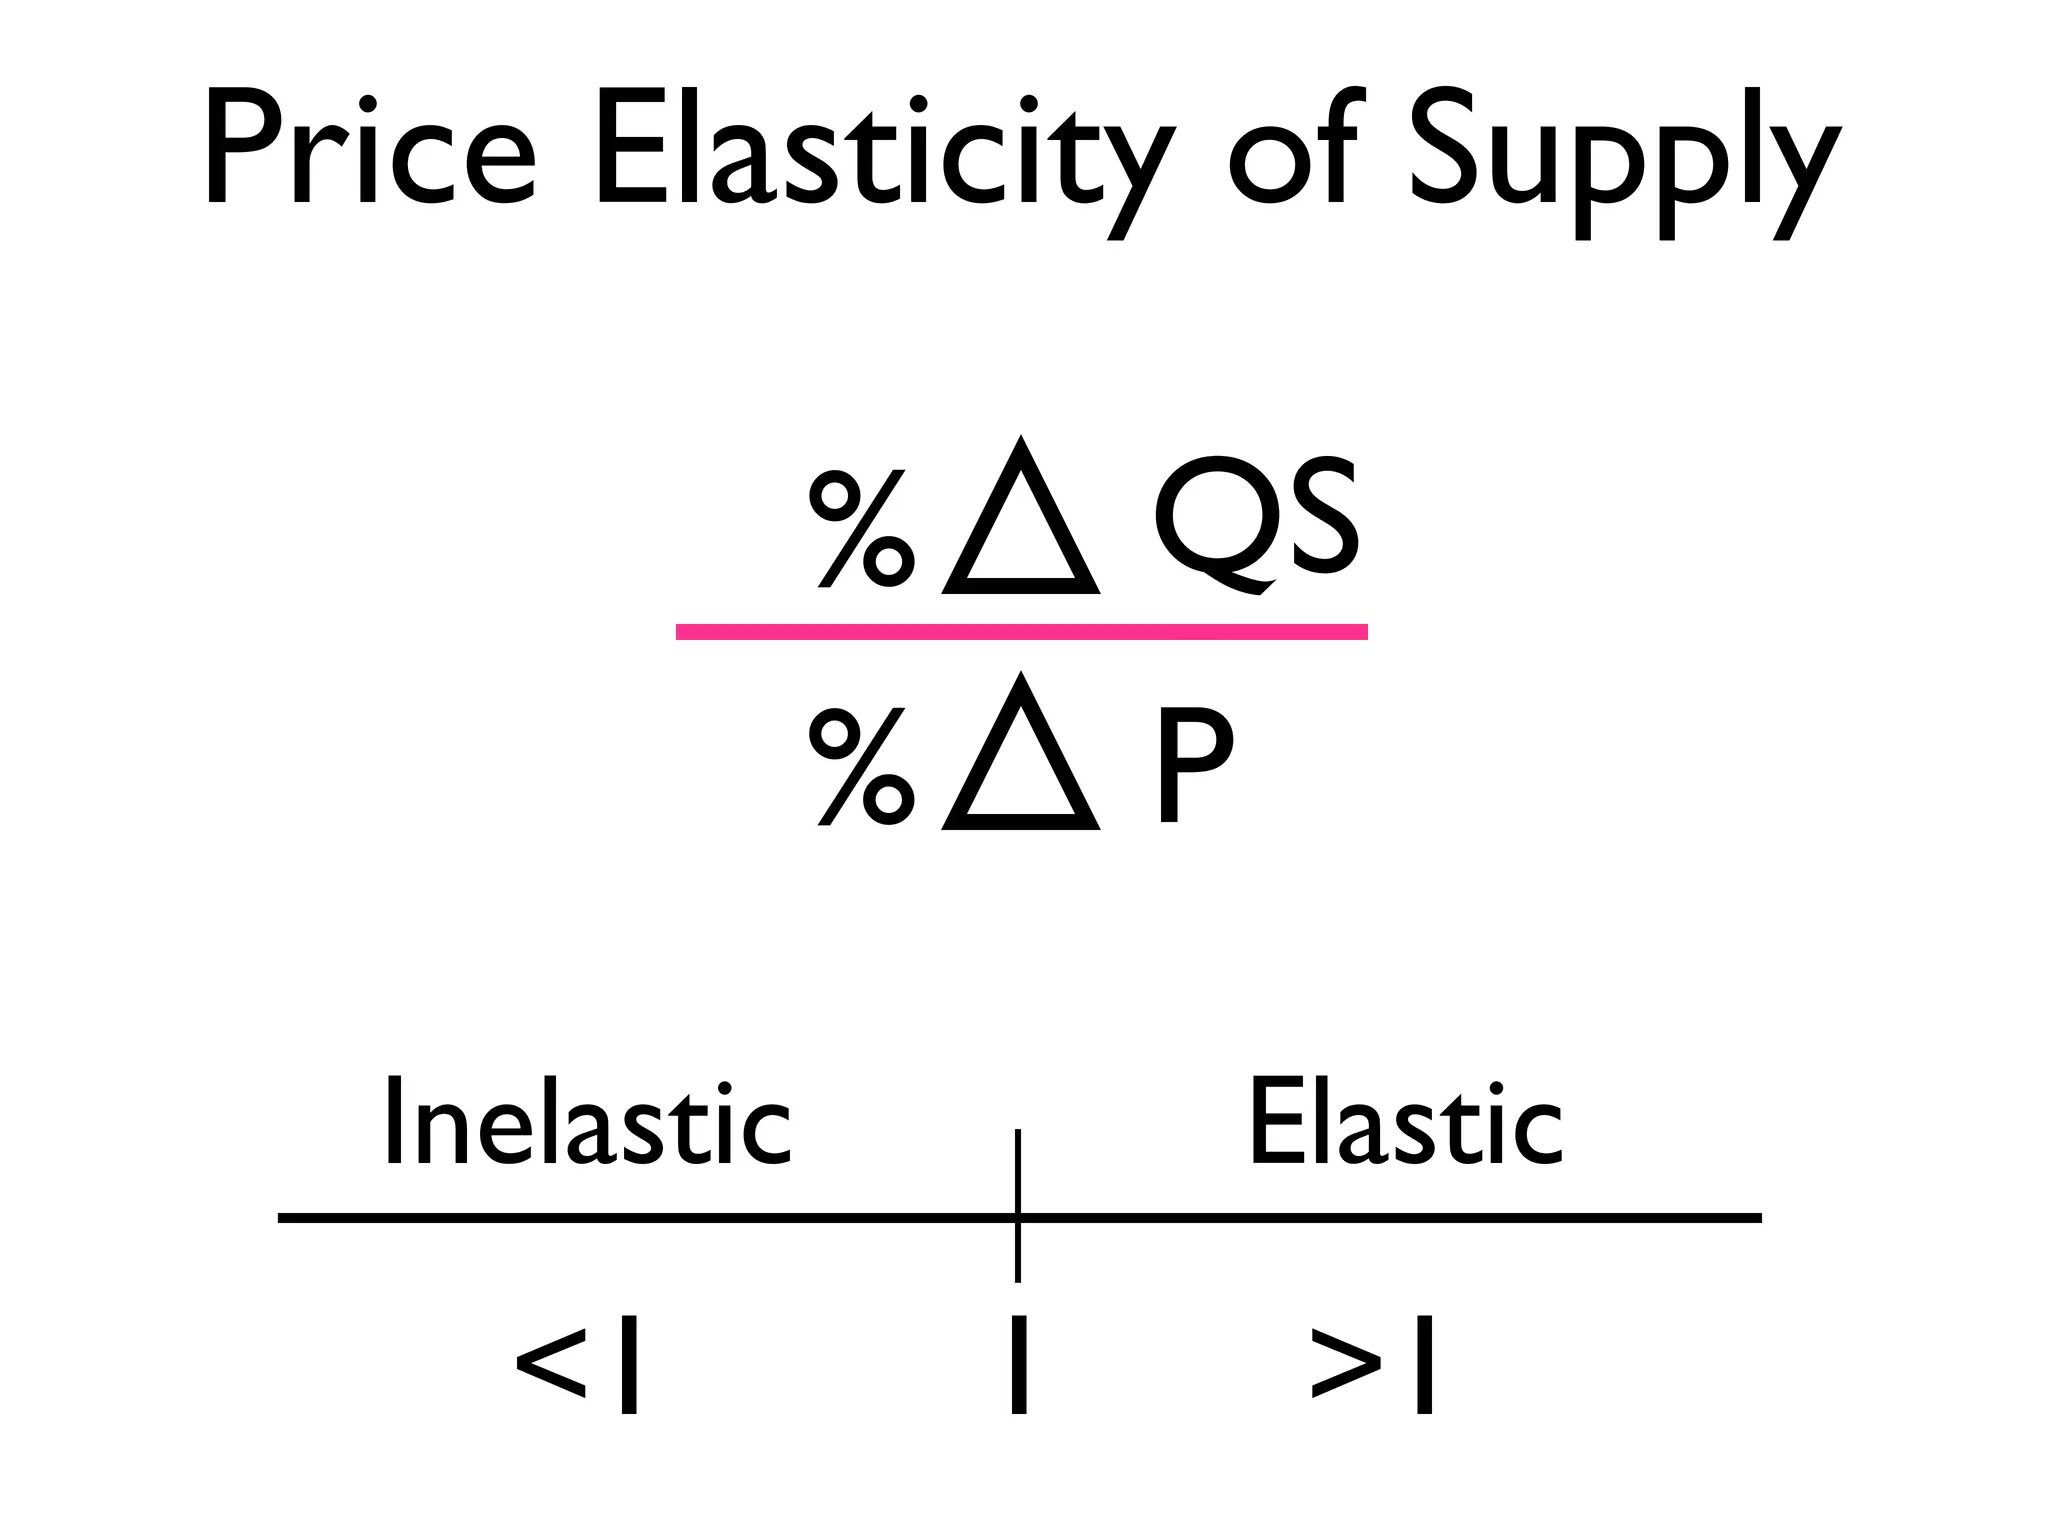
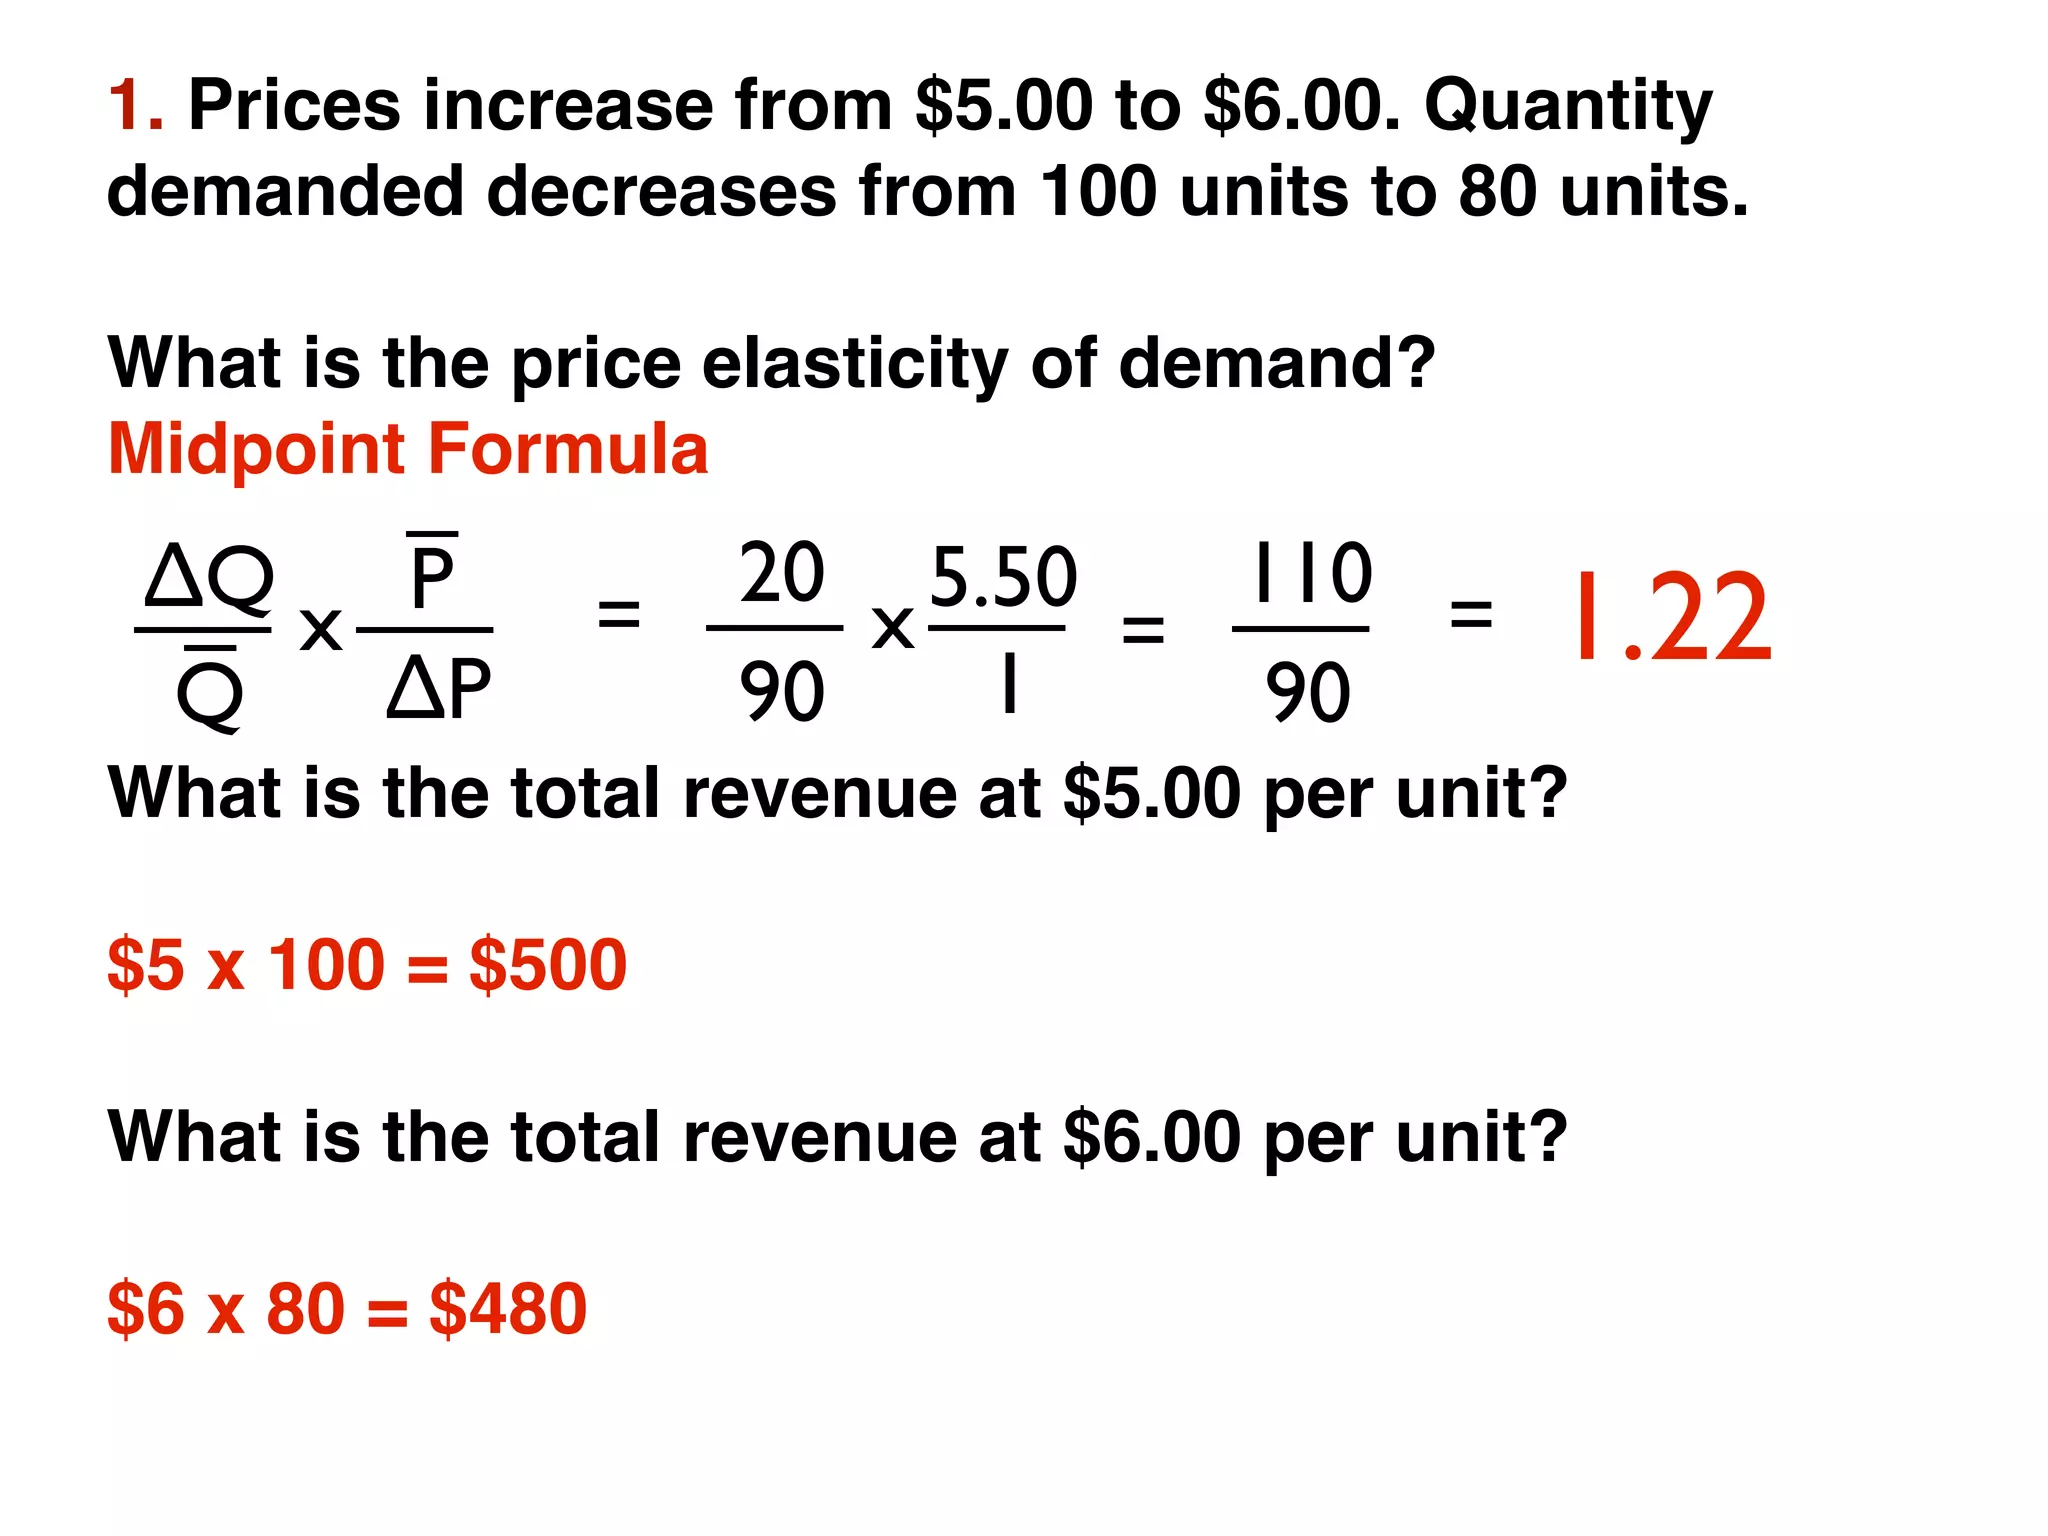
Microeconomics
Chapter 5
Elasticity
0
10
20
30
40
50
60
70
80
90
100
0 1 2 3 4 5 6 7 8 9 10
Price
Quantity
Movement along the
Demand Curve
0
10
20
30
40
50
60
70
80
90
100
0 1 2 3 4 5 6 7 8 9 10
Price
Quantity
Movement along the
Demand Curve
0
10
20
30
40
50
60
70
80
90
100
0 1 2 3 4 5 6 7 8 9 10
Price
Quantity
Movement along the
Demand Curve
0
10
20
30
40
50
60
70
80
90
100
0 1 2 3 4 5 6 7 8 9 10
Price
Quantity
Movement along the
Demand Curve
0
10
20
30
40
50
60
70
80
90
100
0 1 2 3 4 5 6 7 8 9 10
Price
Quantity
Movement along the
Demand Curve
0
10
20
30
40
50
60
70
80
90
100
0 1 2 3 4 5 6 7 8 9 10
Price
Quantity
Movement along the
Demand Curve
0
10
20
30
40
50
60
70
80
90
100
0 1 2 3 4 5 6 7 8 9 10
Price
Quantity
Movement along the
Demand Curve
0
10
20
30
40
50
60
70
80
90
100
0 1 2 3 4 5 6 7 8 9 10
Price
Quantity
Movement along the
Demand Curve
0
10
20
30
40
50
60
70
80
90
100
0 1 2 3 4 5 6 7 8 9 10
Price
Quantity
Movement along the
Demand Curve
0
10
20
30
40
50
60
70
80
90
100
0 1 2 3 4 5 6 7 8 9 10
Price
Quantity
Movement along the
Demand Curve
0
10
20
30
40
50
60
70
80
90
100
0 1 2 3 4 5 6 7 8 9 10
Price
Quantity
Movement along the
Demand Curve
0
10
20
30
40
50
60
70
80
90
100
0 1 2 3 4 5 6 7 8 9 10
Price
Quantity
Movement along the
Demand Curve
0
10
20
30
40
50
60
70
80
90
100
0 1 2 3 4 5 6 7 8 9 10
Price
Quantity
Movement along the
Demand Curve
0
10
20
30
40
50
60
70
80
90
100
0 1 2 3 4 5 6 7 8 9 10
Price
Quantity
Movement along the
Demand Curve
0
10
20
30
40
50
60
70
80
90
100
0 1 2 3 4 5 6 7 8 9 10
Price
Quantity
Movement along the
Demand Curve
0
10
20
30
40
50
60
70
80
90
100
0 1 2 3 4 5 6 7 8 9 10
Price
Quantity
Movement along the
Demand Curve
0
10
20
30
40
50
60
70
80
90
100
0 1 2 3 4 5 6 7 8 9 10
Price
Quantity
Movement along the
Demand Curve
0
10
20
30
40
50
60
70
80
90
100
0 1 2 3 4 5 6 7 8 9 10
Price
Quantity
Movement along the
Demand Curve
Price changes
demand curve does
not change
quantity demanded
changes
0
10
20
30
40
50
60
70
80
90
100
0 1 2 3 4 5 6 7 8 9 10
Price
Quantity
Shift in the Demand Curve
0
10
20
30
40
50
60
70
80
90
100
0 1 2 3 4 5 6 7 8 9 10
Price
Quantity
Shift in the Demand Curve
0
10
20
30
40
50
60
70
80
90
100
0 1 2 3 4 5 6 7 8 9 10
Price
Quantity
Shift in the Demand Curve
0
10
20
30
40
50
60
70
80
90
100
0 1 2 3 4 5 6 7 8 9 10
Price
Quantity
Shift in the Demand Curve
0
10
20
30
40
50
60
70
80
90
100
0 1 2 3 4 5 6 7 8 9 10
Price
Quantity
Shift in the Demand Curve
0
10
20
30
40
50
60
70
80
90
100
0 1 2 3 4 5 6 7 8 9 10
Price
Quantity
Shift in the Demand Curve
0
10
20
30
40
50
60
70
80
90
100
0 1 2 3 4 5 6 7 8 9 10
Price
Quantity
Shift in the Demand Curve
0
10
20
30
40
50
60
70
80
90
100
0 1 2 3 4 5 6 7 8 9 10
Price
Quantity
Shift in the Demand Curve
0
10
20
30
40
50
60
70
80
90
100
0 1 2 3 4 5 6 7 8 9 10
Price
Quantity
Shift in the Demand Curve
0
10
20
30
40
50
60
70
80
90
100
0 1 2 3 4 5 6 7 8 9 10
Price
Quantity
Shift in the Demand Curve
0
10
20
30
40
50
60
70
80
90
100
0 1 2 3 4 5 6 7 8 9 10
Price
Quantity
Shift in the Demand Curve
0
10
20
30
40
50
60
70
80
90
100
0 1 2 3 4 5 6 7 8 9 10
Price
Quantity
Shift in the Demand Curve
0
10
20
30
40
50
60
70
80
90
100
0 1 2 3 4 5 6 7 8 9 10
Price
Quantity
Shift in the Demand Curve
0
10
20
30
40
50
60
70
80
90
100
0 1 2 3 4 5 6 7 8 9 10
Price
Quantity
Shift in the Demand Curve
0
10
20
30
40
50
60
70
80
90
100
0 1 2 3 4 5 6 7 8 9 10
Price
Quantity
Shift in the Demand Curve
0
10
20
30
40
50
60
70
80
90
100
0 1 2 3 4 5 6 7 8 9 10
Price
Quantity
Shift in the Demand Curve
0
10
20
30
40
50
60
70
80
90
100
0 1 2 3 4 5 6 7 8 9 10
Price
Quantity
Shift in the Demand Curve
Price does not
change
demand curve
shifts
quantity demanded
changes
Movement or Shift?
Variable Change Movement Shift
Price
Income
Related Goods
Tastes
Population and Demographics
Expectations
elasticity
price elasticity of demand
total revenue
total expenditure
income elasticity of demand
cross-price elasticity of demand
price elasticity of supply
Key Terms
ELASTICITY EQUATION BENCHMARK
Price Elasticity
of Demand
Cross-Price
Elasticity
Income
Elasticity
Price Elasticity
of Supply
Midpoint
Formula
Inelastic | Elastic
1
Compliments | Substitutes
0
Inferior | Normal | Luxury
0 1
Inelastic | Elastic
1
%∆QD
%∆P
%∆QS
%∆P
%∆QD1
%∆P2
%∆QD
%∆I
∆Q
∆PQ
Px
Elasticity
Elasticity
If I change one thing does
another thing also change?
Elasticity
Elasticity
A measure of how much
one economic variable
responds
to changes in
another economic variable
Percentage Change
%
Percentage Change
%
New - Old
Old
Percentage Change
%
New - Old
Old
Ignore units in the scale
Scales can be deceptive
$0
$1.00
$2.00
$3.00
$4.00
$5.00
$6.00
$7.00
$8.00
1 2 3 4 5 6 7 8 9 10
Gallons - Gasoline
Price
$0
$10.00
$20.00
$30.00
$40.00
$50.00
$60.00
$70.00
$80.00
$90.00
$100.00
3 4.5 6
Gallons - Gasoline
Price
Demand
Schedule
Demand
Schedule
Price Quantity Total Revenue
90 1 90
80 2 160
70 3 210
60 4 240
50 5 250
40 6 240
30 7 210
20 8 160
10 9 90
Demand
Schedule
Price Quantity Total Revenue
90 1 90
80 2 160
70 3 210
60 4 240
50 5 250
40 6 240
30 7 210
20 8 160
10 9 90
Demand
Schedule
Price Quantity Total Revenue
90 1 90
80 2 160
70 3 210
60 4 240
50 5 250
40 6 240
30 7 210
20 8 160
10 9 90
Demand
Schedule
Price Quantity Total Revenue
90 1 90
80 2 160
70 3 210
60 4 240
50 5 250
40 6 240
30 7 210
20 8 160
10 9 90
Demand
Schedule
Total Revenue
Curve
Price Quantity Total Revenue
90 1 90
80 2 160
70 3 210
60 4 240
50 5 250
40 6 240
30 7 210
20 8 160
10 9 90
Demand
Schedule
Total Revenue
Curve
Total
Revenue
Price Quantity Total Revenue
90 1 90
80 2 160
70 3 210
60 4 240
50 5 250
40 6 240
30 7 210
20 8 160
10 9 90
Demand
Schedule
Total Revenue
Curve
Total
Revenue
Price Per Pizza
Price Quantity Total Revenue
90 1 90
80 2 160
70 3 210
60 4 240
50 5 250
40 6 240
30 7 210
20 8 160
10 9 90
Demand
Schedule
Total Revenue
Curve
10 20 30 40 50 60 70 80 90
0
60
120
180
240
300Total
Revenue
Price Per Pizza
Price Quantity Total Revenue
90 1 90
80 2 160
70 3 210
60 4 240
50 5 250
40 6 240
30 7 210
20 8 160
10 9 90
Demand
Schedule
Total Revenue
Curve
10 20 30 40 50 60 70 80 90
0
60
120
180
240
300Total
Revenue
Price Per Pizza
Price Quantity Total Revenue
90 1 90
80 2 160
70 3 210
60 4 240
50 5 250
40 6 240
30 7 210
20 8 160
10 9 90
Demand
Schedule
Total Revenue
Curve
10 20 30 40 50 60 70 80 90
0
60
120
180
240
300Total
Revenue
Price Per Pizza
Price Quantity Total Revenue
90 1 90
80 2 160
70 3 210
60 4 240
50 5 250
40 6 240
30 7 210
20 8 160
10 9 90
Demand
Schedule
Total Revenue
Curve
10 20 30 40 50 60 70 80 90
0
60
120
180
240
300Total
Revenue
Price Per Pizza
Price Quantity Total Revenue
90 1 90
80 2 160
70 3 210
60 4 240
50 5 250
40 6 240
30 7 210
20 8 160
10 9 90
Demand
Schedule
Total Revenue
Curve
10 20 30 40 50 60 70 80 90
0
60
120
180
240
300Total
Revenue
Price Per Pizza
Price Quantity Total Revenue
90 1 90
80 2 160
70 3 210
60 4 240
50 5 250
40 6 240
30 7 210
20 8 160
10 9 90
Demand
Schedule
Total Revenue
Curve
10 20 30 40 50 60 70 80 90
0
60
120
180
240
300Total
Revenue
Price Per Pizza
Price Quantity Total Revenue
90 1 90
80 2 160
70 3 210
60 4 240
50 5 250
40 6 240
30 7 210
20 8 160
10 9 90
Demand
Schedule
Total Revenue
Curve
10 20 30 40 50 60 70 80 90
0
60
120
180
240
300Total
Revenue
Price Per Pizza
Price Quantity Total Revenue
90 1 90
80 2 160
70 3 210
60 4 240
50 5 250
40 6 240
30 7 210
20 8 160
10 9 90
Demand
Schedule
Total Revenue
Curve
10 20 30 40 50 60 70 80 90
0
60
120
180
240
300Total
Revenue
Price Per Pizza
Price Quantity Total Revenue
90 1 90
80 2 160
70 3 210
60 4 240
50 5 250
40 6 240
30 7 210
20 8 160
10 9 90
Demand
Schedule
Total Revenue
Curve
10 20 30 40 50 60 70 80 90
0
60
120
180
240
300Total
Revenue
Price Per Pizza
Price Quantity Total Revenue
90 1 90
80 2 160
70 3 210
60 4 240
50 5 250
40 6 240
30 7 210
20 8 160
10 9 90
Demand
Schedule
Total Revenue
Curve
10 20 30 40 50 60 70 80 90
0
60
120
180
240
300Total
Revenue
Price Per Pizza
Price Elasticity of Demand
%
%
Price Elasticity of Demand
%
%
QD
Price Elasticity of Demand
%
%
QD
P
Price Elasticity of Demand
%
%
QD
P
Percentage Change in Quantity
Demanded
Percentage Change in Price
Price Elasticity of Demand
1
ElasticInelastic
<1 >1
1. Calculate Elasticity
2.Take AbsoluteValue
3. Compare to benchmark of 1
$0
$1.00
$2.00
$3.00
$4.00
$5.00
$6.00
$7.00
$8.00
1 2 3 4 5 6 7 8 9 10
Gallons - Gasoline
Price
$0
$1.00
$2.00
$3.00
$4.00
$5.00
$6.00
$7.00
$8.00
1 2 3 4 5 6 7 8 9 10
Gallons - Gasoline
Price
$0
$1.00
$2.00
$3.00
$4.00
$5.00
$6.00
$7.00
$8.00
1 2 3 4 5 6 7 8 9 10
Gallons - Gasoline
Price
$0
$1.00
$2.00
$3.00
$4.00
$5.00
$6.00
$7.00
$8.00
1 2 3 4 5 6 7 8 9 10
Gallons - Gasoline
Price
$0
$1.00
$2.00
$3.00
$4.00
$5.00
$6.00
$7.00
$8.00
1 2 3 4 5 6 7 8 9 10
Gallons - Gasoline
Price
$0
$1.00
$2.00
$3.00
$4.00
$5.00
$6.00
$7.00
$8.00
1 2 3 4 5 6 7 8 9 10
Gallons - Gasoline
Price
%QD
%P
$0
$1.00
$2.00
$3.00
$4.00
$5.00
$6.00
$7.00
$8.00
1 2 3 4 5 6 7 8 9 10
Gallons - Gasoline
Price
%QD
%P
(4-5)÷5
(6-3)÷3
$0
$1.00
$2.00
$3.00
$4.00
$5.00
$6.00
$7.00
$8.00
1 2 3 4 5 6 7 8 9 10
Gallons - Gasoline
Price
%QD
%P
(4-5)÷5
(6-3)÷3
-.2
1
$0
$1.00
$2.00
$3.00
$4.00
$5.00
$6.00
$7.00
$8.00
1 2 3 4 5 6 7 8 9 10
Gallons - Gasoline
Price
%QD
%P
(4-5)÷5
(6-3)÷3
-.2
1
.2
$0
$1.00
$2.00
$3.00
$4.00
$5.00
$6.00
$7.00
$8.00
1 2 3 4 5 6 7 8 9 10
Gallons - Ice Cream
Price
Price Increase
$0
$1.00
$2.00
$3.00
$4.00
$5.00
$6.00
$7.00
$8.00
1 2 3 4 5 6 7 8 9 10
Gallons - Ice Cream
Price
Price Increase
$0
$1.00
$2.00
$3.00
$4.00
$5.00
$6.00
$7.00
$8.00
1 2 3 4 5 6 7 8 9 10
Gallons - Ice Cream
Price
Price Increase
$0
$1.00
$2.00
$3.00
$4.00
$5.00
$6.00
$7.00
$8.00
1 2 3 4 5 6 7 8 9 10
Gallons - Ice Cream
Price
Price Increase
$0
$1.00
$2.00
$3.00
$4.00
$5.00
$6.00
$7.00
$8.00
1 2 3 4 5 6 7 8 9 10
Gallons - Ice Cream
Price
Price Increase
$0
$1.00
$2.00
$3.00
$4.00
$5.00
$6.00
$7.00
$8.00
1 2 3 4 5 6 7 8 9 10
Gallons - Ice Cream
Price
Price Increase
$0
$1.00
$2.00
$3.00
$4.00
$5.00
$6.00
$7.00
$8.00
1 2 3 4 5 6 7 8 9 10
Gallons - Ice Cream
Price
%QD
%P
Price Increase
$0
$1.00
$2.00
$3.00
$4.00
$5.00
$6.00
$7.00
$8.00
1 2 3 4 5 6 7 8 9 10
Gallons - Ice Cream
Price
%QD
%P
(3-5)÷5
(4-3)÷3
Price Increase
$0
$1.00
$2.00
$3.00
$4.00
$5.00
$6.00
$7.00
$8.00
1 2 3 4 5 6 7 8 9 10
Gallons - Ice Cream
Price
%QD
%P
(3-5)÷5
(4-3)÷3
-.4
.33
Price Increase
$0
$1.00
$2.00
$3.00
$4.00
$5.00
$6.00
$7.00
$8.00
1 2 3 4 5 6 7 8 9 10
Gallons - Ice Cream
Price
%QD
%P
(3-5)÷5
(4-3)÷3
-.4
.33
1.2
Price Increase
$0
$1.00
$2.00
$3.00
$4.00
$5.00
$6.00
$7.00
$8.00
1 2 3 4 5 6 7 8 9 10
Gallons - Ice Cream
Price
Price Decrease
$0
$1.00
$2.00
$3.00
$4.00
$5.00
$6.00
$7.00
$8.00
1 2 3 4 5 6 7 8 9 10
Gallons - Ice Cream
Price
Price Decrease
$0
$1.00
$2.00
$3.00
$4.00
$5.00
$6.00
$7.00
$8.00
1 2 3 4 5 6 7 8 9 10
Gallons - Ice Cream
Price
Price Decrease
$0
$1.00
$2.00
$3.00
$4.00
$5.00
$6.00
$7.00
$8.00
1 2 3 4 5 6 7 8 9 10
Gallons - Ice Cream
Price
Price Decrease
$0
$1.00
$2.00
$3.00
$4.00
$5.00
$6.00
$7.00
$8.00
1 2 3 4 5 6 7 8 9 10
Gallons - Ice Cream
Price
Price Decrease
$0
$1.00
$2.00
$3.00
$4.00
$5.00
$6.00
$7.00
$8.00
1 2 3 4 5 6 7 8 9 10
Gallons - Ice Cream
Price
Price Decrease
$0
$1.00
$2.00
$3.00
$4.00
$5.00
$6.00
$7.00
$8.00
1 2 3 4 5 6 7 8 9 10
Gallons - Ice Cream
Price
%QD
%P
Price Decrease
$0
$1.00
$2.00
$3.00
$4.00
$5.00
$6.00
$7.00
$8.00
1 2 3 4 5 6 7 8 9 10
Gallons - Ice Cream
Price
%QD
%P
(5-3)÷3
(3-4)÷4
Price Decrease
$0
$1.00
$2.00
$3.00
$4.00
$5.00
$6.00
$7.00
$8.00
1 2 3 4 5 6 7 8 9 10
Gallons - Ice Cream
Price
%QD
%P
(5-3)÷3
(3-4)÷4
.66
-.25
Price Decrease
$0
$1.00
$2.00
$3.00
$4.00
$5.00
$6.00
$7.00
$8.00
1 2 3 4 5 6 7 8 9 10
Gallons - Ice Cream
Price
%QD
%P
(5-3)÷3
(3-4)÷4
.66
-.25
2.67
Price Decrease
Midpoint
Formula
Midpoint Formula
Q
Q
P
P
Midpoint Formula
Delta Q
over
Q Bar
Q
Q
P
P
Midpoint Formula
Delta Q
over
Q Bar
Delta P
over
P Bar
Q
Q
P
P
Midpoint Formula
Q
Q
P
P
Midpoint Formula
Q
Q
P
P
Trick: Flip denominator and multiply
Midpoint Formula
Q
Q
P
P
Trick: Flip denominator and multiply
Midpoint Formula
Q
Q P
P
Trick: Flip denominator and multiply
X =
$0
$1.00
$2.00
$3.00
$4.00
$5.00
$6.00
$7.00
$8.00
1 2 3 4 5 6 7 8 9 10
Gallons - Ice Cream
Price
Midpoint Formula
$0
$1.00
$2.00
$3.00
$4.00
$5.00
$6.00
$7.00
$8.00
1 2 3 4 5 6 7 8 9 10
Gallons - Ice Cream
Price
Midpoint Formula
$0
$1.00
$2.00
$3.00
$4.00
$5.00
$6.00
$7.00
$8.00
1 2 3 4 5 6 7 8 9 10
Gallons - Ice Cream
Price
Midpoint Formula
$0
$1.00
$2.00
$3.00
$4.00
$5.00
$6.00
$7.00
$8.00
1 2 3 4 5 6 7 8 9 10
Gallons - Ice Cream
Price
Midpoint Formula
$0
$1.00
$2.00
$3.00
$4.00
$5.00
$6.00
$7.00
$8.00
1 2 3 4 5 6 7 8 9 10
Gallons - Ice Cream
Price
Midpoint Formula
$0
$1.00
$2.00
$3.00
$4.00
$5.00
$6.00
$7.00
$8.00
1 2 3 4 5 6 7 8 9 10
Gallons - Ice Cream
Price
Midpoint Formula
$0
$1.00
$2.00
$3.00
$4.00
$5.00
$6.00
$7.00
$8.00
1 2 3 4 5 6 7 8 9 10
Gallons - Ice Cream
Price
Midpoint Formula
Q
Q P
P
x
$0
$1.00
$2.00
$3.00
$4.00
$5.00
$6.00
$7.00
$8.00
1 2 3 4 5 6 7 8 9 10
Gallons - Ice Cream
Price
Midpoint Formula
Q
Q P
P
x
2
4 1
3.5
x
$0
$1.00
$2.00
$3.00
$4.00
$5.00
$6.00
$7.00
$8.00
1 2 3 4 5 6 7 8 9 10
Gallons - Ice Cream
Price
7
4
Midpoint Formula
Q
Q P
P
x
2
4 1
3.5
x
$0
$1.00
$2.00
$3.00
$4.00
$5.00
$6.00
$7.00
$8.00
1 2 3 4 5 6 7 8 9 10
Gallons - Ice Cream
Price
7
4
1.75
Midpoint Formula
Q
Q P
P
x
2
4 1
3.5
x
What determines
Price Elasticity of
Demand?
Close Substitutes
Passage of Time
Luxuries vs. Necessities
Definition of Market
Share of Budget
Close Substitutes
Close Substitutes
Close Substitutes
Elastic >1
Close Substitutes
Elastic >1
Close Substitutes
Elastic >1
Inelastic <1
Passage of Time
Passage of Time
More Time
More Elastic
Luxuries vs. Necessities
Elastic
Luxuries vs. Necessities
Elastic Inelastic
Definition of Market
Elastic
Definition of Market
Elastic Inelastic
Definition of Market
Elastic Inelastic
Demand for Gasoline
in General
Definition of Market
Elastic Inelastic
Demand for Gasoline
in General
Demand for Gasoline
in Rexburg
Share of the Budget
Small Large
Share of the Budget
Inelastic
Small Large
Share of the Budget
ElasticInelastic
Small Large
Price Elasticity
and
Total Revenue
$0
$1.00
$2.00
$3.00
$4.00
$5.00
$6.00
$7.00
$8.00
1 2 3 4 5 6 7 8 9 10
Gallons - Gasoline
Price
Total Revenue
TR = P x Q
$0
$1.00
$2.00
$3.00
$4.00
$5.00
$6.00
$7.00
$8.00
1 2 3 4 5 6 7 8 9 10
Gallons - Gasoline
Price
Total Revenue
TR = P x Q
$0
$1.00
$2.00
$3.00
$4.00
$5.00
$6.00
$7.00
$8.00
1 2 3 4 5 6 7 8 9 10
Gallons - Gasoline
Price
Total Revenue
TR = P x Q
$0
$1.00
$2.00
$3.00
$4.00
$5.00
$6.00
$7.00
$8.00
1 2 3 4 5 6 7 8 9 10
Gallons - Gasoline
Price
$3.00 x 5 = $15
Total Revenue
TR = P x Q
$0
$1.00
$2.00
$3.00
$4.00
$5.00
$6.00
$7.00
$8.00
1 2 3 4 5 6 7 8 9 10
Gallons - Gasoline
Price
$6.00 x 4 = $24
$3.00 x 5 = $15
Total Revenue
TR = P x Q
$0
$1.00
$2.00
$3.00
$4.00
$5.00
$6.00
$7.00
$8.00
1 2 3 4 5 6 7 8 9 10
Gallons - Gasoline
Price
$6.00 x 4 = $24
$3.00 x 5 = $15
Lose
Total Revenue
TR = P x Q
$0
$1.00
$2.00
$3.00
$4.00
$5.00
$6.00
$7.00
$8.00
1 2 3 4 5 6 7 8 9 10
Gallons - Gasoline
Price
$6.00 x 4 = $24
$3.00 x 5 = $15
Lose
Gain
Total Revenue
TR = P x Q
$0
$1.00
$2.00
$3.00
$4.00
$5.00
$6.00
$7.00
$8.00
1 2 3 4 5 6 7 8 9 10
Gallons - Gasoline
Price
$6.00 x 4 = $24
$3.00 x 5 = $15
Net Gain = $9
Lose
Gain
Total Revenue
TR = P x Q
$0
$1.00
$2.00
$3.00
$4.00
$5.00
$6.00
$7.00
$8.00
1 2 3 4 5 6 7 8 9 10
Gallons - Gasoline
Price
$6.00 x 4 = $24
$3.00 x 5 = $15
Inelastic (<1)
Raising prices
will increase
total revenue
Net Gain = $9
Lose
Gain
Total Revenue
TR = P x Q
$0
$1.00
$2.00
$3.00
$4.00
$5.00
$6.00
$7.00
$8.00
1 2 3 4 5 6 7 8 9 10
Gallons - Ice Cream
Price
Total Revenue
TR = P x Q
$0
$1.00
$2.00
$3.00
$4.00
$5.00
$6.00
$7.00
$8.00
1 2 3 4 5 6 7 8 9 10
Gallons - Ice Cream
Price
Total Revenue
TR = P x Q
$0
$1.00
$2.00
$3.00
$4.00
$5.00
$6.00
$7.00
$8.00
1 2 3 4 5 6 7 8 9 10
Gallons - Ice Cream
Price
Total Revenue
TR = P x Q
$0
$1.00
$2.00
$3.00
$4.00
$5.00
$6.00
$7.00
$8.00
1 2 3 4 5 6 7 8 9 10
Gallons - Ice Cream
Price
$3.00 x 5 = $15
Total Revenue
TR = P x Q
$0
$1.00
$2.00
$3.00
$4.00
$5.00
$6.00
$7.00
$8.00
1 2 3 4 5 6 7 8 9 10
Gallons - Ice Cream
Price
$4.00 x 3 = $12
$3.00 x 5 = $15
Total Revenue
TR = P x Q
$0
$1.00
$2.00
$3.00
$4.00
$5.00
$6.00
$7.00
$8.00
1 2 3 4 5 6 7 8 9 10
Gallons - Ice Cream
Price
$4.00 x 3 = $12
$3.00 x 5 = $15
Lose
Total Revenue
TR = P x Q
$0
$1.00
$2.00
$3.00
$4.00
$5.00
$6.00
$7.00
$8.00
1 2 3 4 5 6 7 8 9 10
Gallons - Ice Cream
Price
$4.00 x 3 = $12
$3.00 x 5 = $15
Lose
Gain
Total Revenue
TR = P x Q
$0
$1.00
$2.00
$3.00
$4.00
$5.00
$6.00
$7.00
$8.00
1 2 3 4 5 6 7 8 9 10
Gallons - Ice Cream
Price
$4.00 x 3 = $12
$3.00 x 5 = $15
Net Gain = -$3
Lose
Gain
Total Revenue
TR = P x Q
$0
$1.00
$2.00
$3.00
$4.00
$5.00
$6.00
$7.00
$8.00
1 2 3 4 5 6 7 8 9 10
Gallons - Ice Cream
Price
$4.00 x 3 = $12
$3.00 x 5 = $15
Elastic (>1)
Raising prices
will decrease
total revenue
Net Gain = -$3
Lose
Gain
Total Revenue
TR = P x Q
Cross-Price
Elasticity of Demand
Cross-Price
Elasticity of Demand
%
%
QD
P
Cross-Price
Elasticity of Demand
%
%
QD
P
1
Cross-Price
Elasticity of Demand
%
%
QD
P
1
2
Cross-Price
Elasticity of Demand
Percentage Change in Quantity
Demanded of one good
Percentage Change in Price
of another good
%
%
QD
P
1
2
Cross-Price
Elasticity of Demand
0
SubstitutesCompliments
<0 >0
1. Calculate Elasticity
2. Compare to benchmark of 0
%
%
QD1
P2
%
%
QD1
P2 50%
%
%
QD1
P2
35%
50%
%
%
QD1
P2
35%
50%
=.7
%
%
QD1
P2
35%
50%
=.7 >0
%
%
QD1
P2
35%
50%
=.7 >0
Substitutes
%
%
QD1
P2
%
%
QD1
P2 50%
%
%
QD1
P2
-40%
50%
%
%
QD1
P2
-40%
50%
=-.8
%
%
QD1
P2
-40%
50%
=-.8 <0
%
%
QD1
P2
-40%
50%
=-.8 <0
Compliments
Cross-Price
Elasticity of Demand
0
SubstitutesCompliments
<0 >0
%
%
QD
P
1
2
Income
Elasticity of Demand
Normal, Inferior, or Luxury?
Percentage Change in
Quantity Demanded
Percentage Change in Income
Income
Elasticity of Demand
%
%
QD
I
Income
Elasticity of Demand
0
LuxuryInferior
<0 >1
1. Calculate Elasticity
2. Compare to benchmark of 0 and 1
1
Normal
%
%
QD
I
%
%
QD
I 20%
%
%
QD
I
10%
20%
%
%
QD
I
10%
20%
=.5
%
%
QD
I
10%
20%
=.5
>0
<1
%
%
QD
I
10%
20%
=.5
>0
<1
Normal
%
%
QD
I
%
%
QD
I 20%
%
%
QD
I
-50%
20%
%
%
QD
I
-50%
20%
=-2.5
%
%
QD
I
-50%
20%
=-2.5 <0
%
%
QD
I
-50%
20%
=-2.5 <0
Inferior
%
%
QD
I
%
%
QD
I 20%
%
%
QD
I
100%
20%
%
%
QD
I
100%
20%
= 5
%
%
QD
I
100%
20%
= 5 >1
%
%
QD
I
100%
20%
= 5 >1
Luxury
Income
Elasticity of Demand
0
LuxuryInferior
<0 >11
Normal
%
%
QD
I
Price Elasticity
of Supply
Price Elasticity of Supply
%
%
Price Elasticity of Supply
%
%
QS
Price Elasticity of Supply
%
%
QS
P
Price Elasticity of Supply
%
%
QS
P
Percentage Change in
Quantity Supplied
Percentage Change in Price
Price Elasticity of Supply
1
ElasticInelastic
<1 >1
1. Calculate Elasticity
2. Compare to benchmark of 1
%
%
QS
P
%
%
QS
P 20%
%
%
QS
P
10%
20%
%
%
QS
P
10%
20%
=.5
%
%
QS
P
10%
20%
=.5 <1
%
%
QS
P
10%
20%
=.5 <1
Inelastic
%
%
QS
P
%
%
QS
P 20%
%
%
QS
P
40%
20%
%
%
QS
P
40%
20%
= 2
%
%
QS
P
40%
20%
= 2 >1
%
%
QS
P
40%
20%
= 2 >1
Elastic
Price Elasticity of Supply
1
ElasticInelastic
<1 >1
%
%
QS
P
1. Prices increase from $5.00 to $6.00. Quantity
demanded decreases from 100 units to 80 units.
What is the price elasticity of demand?
Midpoint Formula
What is the total revenue at $5.00 per unit?
$5 x 100 = $500
What is the total revenue at $6.00 per unit?
$6 x 80 = $480
∆Q
∆PQ
Px
20
190
5.50x 1.22110
90
= = =

101 lecture 5