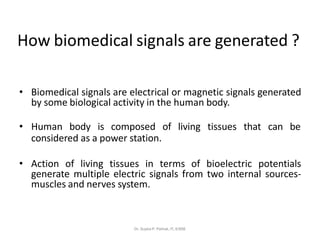
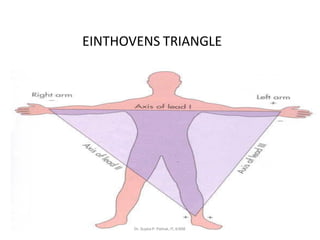
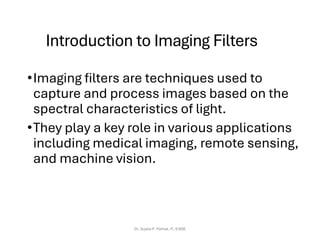
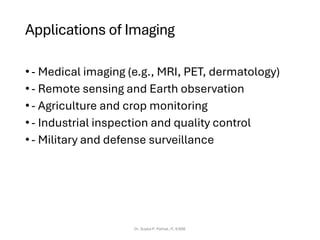
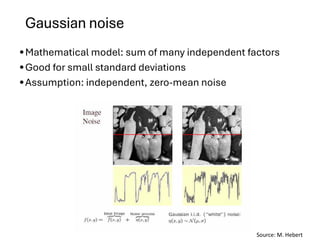
The Open Systems Interconnection (OSI) model is a conceptual framework that standardizes communication functions into seven distinct layers. It helps in understanding, implementing, and troubleshooting network communication systems by breaking down complex processes into smaller, manageable parts.


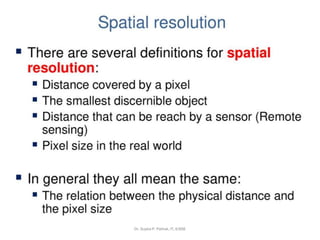
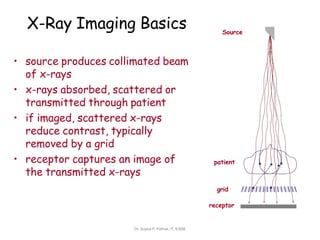
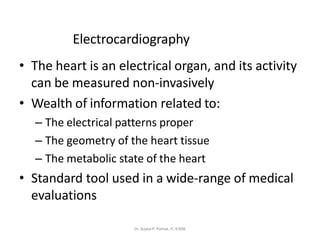
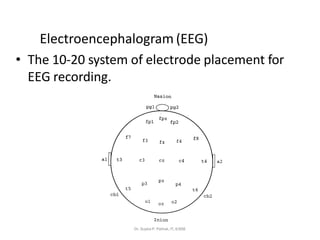
![SimpleImageFormation Model
Dr. Sujata P. Pathak, IT, KJSSE
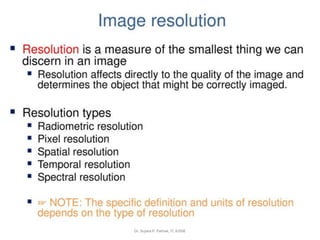
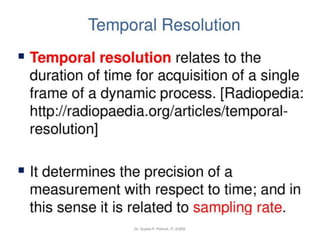
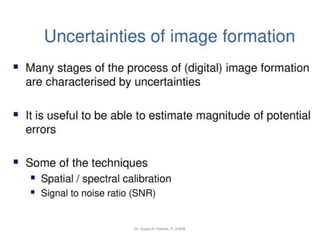
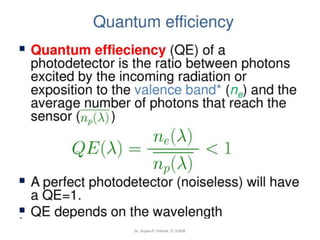
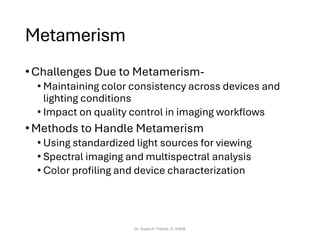
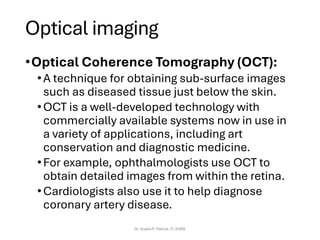
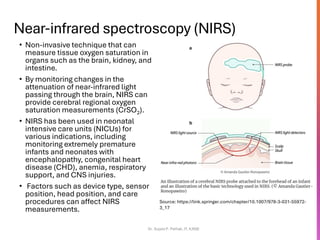
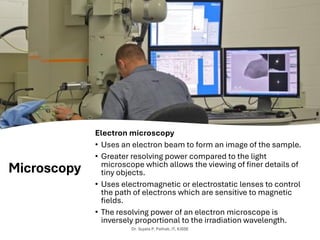
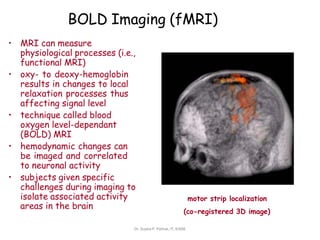
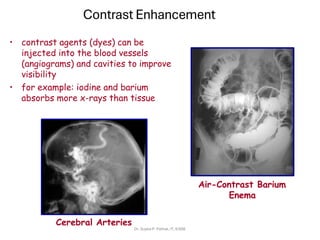
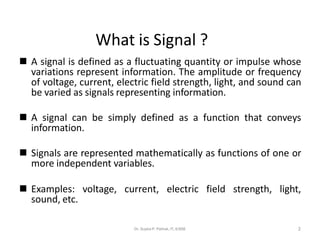
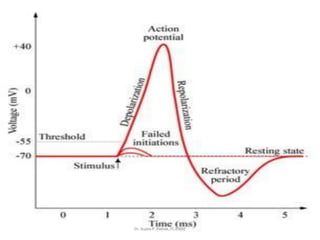
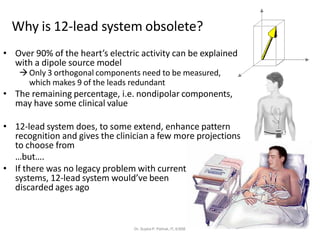
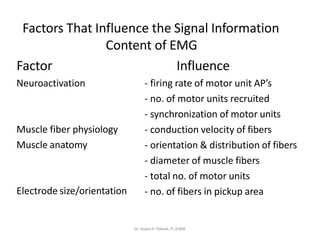
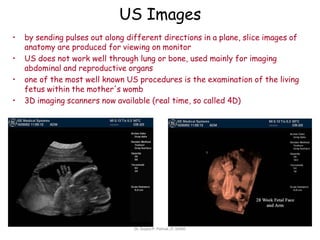
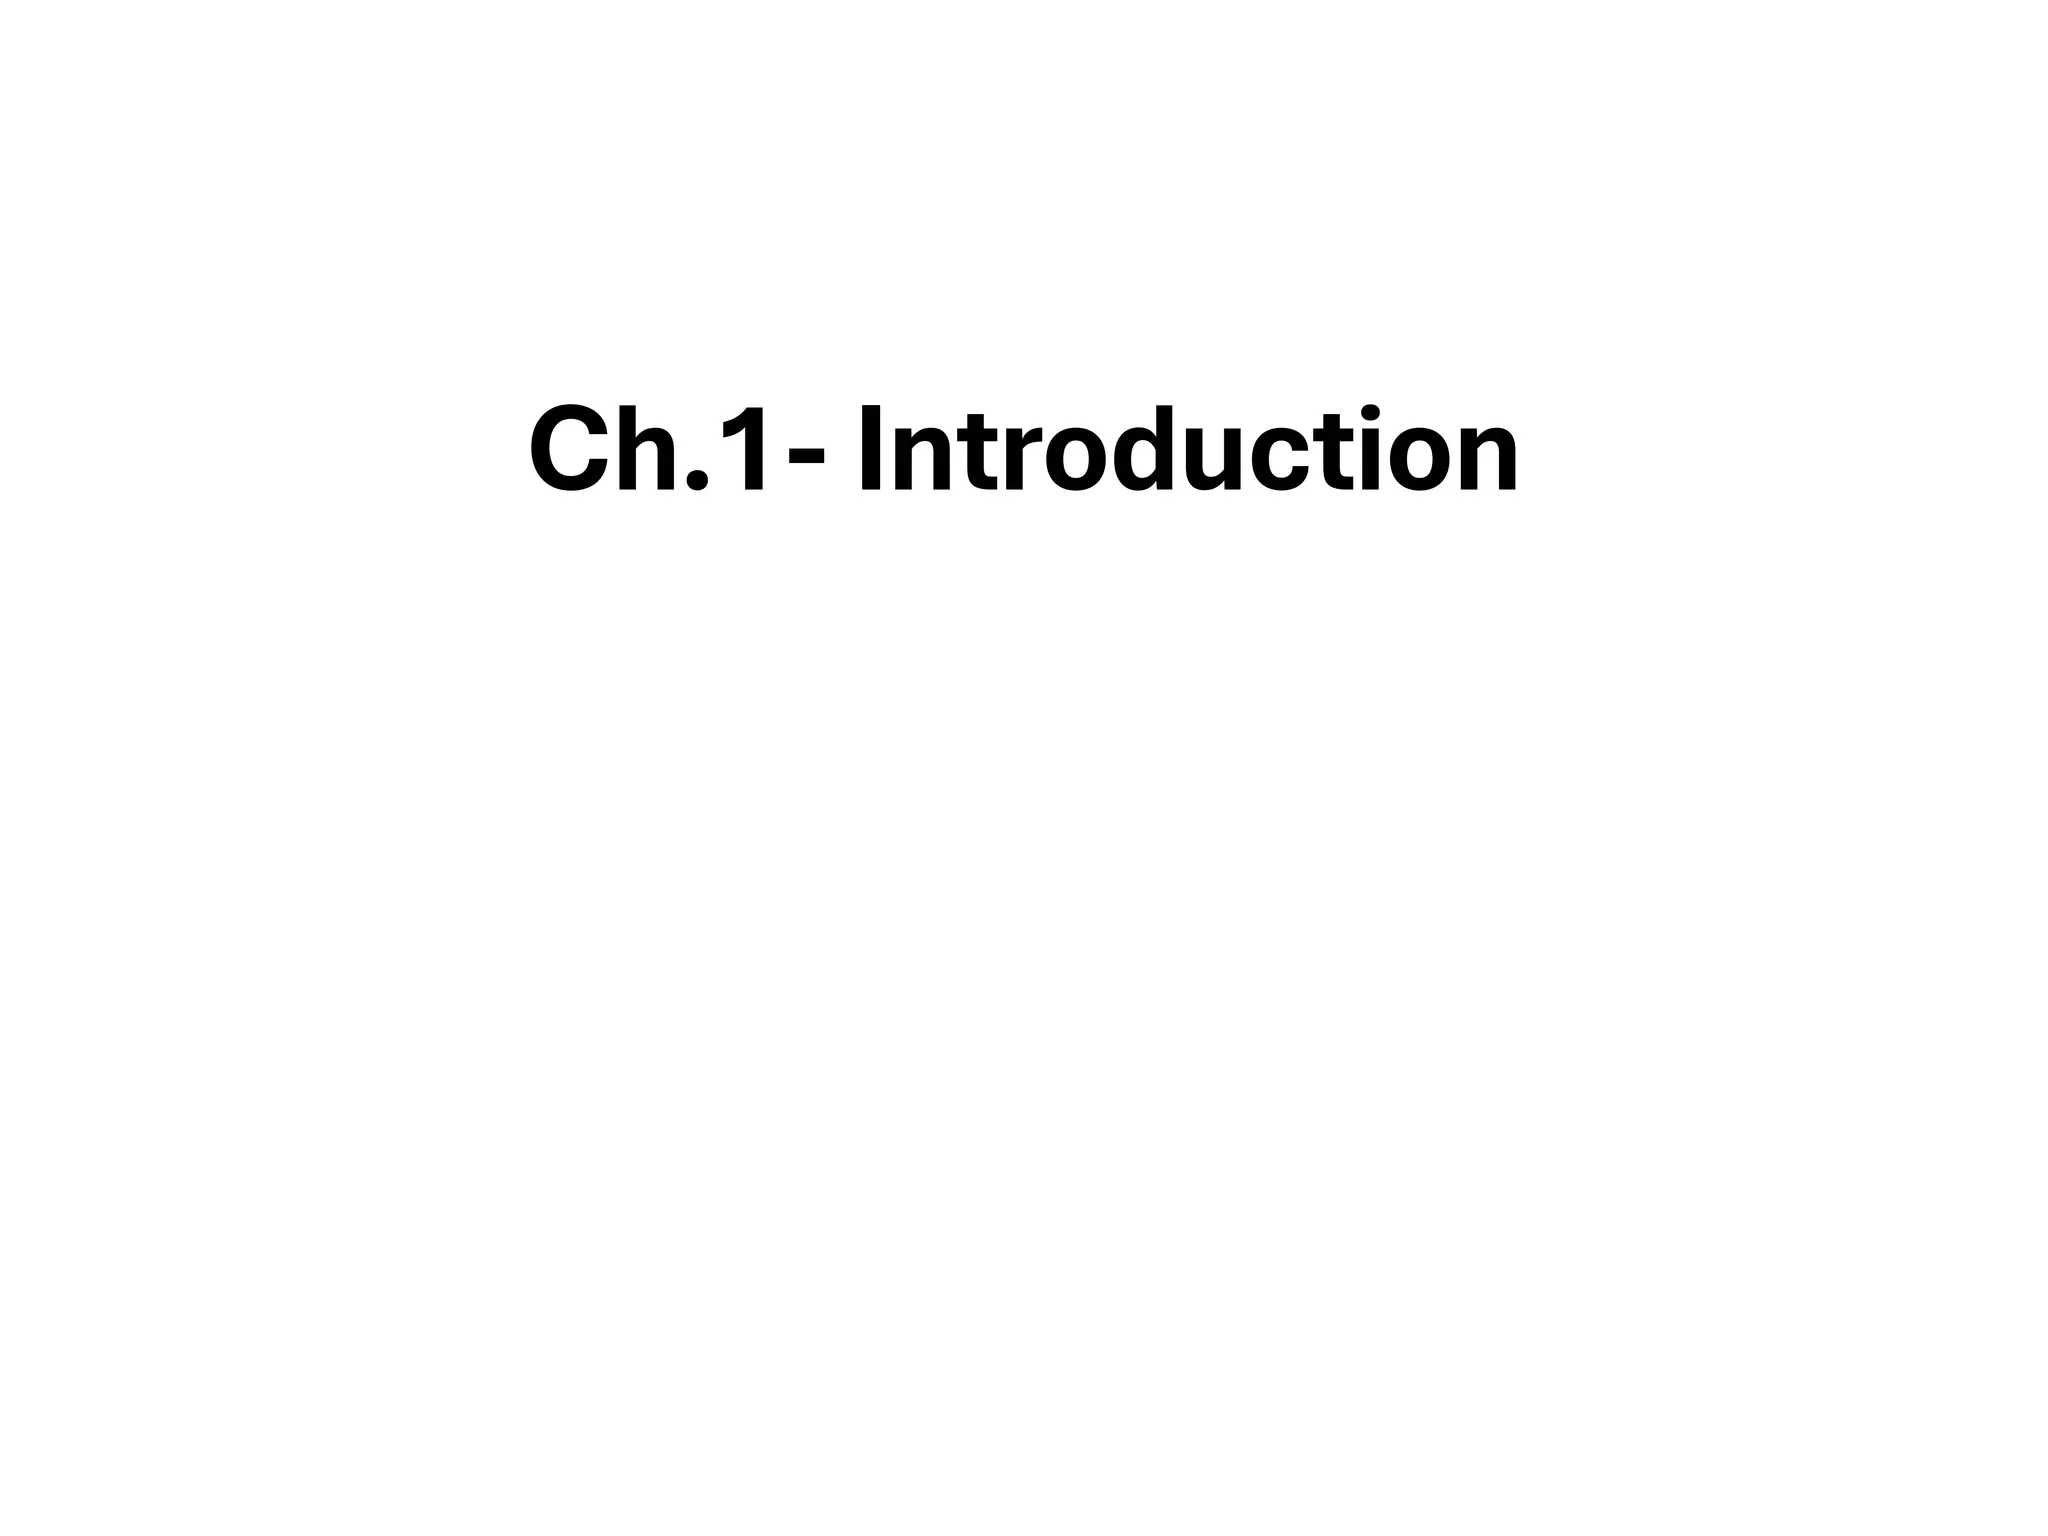
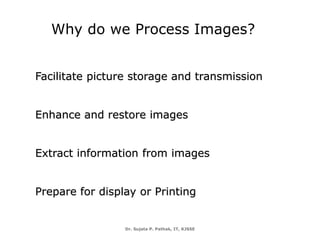
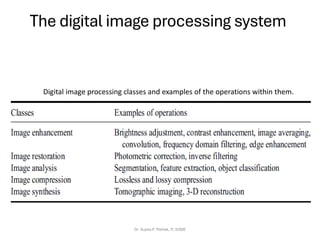
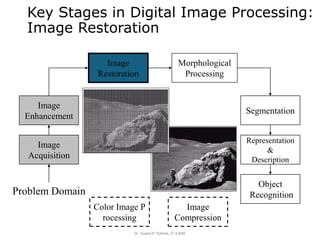
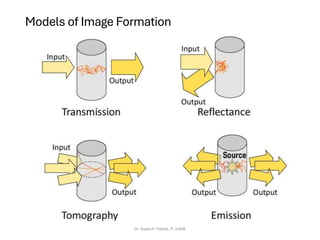
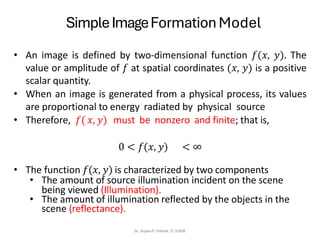
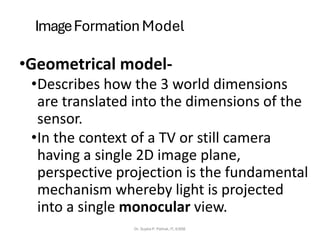
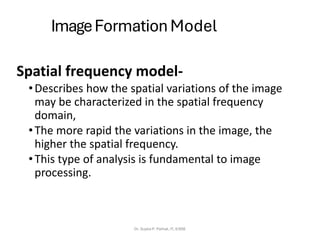
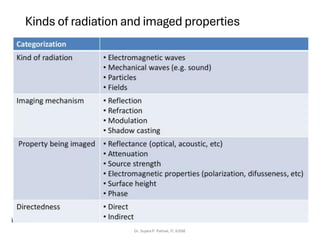
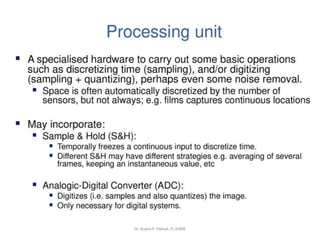
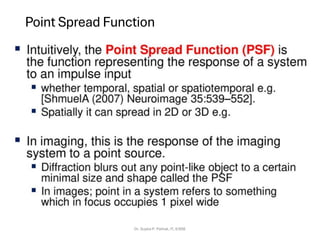
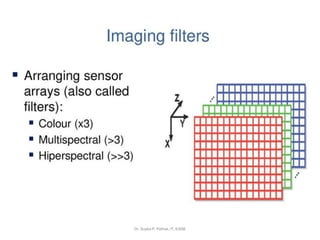
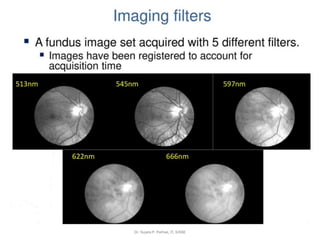
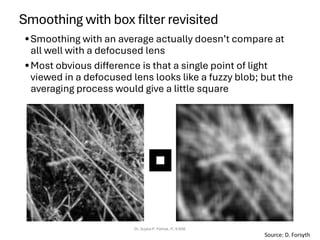
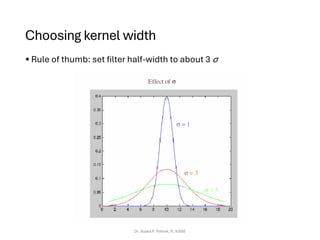
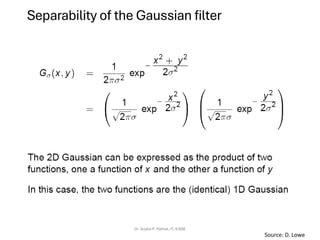
• A simple image model is
𝑓 (𝑥, 𝑦) = 𝑖(𝑥, 𝑦) . 𝑟(𝑥, 𝑦)
Where 0 <𝑖(𝑥, 𝑦) <∞ and 0< 𝑟(𝑥, 𝑦) <1
𝑟(𝑥, 𝑦) = 0 means total absorption
𝑟(𝑥, 𝑦) = 1 means total reflectance or transmittance
• The intensity of a monochrome image at any coordinates (𝑥,
𝑦) is the gray level (𝑙) of the image at that point.
• The interval of 𝑙 ranges from [0, 𝐿 − 1].
where 𝑙 = 0 indicates black and 𝑙 = 1 indicates white.
All the intermediate values are shades of gray varying from
black to white.](https://image.slidesharecdn.com/ch1-introduction111-251216113038-a194fd0b/85/CH1_INTRODUCTION-TO-DATABASE-PROGRAMMING-39-320.jpg)
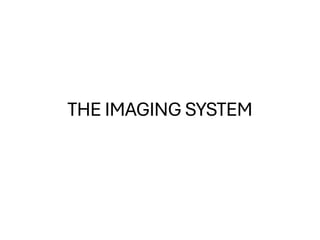
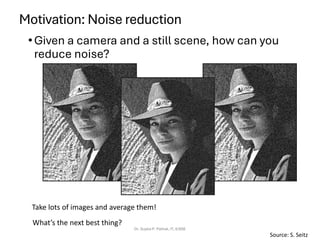
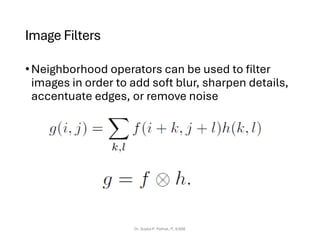
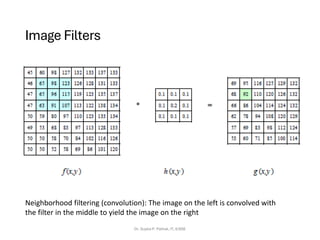

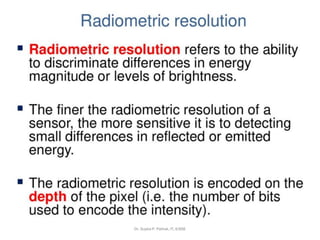
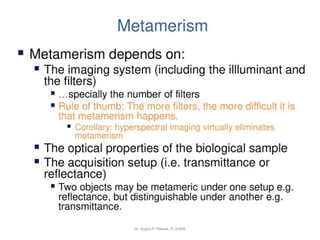
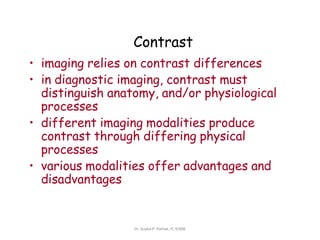
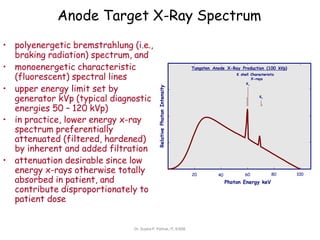
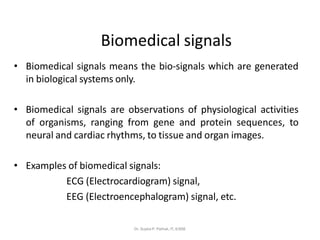
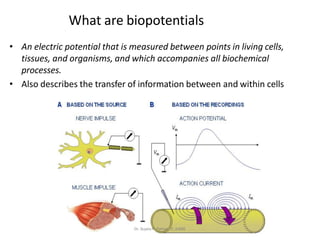
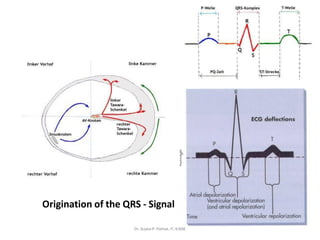
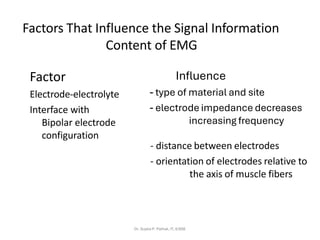
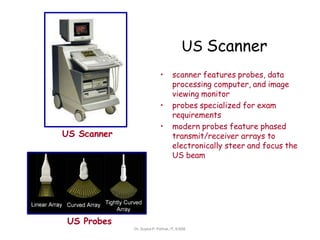
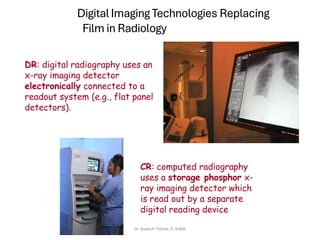
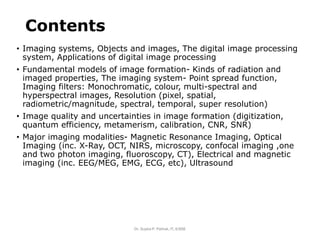
![Image Filters
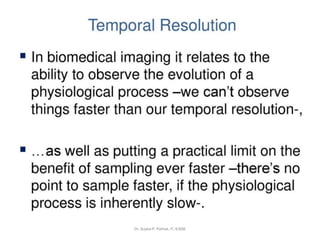
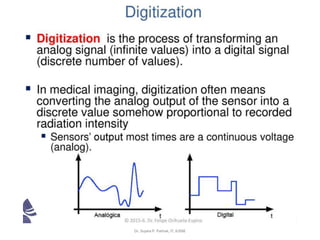
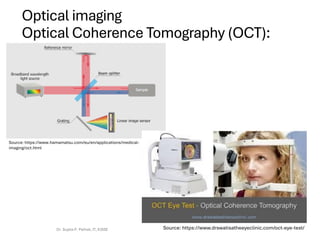
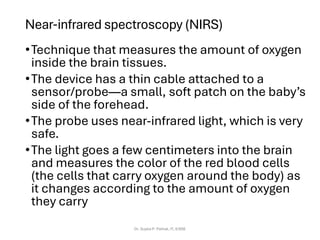
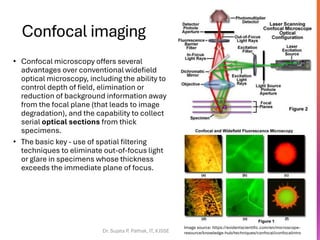
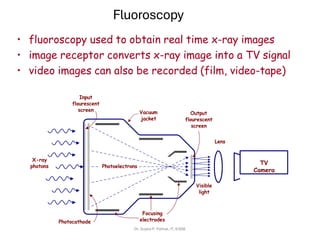
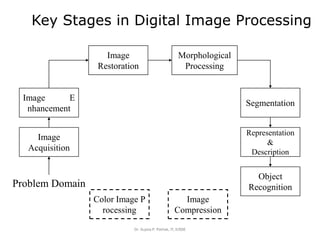
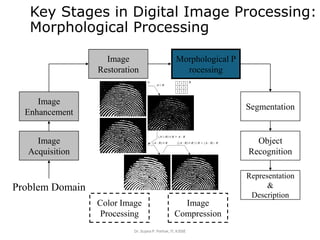
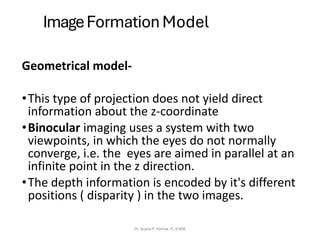
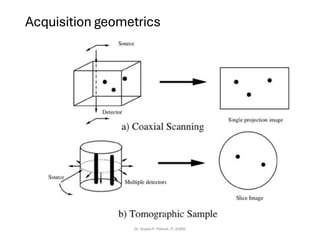
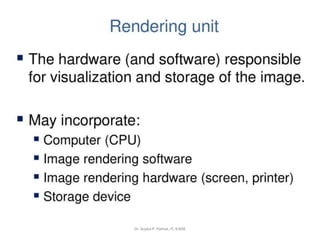
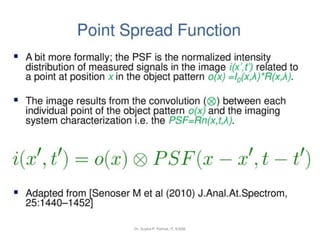
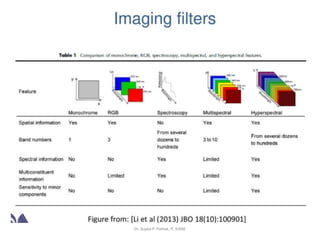
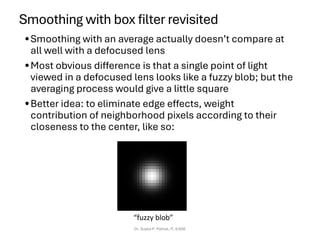
Defining convolution
• Let f be the image and g be the kernel. The output of convolving f with
g is denoted f * g.
Dr. Sujata P. Pathak, IT, KJSSE
−
−
=
l
k
l
k
g
l
n
k
m
f
n
m
g
f
,
]
,
[
]
,
[
]
,
)[
(
f
Source: F. Durand
• Convention: kernel is “flipped”
• MATLAB: conv2 vs. filter2 (also imfilter)](https://image.slidesharecdn.com/ch1-introduction111-251216113038-a194fd0b/85/CH1_INTRODUCTION-TO-DATABASE-PROGRAMMING-90-320.jpg)
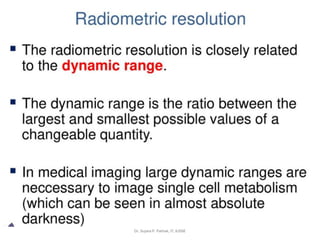
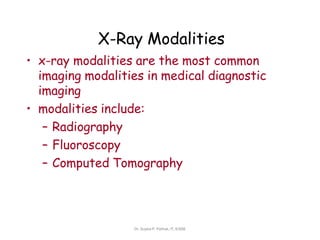
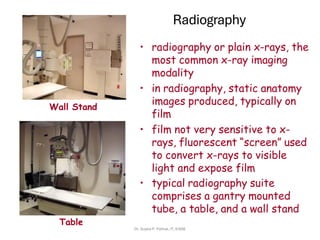
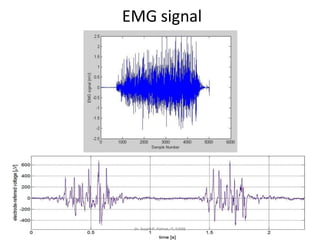
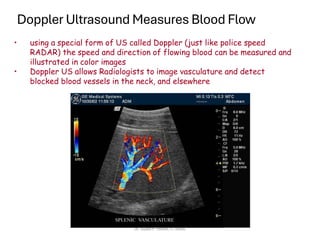
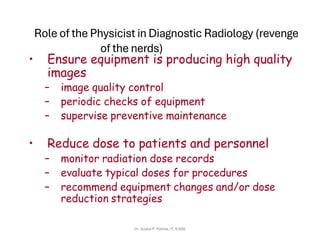
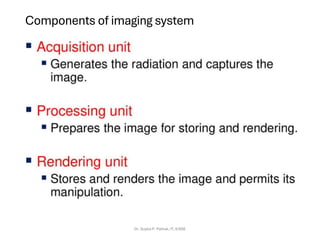
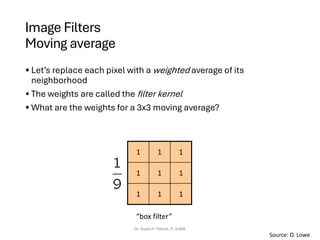
![Image Filters
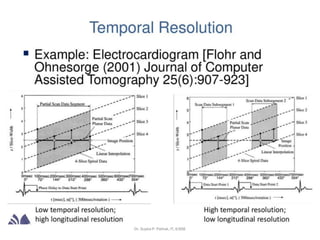
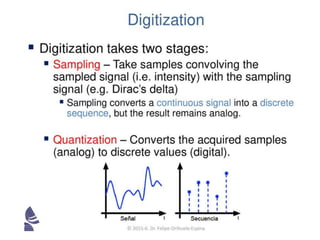
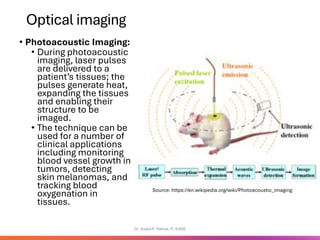
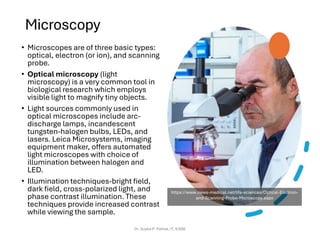
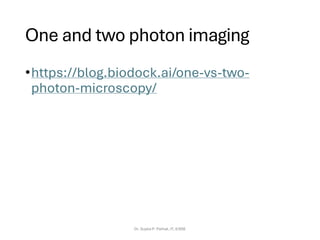
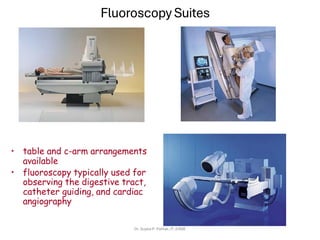
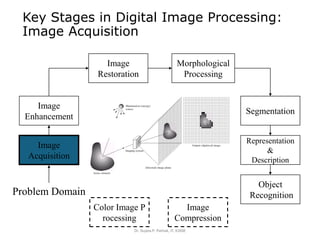
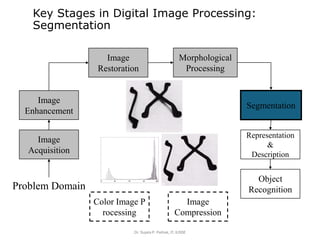
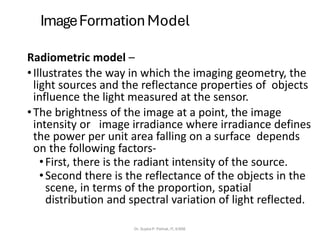
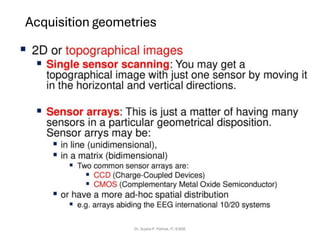
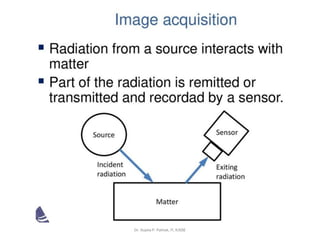
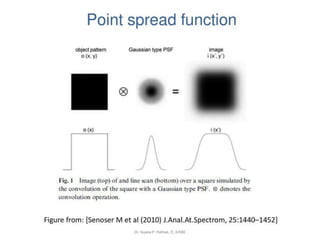
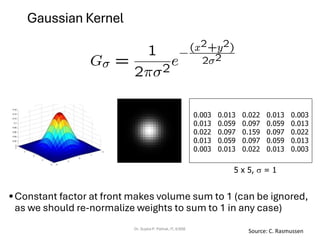
Properties in more detail
•Commutative: a * b = b * a
• Conceptually no difference between filter and signal
•Associative: a * (b * c) = (a * b) * c
• Often apply several filters one after another: (((a * b1) * b2) *
b3)
• This is equivalent to applying one filter: a * (b1 * b2 * b3)
•Distributes over addition: a * (b + c) = (a * b) + (a * c)
•Scalars factor out: ka *b = a *kb = k (a * b)
•Identity: unit impulse e = […, 0, 0, 1, 0, 0, …],
a * e = a
Dr. Sujata P. Pathak, IT, KJSSE](https://image.slidesharecdn.com/ch1-introduction111-251216113038-a194fd0b/85/CH1_INTRODUCTION-TO-DATABASE-PROGRAMMING-92-320.jpg)

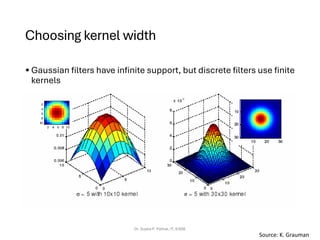
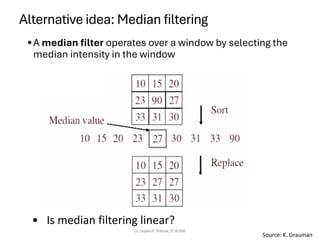
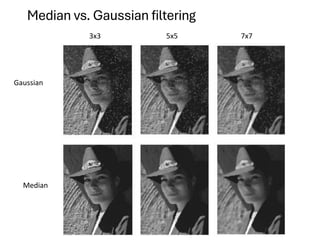
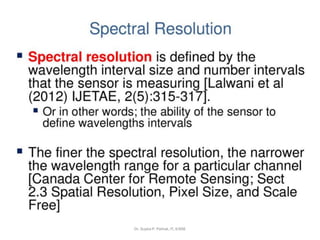
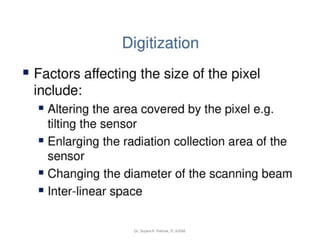
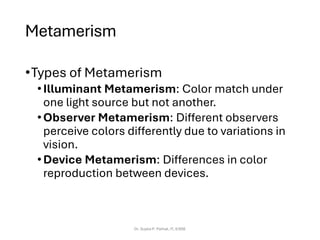
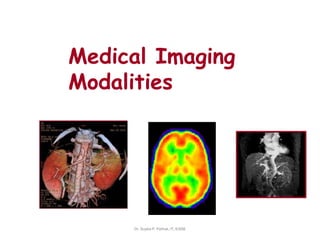
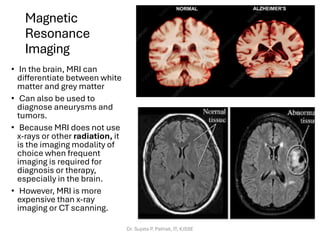
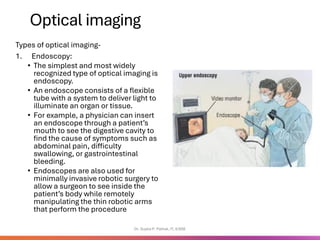
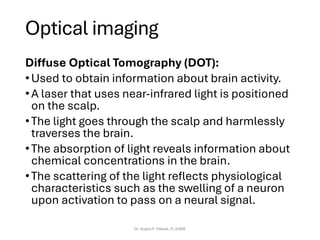
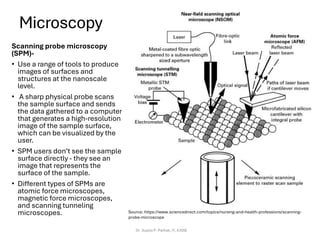
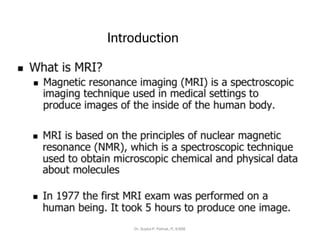
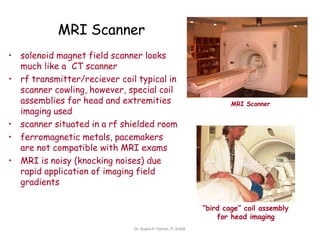
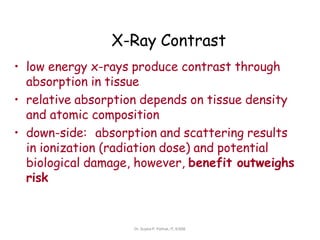
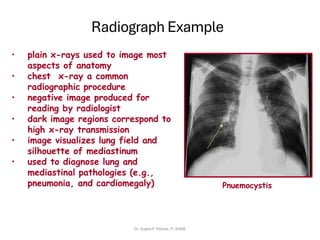
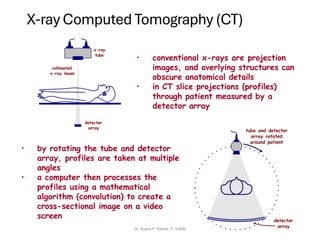
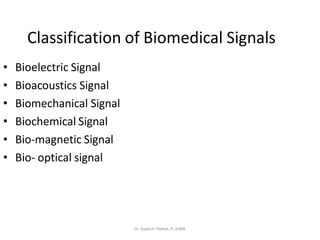
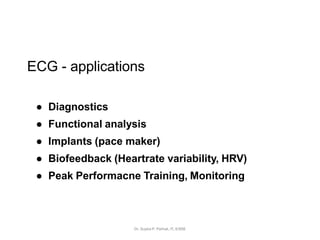
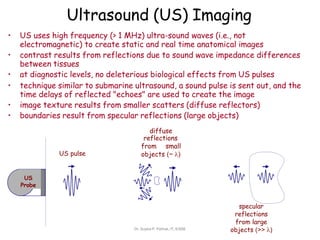
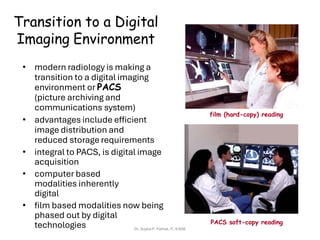
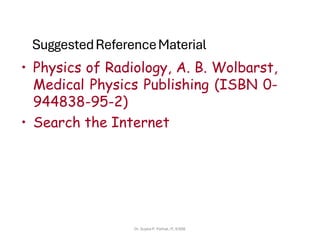
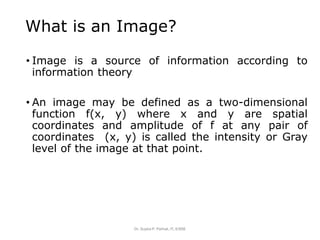
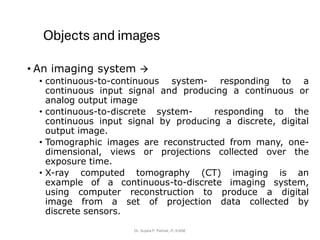
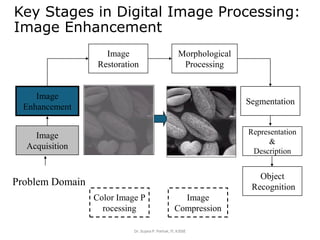
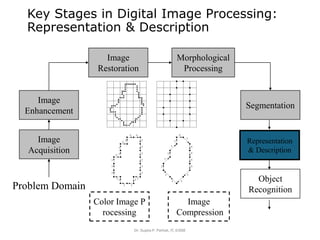
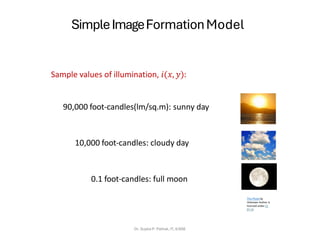
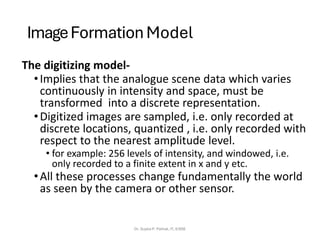
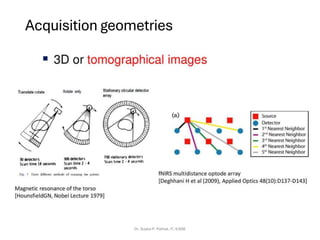
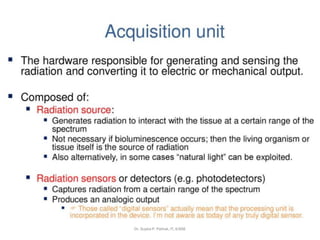
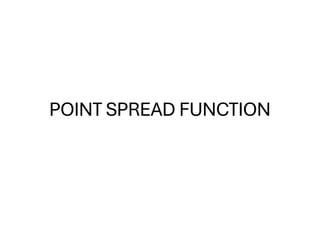
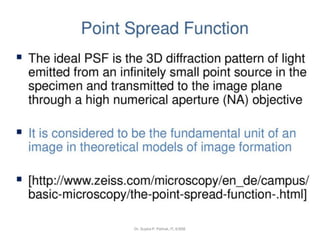
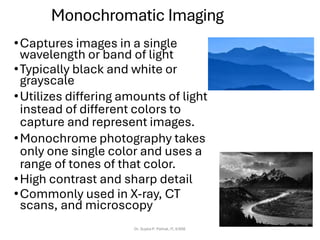
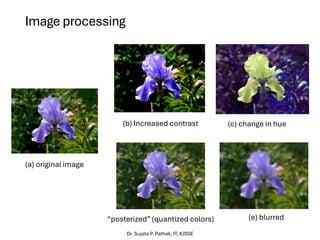
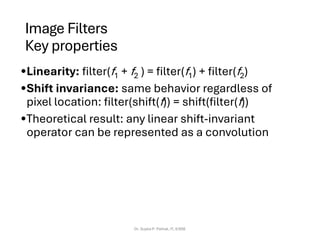
![Median filter
• MATLAB: medfilt2(image, [h w])
Dr. Sujata P. Pathak, IT, KJSSE
Salt-and-pepper noise Median filtered
Source: M. Hebert](https://image.slidesharecdn.com/ch1-introduction111-251216113038-a194fd0b/85/CH1_INTRODUCTION-TO-DATABASE-PROGRAMMING-119-320.jpg)